3.1. Related Work on Organ
The multi-organ segmentation experimental environment is a computing platform with a Win11 operating system, INTEL-12900K processor, and RTX4090 24G × 2 graphics card. The experimental code uses Python programming language, and the deep learning framework is Pytorch. CI-UNet model training uses the Adam optimization algorithm. The output image size is 256 × 256. The training’s start learning rate is 1 × 10
−5, the termination learning rate is 0.01 times the start learning rate, and the cyclical learning rate can obtain better training results [
43]. The momentum parameter of the optimizer is 0.9, the second moment is 0.999, and the batch size of the model training is 8. The training generations are the sum of the Cross-entropy loss function and Dice loss function, and the total training generations are 100. The ratio of the training set and validation set is 8:2.
In this section, we experiment with the Chaos dataset, which has 623 original images. The 623 original data do not give good results, so proper data enhancement is needed. We use a rotation of 10 degrees for data augmentation, and we use data augmentation for two reasons:
Some data enhancement methods cannot transform the original data image and label at the same time. In contrast, image rotation can make the image and label produce the same change, and the structure and change in the original image are small;
As a proven method of image enhancement, image rotation is widely used in various fields and has strong versatility.
In this paper, we conducted ablation experiments for the rotation angle of the image, and we selected 5°,10°, 20°, and 30° for the angle transformation, which is used for VGG16 backbone UNet network for the experiments. The results of different rotation angles in the VGG16 network are shown in
Table 1.
Table 1 shows that the best mIoU and mPA evaluation metrics performance was achieved at a rotation angle of 10°. A very likely reason for this situation is that the selection of the angular band has a tangible impact on the nature of the data. Medical images usually need to preserve spatial orientation, and a more significant rotation may make the images unrealistic from a clinical point of view. There is little difference in the evaluation metrics between the rotation angle of 5° and 10°. However, we enhanced the data with a rotation angle of 10° to create a moderate differentiation in the images. We believe that setting an angle of 10° and being able to expand the dataset will not affect the image characteristics of the dataset significantly. Therefore, this paper selects the expanded dataset with a rotation angle of 10° as the experimental dataset.
Cutout as a data enhancement method can cope with regularization well, but excessive Cutout can reduce the accuracy of the network. Here, we take three different degrees of Cutout data enhancement methods for ablation experiments. The results of ablation experiments with different degrees of Cutout are shown in
Table 2.
When validating the dataset with Cutout using the VGG16 backbone UNet, it was found that the accuracy of the evaluation metrics obtained when using a Cutout ratio of 30% was better than when using a Cutout ratio of 20% and 40%. We analyze the reason for this. As deep learning training is prone to overfitting, various regularization methods are needed. Cutout is a unique form of Dropout. The size of the feature map values of the shallow feature map has increased, and the distribution of the deep feature map is wider. We selected a combination of Rotation 10° and Cutout for data enhancement from the above experimental results. We used Cross-Validation [
44,
45,
46] to select the dataset parameter. Cross-Validation helps to perform model parameter determination and, simultaneously, can avoid the limitations and specificity of fixed division datasets. The primary purpose of conducting crossover experiments is to determine the appropriate learning rate, optimizer, and second moment. We choose the generic 0.9 and 0.999 to conduct the experiments. The Cross-Validation results are shown in
Figure 9a,b.
As can be seen from
Figure 9 above, in each cross-validation, the starting learning rate is 1 × 10
−5 when each evaluation index is the best, the training set for Cross-Validation is 1495 sets, and the validation set is 374 sets. In the following experiments, we will determine the use of 1 × 10
−5 as the learning rate parameter since the experimental results of the first group in the above crossover experiments were much higher than those of the other groups. To eliminate fluctuations, in this section, this experiment selects the average of 5 sets of experiments, the third set of experimental data for the experiment.
The following will outline and explains the results of our experimental analysis of predictive tomographic abdominal organ segmentation. By comparing the different structures of UNet, PSPNet [
47], DeepLabv3+, MRI-specific algorithms, and our algorithm CI-UNet.
The ablation results of different backbone UNet networks are shown in
Table 3.
The PA index reflects the global degree of correct pixel point classification, which is relatively unconvincing because the background pixel points of tomographic organ images account for the vast majority of the background pixel points, resulting in small changes in the PA index. Therefore, the paper mainly uses mIoU and mPA index data for experimental ablation illustration. From the control of mIoU and mPA index data, it can be found that the extraction effect of double convolution backbone UNet is the worst. The mIoU metric of the double convolutional backbone UNet is 73.25%, and the mPA metric is 83.32%. The monotonic structure of the UNet backbone network makes the network perform poorly in image feature information extraction, which makes the mIoU and mPA metrics much lower than the VGG16 backbone UNet, and the ResNet50 [
48] backbone UNet mIoU metrics of VGG16 backbone UNet and ResNet50 backbone UNet are relatively close, 79.37% and 78.71%, respectively, and mPA metrics are 86.88% and 88.08%, respectively. mPA metrics have a 1.2% difference, which is caused by the fact that the ResNet50 backbone UNet has more pixels correctly predicted category than the VGG backbone UNet during the prediction process. The circumstance of mPA metrics for each organ of the VGG16 backbone UNet network and ResNet50 backbone UNet are shown in
Figure 10.
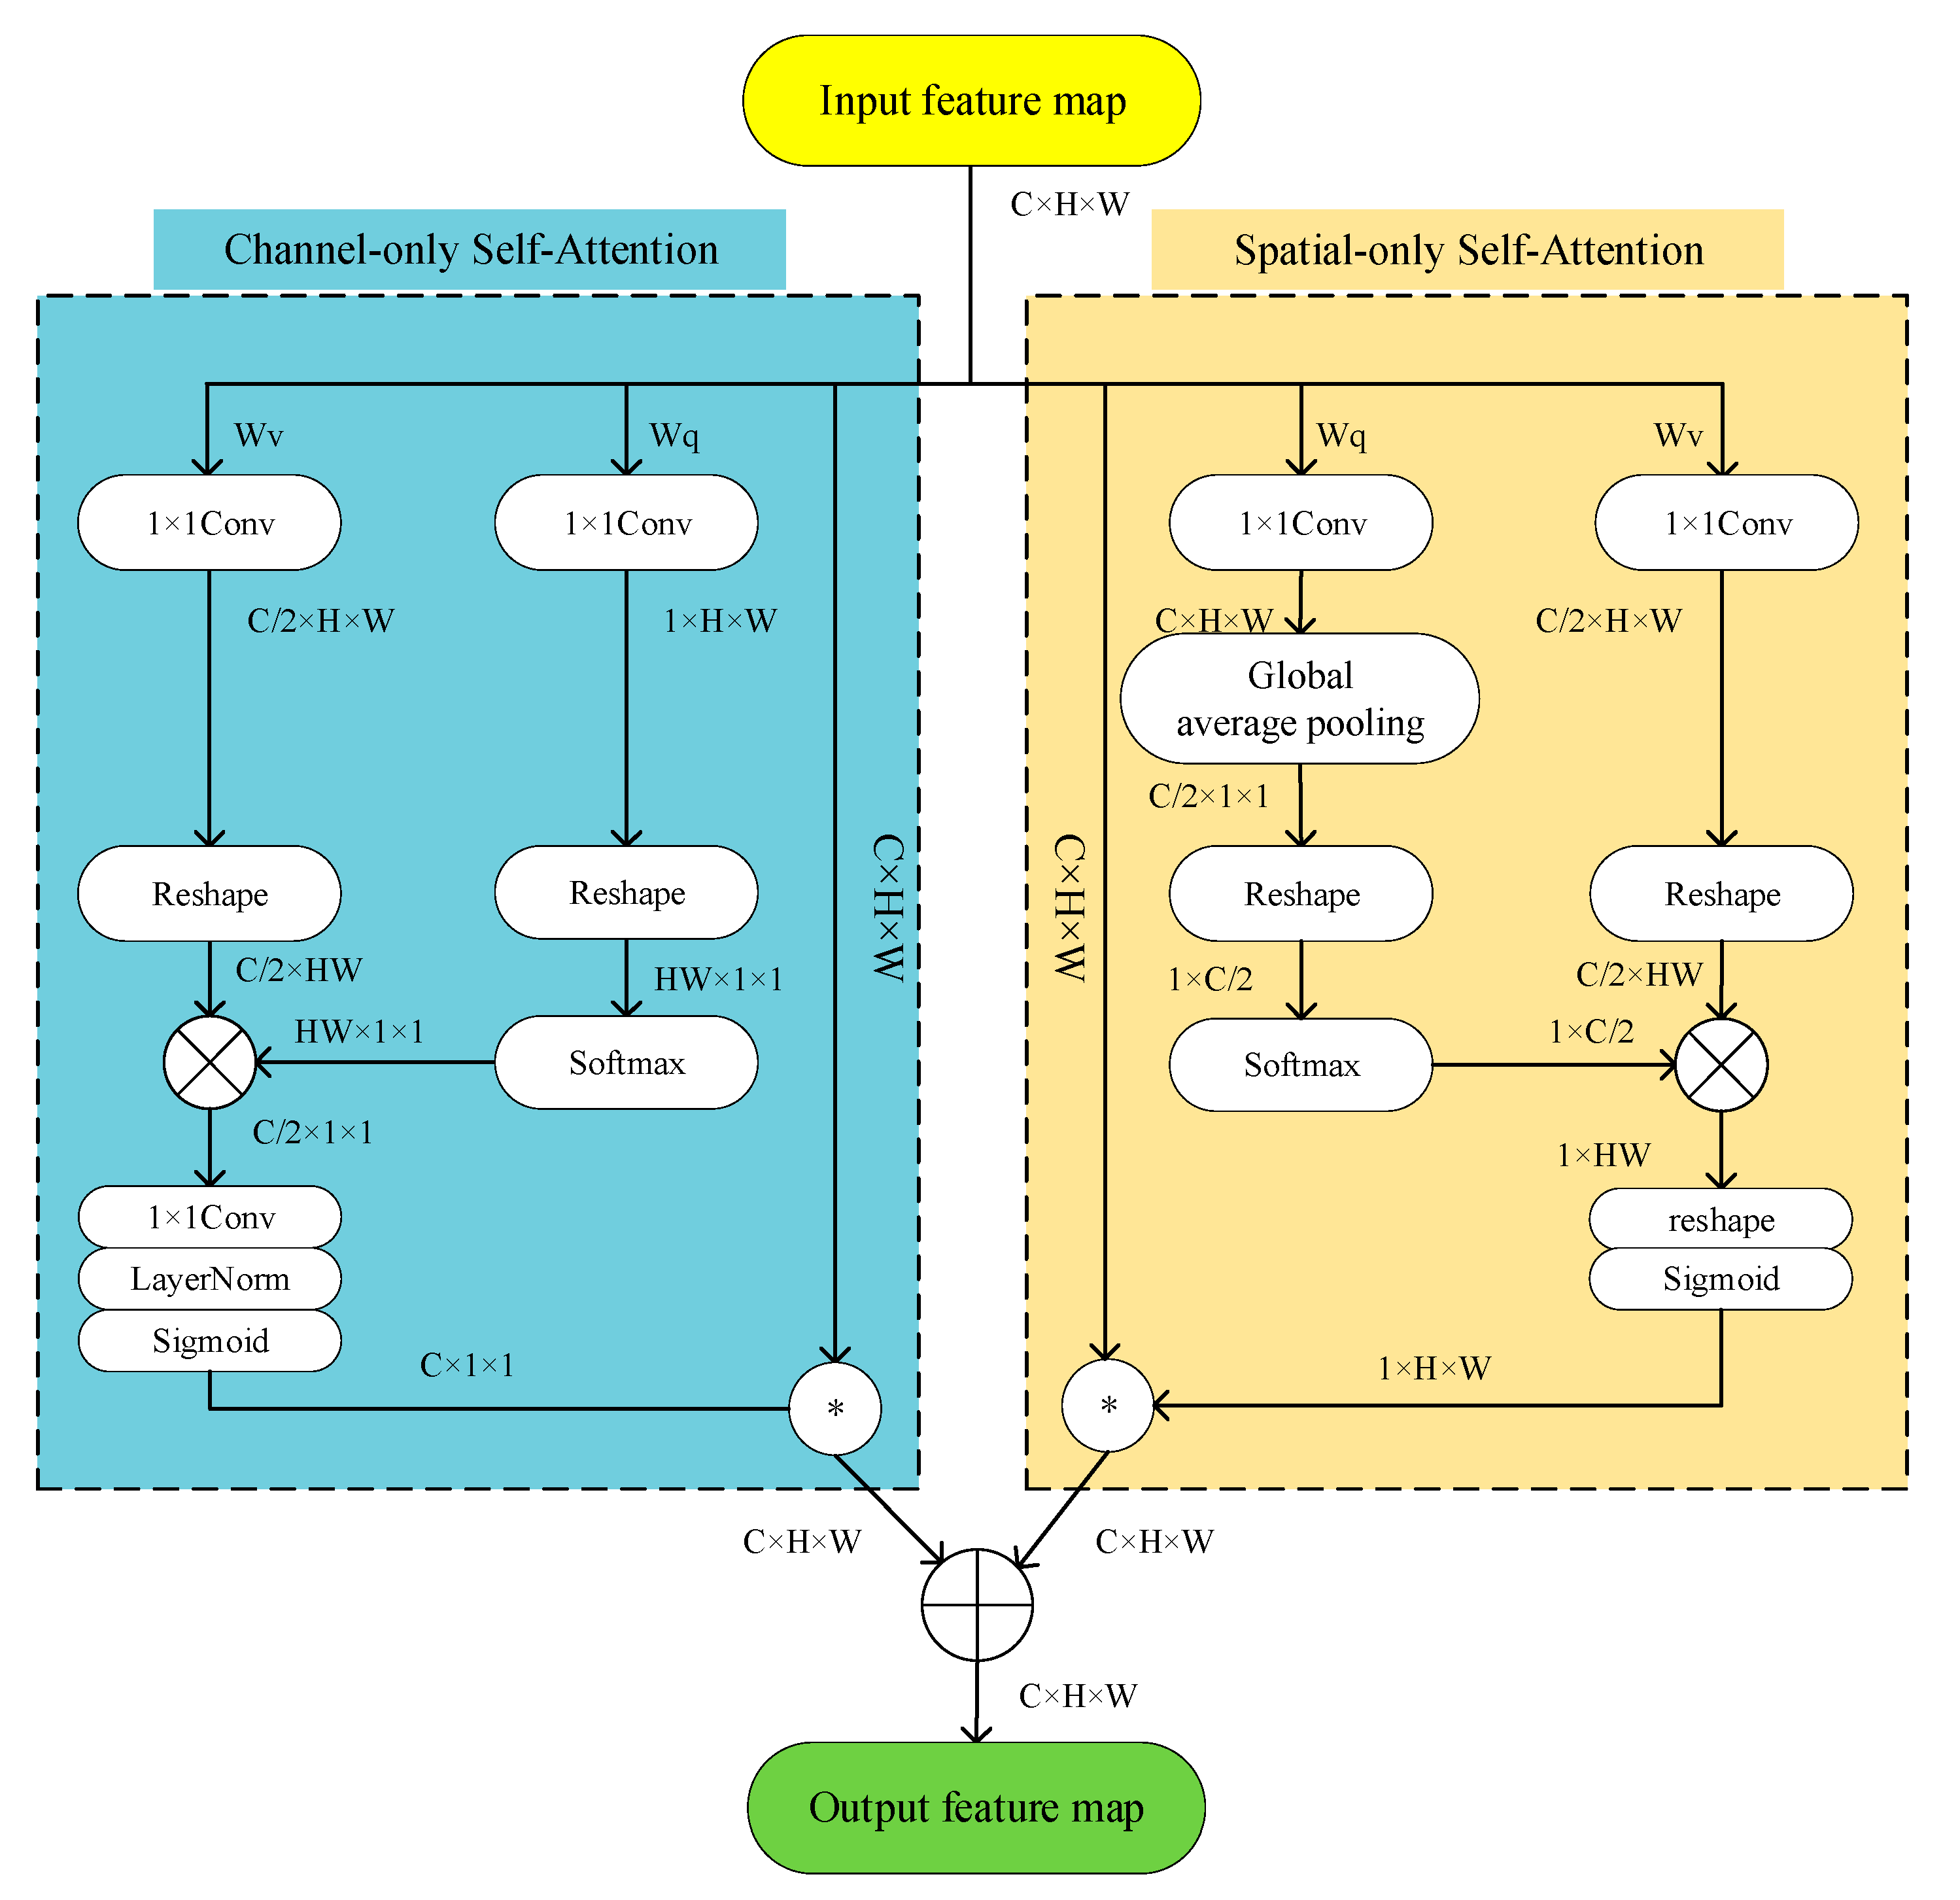
To refine the network and enable the network to focus on effective information during decoding, the SE attention mechanism [
49], the Cbam attention mechanism [
50], and the Polarized Self-Attention mechanism are selected for comparison in this paper. The results of the ablation of different trunk Attention UNet structures are shown in
Table 4.
As seen in
Table 4, the mIoU and mPA of the Attention UNet using the VGG16 backbone and PSA attention mechanism were 81.22% and 88.75%, respectively, while the mIoU and mPA metrics of the UNet neural network using the SE and Cbam attention mechanism under the same conditions were 79.75% and 87.02%, and 81.13% and 88.60%, respectively. Similarly, the mIoU and mPA of Attention UNet using ResNet50 backbone with PSA attention mechanism are 80.03% and 90.42%, respectively. In contrast, the mIoU and mPA metrics of neural networks using SE and Cbam attention mechanisms with the same backbone are 78.94% and 87.40%, and 79.47% and 88.63%, respectively.
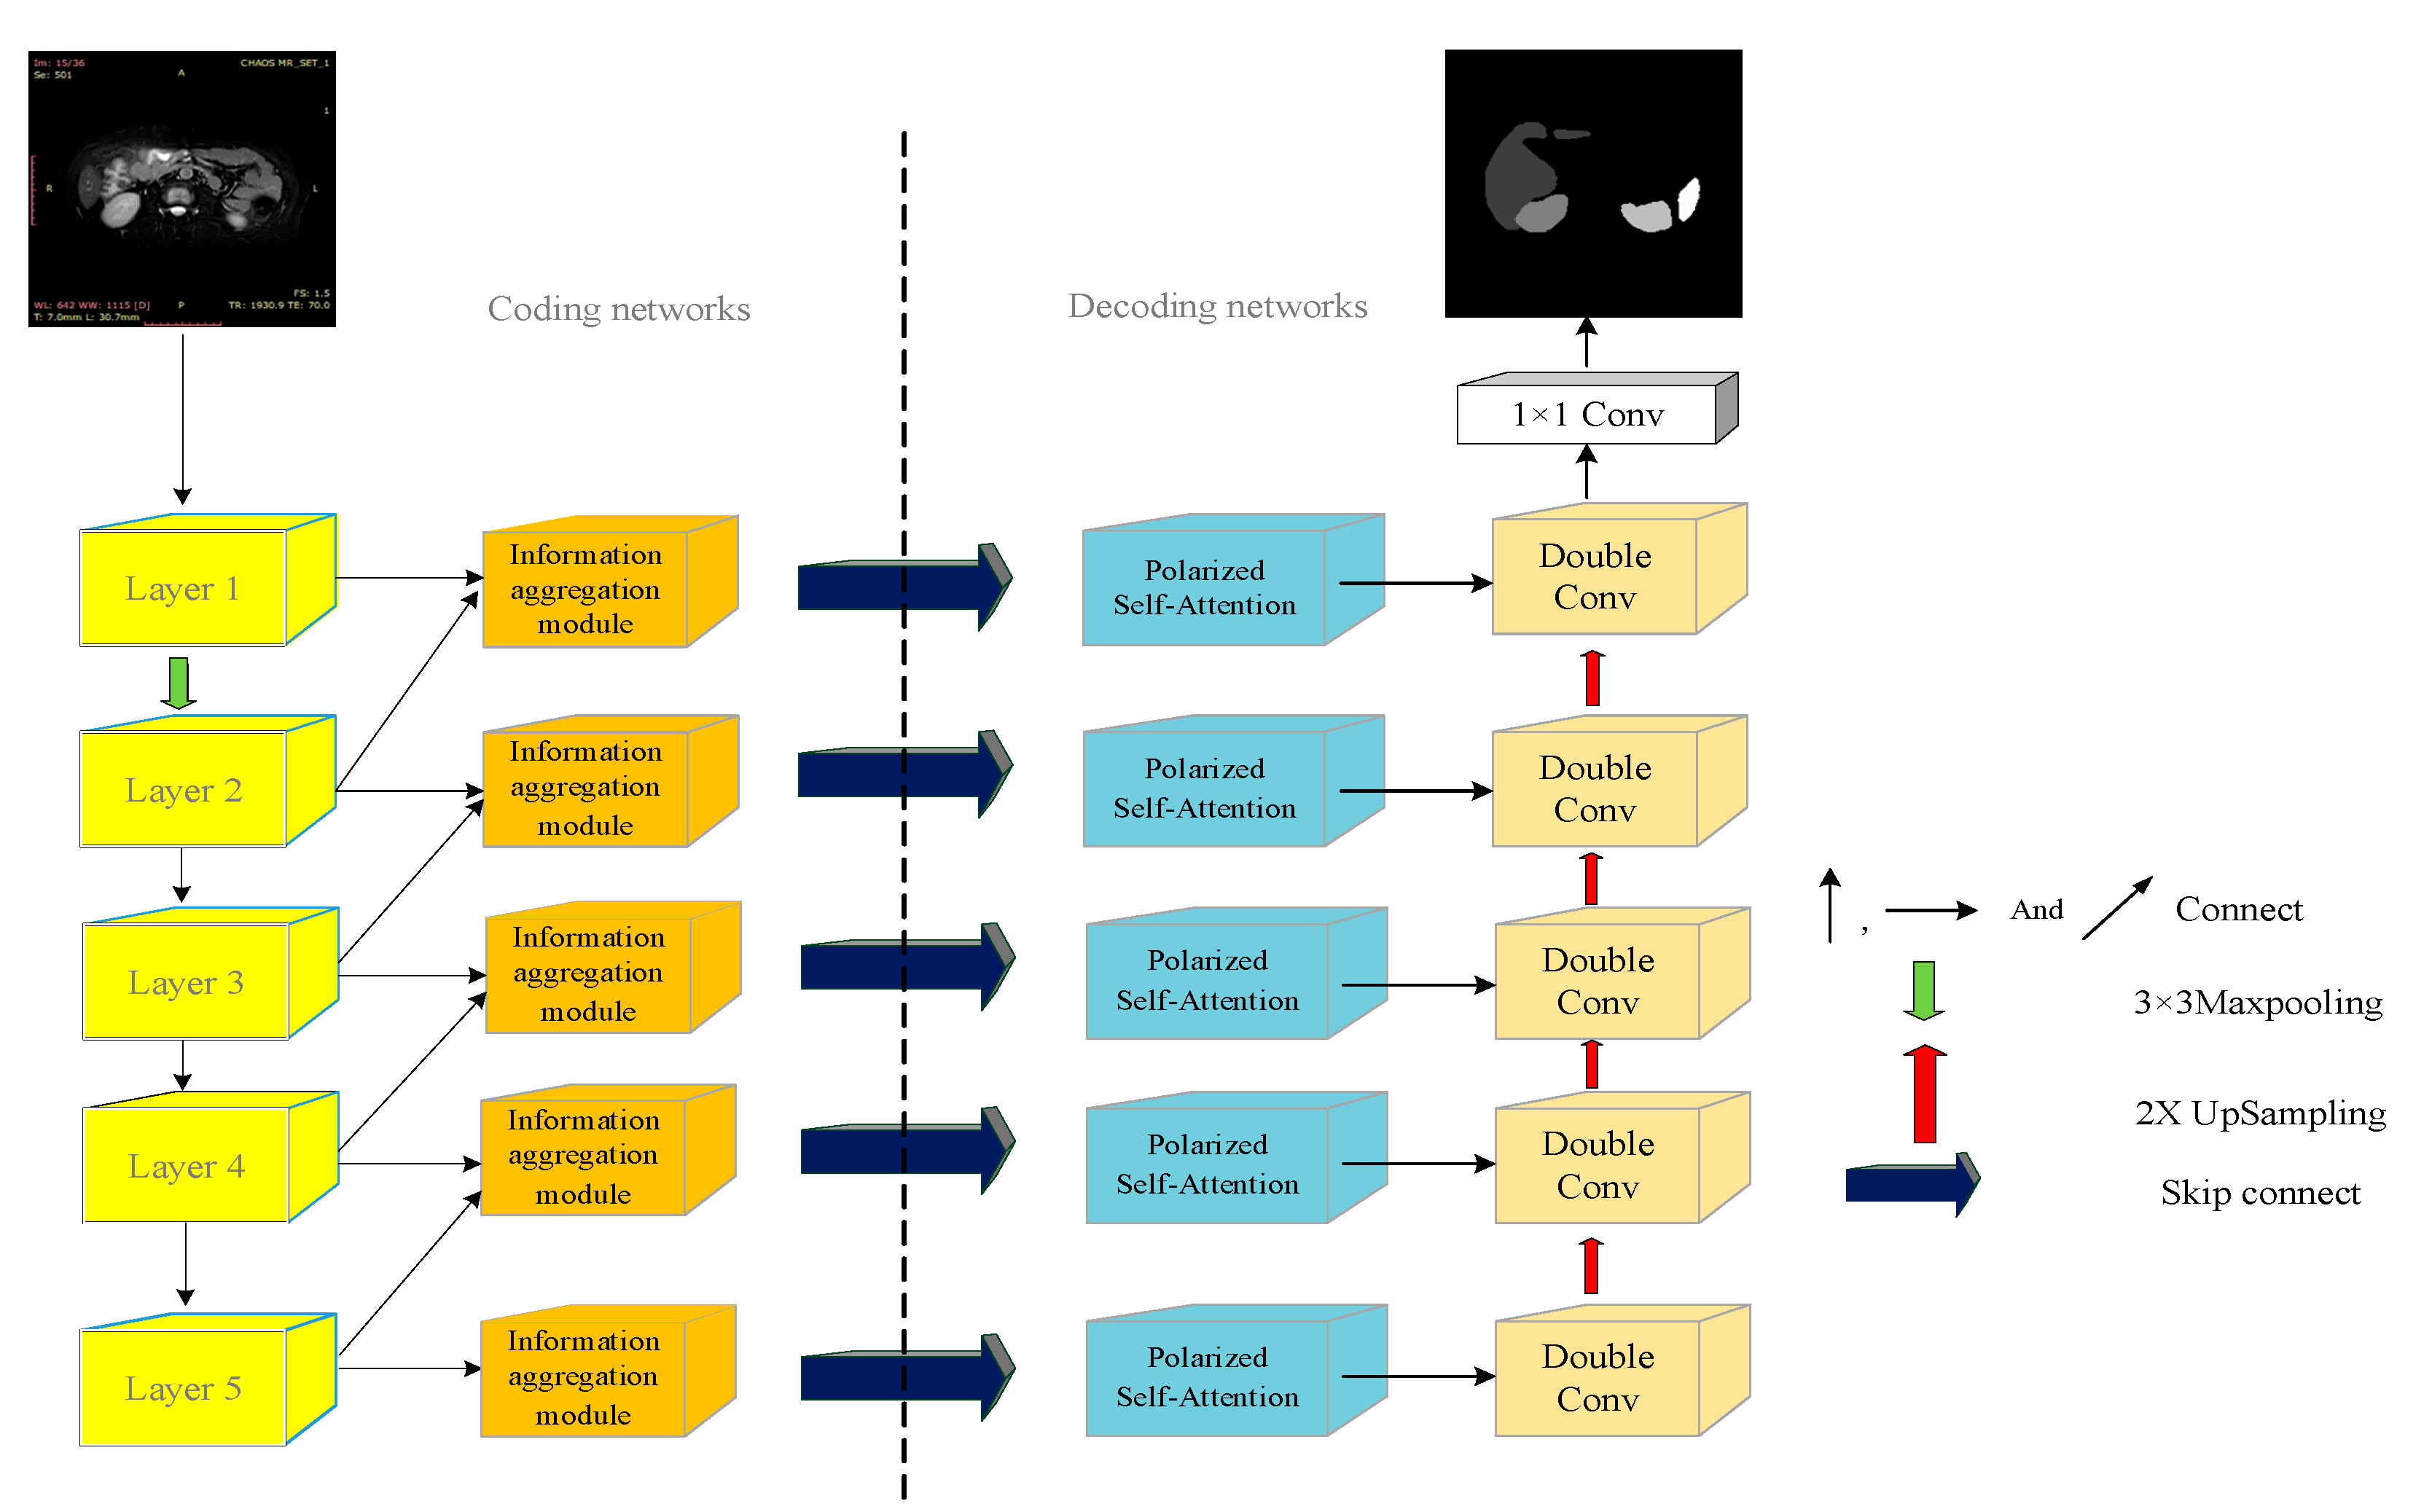
Table 4 shows that the Polarized Self-Attention mechanism improves the UNet segmentation network more than SE, and the Cbam attention mechanism in both ResNet50 or VGG16 backbone cases and the PSA attention mechanism improves better in refining the targets. In this paper, the information aggregation module is added based on Attention UNet, and the experimental results of the ablation of Attention UNet and CI-UNet are shown in
Table 5.
The algorithm in this paper uses the VGG16 network to replace the double convolutional backbone and uses the PSA attention mechanism also adds the information aggregation module for fusing the image information between the layers.
Table 5 shows that the experimental results of mIoU and mPA are 82.33% and 90.10%, respectively. Compared with UNet without adding the information aggregation module under the same conditions, the improvement in accuracy is 1.11%, and the improvement in mPA is 1.35%. The algorithm in this paper is also compared with the PSPNet algorithm and DeepLabv3+ algorithm. It is also compared with dedicated algorithms developed for MRI, such as M-FCN [
51] and U-Net_based [
52]. The ablation results of each algorithm are shown in
Table 6.
As can be seen in
Table 6, the mIoU and mPA values of the ResNet50 backbone PSPNet network are 81.04% and 89.66%, respectively, lower than the algorithm in this paper by 1.28% and 0.44%, respectively. While the mIoU values of PSPNet and Deeplabv3+ networks using MobileNetV2 [
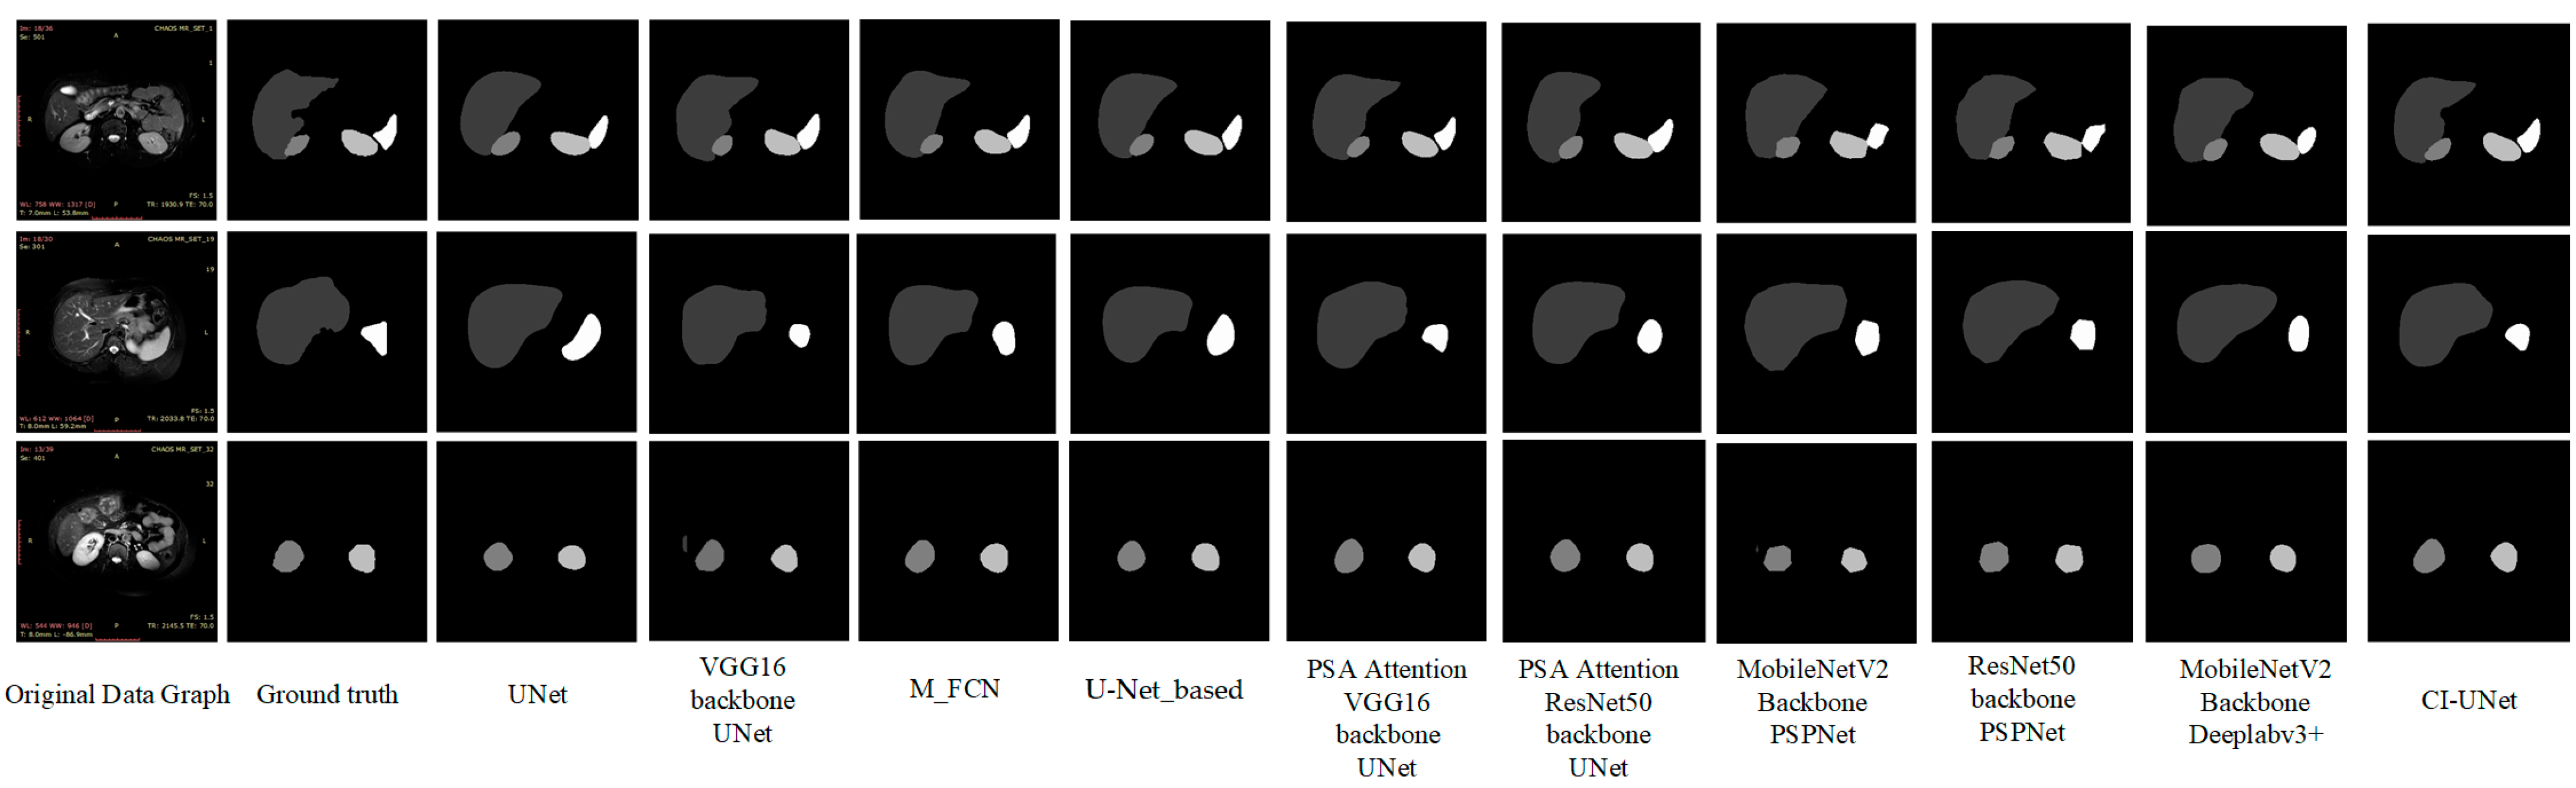
53] backbones are 76.41% and 75.92%, which were lower than the algorithm in this paper by 5.92% and 6.41%, respectively. The mPA values were 87.02% and 86.04%, lower than the algorithm in this paper by 3.08% and 4.06%, respectively. We also found some dedicated algorithms for MRI 2d images for comparison. mIoU and mPA values for M-FCN are 77.21 and 86.40, respectively—5.12% and 3.7% lower than the algorithm in this paper. mIoU and mPA values for U-Net_based are 77.86 and 85.14, respectively, 4.47% and 4.96%, lower than the algorithm in this paper, respectively. The prediction plots of organ segmentation for each algorithm are shown in
Figure 11.
As shown in
Figure 11 above, based on visual observation, the algorithm in this paper is closest to the gold standard in terms of organ edge structure, and there are no organ prediction errors and more well-defined angles.
However, at the same time, we observed segmentation errors in the above VGG prediction result maps and PSPNet, and MobileNetV2 backbone prediction images, which all showed incorrect predictions of liver images in the third set of image predictions, of which we analyzed the reasons as follows:
Segmentation errors due to unbalanced datasets, the accuracy of the model may be affected when dealing with unbalanced datasets. Since the number of samples in specific categories in the dataset is small, misclassification may occur, leading to a decrease in accuracy;
Mislabeling of the dataset itself. If there is noise or outliers in the dataset, such as mislabeled data, it may also cause the neural network to learn the wrong patterns, leading to inaccurate predictions;
Overlap between categories, where multiple objects exist for that image feature point;
Overfitting, where the neural network is overtrained, resulting in features that need to be captured not being captured.
The confusion matrix of the algorithm in this paper on the validation set, the mIoU segmentation index for each organ, and the mPA segmentation index for each organ segmentation are shown in
Figure 12a–c.
In this paper, the Chaos dataset was utilized to design a multi-organ segmentation task, and the weights were obtained after the network completed training in this paper. The CI-UNet designed in this paper can segment multiple organs in a single prediction. We have selected some representative images from the Chaos validation set for multi-organ segmentation image prediction. There are some typical features in our validation images, and the following six image structures are typical:
No-organ images;
Single-organ liver images;
Left and right kidney images;
Liver, left, and right kidney images;
Liver, left kidney, and spleen images;
Liver, left and right kidney, spleen images.
We use CI-UNet to make predictions for each of the above six typical images, and the prediction results are shown in
Figure 13.
Data imbalance is the main problem that causes segmentation errors and affects network accuracy. Network training is more effective when the datasets inside the training set are more balanced. In the Chaos dataset, the large sample class is background, liver. The problem of unbalanced data in this paper still needs to be solved. We balance the dataset by sampling most of the samples and augmenting a few samples. After data enhancement, we processed the chaotic dataset by removing the background-only images, and the total number of images released was 300. The data images with only the liver were removed. The number of removed images is 60. Experiments were conducted for this dataset using CI-UNet and the results are shown in
Table 7.
By observing
Table 7, we can find that the indicators demonstrate a slight performance improvement, and we analyze the advantages of balanced datasets as follows:
Improving model performance: When the number of samples in different categories in a dataset is unbalanced, the model tends to predict the categories with higher numbers and ignore those with lower numbers. By balancing the dataset, the number of samples in each category can be made closer, thus reducing bias and improving the learning ability of the model for each category, improving the model performance;
Preventing overfitting: Dataset imbalance may lead to model overfitting, i.e., learning better for a more significant number of categories and worse for a smaller number of categories. It may affect the generalization ability of the model. By balancing the dataset, the risk of overfitting can be reduced, and the model can be better adapted to the samples of each category;
Improving the accuracy of evaluation metrics: Commonly used evaluation metrics such as accuracy can give misleading results when the dataset is unbalanced. By balancing the dataset, the evaluation metrics can be made to reflect the model’s performance in each category more accurately.
The results of Grad-CAM used for the organ image are shown in
Figure 14.
By observing
Figure 14, it can be seen that the attention for each individual organ is basically focused on the organ attachment structures, and similar identical structures receive some lower ranking attention.
3.2. Related Work on Spine
The spine segmentation experimental environment is the same as the multi-organ segmentation task, with experimental parameters of maximum learning rate of 1 × 10⁻⁴ and the termination learning rate is 0.01 times the start learning rate, momentum parameter of the optimizer of 0.9 and second moment of 0.999, batch size of model training of 8, training generations as the sum of Cross-entropy loss function and Dice loss function, and total training generations of 100.
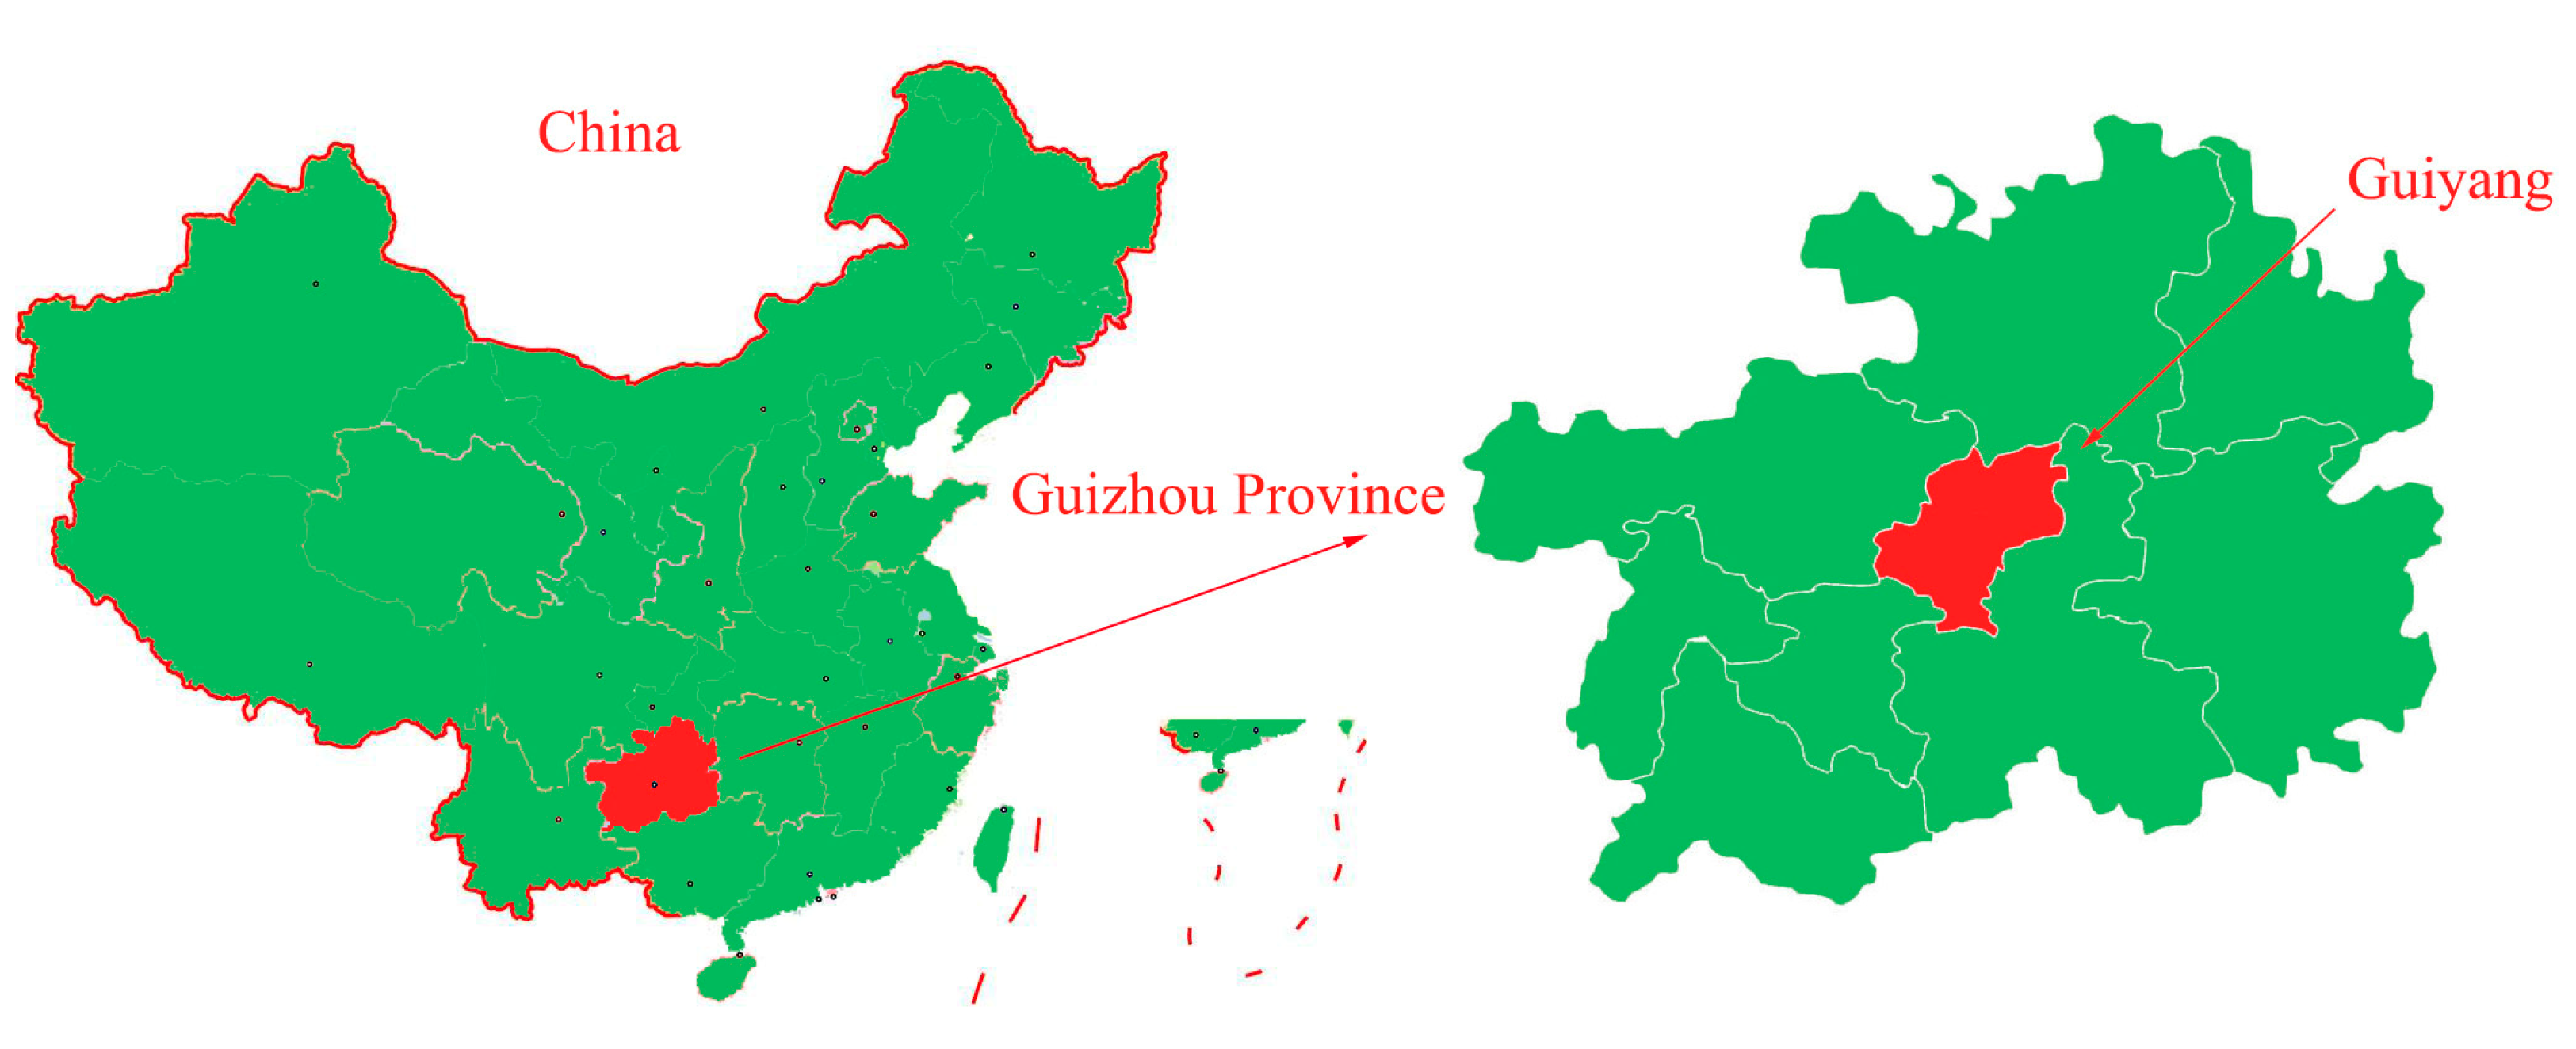
We applied the CI-UNet network designed in this paper to the spine dataset of the Guizhou branch of Beijing Jishuitan Hospital. The geographical location of Guiyang City, Guizhou Province, is shown in
Figure 15.
Guizhou Province is the most affected area by coal-fired fluorosis. The coal-burning type of ground fluorosis, and coal-burning polluted endemic fluorosis is a type of ground fluorosis unique to China in the world, affecting about 15 million people, with about 10 million people suffering from dental fluorosis and about 1 million people suffering from bone fluorosis. Fluorosis severely affects residents’ bone health and quality of life [
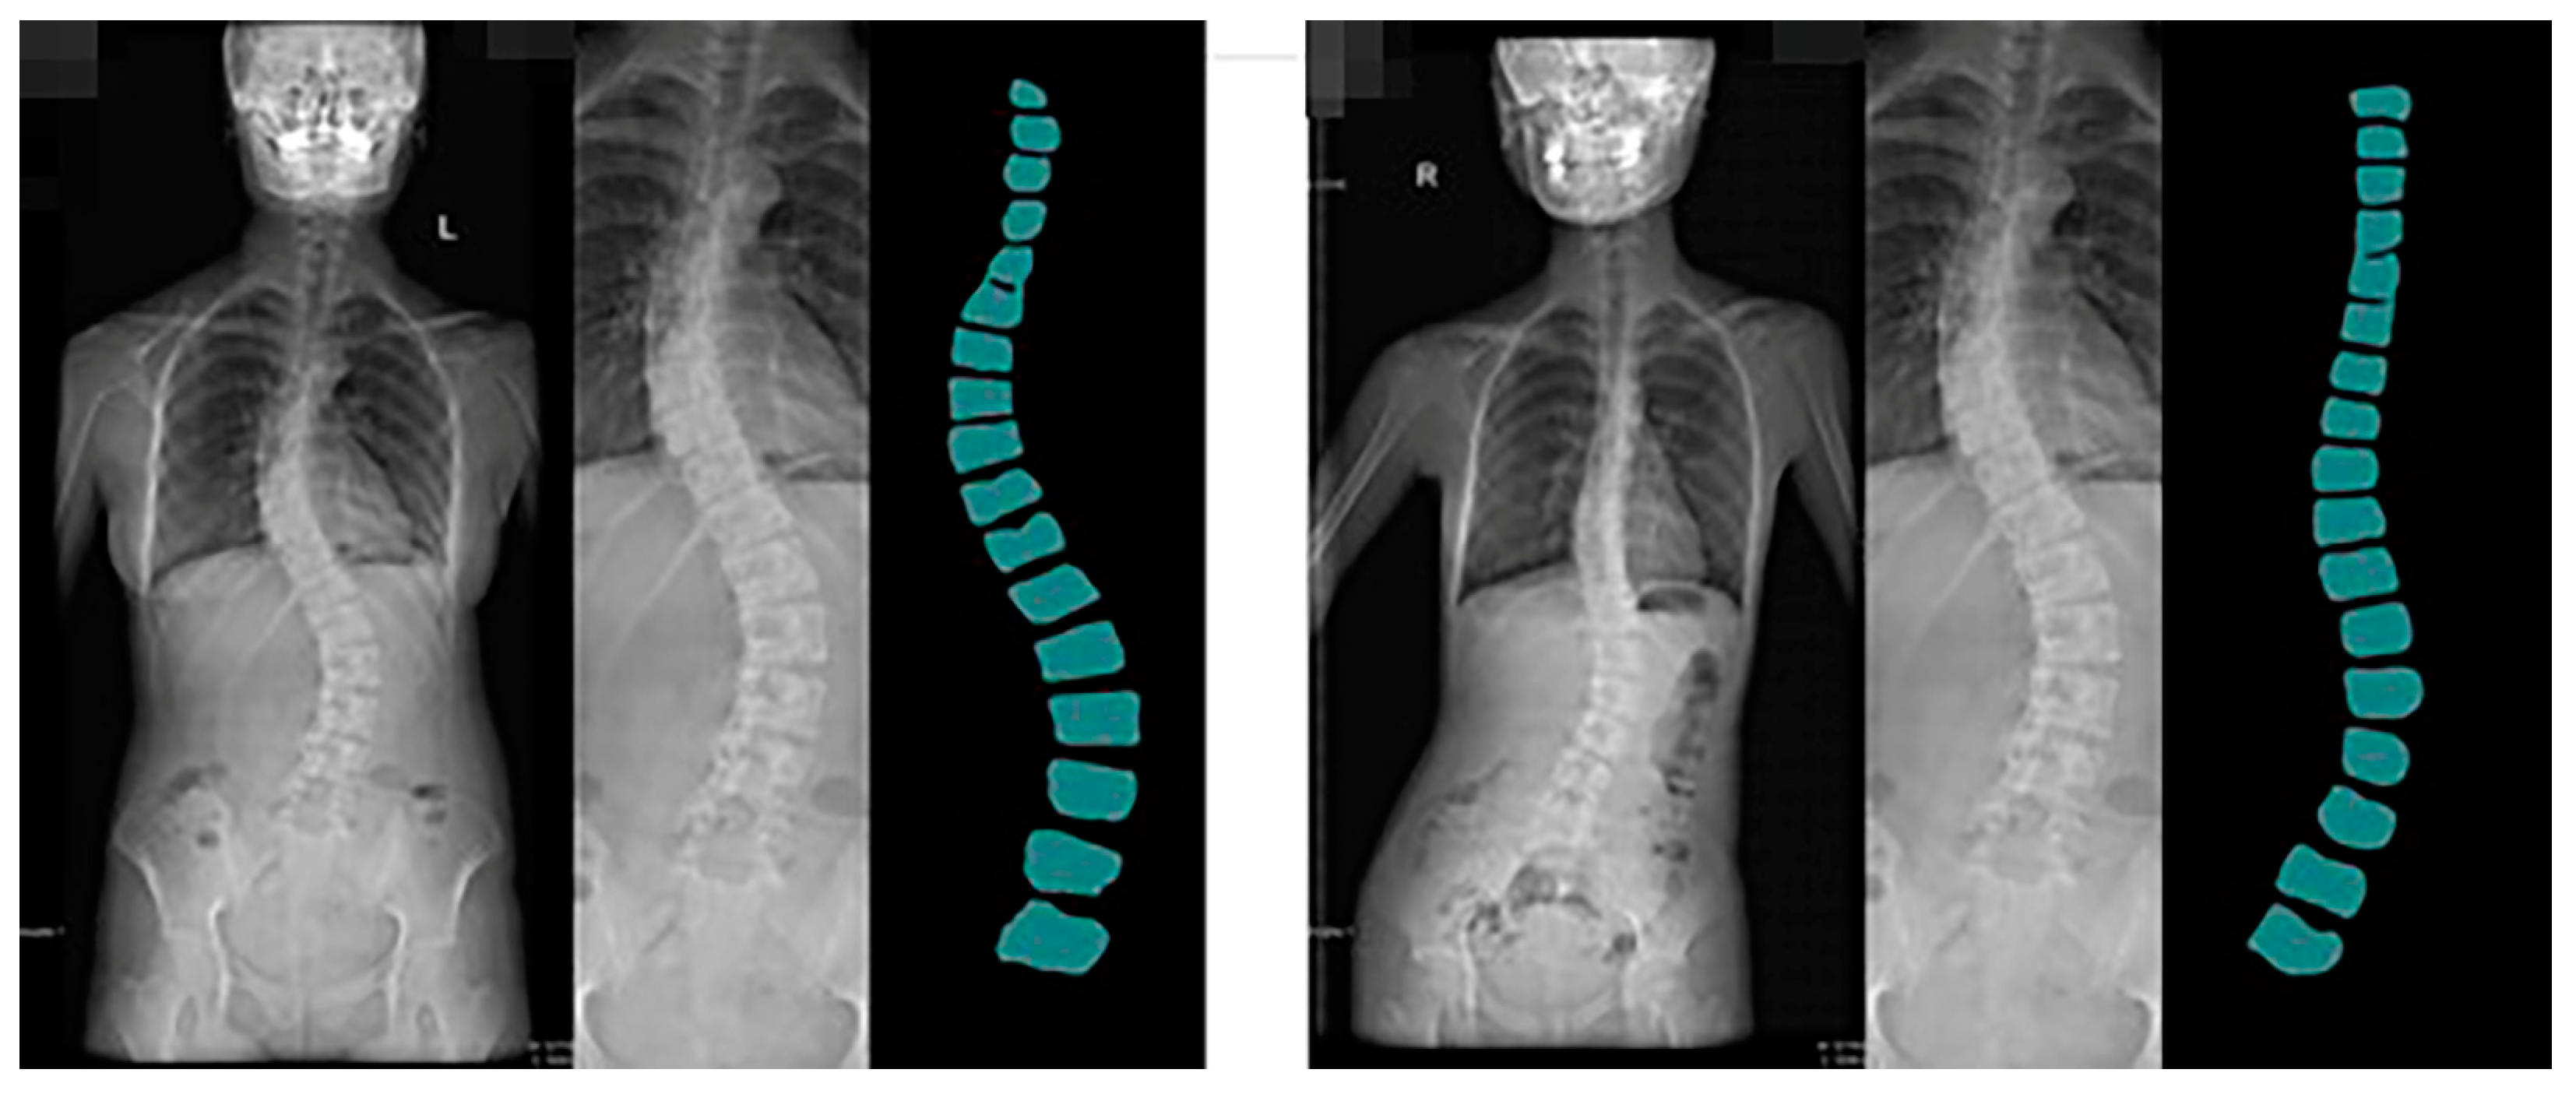
54]. The spine dataset of the Guizhou branch of Beijing Jishuitan Hospital uses X-ray images of the spine medical images, which reflect the bone quality of the inhabitants of Guizhou province, China, between the ages of 18 and 70. Due to geological conditions and the level of economic development, middle-aged and elderly residents have poor height development and often suffer from a range of diseases, including scoliosis, which is particularly serious. This dataset was developed in collaboration with the Guizhou branch of Beijing Jishuitan Hospital. Many ortho X-ray medical images of residents in Guizhou province were retrieved to produce the dataset. Due to privacy and legal issues, this dataset cannot be made public, and this dataset is labeled by is manually labeled. The segmentation prediction results generated by CI-UNet are shown in
Figure 16.
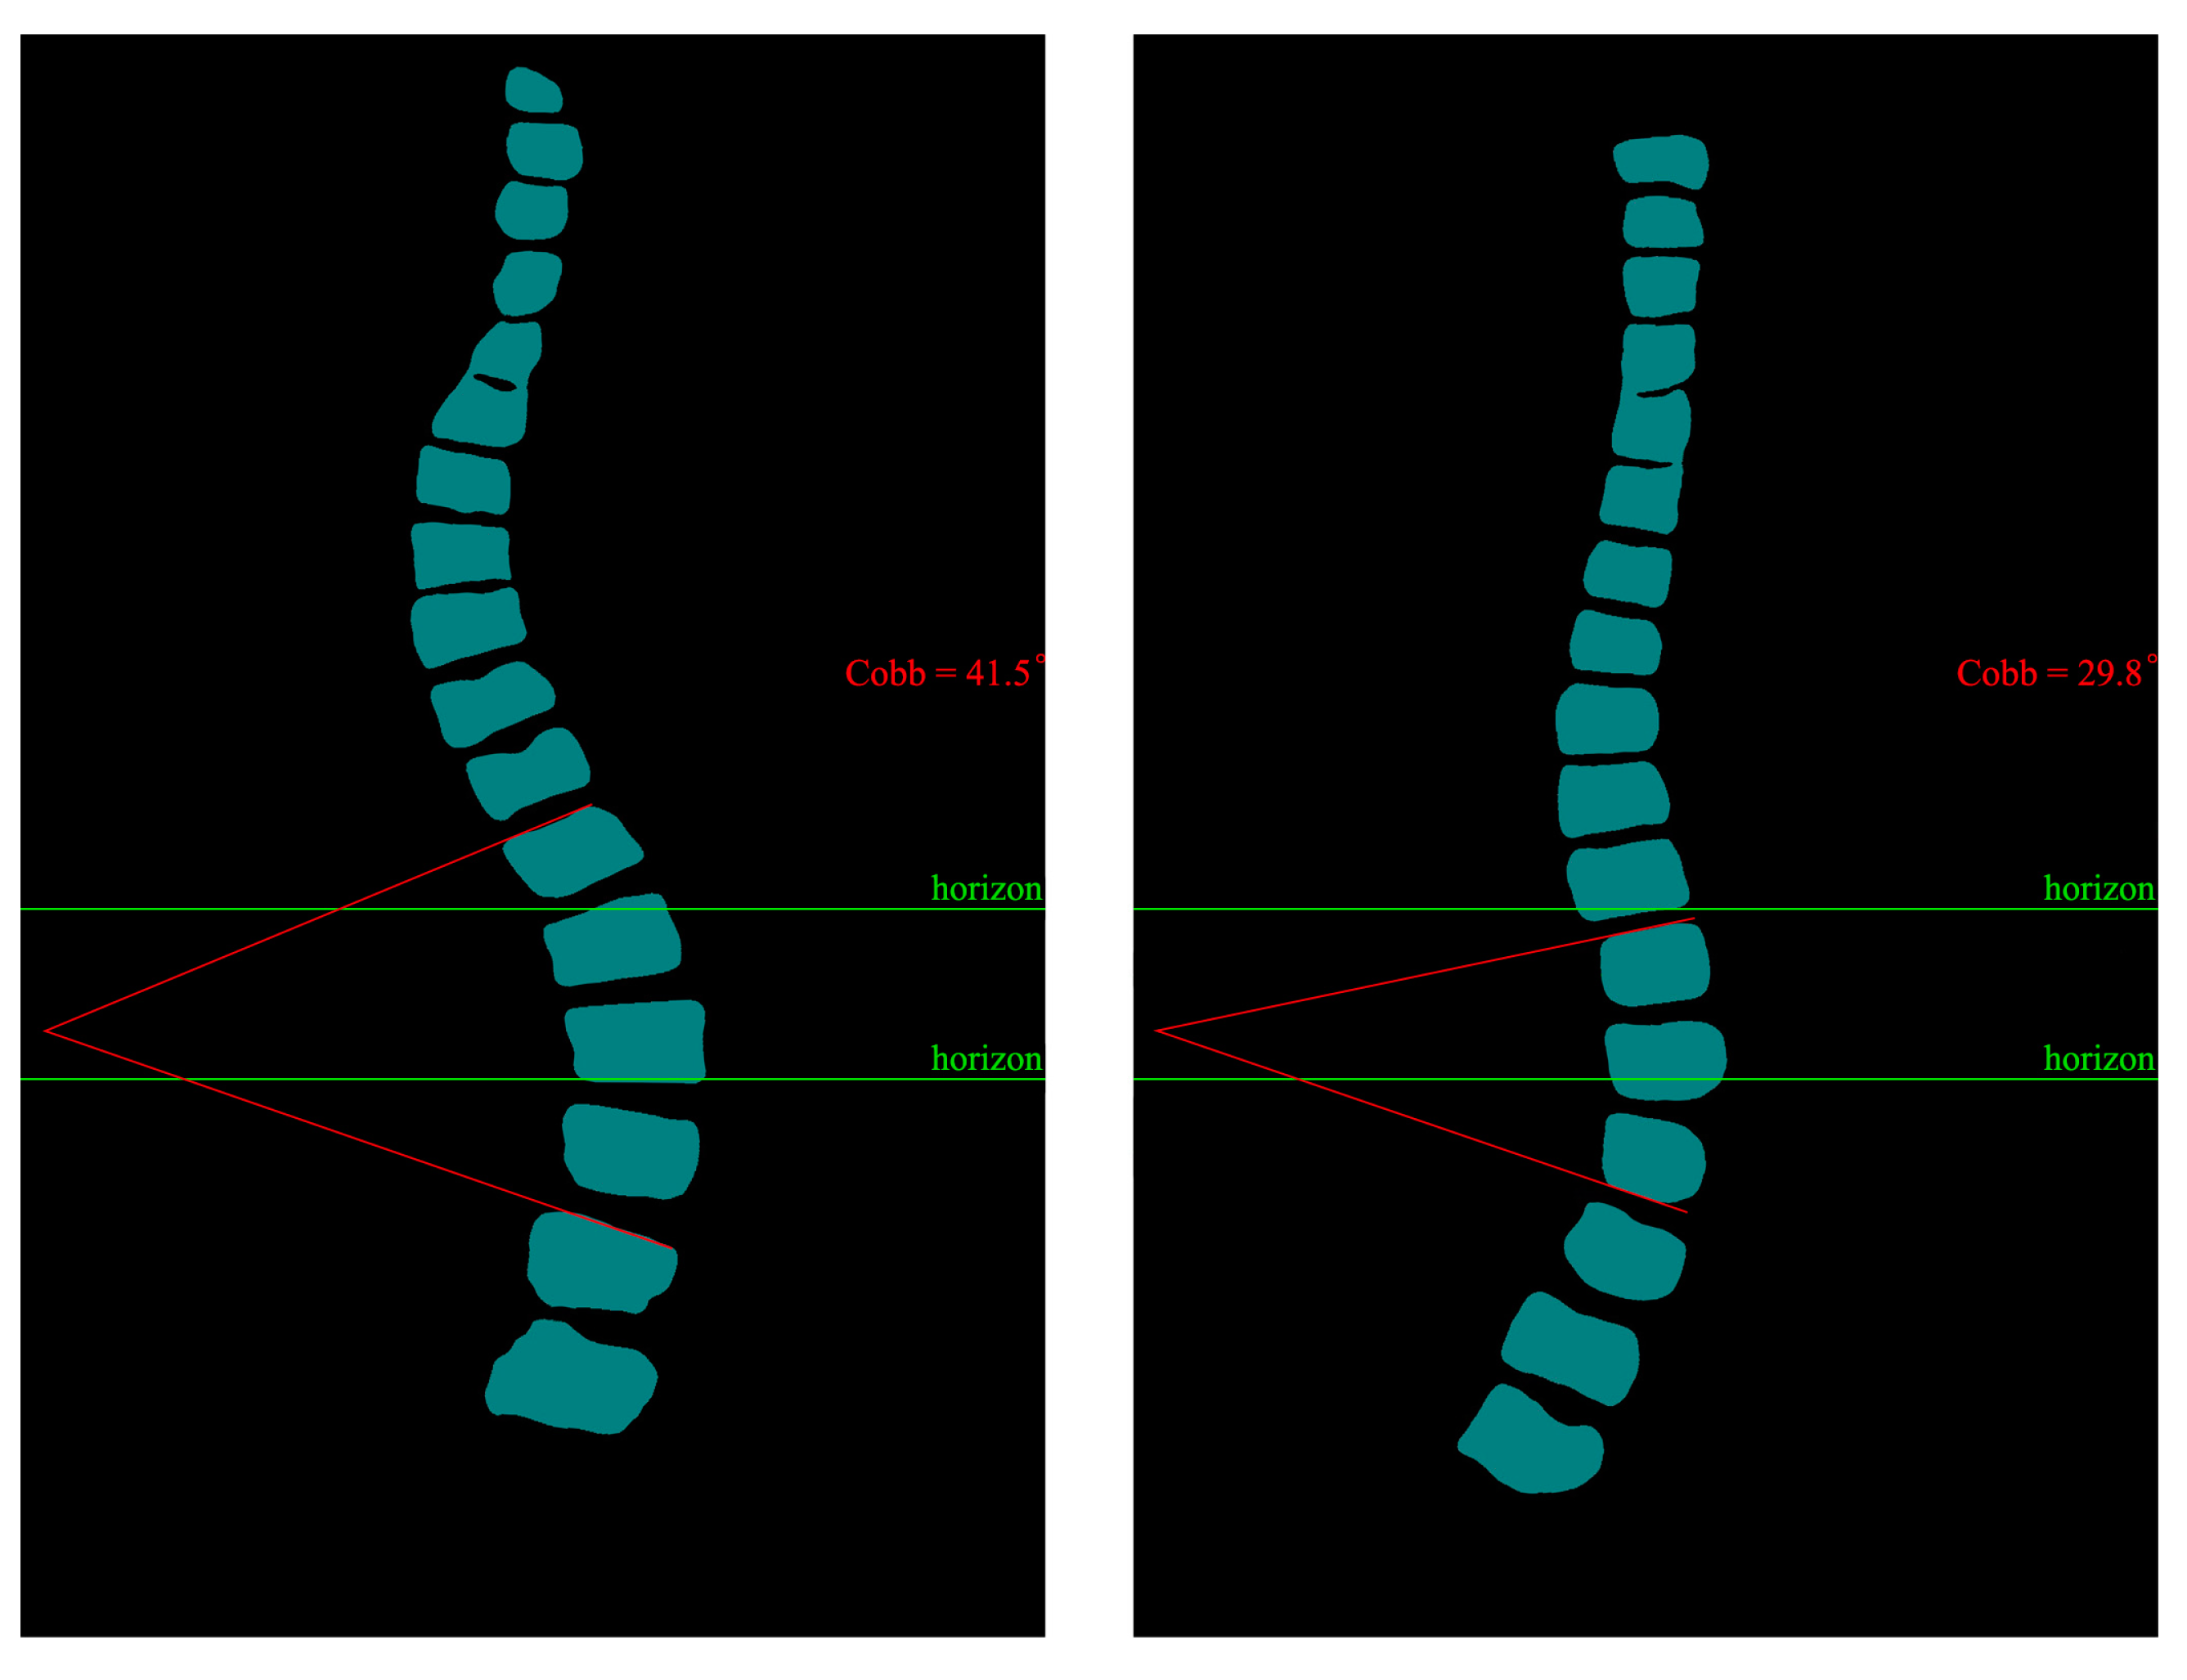
Training datasets need to be increased, resulting in less-than-optimal predictive segmentation. In the future, we will invest more human and material resources to solve the problem of data volume labeling. At the same time, we will produce more datasets for the local high prevalence of diseases. Based on the predicted images obtained, we calculated the angle of curvature of the spine. We chose the internationally used Cobb [
55,
56] index for spinal curvature assessment. The Cobb angle is a standard method used to measure the degree of scoliosis. It determines the degree of scoliosis by measuring the lateral bending angle of two adjacent vertebrae. Specifically, the Cobb angle is derived from the angle between two vertical lines drawn from the upper to lower surfaces of the two vertebrae.
During the measurement, the physician selects the two most curved adjacent vertebrae, draws a vertical line on their upper and lower surfaces, and then measures the angle between these two lines. This angle is the Cobb angle. Usually, the greater the Cobb angle, the more severe the scoliosis.
The Cobb angle is commonly used to diagnose scoliosis in adults, children, adolescents, and other spinal deformities. It is one of the most important indicators to assess the degree of scoliosis and the choice of treatment options. We calculated the prediction results based on the principle of Cobb calculation. The predicted image Cobb calculation results are shown in
Figure 17.
We have discussed with the spine doctors that CI-UNet predictive imaging can significantly help them improve their efficiency by producing semi-automatic calculations for scoliosis alone. The doctors are very receptive to our work, and we will follow up with more tasks for more body structures.
For the segmentation task of the spine, we performed the same task as the multi-organ segmentation task described in the previous section, and the results of the spine segmentation experiments for each network are shown in
Table 8.
The results of the spine segmentation experiments are shown in
Table 8. We found that the mIoU and mPA metrics of the VGG backbone are higher than the ResNet50 backbone metrics in the spine segmentation experiments. Compared with the double convolutional backbone UNet, CI-UNet is 12.35 percentage points higher in the mIoU metric and 4.76 percentage points higher in the mPA metric. Compared with the MobileNetV2 and ResNet50 backbone PSPNet, CI-UNet is 13.2 and 9.9 percentage points higher in mIoU metrics and 5.25 and 4.23 in mPA metrics, respectively. Compared with M-FCN, it is 6.76% higher in the mIoU metric and 2.74% higher in the mPA metric. Compared to U-Net_based, it is 6.2% higher in the mIoU metric and 2.34% higher in the mPA metric. The total amount of data of the spine dataset of the Guizhou branch of Beijing Jishuitan Hospital is 200, and the ratio of the training set and validation set is 9:1. Due to the small amount of data, the experimental results may have large fluctuations. We can see from the comparison of the above results that the evaluation indexes of CI-UNet designed in this paper are superior compared with other networks.


