Article

Assessment of the Central Nervous System in Children with Fetal Alcohol Spectrum Disorder (FASD) Using Magnetic Resonance (MR) Techniques

by
Andrzej Urbanik
1,
Monika Nardzewska-Szczepanik
1,
Teresa Jadczak-Szumiło
2 and
Monika Ostrogórska
1,*
1
Department of Radiology, Jagiellonian University Medical College, 31-501 Cracow, Poland
2
ITEM—Psychology Centre, 34-300 Żywiec, Poland
*
Author to whom correspondence should be addressed.
Appl. Sci. 2023, 13(12), 7303; https://doi.org/10.3390/app13127303
Submission received: 17 May 2023 / Revised: 31 May 2023 / Accepted: 15 June 2023 / Published: 19 June 2023

Abstract

:
The study aimed to assess central nervous systems in children diagnosed with Fetal Alcohol Spectrum Disorder (FASD), using the techniques of magnetic resonance (MRI). The analyses considered 200 children, both female and male, aged 6–17 years, diagnosed with FASD, as well as 32 healthy children of both sexes, aged 6–16 years. Brain anomalies as well as linear and surface area measurements of the brain and corpus callosum were assessed. 1H MRS and DWI signals were evaluated in the frontal lobes, basal ganglia, hippocampi, and cerebellum. Several brain anomalies were found in children with FASD. Qualitative assessment showed the thinning of the corpus callosum in 40% of the cases and cerebral ventricular asymmetry in 32% of the children. The mean thickness of the corpus callosum isthmus and the mean length of the corpus callosum were statistically lower in children with FASD. Higher Lip/Cr concentration and DWI values as well as lower NAA/Cr, Cho/Cr, and mI/Cr concentrations were found in multiple studied brain regions. The analysis of the present findings in the study group showed that brain MRI examinations of children with FASD more often identified a decreased corpus callosum and 1H MRS and DWI abnormalities, particularly in the region of basal ganglia.

1. Introduction

Alcohol is the most common stimulant, known to have been used from the early days of human civilization. The effects of alcohol on the human body have been described since antiquity, but it was not until 1852 that the Swedish physician Magnus Huss formulated the concept of alcoholism as an illness [1]. It was also in antiquity that alcohol consumption during pregnancy was thought to potentially produce adverse consequences. Apparently, Aristotle argued that “drunken, or haire-brain women [for the] most part bring forth children like unto themselves” [2]. This was, however, intuitive knowledge. It took a more concrete shape when, in 1726, the English physician John Freind pointed out that drunkenness is a common cause of the birth of a weak, small, and sickly child [3]. The link between alcohol consumption during pregnancy and the child’s health became apparent during the so-called Gin Craze, a period from 1720 to 1751, when gin was very cheap in England and, therefore, its consumption among women increased enormously. In fact, gin has commonly been referred to as “Mother’s Ruin” since that time because the number of babies born in the period fell dramatically, with 75% of them not surviving past five years of age [4]. Notably, in his 1878 publication, the French physician Etienne Lancereaux described the characteristic appearances and intellectual conditions of children whose mothers had consumed alcohol during pregnancy [5].
It was only in 1968 that a scientific publication appeared where the French pediatrist Paul Lemoine described 127 newborn babies of alcoholic mothers—most stillborn or severely damaged [6]. The article by Lemoine led to increased interest in the effects of alcohol consumption in pregnancy on the development of children. In 1973, a team of American physicians and psychologists identified and described the pattern of typical malformations in children resulting from prenatal exposition to alcohol [7]. The condition was referred to as Fetal Alcohol Syndrome (FAS). Its characteristics include facial dysmorphic features (smooth philtrum, narrow palpebral fissures, and thin upper lip), short stature, low weight, low head circumference, and damage to central nervous system (CNS), reflected by existing neurological and general cognitive impairment as well as intellectual deficits.
Taking into account varied levels of prenatal exposition to alcohol and varied severities of the symptoms, in 1996, a team of American researchers working for the Institute of Medicine—IOM (currently known as the National Academy of Medicine—NAM) proposed a new classification of the developmental deficits associated with exposition to alcohol [8]. A few types of the condition were distinguished, relative to the expression of the symptoms: [1]). FAS with confirmed exposition to alcohol; [2]. FAS without confirmed exposition to alcohol; [3]. partial FAS (pFAS); [4]. Alcohol-Related Birth Disorder (ARBD); and [5]. Alcohol-Related Neurodevelopmental Disorder (ARND). As a result, a new term was introduced, i.e., Fetal Alcohol Spectrum Disorder (FASD). This term covers a wide range of effects observed in children whose mothers’ consumed alcohol during pregnancy; it is an umbrella term for impairments developing as a consequence of prenatal alcohol exposure [9,10,11,12]. As a result of the works presented, research has been intensified in several places to gain a more thorough understanding of alcohol-related mechanisms occurring during the fetal period.
The study aimed to assess central nervous system in children diagnosed with Fetal Alcohol Spectrum Disorder (FASD), using the techniques of magnetic resonance imaging (MRI), diffusion-weighted magnetic resonance imaging (DWI), and proton magnetic resonance spectroscopy (1H MRS).

2. Patients, Materials, and Methods

The analyses took into account 200 children, both female and male, aged 6–17 years, diagnosed with FASD, as well as 32 healthy children of both sexes, aged 6–16 years. A statistically significant difference in age was not detected between the study and the control group (p > 0.05). All children were examined in the same hospital.
FASD-related evaluation of the children was carried out by a qualified psychologist specializing in this disorder. That psychologist formulated the final diagnosis, which was taken into account in qualifying the children to the FASD group. The children were brought for assessment by foster parents, guardians, or biological parents. In all the cases, maternal alcohol consumption during pregnancy was confirmed based on court records, children’s medical records and history, as well as interviews in the case of biological parents. Parents or guardians sought help for their children because they were having difficulties at school, and the assessments carried out at the district’s psychological and pedagogical counselling center failed to identify the causes.
Children in the control group had no history of nervous system disorders or cranio-cerebral injuries, and they were taking no medication. The maternal consumption of alcohol during pregnancy and in the period of breastfeeding was also excluded. All the children in the control group were raised in their biological families.
If it was reported in the interview, the maternal use of other potentially harmful substances such as illicit drugs or medication that could affect the development of the fetus was also excluded in the case of children recruited to both the study and the control groups.
Magnetic resonance imaging, DWI, and 1H MRS (1.5 T MR system) of the brain was performed in all children in the study group and in the control group. The study was approved by the local bioethics commission.

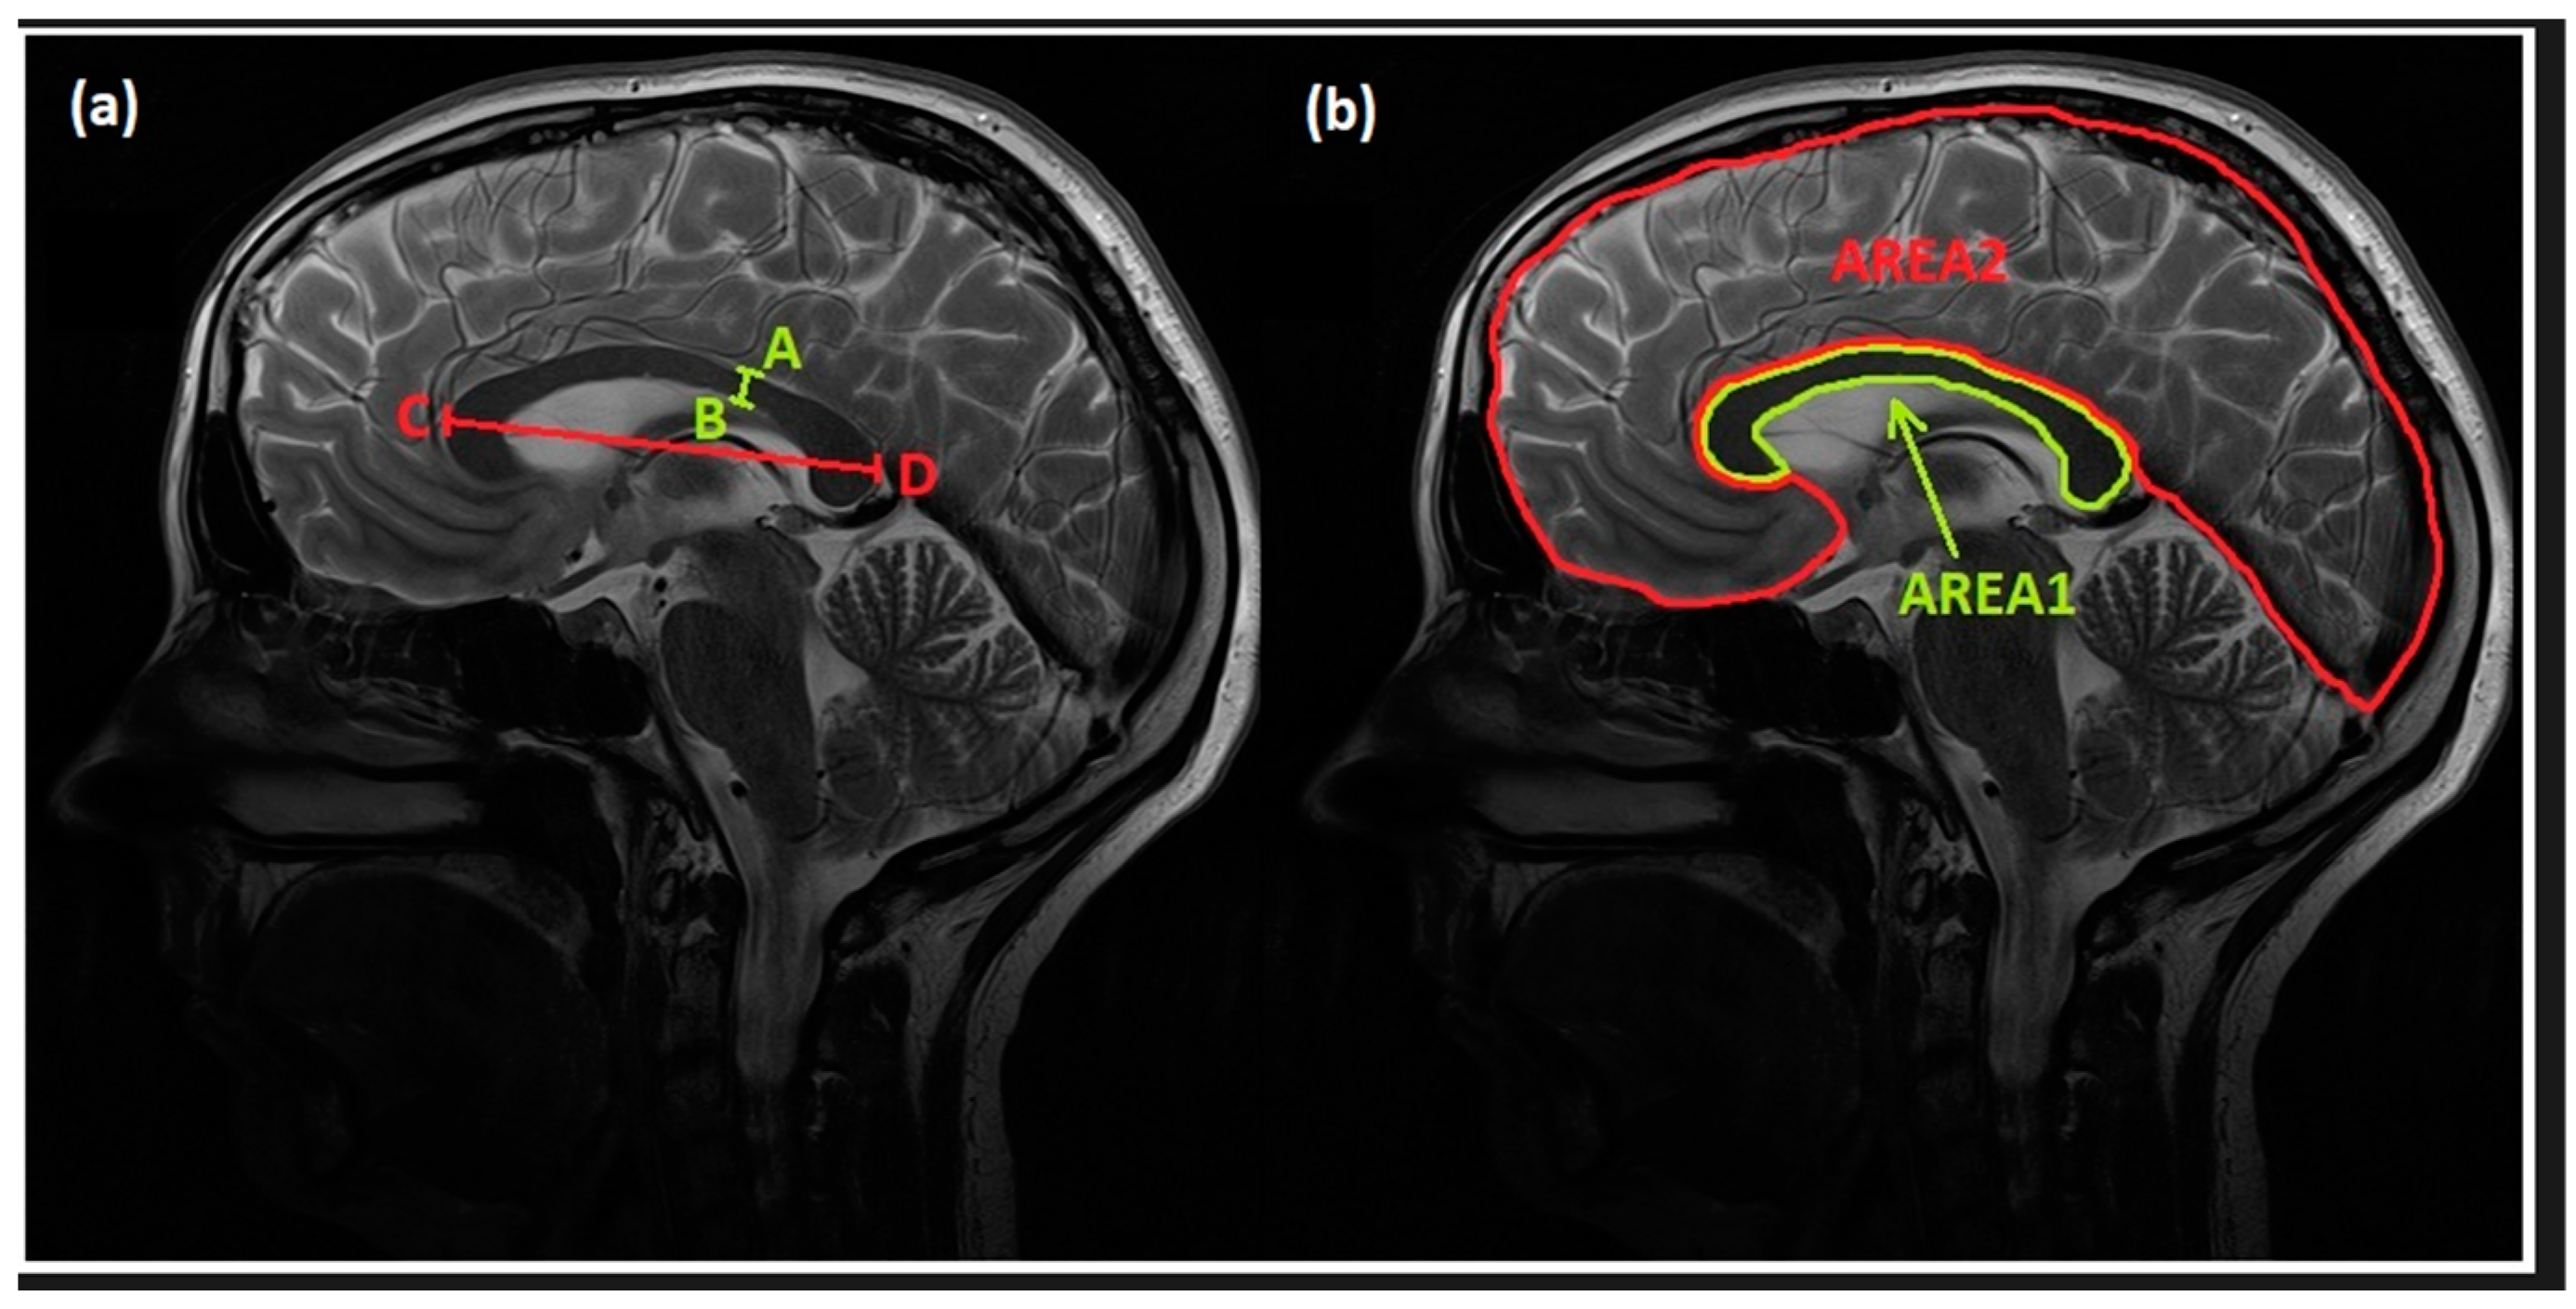
2.1. Structural Examinations

All examinations were performed without intravenous administration of contrast agents. Standard structural MR imaging of the head (T1 sagittal, T2 axial, T2 sagittal, PD axial, FLAIR axial) was performed to visualize anatomical structures of the brain. Based on these factors, analyses were carried out to identify any visible irregularities in the brains (both pathological changes and developmental variations) of children with FASD and to assess the frequency of isolated anomalies, as well as the co-existence of a few abnormalities. The analyses were performed by a radiologist with 25 years of experience and then verified by another radiologist involved in the study. As the analysis most frequently showed abnormalities in the corpus callosum, detailed morphometric measurements of this anatomical structure were also performed. All measurements were made on images in the sagittal plane passing along the mid-sagittal line of the body. To minimize errors, measurements were taken twice by two independent experienced researchers. If the difference between measurements was over 10%, the measurement was repeated by both researchers. The mean value was reported as the final value. Linear measurements of the corpus callosum thickness at the narrowest location—isthmus (AB)—and its maximum length (CD) were performed at the mid-sagittal cross-sectional image of the brain. The mid-sagittal cross-sectional area of the corpus callosum (AREA1) and the mid-sagittal cross-sectional area of the brain (AREA2) were measured in the same plane. The children examined in the study differed within the groups in terms of age, and, consequently, in the size of the corpus callosum. Therefore, an additional parameter expressing relative ratios was introduced in order to obtain an indicator presenting values independent of the size of the child’s head. Thus, the ratios of these areas (AREA1/AREA2) were calculated. The acquired values were compared between the study group and the control group. The method of performing individual linear and surface area measurements is shown in Figure 1.

2.2. 1H MRS Examinations

Proton magnetic resonance spectroscopy (1H MRS) was performed using Point-Resolved Spectroscopy Sequence (PRESS) technique (TE = 35 ms, TR = 1500 ms, number of acquisitions: 128, slice thickness = 20 mm). Spectroscopic signal was acquired from Volumes of Interest (VOIs 2 × 2 × 2 cm) in 7 locations: right and left frontal lobe, right and left basal ganglia, right and left hippocampus, and cerebellar vermis. Quantitative analysis of the spectroscopic data was performed using the dedicated software SAGE 7.0 (Spectroscopy Analysis, GE). The received signal was reconstructed and processed using the Gaussian function with a line broadening of 8 Hz. All the obtained 1H MRS data were good quality; therefore, the phase was not manually corrected. The baseline present in the spectrum was not erased.
Concentrations of the specific metabolites (N-acetylaspartate—NAA, choline—Cho, myo-inositol—mI, lipids—Lip, lactates—Lac) were calculated in relation to the concentration of creatine (Cr). Total concentration of each metabolite in the brain was calculated as a mean value of the results identified in the seven locations; for each child, concentrations of a given metabolite in all the studied locations were added, and the total value was then divided by seven (number of the locations). Additionally, the mean concentration value was calculated for the symmetrically distributed locations (frontal lobes, basal ganglia, hippocampi); the concentrations in the left and right hemisphere were added, and the total value was divided by two. Consequently, five results were acquired for each metabolite: concentration in the frontal lobes, basal ganglia, hippocampi, and cerebellum, as well as the mean value for all the anatomical locations in the brain.

2.3. DWI Examinations

Diffusion-weighted imaging (DWI) was performed using the following parameters: TR = 8400 ms, TE = 105 ms, FA = 90°, NEX = 2, b = 0, and b = 1500 s/mm2; slice thickness = 5 mm; FOV = 26 cm; spacing = 0 mm; matrix—128 × 128. The values of DWI and ADC (Apparent Diffusion Coefficient of water) were calculated for the same locations as in 1H MRS examination using Functool 2 software (GEMS).

2.4. Statistical Analysis of Data

Statistical analysis of the results was carried out using the software Statistica 13.3 PL (Statsoft). The normality of the data was assessed using the Shapiro–Wilk test. The equality of variances was evaluated with the use of Levene’s test. The differences in the results of linear measurements, surface area measurements, as well as DWI and ADC values and metabolite concentrations between healthy controls and children with FASD were verified using Student’s t-test, and a Mann–Whitney U-test was applied if the condition of normal distribution was not met. It was assumed that a difference was statistically significant if p < 0.05. The results of data analysis were presented as mean values and standard deviation.

3. Results

The evaluation of test results obtained with MR techniques revealed the presence of anatomical variants as well as statistically significant differences in metabolite concentrations and DWI values between the group of children with FASD and the control group.

3.1. Structural Examination

Structural images of 200 children with FASD were analyzed. One anomaly was found in 67.5% of the cases, two coexisting anomalies were identified in 20.5%, and three or more anomalies were observed in 9% of the cases. No irregularities were found in 3% of the children.
The qualitative assessment, with no measurements performed, showed a thinning of the corpus callosum in 40% of the cases and cerebral ventricular asymmetry in 32% of the children. The cavity of the septum pellucidum was observed in 12% of the children with FASD. Other anomalies identified included focal demyelination (9%), dysgenesis of the fornix of the brain (6%), enlargement of the subarachnoid space (6%), pineal cyst (4%), mega cisterna magna (4%), ventricular enlargement (4%), cortical atrophy (4%), cavum vergae (2%), focal porencephaly (2%), and cerebellar vermis hypoplasia (1.5%). In the group of 200 children, two subjects (1%) were found with pituitary adenoma, vascular malformations, partially empty sella syndrome, Dandy–Walker syndrome, or asymmetry of the cerebral hemispheres.
The specific dimensions of the corpus callosum were compared in children with FASD and the controls. The results are presented in Table 1. The comparative analyses showed that both the mean thickness of the corpus callosum isthmus (AB) and the mean length of the corpus callosum (CD) were statistically lower in children with FASD. Likewise, the area of the corpus callosum (AREA1) and the brain (AREA2), as well as their ratio (AREA1/AREA2), were significantly smaller in children with FASD compared to the controls.

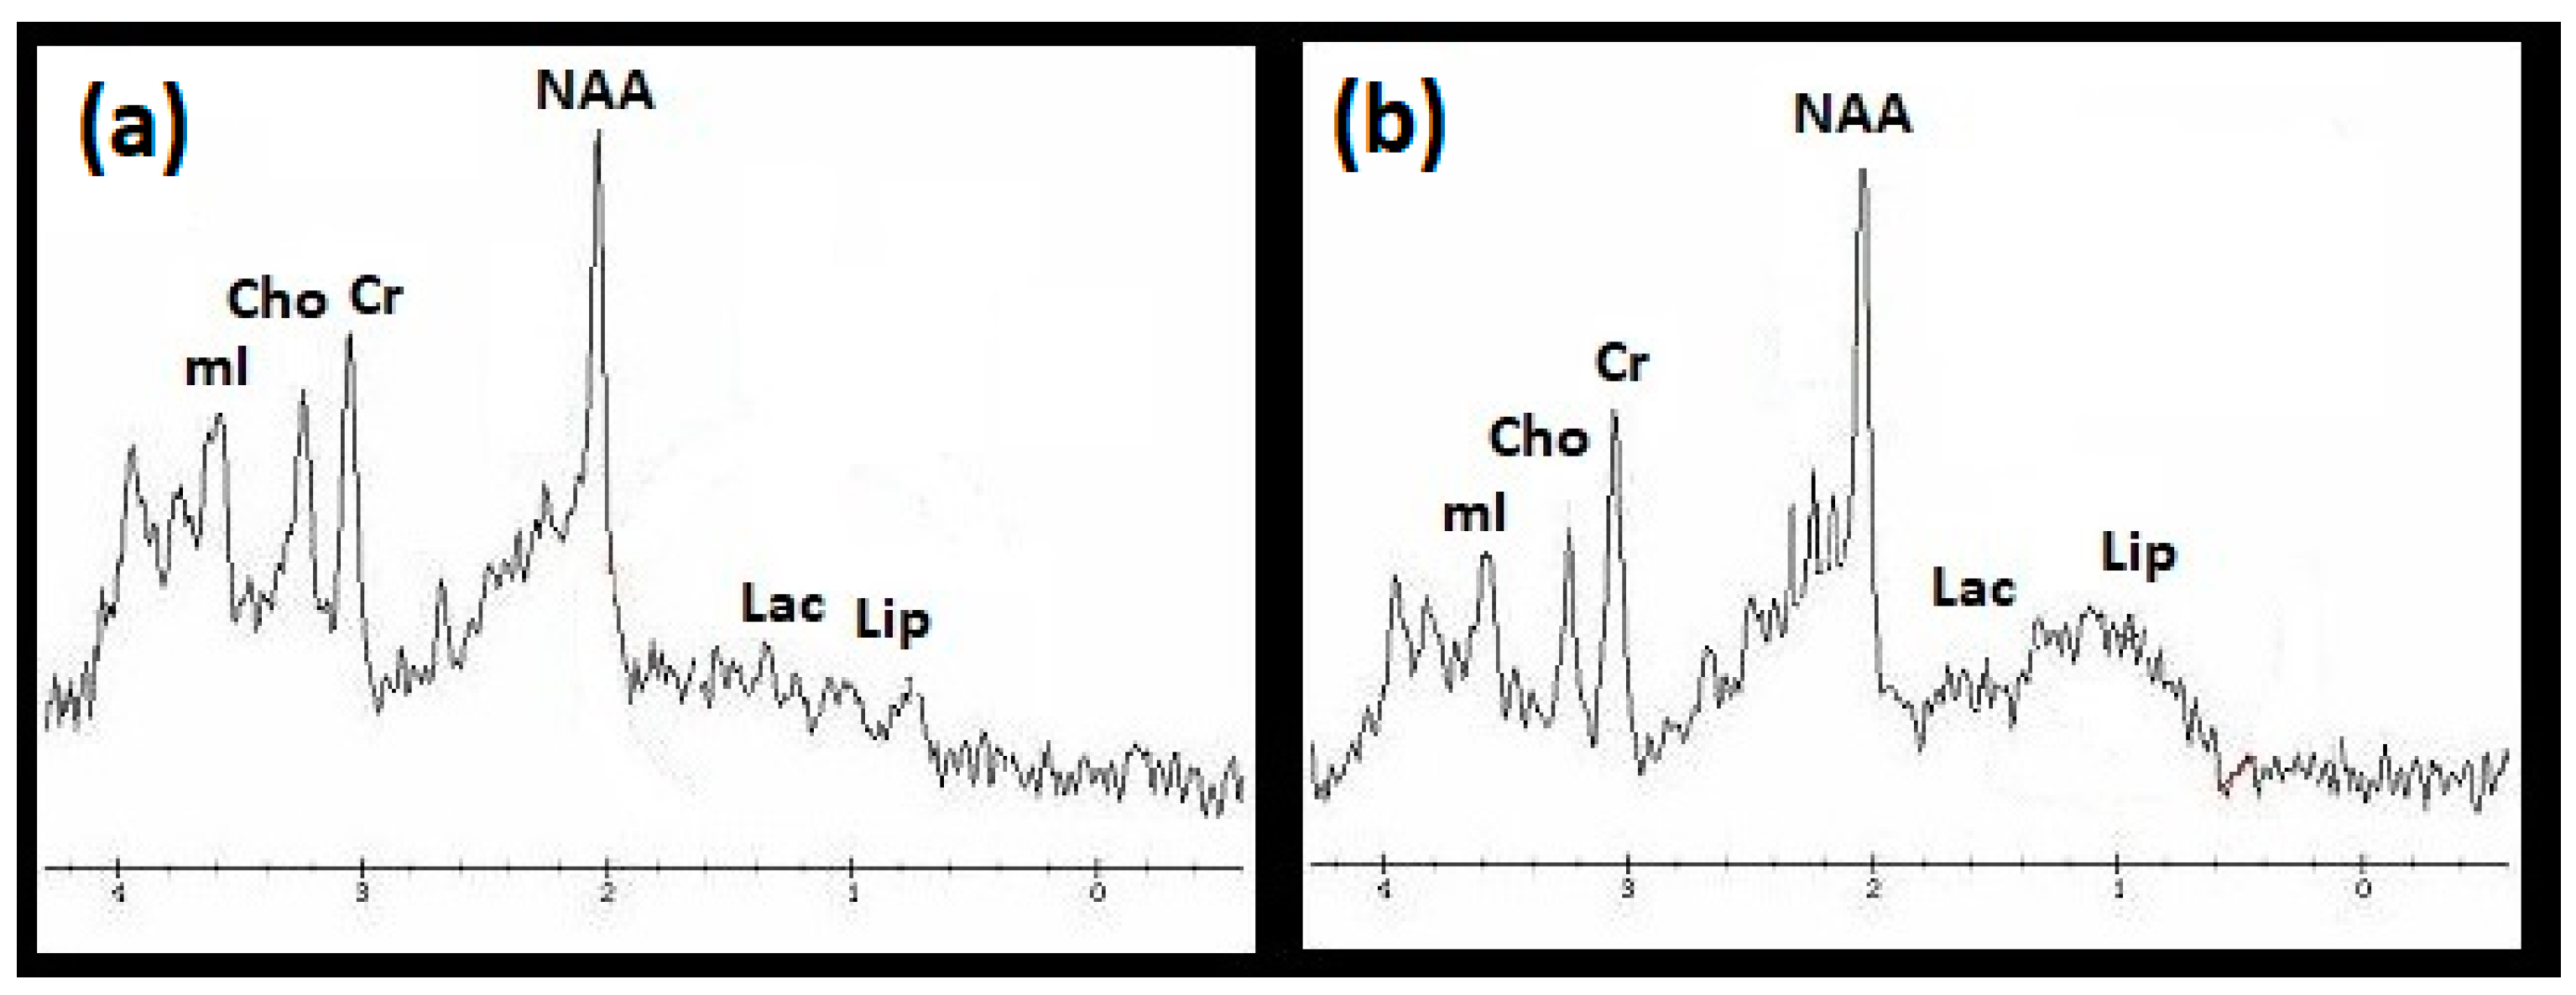
3.2. 1H MRS Examination

Sample 1H MRS spectra acquired from a child with FASD and a healthy control are shown in Figure 2. The quality of all spectra obtained during the exam was sufficient to perform the analyses and to determine the concentrations of selected metabolites.
Relative concentrations of the investigated metabolites in the specific locations were compared in children with FASD and healthy controls. The following statistically significant differences were identified in the case of children with FASD:
  • Higher Lip/Cr concentrations in the frontal lobes (p < 0.001), basal ganglia (p < 0.001), cerebellum (p < 0.05), and in the whole brain (p < 0.001);
  • Lower NAA/Cr concentrations in the frontal lobes (p < 0.05) and in the basal ganglia (p < 0.01);
  • Lower Cho/Cr concentrations in the basal ganglia (p < 0.01), cerebellum (p < 0.05), and in the whole brain (p < 0.05);
  • Lower mI/Cr concentrations in the frontal lobes (p < 0,05), basal ganglia (p < 0.05), hippocampi (p < 0.05), and in the whole brain (p < 0.001).

3.3. DWI Examination

The examination showed significantly higher DWI values in the group of children with FASD in the frontal lobes (p < 0.05), basal ganglia (p < 0.05), and in the whole brain (p < 0.05) compared to the control group. As for ADC, there was no statistically significant trend. The results are presented in Table 2.

4. Discussion

4.1. Structural Examination

Analyses of the structural MR images acquired from children with FASD showed a number of morphological anomalies. Even a qualitative assessment (without measurements performed) showed that 40% of these children presented with thinning of the corpus callosum, which is the main white matter tract connecting the two cerebral hemispheres. The morphometric measurements performed in the study also showed statistically significant thinning and shortening of the corpus callosum in children with FASD, as well as decreased callosal area in the sagittal plane (also in relation to the whole brain area). In the related literature, there are a lot of publications reporting results consistent with the present findings. This is because children with FASD are often found with decreased volume (thinning, shortening) [13,14,15,16] as well as an abnormal shape of the corpus callosum [17,18,19]—particularly in its posterior part [20,21].
The measurements of the mid-sagittal cross-sectional area of the brain conducted in the present study showed that this area is significantly smaller in children with FASD, compared to the controls. In accordance with the available literature, children with FASD present decreased dimensions of the cranium, brain and cerebellum [17,22,23,24], and more specifically decreased volumes of, e.g., the frontal lobes [25], parietal lobes [26,27], basal ganglia [28] and hippocampi [29,30].
Several research reports also show asymmetries in the brains of children with FASD, e.g., asymmetry of the hippocampi [28], brain hemispheres and cerebral ventricles [16], which was also demonstrated in the present study. The current study, however, also found other anomalies occurring in the brain (e.g., focal demyelination, cysts, cavities of septum pellucidum). These anomalies were not identified in all the children examined, and some of them were present only in isolated cases. Dyląg et al. [16] reported that 62% of the children with FASD presented with brain anomalies. In particular, they observed demyelination plaques (23.1%), as well as gray matter heterotopia, arachnoid cysts, vascular malformations, cavum septum pellucidum cysts, porencephalia, pineal cysts, and in isolated cases of pituitary adenomas and Dandy–Walker Syndrome. Boronat et al. [31] observed that children with FASD presented with arachnoid cysts, vascular anomalies, gliosis, pituitary hypoplasia, occipito-cervical junctions, cervical vertebral anomalies, prominent perivascular spaces, and cavum septum pellucidum.

4.2. 1H MRS Examination

The current findings showed significantly higher Lip/Cr concentration as well as lower NAA/Cr, Cho/Cr, and mI/Cr concentrations in children with FASD, compared to the controls. Furthermore, the greatest risk of these alterations was observed in the basal ganglia.
In the literature, there are few studies focusing on the differences in the brain metabolite composition in children exposed to alcohol during the fetal period [32]. Some of the reports were consistent with the current findings. Fagerlund et al. [33] observed lower levels of NAA/Cho and NAA/Cr in children with FASD than in the control group in the parietal and frontal cortices, the corpus callosum, thalamus, frontal white matter, and cerebellar dentate nucleus. Du Plessis et al. [34] observed lower NAA and Cho concentrations in the deep nuclei. Decreased NAA levels in the children with FASD may be indicative of an accelerated process of cell death, and, consequently, a reduced number of neurons or degradation [35]. A study conducted by Astley et al. [13] showed lower Cho concentrations in children with FASD, and this decrease was inversely correlated with mental impairment and the severity of facial phenotypic abnormalities. Gonçalves et al. [36] and O’Neill et al. [37] identified a decrease in the concentrations of Cho and Cho/Cr in children with ADHD exposed to alcohol in utero. This decrease was indicative of problems with myelination. In the literature, there are no reports showing statistically significant alterations in lipid concentrations. The increase in lipid concentrations, shown in the present study, was a marker of cell membrane damage. Similarly, no studies have reported a decrease in mI concentrations in children with FASD. This alteration is indicative of problems related to proliferation of glial cells, resulting from the maternal consumption of alcohol during gestation [35].
At the same time, in the literature, there are some reports that contradict the current findings. Du Plessis et al. [34] and Fagerlund et al. [33] observed higher levels of Cho and Cr in the corpus callosum, the parietal and frontal cortices, the thalamus, the frontal white matter, and the cerebellar dentate nucleus. Cortese et al. [38], on the other hand, found increased levels of NAA and NAA/Cr in the FASD group compared to the control group. Gonçalves et al. [36] identified increased mI/Cr concentration in the cerebellum. In the literature, there are also conflicting reports related to metabolites that were not investigated in the present study, i.e., glutamates and glutamine. According to Du Plessis et al. [34], children with FASD present with higher concentrations of Glu and Glx, whereas Howells et al. [39] reported lower concentrations of these metabolites.

4.3. DWI Examination

To the best knowledge of the authors, in the specialist literature, there are no reports about the use of DWI technique in the diagnostics of FASD. There are, however, publications reporting results of diffusion tensor imaging (DTI), a technique developed from the DWI method. Microstructural anomalies have been observed in several brain areas, including, e.g., the temporal lobe, cingulate gyrus, corticospinal tracts, inferior frontal–occipital fasciculus, inferior and superior longitudinal fasciculus, and thalamus. The most frequently observed anomalies include a decreased value of Fractional Anisotropy (FA) and increased values of Mean Diffusivity (MD) as well as the Apparent Diffusion Coefficient of water (ADC) [40,41,42], although studies investigating young children and neonates present the opposite results [43]. In the corpus callosum, altered DTI parameters are found in the splenium, isthmus, and genu [23,40,43,44,45]. The present findings show statistically significantly increased values of DWI in the frontal lobes, basal ganglia, and in the whole brain and decreased ADC values in the whole brain as well. This deviation from the typical DWI and ADC values may have been indicative of impaired microstructure in the brain regions examined. It is also worth mentioning the so-called translucence effect, when a higher DWI signal was due to a higher water content. Then, there was no clearer ADC reduction. It is likely that children with DWI have a higher water content, and thus a lower maturity of myelin.

5. Conclusions

Analysis of the present findings in the study group showed that brain MRI examinations of children with FASD significantly more often identified decreased linear measurements and areas of the sagittal cross-section of the corpus callosum. Furthermore, examinations of the brain performed using the 1H MRS and DWI techniques showed abnormalities both in metabolism rates and the microstructures of the brain in children with FASD, particularly in the region of basal ganglia.

Author Contributions

Conceptualization, A.U.; methodology, A.U.; validation, T.J.-S.; formal analysis, T.J.-S. and M.O.; investigation, A.U., M.N.-S. and T.J.-S.; data curation, A.U. and M.O.; writing—original draft preparation, A.U. and M.O.; writing—review and editing, A.U., M.N.-S., T.J.-S. and M.O.; visualization, M.O.; supervision, A.U. and M.N.-S.; project administration, A.U. All authors have read and agreed to the published version of the manuscript.

Funding

This research received no external funding.

Institutional Review Board Statement

The study was conducted in accordance with the Declaration of Helsinki and approved by the Human Research Ethics Committee in Adam Mickiewicz University in Poznań.

Informed Consent Statement

Informed consent was obtained from all subjects involved in the study.

Data Availability Statement

The data presented in this study are available on request from the corresponding author. The data are not publicly available due to privacy restrictions.

Conflicts of Interest

The authors declare no conflict of interest.

References

  1. Huss, M. Chronische Alkoholskrankheit oder Alcoholismus Chronicus: Ein Beitrag zur Kenntniss der Vergiftungs-Krankheiten; Van Dem Busch, G., Ed.; Kessinger Publishing: Whitefish, MT, USA, 1952. [Google Scholar]
  2. Abel, E.L. Was the fetal alhohol syndrome recognized by the Greek and Romans? Alcohol Alcohol. 1999, 34, 868–872. [Google Scholar] [CrossRef] [PubMed]
  3. Freind, J. The History of Physick: From the Time of Galen, to the Beginning of the Sixteenth Century. Chiefly with Regard to Practice. In a Discourse Written to Doctor Mead; Gale ECCO: London, UK, 1726. [Google Scholar]
  4. Watney, J. Mother’s Ruin: A History of Gin; Owen: London, UK, 1976. [Google Scholar]
  5. Lancereaux, E. De l’Alcoolisme et de Ses Conséquences au Point de Vue de L’état Physique, Intellectuel et Moral des Populations. Ph.D. Thesis, Faculté de Paris, Paris, France, 1878. [Google Scholar]
  6. Lemoine, P.; Harousseau, H.; Borteyru, J.P.; Menuet, J.C. Les enfantes de parents alcoholiques: Anomalies observees a propos de 127 cas. Quest Med. 1968, 21, 476–482. [Google Scholar]
  7. Jones, K.; Smith, D.; Ulleland, C.; Streissguth, A. Pattern of malformation in offspring of chronic alcoholic mothers. Lancet 1973, 301, 1267–1271. [Google Scholar] [CrossRef]
  8. Abel, E.L. Fetal Alcohol Syndrome. From Mechanism to Prevention; CRC Press: New York, NY, USA, 1996. [Google Scholar]
  9. Streissguth, A.P.; O’Malley, K. Neuropsychiatric implications and long-term consequences of fetal alcohol spectrum disorders. Semin. Clin. Neuropsychiatry 2000, 5, ascnp0050177. [Google Scholar] [CrossRef] [PubMed]
  10. Barr, H.M.; Streissguth, A.P. Identifying maternal self-reported alcohol use associated with fetal alcohol spectrum disorders. Alcohol. Clin. Exp. Res. 2001, 25, 283–287. [Google Scholar] [CrossRef] [PubMed]
  11. Astley, S.J. Diagnostic Guide for Fetal Alcohol Spectrum Disorders. The 4-Digit Diagnostic Code TM, 3rd ed.; University of Washinghton: Seattle, DC, USA, 2004. [Google Scholar]
  12. Riley, E.P.; Clarren, S.; Weinberg, J.; Jonsson, E. Fetal Alcohol Spectrum Disorder: Management and Policy Perspectives of FASD; Wiley-Blackwell: Weinheim, Germany, 2011. [Google Scholar]
  13. Astley, S.J.; Aylward, E.H.; Olson, H.C.; Kerns, K.; Brooks, A.; Coggins, T.E.; Davies, J.; Dorn, S.; Gendler, B.; Jirikowic, T.; et al. Magnetic resonance imaging outcomes from a comprehensive magnetic resonance study of children with fetal alcohol spectrum disorders. Alcohol. Clin. Exp. Res. 2009, 33, 1671–1689. [Google Scholar] [CrossRef] [Green Version]
  14. Biffen, S.C.; Warton, C.M.R.; Lindinger, N.; Randall, S.R.; Lewis, C.E.; Molteno, C.D.; Jacobson, J.L.; Jacobson, S.W.; Meintjes, E.M. Reductions in corpus callosum volume partially mediate effects of prenatal alcohol exposure on IQ. Front. Neuroanat. 2018, 11, 132. [Google Scholar] [CrossRef] [Green Version]
  15. Jacobson, S.W.; Jacobson, J.L.; Molteno, C.D.; Warton, C.M.; Wintermark, P.; Hoyme, H.E.; De Jong, G.; Taylor, P.; Warton, F.; Lindinger, N.M.; et al. Heavy Prenatal Alcohol Exposure is Related to Smaller Corpus Callosum in Newborn MRI Scans. Alcohol. Clin. Exp. Res. 2017, 41, 965–975. [Google Scholar] [CrossRef] [Green Version]
  16. Dyląg, K.A.; Sikora-Sporek, A.; Bańdo, B.; Boroń-Zyss, J.; Drożdż, D.; Dumnicka, P.; Przybyszewska, K.; Sporek, M.; Walocha, J.W.; Wojciechowski, W.; et al. Magnetic resonance imaging (MRI) findings among children with fetal alcohol syndrome (FAS), partial fetal alcohol syndrome (pFAS) and alcohol related neurodevelopmental disorders (ARND). Przegl. Lek. 2016, 73, 605–609. [Google Scholar]
  17. Inkelis, S.M.; Moore, E.M.; Bischoff-Grethe, A.; Riley, E.P. Neurodevelopment in adolescents and adults with fetal alcohol spectrum disorders (FASD): A magnetic resonance region of interest analysis. Brain Res. 2020, 1732, 146654. [Google Scholar] [CrossRef]
  18. Bookstein, F.L.; Streissguth, A.P.; Sampson, P.D.; Connor, P.D.; Barr, H.M. Corpus callosum shape and neuropsychological deficits in adult males with heavy fetal alcohol exposure. NeuroImage 2002, 15, 233–251. [Google Scholar] [CrossRef] [Green Version]
  19. Donald, K.A.; Eastman, E.; Howells, F.M.; Adnams, C.; Riley, E.P.; Woods, R.P.; Narr, K.L.; Stein, D.J. Neuroimaging effects of prenatal alcohol exposure on the developing human brain: A magnetic resonance imaging review. Acta Neuropsychiatr. 2015, 27, 251–269. [Google Scholar] [CrossRef] [PubMed] [Green Version]
  20. Yang, Y.; Phillips, O.R.; Kan, E.; Sulik, K.K.; Mattson, S.N.; Riley, E.P.; Jones, K.L.; Adnams, C.M.; May, P.A.; O’Connor, M.J.; et al. Callosal Thickness Reductions Relate to Facial Dysmorphology in Fetal Alcohol Spectrum Disorders. Alcohol. Clin. Exp. Res. 2012, 36, 798–806. [Google Scholar] [CrossRef] [PubMed] [Green Version]
  21. Sowell, E.R.; Thompson, P.M.; Mattson, S.N.; Tessner, K.D.; Jernigan, T.L.; Riley, E.P.; Toga, A.W. Voxel-based morphometric analyses of the brain in children and adolescents prenatally exposed to alcohol. Neuroreport 2001, 12, 515–523. [Google Scholar] [CrossRef] [Green Version]
  22. Treit, S.; Beaulieu, C. Imaging Brain Structure in FASD. In Ethical and Legal Perspectives in Fetal Alcohol Spectrum Disorders (FASD); Springer: Cham, Switzerland, 2018; pp. 77–93. [Google Scholar]
  23. Treit, S.; Chen, Z.; Zhou, D.; Baugh, L.; Rasmussen, C.; Andrew, G.; Pei, J.; Beaulieu, C. Sexual dimorphism of volume reduction but not cognitive deficit in fetal alcohol spectrum disorders: A combined diffusion tensor imaging, cortical thickness and brain volume study. NeuroImage Clin. 2017, 15, 284–297. [Google Scholar] [CrossRef]
  24. Hemingway, S.J.A.; Davies, J.K.; Jirikowic, T.; Olson, E.M. What proportion of the brain structural and functional abnormalities observed among children with fetal alcohol spectrum disorder is explained by their prenatal alcohol exposure and their other prenatal and postnatal risks? Adv. Pediatr. Res. 2020, 7, 41. [Google Scholar]
  25. Sowell, E.R.; Thompson, P.M.; Mattson, S.N.; Tessner, K.D.; Jernigan, T.L.; Riley, E.P.; Toga, A.W. Regional brain shape abnormalities persist into adolescence after heavy prenatal alcohol exposure. Cereb. Cortex. 2002, 12, 856–865. [Google Scholar] [CrossRef] [PubMed] [Green Version]
  26. Archibald, S.L.; Fennema-Notestine, C.; Gamst, A.; Riley, E.P.; Mattson, S.N.; Jernigan, T.L. Brain dysmorphology in individuals with severe prenatal alcohol exposure. Dev. Med. Child. Neurol. 2001, 43, 148. [Google Scholar] [CrossRef] [Green Version]
  27. Meintjes, E.M.; Narr, K.L.; Van Der Kouwe, A.J.; Molteno, C.D.; Pirnia, T.; Gutman, B.; Woods, R.P.; Thompson, P.M.; Jacobson, J.L.; Jacobson, S.W. A tensor-based morphometry analysis of regional differences in brain volume in relation to prenatal alcohol exposure. NeuroImage Clin. 2014, 5, 152–160. [Google Scholar] [CrossRef] [Green Version]
  28. Little, G.; Beaulieu, C. Multivariate models of brain volume for identification of children and adolescents with fetal alcohol spectrum disorder. Hum. Brain Mapp. 2020, 41, 1181–1194. [Google Scholar] [CrossRef] [Green Version]
  29. Dodge, N.C.; Thomas, K.G.F.; Meintjes, E.M.; Molteno, C.D.; Jacobson, J.L.; Jacobson, S.W. Reduced Hippocampal Volumes Partially Mediate Effects of Prenatal Alcohol Exposure on Spatial Navigation on a Virtual Water Maze Task in Children. Alcohol. Clin. Exp. Res. 2020, 44, 844–855. [Google Scholar] [CrossRef]
  30. Roediger, D.J.; Krueger, A.M.; de Water, E.; Mueller, B.A.; Boys, C.A.; Hendrickson, T.J.; Schumacher, M.J.; Mattson, S.N.; Jones, K.L.; Lim, K.O.; et al. Hippocampal subfield abnormalities and memory functioning in children with fetal alcohol Spectrum disorders. Neurotoxicol. Teratol. 2020, 83, 106944. [Google Scholar] [CrossRef]
  31. Boronat, S.; Sanchez-Montanez, A.; Gomez-Barros, N.; Jacas, C.; Martinez-Ribot, L.; Vázquez, E.; Del Campo, M. Correlation between morphological MRI findings and specific diagnostic categories in fetal alcohol spectrum disorders. Eur. J. Med. Genet. 2017, 60, 65–71. [Google Scholar] [CrossRef]
  32. Goldberg, E.M.; Aliani, M. Metabolomics and fetal alcohol spectrum disorder. Biochem. Cell Biol. 2018, 96, 198–203. [Google Scholar] [CrossRef] [PubMed] [Green Version]
  33. Fagerlund, Å.; Heikkinen, S.; Autti-Rämö, I.; Korkman, M.; Timonen, M.; Kuusi, T.; Riley, E.P.; Lundbom, N. Brain metabolic alterations in adolescents and young adults with fetal alcohol spectrum disorders. Alcohol. Clin. Exp. Res. 2006, 30, 2097–2104. [Google Scholar] [CrossRef]
  34. Du Plessis, L.; Jacobson, J.L.; Jacobson, S.W.; Hess, A.T.; van der Kouwe, A.; Avison, M.J.; Molteno, C.D.; Stanton, M.E.; Stanley, J.A.; Peterson, B.S.; et al. An in vivo 1H magnetic resonance spectroscopy study of the deep cerebellar nuclei in children with fetal alcohol spectrum disorders. Alcohol. Clin. Exp. Res. 2014, 38, 1330–1338. [Google Scholar] [CrossRef] [PubMed] [Green Version]
  35. Cichocka, M.; Urbanik, A. Widmo protonowej spektroskopii rezonansu magnetycznego (1H MRS) mózgu dorosłego człowieka. Inż. Fiz. Med. 2017, 6, 193–196. [Google Scholar]
  36. Gonçalves, R.D.; Vasconcelos, M.M.; Faleiros, L.O.; Cruz, L.C., Jr.; Domingues, R.C.; Brito, A.R.; Werner, J., Jr.; Herdy, G.V. Proton magnetic resonance spectroscopy in children with fetal alcohol spectrum disorders. Arq. Neuro-Psiquiatr. 2009, 67, 254–261. [Google Scholar] [CrossRef] [Green Version]
  37. O’Neill, J.; O’Connor, M.J.; Yee, V.; Ly, R.; Narr, K.; Alger, J.R.; Levitt, J.G. Differential neuroimaging indices in prefrontal white matter in prenatal alcohol-associated ADHD versus idiopathic ADHD. Birth Defects Res. 2019, 111, 797–811. [Google Scholar] [CrossRef]
  38. Cortese, B.M.; Moore, G.J.; Bailey, B.A.; Jacobson, S.W.; Delaney-Black, V.; Hannigan, J.H. Magnetic resonance and spectroscopic imaging in prenatal alcohol-exposed children: Preliminary findings in the caudate nucleus. Neurotoxicol. Teratol. 2006, 28, 597–606. [Google Scholar] [CrossRef] [PubMed]
  39. Howells, F.M.; Donald, K.A.; Roos, A.; Woods, R.P.; Zar, H.J.; Narr, K.L.; Stein, D.J. Reduced glutamate in white matter of male neonates exposed to alcohol in utero: A 1H-magnetic resonance spectroscopy study. Metab. Brain Dis. 2016, 31, 1105–1112. [Google Scholar] [CrossRef]
  40. Paolozza, A.; Treit, S.; Beaulieu, C.; Reynolds, J.N. Diffusion tensor imaging of white matter and correlates to eye movement control and psychometric testing in children with prenatal alcohol exposure. Hum. Brain Mapp. 2017, 38, 444–456. [Google Scholar] [CrossRef]
  41. Roos, A.; Wedderburn, C.J.; Fouche, J.-P.; Subramoney, S.; Joshi, S.H.; Woods, R.P.; Zar, H.J.; Narr, K.L.; Stein, D.J.; Donald, K.A. Central white matter integrity alterations in 2–3-year-old children following prenatal alcohol exposure. Drug Alcohol Depend. 2021, 225, 108826. [Google Scholar] [CrossRef]
  42. Long, X.; Lebel, C. Evaluation of Brain Alterations and Behavior in Children with Low Levels of Prenatal Alcohol Exposure. JAMA Netw. Open 2022, 5, e225972. [Google Scholar] [CrossRef] [PubMed]
  43. Kar, P.; Reynolds, J.E.; Ben Gibbard, W.; McMorris, C.; Tortorelli, C.; Lebel, C. Trajectories of brain white matter development in young children with prenatal alcohol exposure. Hum. Brain Mapp. 2022, 43, 4145–4157. [Google Scholar] [CrossRef] [PubMed]
  44. Lebel, C.; Rasmussen, C.; Wyper, K.; Walker, L.; Andrew, G.; Yager, J.; Beaulieu, C. Brain diffusion abnormalities in children with fetal alcohol spectrum disorder. Alcohol. Clin. Exp. Res. 2008, 32, 1732–1740. [Google Scholar] [CrossRef] [PubMed]
  45. Fryer, S.L.; Schweinsburg, B.C.; Bjorkquist, O.A.; Frank, L.R.; Mattson, S.N.; Spadoni, A.D.; Riley, E.P. Characterization of white matter microstructure in fetal alcohol spectrum disorders. Alcohol. Clin. Exp. Res. 2009, 33, 514–521. [Google Scholar] [CrossRef] [PubMed] [Green Version]
Figure 1. Schemes of measurements of the corpus callosum and brain in children with FASD and children from the control group: (a) linear measurements, (b) surface area measurements.
Applsci 13 07303 g001
Figure 2. Sample 1H MRS spectra acquired from (a) a healthy child in the control group and (b) a child with FASD.
Applsci 13 07303 g002
Table 1. Comparison of the corpus callosum measurements (mean values + standard deviation) in the FASD group and in the control group.
ParameterControl GroupFASD Groupp
AB (mm)3.72 ± 0.822.92 ± 0.99<0.001 *
CD (mm)69.21 ± 4.065.14 ± 4.59<0.001 *
AREA1 (mm2)4.98 ± 0.594.29 ± 1.01<0.001 *
AREA2 (mm2)95.29 ± 8.5590.13 ± 8.57<0.001 *
AREA1/AREA20.05 ± 0.0050.04 ± 0.01<0.01 *
AB—corpus callosum thickness, CD—corpus callosum maximum length, AREA1—corpus callosum area, AREA2—brain area, *—statistically significant result.
Table 2. Comparison of the brain DWI and ADC values (mean values + standard deviation) in the FASD group and in the control group.
DWIADC
FASD MeanControls MeanpFASD MeanControls Meanp
frontal lobes212.71 ± 33.36195.44 ± 34.990.01 *0.0007 ± 0.00000.0007 ± 0.00010.73
basal ganglia195.72 ± 34.47179.48 ± 36.420.03 *0.0007 ± 0.00000.0007 ± 0.00000.25
hippocampi251.96 ± 47.58234.23 ± 44.560.060.0009 ± 0.00060.0010 ± 0.00010.33
cerebellum298.15 ± 61.79278.57 ± 58.870.110.0008 ± 0.00010.0007 ± 0.00010.09
mean value from all the studied VOIs231.28 ± 37.18213.84 ± 35.590.02 *0.0008 ± 0.00000.0008 ± 0.00000.07
DWI—Diffusion-Weighted Imaging value, ADC—Apparent Diffusion Coefficient of water, *—statistically significant result.
Disclaimer/Publisher’s Note: The statements, opinions and data contained in all publications are solely those of the individual author(s) and contributor(s) and not of MDPI and/or the editor(s). MDPI and/or the editor(s) disclaim responsibility for any injury to people or property resulting from any ideas, methods, instructions or products referred to in the content.

