Abstract
To investigate the effects of long-term freeze–thaw cycles on the physical and mechanical properties as well as the attenuation trend of rocks, this study conducted saturated freeze–thaw tests on coarse sandstone and fine sandstone samples collected from the slopes of Muli Coal Mine in Qinghai Province. The samples underwent different numbers of freeze–thaw cycles, and their porosity, longitudinal wave velocity, and uniaxial compression strength were studied. The variations in the physical and mechanical properties of the two types of sandstone with respect to the number of freeze–thaw cycles were analyzed. Take uniaxial compressive strength (UCS) as the integrity index, and decay laws of rock integrity were analyzed based on the decay equation suggested in previous studies. We found that the decay index λ, which is commonly assumed to be constant, varies with the number of freeze–thaw cycles. Furthermore, the λ values varied between different rock types. For fine sandstone, the λ decreases with an increase in the number of freeze–thaw cycles, ranging from 0.00385 to 0.005. However, for coarse sandstone, the λ initially decreases and then increases with an increase in the number of freeze–thaw cycles. The range of λ for coarse sandstone is between 0.00376 and 0.00481. Finally, we established a relationship between the decay index, porosity, and longitudinal wave velocity in the fine sandstones. This relationship provides a more straightforward way to evaluate the integrity of fine sandstones subjected to different numbers of freeze–thaw cycles.
1. Introduction
Investigations conducted in mountainous areas such as the Alps and the South-North Polar regions [1,2] have revealed the detrimental effects of long-term freeze–thaw cycling on rocks. This natural weathering process leads not only to the rupture of surface rocks and the accumulation of debris but also increases the occurrence of hazardous events such as rock falls and landslides. Over an extended period, in conjunction with other weathering processes, these phenomena contribute to ongoing changes in the topography and geomorphology of cold regions [3]. Furthermore, during engineering construction activities in cold areas, various rock elements, including rock side-slopes, tunnel-wall rocks, and rock materials used for construction purposes (e.g., carvings, wall surfaces, and ground linings), are susceptible to damage caused by freeze–thaw cycling [4,5,6,7,8,9]. Therefore, gaining a comprehensive understanding of the alterations in the physical and mechanical properties of rocks subjected to freeze–thaw cycles is crucial not only for elucidating the evolution of topography and geomorphology but also for facilitating effective engineering construction practices in cold regions.
Since the 1950s, many experiments of rocks under F–T cycling have been carried out [10,11,12,13,14,15,16,17,18,19]. The results further confirmed that the physical and mechanical properties of rocks deteriorate with F–T cycles. Based on the results of 10 different rocks subjected to F–T cycling, Mutlutürk [20] found that if Shore hardness (SH) was the rock integrity index, there is a relationship between the rock integrity index and the number of F–T cycles.
where, λ is the decay index, I0 is the rock initial integrity, and IN is the integrity after N cycles of freeze–thaw (F–T). Since then, scholars [21,22,23,24,25,26,27,28,29,30,31] have adopted different physical and mechanical indices of various rocks under F–T cycles as integrity to validate this equation. Partial data are summarized in Table 1. Considering that UCS is a more meaningful mechanical indicator for engineering purposes, this study uses UCS as integrity.

Table 1.
Different integrity indexes and corresponding decay index λ.
When determining λ, the usual method is to measure the integrity before and after it is subjected to different F–T cycles, and then based on Equation (1), regression analysis is used to obtain the λ [21,22,23,24,25,26,27,28,29,30,31]. Another approach is to establish a relationship between the initial physical and mechanical indices of the rock and the decay index and use this to estimate the decay index. For example, Yavuz [32] calculated the decay index based on the initial integrity and porosity, while Huang et al. [33] calculated the decay index based on the initial porosity, elastic modulus, and Brazilian tensile strength (BTS).There is an implicit prerequisite, i.e., λ is considered as a constant in the whole process of F–T cycling, which does not conform to the observed phenomena in the experiments [12,34]. It is reasonable to consider that λ varies with the number of F–T cycles. The relationships between λ and the F–T cycle numbers are likely to be different.
To investigate the effects of long-term freeze–thaw cycles on the physical and mechanical properties as well as the attenuation trend of rocks, the present authors investigated the changes in physical and mechanical properties of two sandstones subjected to F–T cycling. Taking uniaxial compressive strength (UCS) as the integrity, the decay equation and the decay index of the rock integrity in terms of F–T cycling were studied. For fine sandstone, we observed that the decay index gradually decreases with an increase in the number of freeze–thaw cycles. Furthermore, it exhibits a good fitting relationship with the longitudinal wave velocity. This relationship provides a more straightforward way to evaluate the integrity of fine sandstones subjected to different numbers of freeze–thaw cycles.
2. Materials and Methods
The rocks used for the experiment were taken from the slope of the Muji open-pit coal mine in Qinghai, and consist of two varieties of sandstone, one is coarse and the other is fine. The rock samples were processed into standard cylindrical specimens with a diameter of 50 mm and a height of 100 mm, meeting the requirements of the International Society for Rock Mechanics for a height-to-diameter ratio of 2.0~2.5. The processing accuracy followed the relevant requirements of Standard for Test Methods of Engineering Rock mass [35] for uniaxial compressive-strength test specimens. The processed standard specimens were observed and initially selected, and rock samples with visible structural inhomogeneity and defects were screened out. The fine and coarse sandstone samples were numbered separately, with 20 samples for each type of sandstone.
According to the regulations in the Code of Test Methods of Rock for Highway Engineering [36], making reference to the temperature and time setting conditions in previous studies [13,24], the negative temperature in this test was set as −25 °C, the duration time was 8 h, the temperature for thaw was +25 °C, also for 8 h, i.e., one freeze–thaw cycle takes 16 h. The freeze–thaw test was carried out using a freeze–thaw cycling test device XT5405FSC. During freezing, the rock specimens were wrapped up with plastic film so as to keep the moisture content unchanged; and when thawing, the rock specimens were soaked in distilled water.
In order to study the influence of freeze–thaw cycle numbers upon the physical and mechanical properties, the porosity, the velocity of longitudinal wave and the uniaxial compressive strength were measured individually after the rock specimens experienced 0, 30, 60, 90 and 120 freeze–thaw cycles. The variations in these parameters were analyzed. The testing methodologies were as follows.
Equation (2) is used to calculate the porosity:
where, n denotes the rock porosity %;
ms denotes the rock mass after saturation after different number of freeze–thaw cycles, g;
md is the dry rock mass, g;
mw is the rock mass-in-water after different number of freeze–thaw cycles, g.
A digital ultrasonic instrument (RSM-SY5(N)) was used to measure the velocity of longitudinal wave of the saturated rock specimens after a certain number (0, 30, 60, 90, 120) of freeze–thaw cycles.
The multi-functional electro-hydraulic-servo rock mechanical testing system manufactured by the MTS Company was used to perform the uniaxial compressive-strength tests of rock specimens after freeze–thaw cycles. Testing procedures are referred to the Chinese codes of testing method for engineering rock mass [35]. MTS Equipment with circumferential sensors can detect the circumferential strain in rock axial compression so that Poisson’s ratio can be obtained.
3. Results and Discussion
3.1. Changes in Porosity
It can be seen from Table 2 that the porosity of two sandstones increases with the increase in the number of freeze–thaw cycles. For instance, the porosity of fine sandstone specimen No. 2-20 increases from 1.63% to 3.33% after 120 freeze–thaw cycles, with an increase of 104%; while for the porosity of coarse sandstone specimen No. 1-19, an increase of 82% was observed from 1.92% to 3.49% after 120 cycles.
Table 2.
Porosity of sandstone specimens (%) subjected to different number of freeze–thaw cycles.
The increase in porosity is likely attributed to ice formation in the specimens. On the one hand, when temperature decreases, pore water in rocks can gradually freeze to ice, producing 9% of the volume expansion. On the other hand, under the action of the temperature gradient, the unfrozen water films migrate and segregation ice forms [37,38,39,40,41]. Under the action of the above two causes, pores in rocks are bound to increase in forms of in situ expansion or even cracks. When temperature rises, moisture gradually infiltrates into the newly formed micro-cracks or expanded pores, causing even more serious expansion or cracking during freezing in the next cycle. Accordingly, freeze–thaw cycles cause the above function to occur repeatedly, thereby leading to a continuous increase in rock porosity.
3.2. Changes in Velocity of Longitudinal Wave
It can be seen from Table 3 that the velocity of the longitudinal wave of two sandstones decreases with the increase in the number of freeze–thaw cycles. There are apparent differences in the varying amplitudes of the two rocks. The average velocity of the longitudinal wave of the fine sandstone specimen decreased from 3821 m/s to 2990 m/s after 120 freeze–thaw cycles, with a decrease of 21.8%, while coarse sandstone specimens decreased from 3642 m/s to 3116 m/s, with a decrease of 14.4%.
Table 3.
Sandstone specimen velocity of longitudinal wave (m/s) after undergoing the different times of freeze–thaw cycles.
The propagation velocity of sound waves in the rock mass is closely related to the elasticity of the medium, the degree of hard density and the integrity. In general, fresh and complete rock has a relatively large longitudinal wave velocity. With an increase in the degree of weathering, the wave velocity is bound to decrease. The continuous decrease in wave velocity also reflects the fact that rock porosity increases as the number of freeze–thaw cycles increases.
3.3. Uniaxial Compressive Test
3.3.1. Damage Features
Under uniaxial compressive strength (UCS), various damage patterns were observed, mainly related to loading methods, loading rate, and the water content of specimens, etc. Basically, two patterns were encountered, namely, compressive shear failure and tensile fractures, as shown in Figure 1.
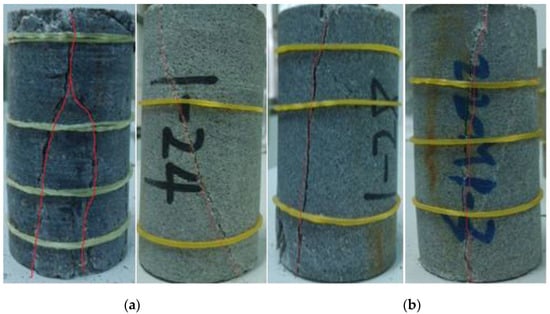
Figure 1.
Typical rock compressive damage morphotypes after different freeze–thaw cycles: (a) compressive shear failure; and (b) tensile fracture.
3.3.2. Uniaxial Compressive Strength Testing Results
Stress–strain curves are illustrated in Figure 2. It can be seen from Figure 2 that the stress–strain curves of sandstone conform to the general rule of rock deformation: they are divided into compaction stage-elastic, stage-shaping yield-failure, in which the compaction stage of the coarse sandstone is more obvious due to pores and fractures. The UCS of both rocks decreased with the increase of freeze–thaw cycles, and the corresponding strain increased at the peak intensity.
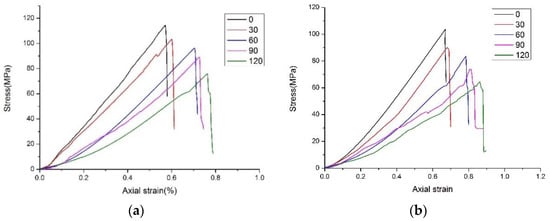
Figure 2.
Typical rock compressive damage morphotypes after different freeze–thaw cycles: (a) fine sandstone; and (b) coarse sandstone.
The concrete results of uniaxial compressive strength tests are listed in Table 4.
Table 4.
Results of sandstone specimen uniaxial compressive strength tests.
3.4. Rock Integrity Decay Laws Based on Uniaxial Compressive Strength
3.4.1. Decay Index λ under the Different Times of Freeze–thaw Cycles
Taking the uniaxial compressive strength as rock integrity index, Equation (1) can be used to obtain decay index λ:
where, UCS0 is the uniaxial compressive strength before freeze–thaw cycling; UCSN is the uniaxial compressive strength of the rock undergoing N freeze–thaw cycles.
The measurement of uniaxial compressive strength of fine and coarse sandstone after the different number of freeze–thaw cycles and λ obtained by Equation (3) are listed in Table 5.
Table 5.
λ corresponding to the different freeze–thaw cycles.
It can be seen from Table 5 that with the increase in the number of freeze–thaw cycles, λ continues to change with a certain varying law. As far as the fine sandstone is concerned, λ continues to decrease, indicating that the integrity loss caused by the single freeze–thaw is rather serious in the initial freeze–thaw cycles; with the increase in the number of freeze–thaw cycles, the integrity loss caused by a single freeze–thaw gradually decreases and tends to become a certain constant. For the coarse sandstones, however, λ appears to decrease first and then increase with an increase in the times of freeze–thaw cycles. The following analysis focuses on fine sandstone.
Substituting the obtained λ for freeze–thaw cycles of N = 30, 60, 90 and UCS0 = 114.8 MPa into Equation (1), we can obtain the corresponding decay equations in the following:
The above decay development by Equations (4)–(6) and the measured uniaxial compressive strength are illustrated in Figure 3.
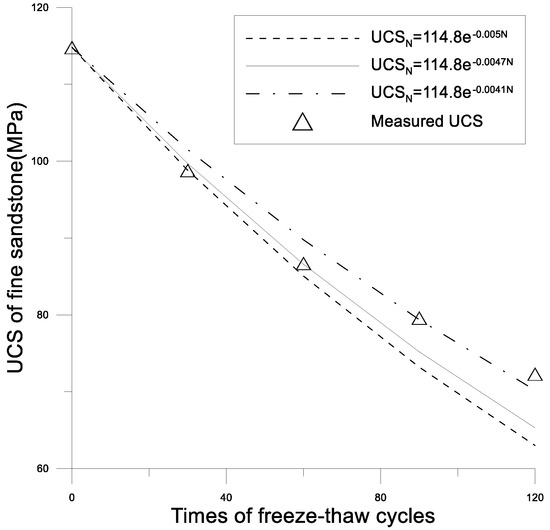
Figure 3.
Different λ corresponding to fine sandstone integrity decay curves and measured UCS.
It can be seen from Figure 3 that if Equation (2) is used to calculate λ of 30, 60 and 90 freeze–thaw cycles, then the equation and these 3 different λ values are used to calculate the uniaxial compressive strength after 120 cycles, UCS120, we obtain three different values of 63 MPa, 65 MPa and 70.5 MPa, respectively. The differences from the measured UCS120 are 9.3 MPa, 6.8 MPa and 1.8 MPa, respectively. A better prediction for rock integrity after a certain cycle number M can be made by λ obtained from another cycle N closer to M. If the decay equation is characterized with the obtained λ in the 30 cycles, the obtained uniaxial compressive strength in the extrapolation N = 120 freeze–thaw cycles is 13% less than the measured value, i.e., the integrity loss after undergoing 120 freeze–thaw cycles is considerably overestimated.
Taking the uniaxial compressive strength of the marble [42] after different freeze–thaw cycles as an example, the results are illustrated in Figure 4.
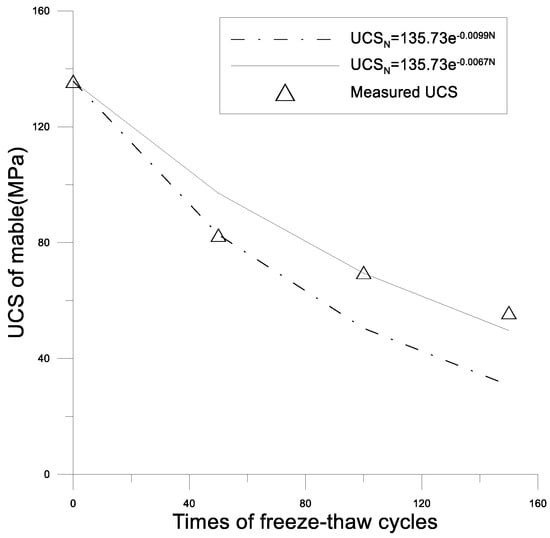
Figure 4.
Different λ corresponding to marble integrity decay curves and measured UCS.
It can also be noticed from Figure 4 that better prediction for rock integrity after a certain cycle number M can be made by a λ obtained from another cycle N closer to M. If the decay equation is characterized with the obtained λ in the 50 times of freeze–thaw cycles, the obtained uniaxial compressive strength in the extrapolation N = 150 times of freeze–thaw cycles is 45% less than the measured value, i.e., the integrity loss after undergoing 150 times freeze–thaw cycles is considerably overestimated.
The above analysis indicates that λ in the decay Equation (1) is not a constant but rather changes with the increase in the number of freeze–thaw cycles. When the rock integrity degree is characterized with the uniaxial compressive strength, λ (of fine sandstone and marble) decreases with the increase in number of freeze–thaw cycles, and gradually tend to be a constant. Therefore, when the obtained λ from a small number of freeze–thaw cycles is substituted into the decay equation, there will be a larger discrepancy between the calculated and measured results for the integrity after a larger number of cycles. The loss of the integrity is overestimated. The decay parameter that in previous studies is considered as a constant might only be reasonable for small number of freeze–thaw cycles.
What is worth noticing is that changes in the laws of λ with the number of freeze–thaw cycles vary with different rocks and, accordingly, micro-structures. In our testing program, for coarse sandstone, λ decreased first and then increased; while the λ of andesite [11] basically remains unchanged in the process of freeze–thaw cycles. The varying law can be different for different rocks, but it is also influenced by factors such as the structure components, grain shapes, pores and micro-cracks, etc.
3.4.2. Relationship of the Decay Parameter versus Porosity and Longitudinal Wave Velocity of the Sandstone
Taking UCS as the integrity index, it is necessary to perform freeze–thaw cycling and compression tests to obtain λ; however, it is rather time- and labor-intensive and costly. It is therefore desirable to relate λ with some easily obtained indexes, so that the decay equation can be used to predict the UCS of rocks subjected to certain freeze–thaw cycles.
The fine sandstone λ decreases with the increase in the number of freeze–thaw cycles, which implies that greater integrity loss is caused by a single freeze–thaw cycle in the initial cycles; with the increase in number of freeze–thaw cycles, the integrity loss caused by a single cycle gradually decreases until it becomes a constant. At the same time, it can be seen from Table 2 and Table 3 that, with the increase in freeze–thaw cycles, the porosity continues to increase and the longitudinal wave velocity decreases. This implies certain connections between these indexes.
The change of porosity and the change in the longitudinal wave velocity by a single freeze–thaw cycle are expressed as follows:
For convenience of application, the relationship between Δn and the decay index λ and that between Δv and λ are investigated and illustrated in Figure 5 and Figure 6.
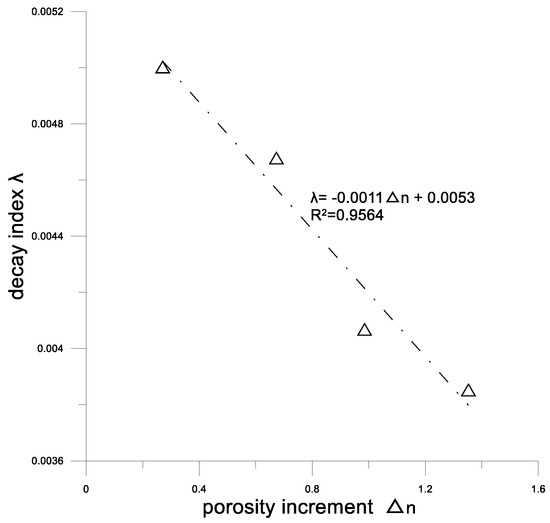
Figure 5.
Relationship between λ and porosity increment of fine sandstone.
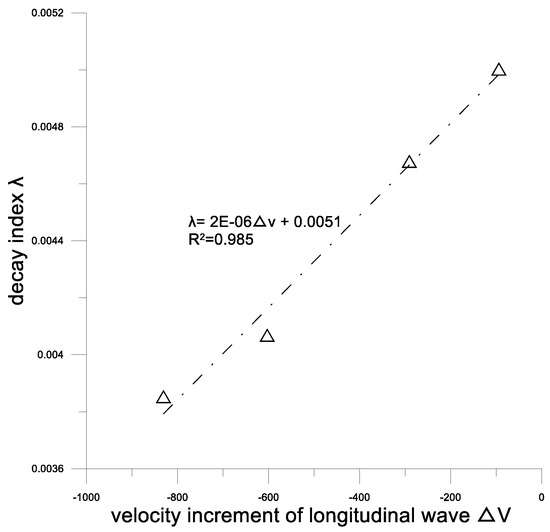
Figure 6.
Relationship between λ and increment of velocity of longitudinal wave.
It can be seen from the above fitting that there is a good fit in the relationship between decay index λ and the porosity increment as well as in the velocity increment of the longitudinal wave (R2 > 0.95), in contrast, λ and Δv have a better-fitting relationship (R2 > 0.98).
Substituting Equation (10) into the decay equation, respectively, using UCS to express the rock integrity, we obtain the following:
As for fine sandstone, the simple and easily measured variation quantity of velocity of the longitudinal wave can be substituted into Equation (11), and the UCS after certain freeze–thaw cycles can be obtained.
4. Conclusions
In our paper, freeze–thaw cycle tests were carried out on coarse sandstones and fine sandstones collected from the side slopes of Muli coal mine in Qinghai Province under saturated conditions. Their physical and mechanical properties, after a number of freeze–thaw cycles, were investigated. Based on the decay equation suggested by Mutlutür [20] and taking UCS as the integrity index, the rock integrity decay laws were analyzed. The following conclusions were obtained:
- (1)
- The porosity of fine sandstone and coarse sandstone continues to increase with the increase in the number of freeze–thaw cycles, while the velocity of the longitudinal waves of rocks of two kinds continues to decrease. Both indicate that the freeze–thaw functions can make the pores or micro-cracks in rocks continue to crack and expand;
- (2)
- Based on the uniaxial compressive testing results of coarse sandstones and fine sandstones, and in combination with previous studies, the rock integrity decay laws were analyzed. The results indicate that the decay index λ is not a constant value but changes with an increase in the number of freeze–thaw cycles. For the fine sandstone, λ gradually decrease with the increase in freeze–thaw cycles and finally tends to become a certain constant (λ = 0.00385~0.005); with the coarse sandstones, λ decreases at first and then increases (λ = 0.00376~0.00481);
- (3)
- Taking UCS as the integrity index, for the fine sandstone, there is a good fitting relationship between decay index λ and the porosity increment (R2 > 0.95) as well as between the velocity increment of the longitudinal wave (R2 > 0.98), λ can, then, be deduced by the velocity increment of the longitudinal wave, and by further calculating the integrity indices (UCS) subject to the number of different freeze–thaw cycles.
Author Contributions
Conceptualization, L.W. and W.Z.; methodology, L.W.; software, X.C.; validation, L.W., X.C. and W.Z.; formal analysis, L.W. and X.C.; investigation, Y.T. and S.X.; data curation, X.C.; writing—original draft preparation, L.W.; writing—review and editing, X.C. and W.Z.; supervision, W.Z.; project administration, S.X.; funding acquisition, L.W. and W.Z. All authors have read and agreed to the published version of the manuscript.
Funding
This research was funded by National Natural Science Foundation of China, grant number 42172314 and 42007264.
Data Availability Statement
Data available on request due to restrictions, e.g., privacy or ethics. Data presented in this study are available upon request from the corresponding author. The data are not publicly available to protect the privacy of the participants in this research.
Acknowledgments
The authors would like to extend their sincere thanks to CCTEG XI’AN Research Institute for providing the test site and test equipment.
Conflicts of Interest
The authors declare no conflict of interest.
References
- Sass, O. Spatial patterns of rockfall intensity in the northern Alps. Z. Geomorphol. Suppl. 2005, 138, 51–65. [Google Scholar]
- Stoffel, M.; Lièvre, I.; Conus, D.; Grichting, M.A.; Raetzo, H.; Gärtner, H.W.; Monbaron, M. 400 years of debris-flow activity and triggering weather conditions: Ritigraben, valais, switzerland. Arct. Antarct. Alp. Res. 2005, 37, 387–395. [Google Scholar] [CrossRef]
- Matsuoka, N.; Murton, J. Frost weathering: Recent advances and future directions. Permafr. Periglac. Process 2008, 19, 195–210. [Google Scholar] [CrossRef]
- Grossi, C.M.; Brimblecombe, P.; Harris, I. Predicting long term freeze-thaw risks on europe built heritage and archaeological sites in a changing climate. Sci. Total Environ. 2007, 377, 273. [Google Scholar] [CrossRef]
- Zhang, S.; Lai, Y.; Zhang, X.; Pu, Y.; Yu, W. Study on the damage propagation of surrounding rock from a cold-region tunnel under freeze–thaw cycle condition. Tunn. Undergr. Space Technol. 2004, 19, 295–302. [Google Scholar] [CrossRef]
- Mu, Y.; Ma, W.; Li, G.; Niu, F.; Liu, Y.; Mao, Y. Impacts of supra-permafrost water ponding and drainage on a railway embankment in continuous permafrost zone, the interior of the Qinghai-Tibet Plateau. Cold Reg. Sci. Technol. 2018, 154, 23–31. [Google Scholar] [CrossRef]
- Li, G.Y.; Hou, X.; Zhou, Y.; Ma, W.; Mu, Y.H.; Chen, D.; Tang, L.Y. Freeze-thaw resistance of eco-material stabilized loess. J. Mt. Sci. 2021, 18, 794–805. [Google Scholar] [CrossRef]
- Li, G.; Wang, F.; Ma, W.; Fortier, R.; Mu, Y.; Zhou, Z.; Cai, Y. Field observations of cooling performance of thermosyphons on permafrost under the China-Russia Crude Oil Pipeline. Appl. Therm. Eng. 2018, 141, 688–696. [Google Scholar] [CrossRef]
- Chen, Y.; Tan, L.; Xiao, N.; Liu, K.; Jia, P.; Zhang, W. The hydro-mechanical characteristics and micro-structure of loess enhanced by microbially induced carbonate precipitation. Geomech. Energy Environ. 2023, 34, 100469. [Google Scholar] [CrossRef]
- Inada, Y.; Yokota, K. Some studies of low temperature rock strength. Int. J. Rock Mech. Min. Sci. Geomech. Abstr. 1984, 21, 145–153. [Google Scholar] [CrossRef]
- Matsuoka, N. Mechanisms of rock breakdown by frost action: An experimental approach. Cold Reg. Sci. Technol. 1990, 17, 253–270. [Google Scholar] [CrossRef]
- Xu, G.; Liu, Q. Analysis of mechanism of rock failure due to freeze-thaw cycling and mechanical testing study on frozen-thawed rocks. Chin. J. Rock Mech. Eng. 2005, 24, 3077–3082. [Google Scholar]
- Takarli, M.; Prince, W.; Siddique, R. Damage in granite under heating/cooling cycles and water freeze–thaw condition. Int. J. Rock Mech. Min. Sci. 2008, 45, 1164–1175. [Google Scholar] [CrossRef]
- Liu, H.; Niu, F.; Xu, Z.; Lin, Z.; Xu, J. Acoustic experimental study of two types of rock from the tibetan plateau under the condition of freeze-thaw cycles. J. Glaciol. 2011, 33, 557–563. [Google Scholar]
- Molina, E.; Cultrone, G.; Sebastián, E.; Alonso, F.J.; Carrizo, L.; Gisbert, J.; Buj, O. The pore system 1 of sedimentary rocks as a key factor in the durability of building materials. Eng. Geol. 2011, 118, 110–121. [Google Scholar] [CrossRef]
- Lin, Z.H.; Niu, F.; Liu, H.; Lu, J. Influences of freezing-thawing cycles on physico-mechanical properties of rocks of embankment revetments in permafrost regions. Rock Soil Mech. 2011, 32, 1369–1376. [Google Scholar]
- Ruedrich, J.; Kirchner, D.; Siegesmund, S. Physical weathering of building stones induced by freeze–thaw action: A laboratory long-term study. Environ. Earth Sci. 2011, 63, 1573–1586. [Google Scholar] [CrossRef]
- Liping, W.; Ning, L.; Jilin, Q.; Yanzhe, T.; Shuanhai, X. A study on the physical index change and triaxial compression test of intact hard rock subjected to freeze-thaw cycles. Cold Reg. Sci. Technol. 2019, 160, 39–47. [Google Scholar] [CrossRef]
- Jiang, W.; Lai, Y.; Yu, F.; Ma, Q.; Jiang, H. Mechanical properties investigation and damage constitutive models of red sandstone subjected to freeze-thaw cycles. Cold Reg. Sci. Technol. 2023, 207, 103776. [Google Scholar] [CrossRef]
- Mutlutürk, M.; Altindag, R.; Türk, G. A decay function model for the integrity loss of rock when subjected to recurrent cycles of freezing–thawing and heating–cooling. Int. J. Rock Mech. Min. Sci. 2004, 41, 237–244. [Google Scholar] [CrossRef]
- Akin, M.; Özsan, A. Evaluation of the long-term durability of yellow travertine using accelerated weathering tests. Bull. Eng. Geol. Environ. 2011, 70, 101–114. [Google Scholar] [CrossRef]
- Yavuz, H. Effect of freeze–thaw and thermal shock weathering on the physical and mechanical properties of an andesite stone. Bull. Eng. Geol. Environ. 2011, 70, 187–192. [Google Scholar] [CrossRef]
- Jamshidi, A.; Nikudel, M.R.; Khamehchiyan, M. Predicting the long-term durability of building stones against freeze–thaw using a decay function model. Cold Reg. Sci. Technol. 2013, 92, 29–36. [Google Scholar] [CrossRef]
- Jamshidi, A.; Nikudel, M.R.; Khamehchiyan, M. A novel physico-mechanical parameter for estimating the mechanical strength of travertines after a freeze–thaw test. Bull. Braz. Math. Soc. 2017, 76, 181–190. [Google Scholar] [CrossRef]
- Ghobadi, M.H.; Babazadeh, R. Experimental studies on the effects of cyclic freezing–thawing, salt crystallization, and thermal shock on the physical and mechanical characteristics of selected sandstones. Rock Mech. Rock Eng. 2015, 48, 1001–1016. [Google Scholar] [CrossRef]
- Ghobadi, M.H.; Beydokhti, A.R.T.; Nikudel, M.R.; Asiabanha, A.; Karakus, M. The effect of freeze–thaw process on the physical and mechanical properties of tuff. Environ. Earth Sci. 2016, 75, 846. [Google Scholar] [CrossRef]
- Wang, P.; Xu, J.; Liu, S.; Liu, S.; Wang, H. A prediction model for the dynamic mechanical degradation of sedimentary rock after a long-term freeze-thaw weathering: Considering the strain-rate effect. Cold Reg. Sci. Technol. 2016, 131, 16–23. [Google Scholar] [CrossRef]
- Ke, B.; Zhou, K.; Xu, C.; Deng, H.; Li, J.; Bin, F. Dynamic mechanical property deterioration model of sandstone caused by freeze–thaw weathering. Rock Mech. Rock Eng. 2018, 51, 2791–2804. [Google Scholar] [CrossRef]
- Feng, Q.; Jin, J.; Zhang, S.; Liu, W.; Yang, X.; Li, W. Study on a damage model and uniaxial compression simulation method of frozen–thawed rock. Rock Mech. Rock Eng. 2022, 55, 187–211. [Google Scholar] [CrossRef]
- Hou, C.; Jin, X.; He, J.; Li, H. Experimental studies on the pore structure and mechanical properties of anhydrite rock under freeze-thaw cycles. J. Rock Mech. Geotech. Eng. 2022, 14, 781–797. [Google Scholar] [CrossRef]
- Liu, X.; Liu, Y.; Dai, F.; Yan, Z. Tensile mechanical behavior and fracture characteristics of sandstone exposed to freeze-thaw treatment and dynamic loading. Int. J. Mech. Sci. 2022, 226, 107405. [Google Scholar] [CrossRef]
- Yavuz, H.; Altindag, R.; Sarac, S.; Ugur, I.; Sengun, N. Estimating the index properties of deteriorated carbonate rocks due to freeze–thaw and thermal shock weathering. Int. J. Rock Mech. Min. Sci. 2006, 43, 767–775. [Google Scholar] [CrossRef]
- Huang, S.; He, Y.; Yu, S.; Cai, C. Experimental investigation and prediction model for UCS loss of unsaturated sandstones under freeze-thaw action. Int. J. Min. Sci. Technol. 2022, 32, 41–49. [Google Scholar] [CrossRef]
- Hallet, B.; Walder, J.S.; Stubbs, C.W. Weathering by segregation ice growth in microcracks at sustained subzero temperatures: Verification from an experimental study using acoustic emissions. Permafr. Periglac. Process 1991, 2, 283–300. [Google Scholar] [CrossRef]
- GB/T 50266-2013; Standard for Test Methods of Engineering Rock Mass. China Jihua Press: Beijing, China, 2013.
- JTG E41-2005; Test Methods of Rock for Highway Engineering. China Communications Press: Beijing, China, 2005.
- Walder, J.; Hallet, B. A theoretical model of the fracture of rock during freezing. Geol. Soc. Am. Bull 1985, 96, 336. [Google Scholar] [CrossRef]
- Murton, J.B.; Coutard, J.P.; Lautridou, J.P.; Ozouf, J.C.; Robinson, D.A.; Williams, R.B.; Guillemet, G.; Simmons, P. Experimental design for a pilot study on bedrock weathering near the permafrost table. Earth Surf. Process. Landf. 2000, 25, 1281–1294. [Google Scholar] [CrossRef]
- Murton, J.B.; Peterson, R.; Ozouf, J.C. Bedrock fracture by ice segregation in cold regions. Science 2006, 314, 1127–1129. [Google Scholar] [CrossRef]
- Rempel, A.W.; Wettlaufer, J.S.; Grae Worster, M. Premelting dynamics in a continuum model of frost heave. J. Fluid Mech. 2004, 498, 227–244. [Google Scholar] [CrossRef]
- Dash, J.G.; Rempel, A.W.; Wettlaufer, J.S. The physics of premelted ice and its geophysical consequences. Rev. Mod. Phys. 2006, 78, 695–741. [Google Scholar] [CrossRef]
- Tan, X.; Chen, W.; Yang, J.; Cao, J. Laboratory investigations on the mechanical properties degradation of granite under freeze–thaw cycles. Cold Reg. Sci. Technol. 2011, 68, 130–138. [Google Scholar] [CrossRef]


Disclaimer/Publisher’s Note: The statements, opinions and data contained in all publications are solely those of the individual author(s) and contributor(s) and not of MDPI and/or the editor(s). MDPI and/or the editor(s) disclaim responsibility for any injury to people or property resulting from any ideas, methods, instructions or products referred to in the content. |
© 2023 by the authors. Licensee MDPI, Basel, Switzerland. This article is an open access article distributed under the terms and conditions of the Creative Commons Attribution (CC BY) license (https://creativecommons.org/licenses/by/4.0/).