Article

Optimizing the Powder Metallurgy Parameters to Enhance the Mechanical Properties of Al-4Cu/xAl2O3 Composites Using Machine Learning and Response Surface Approaches

1
Mechanical Engineering Department, Faculty of Engineering, Suez Canal University, Ismailia 41522, Egypt
2
Department of Electrical Engineering, College of Engineering, Qassim University, Unaizah 56452, Saudi Arabia
3
Department of Mechanical Engineering, College of Engineering, Qassim University, Unaizah 56452, Saudi Arabia
4
Department of Production Engineering and Mechanical Design, Port Said University, Port Fouad 42526, Egypt
5
Center of Excellence for Nanomaterials for Clean Energy Applications, King Abdulaziz City for Science and Technology (KACST), Riyadh 12354, Saudi Arabia
6
Department of Chemistry, College of Science, Princess Nourah bint Abdulrahman University, Riyadh 11671, Saudi Arabia
*
Authors to whom correspondence should be addressed.
Appl. Sci. 2023, 13(13), 7483; https://doi.org/10.3390/app13137483
Submission received: 21 May 2023 / Revised: 13 June 2023 / Accepted: 19 June 2023 / Published: 25 June 2023

Abstract

:
This study comprehensively investigates the impact of various parameters on aluminum matrix composites (AMCs) fabricated using the powder metallurgy (PM) technique. An Al-Cu matrix composite (2xxx series) was employed in the current study, and Al2O3 was used as a reinforcement. The performance evaluation of the Al-4Cu/Al2O3 composite involved analyzing the influence of the Al2O3 weight percent (wt. %), the height-to-diameter ratio (H/D) of the compacted samples, and the compaction pressure. Different concentrations of the Al2O3 reinforcement, namely 0%, 2.5%, 5.0%, 7.5%, and 10% by weight, were utilized, while the compaction process was conducted for one hour under varying pressures of 500, 600, 700, 800, and 900 MPa. The compacted Al-4Cu/Al2O3 composites were in the form of cylindrical discs with a fixed diameter of 20 mm and varying H/D ratios of 0.75, 1.0, 1.25, 1.5, and 2.0. Moreover, the machine learning (ML), design of experiment (DOE), response surface methodology (RSM), genetic algorithm (GA), and hybrid DOE-GA methodologies were utilized to thoroughly investigate the physical properties, such as the relative density (RD), as well as the mechanical properties, including the hardness distribution, fracture strain, yield strength, and compression strength. Subsequently, different statistical analysis approaches, including analysis of variance (ANOVA), 3D response surface plots, and ML approaches, were employed to predict the output responses and optimize the input variables. The optimal combination of variables that demonstrated significant improvements in the RD, fracture strain, hardness distribution, yield strength, and compression strength of the Al-4Cu/Al2O3 composite was determined using the RSM, GA, and hybrid DOE-GA approaches. Furthermore, the ML and RSM models were validated, and their accuracy was evaluated and compared, revealing close agreement with the experimental results.

1. Introduction

In the field of material science, one of the most important challenges is to identify potential correlations among processing, structure, characteristics, and performance [1,2]. Therefore, understanding these relationships in a new approach results in it being embraced by the engineering community and materials science. In the last few decades, there has been an urgent need to reduce the energy consumption of aircraft and vehicles by reducing the weight of each component. Consequently, metal matrix composites (MMCs) have recently replaced conventional engineering materials due to their promising properties [3,4]. Aluminum matrix composites (AMCs) are MMCs that have superior advantages, such as a high strength-to-weight ratio, excellent weldability, good corrosion, fatigue resistance, and wear resistance [5,6,7,8,9,10,11,12]. AMCs, especially Al–Cu matrix composites (2xxx series), fabricated by powder metallurgy (PM), are widely employed in the automotive and aerospace industries because of their low density and the material savings achieved by using near-net-shape processing characteristics [13,14,15]. Moreover, Al-4Cu AMCs produced by PM provide extraordinary sintering control. Therefore, Al-4Cu is the root of the majority of commercial AMCs produced by PM [16]. Numerous reinforcements, such as Al2O3 [17], TiC [18], SiC, and B4C graphene [19], have been alloyed in AMCs [20]. Al2O3 has significantly improved the strength of Al-4Cu alloy by realizing the approximate theoretical sintering density [21]. However, this required trial-and-error experiments, so time was consumed.
Utilizing machine learning (ML) techniques, such as predictive analytics, it is possible to anticipate the presence of a particular attribute based on the components, processing, and structure [22,23]. Nonetheless, inverse models are regarded as an optimizing issue in which the outcome or the specified attributes are recommended to be minimized or maximized as a function of composition or structural factors [23,24]. In addition, various machine learning approaches are employed to shed light on the intricate network of processing, structural attributes, and performing interactions that define the heart of material evolution depending on the chemistry, fundamental physics, and the engineering of materials [25,26]. In the realm of metal manufacturing, ML approaches have a vast capacity for the creation of either inverse or forward models. Typical uses involve process optimization, flaw detection, and microstructure characterization, as well as attribute estimation of the end output [27,28,29]. Because of the widespread incorporation of Al2O3, TiC, SiC, and B4C particles into the metallic matrix, ML has already been extensively applied in MMCs [24,30]. The mechanical properties of AMCs with various additions, including Al/Al2O3 [31,32,33], AA2219/Al2O3/TiC [34], A356/Al2O3 [35], A356/B4C [36], AA6061/Al2O3/SiC [37], and Al-Si-Mg/Al2O3/SiC [38,39], have all been predicted using ML. Adding reinforcement particles to the base metal makes it more complicated. Realizing the connections among variables such as the reinforcement volume proportion and particle size, alloy chemical structure, interfacial bonding, processing and post-processing factors, and final product mechanical qualities is challenging as a result.
Other statistical techniques besides ML, such as response surface methodology, have been extensively adopted in the literature when dealing with AMCs. The development and further exploration of pertinent mathematical ideas are essential requirements for today’s data modeling. In previous research, response surface methodology, often known as RSM, has been utilized to enhance PM processes, notably those involving AMCs. Tests can be replicated and improved upon with the help of RSM, which is a collection of empirically based statistical and mathematical methodologies [40,41,42,43]. Moreover, genetic algorithms (GAs) can be utilized in optimization to steer clear of reaching local optimum answers. GA methodology is extensively utilized in a broad range of business and research domains [44,45]. In addition to producing the most effective algorithms for each individual set, the convergence of the findings is also ensured by GAs, which make use of certain criteria in order to arrive at a solution that strives to achieve a global minimum for a fitness function [46,47,48,49].
The RSM and artificial neural network (ANN) techniques were utilized in a study that Alam et al. [50] conducted to examine the impact of Al/SiC composites on the microhardness (VHN). AMCs that were strengthened with an x-weight percentage of SiC were produced using PM. The values for x varied, with 5, 7.5, and 10 microparticles. The scientists ended up deciding that the composite with a reinforcement ratio of 7.5% exhibited a superior sintered density and Vickers microhardness because of the uniform dispersion of the filler particles inside the Al matrix, which did not include any pores. In addition to this, the findings indicate that the ANN approach achieved more precise results than the RSM method. The authors of the Devaneyan et al. [51] study showed the mechanical behavior of Al-7075 that was reinforced with SiC and TiC using the PM method. SiC and TiC were mixed together with a variety of different weight proportions after the design matrix was generated with RSM. The scientists came to the conclusion that the mechanical properties of the outcome were improved due to the content of the composite, which consisted of 90% Al 7075, 4% TiC, and 8% SiC.
Therefore, the aim of this study was to conduct a comprehensive investigation into the modeling of various parameters’ effects on AMCs, specifically Al-4Cu alloy. To assess the performance of the resulting Al-4Cu composites, Al2O3 was utilized as a reinforcement. The experimental investigations considered the following parameters: the weight percentage of the Al2O3 reinforcement, the H/D of the compacted discs, and the compaction pressure values. Moreover, the DOE, ML, RSM, GA, and DOE-GA methodologies are utilized as theoretical investigations. The physical responses, such as the RD and mechanical property responses, including the hardness distribution, yield and compressive strength, and fracture strain, are compared to the experimental results.

2. Methodology

2.1. Experimental Design

In the current study, RSM was utilized to design the experimental conditions. The process variables were the Al2O3 wt.%, the H/D value of the compacted discs, and the compaction pressure. The experimental design of the studied variables is illustrated in Table 1. A total of 24 runs were performed, and several responses (relative density, hardness, yield stress, compressive strength, and fracture strength) were examined.

2.2. Experimental Procedure

The AMCs in the present study consisted of blended Al-4Cu elements in addition to fine reinforcement particles of Al2O3. Al powders (average particle size of ≈ 25 μm, 99.9% purity) were mixed with 4% wt. of Cu powders (average particles size of ≈ 10 μm, 99.9% purity) and Al2O3 powders (average particles size of 10 μm, 99.99% purity) in a glove box in a vacuum ambient. The Al2O3 reinforcement was utilized with different concentrations (2.5, 5.0, 7.5, and 10 wt.%) to prepare the studied composites. Then, the powders were blended for a duration of three hours using a tubular blender at a rotational speed of 96 rpm. The blended powders were cold-compacted in a hardened steel (W302) die using a hydraulic press. The compacted Al-4Cu/Al2O3 composites were in the form of cylindrical discs, with a diameter of 20 mm and varying height-to-diameter (H/D) ratios of 0.75, 1.0, 1.25, 1.5, and 2.0. The compaction processes were performed for 60 min under varying pressures (500, 600, 700, 800, and 900 MPa). Subsequently, the sintering processes were achieved by heating the compacted discs for 2 h at 560 °C, followed by furnace cooling. Afterward, the aging process was carried out for 2 h at 160 °C, followed by air cooling. Density measurements were performed by a digital densitometer using the Archimedean principle. However, the theoretical densities were calculated using the mixture rule. Moreover, the discs’ cross-section hardness values were measured using a Vickers hardness tester under a 10 N applied load and a dwell time of 15 s. Additionally, compression tests were conducted at room temperature on a 500 KN universal testing machine at a 1 × 10⁻³ S−1 strain rate. Accordingly, the limitation of this study ranged between an alumina percentage of 0 and 10 wt.%, the compaction pressure ranged between 500 and 900 MPa, and the H/D ratio ranged between 0.75 and 2.

2.3. Machine Learning (ML)

2.3.1. Linear Regression

Linear regression is a commonly used machine learning technique that is also one of the most straightforward solutions to any forecasting problem. It is useful for making accurate forecasts of numerical or physical parameters. It demonstrates a linear relationship, also referred to as a regression, between at least one independent parameter and a dependent parameter by displaying their connection in a straight line. A linear association of the weighted input parameters (also known as predictors), x1, x2, …, and xn, and their interactions is used to predict a goal parameter Y. The weights (wi) and error terms (b) are selected in such a way that the mean squared error (MSE) of the training data is minimized (Equation (1)).
Y = w 0 + n = 1 N w n x n + b  
Linear regression can be either simple, where just one independent parameter is used to estimate the dependent parameter, or multiple, where numerous independent parameters are used to estimate the dependent parameter [52,53].

2.3.2. Regression Trees

Regression trees are a type of decision tree that segments the dataset into subsets, with the intention of predicting the final output response. As the objective variables in the tree’s leaves, these decision trees make use of continuous values rather than class labels (decision branches). Because it makes use of improved split decisions and adequate halting rules, the regression tree approach allows for decisions to be expressed in an effective manner, likely occurrences to be located, and prospective repercussions to be uncovered [28].

2.3.3. Random Forest Regression

Random forest regression is a set of supervised learning techniques used in ML and predictive modeling for classification and regression. The optimal output is determined by taking the mode (the most common value in the collection of decision tree outputs) of the classes or the mean forecast and applying them together.
Random forest regression is a statistical method that splits a dataset into two sections: a training set and a test set. The next step is to randomly select some samples from the training set. Decision trees can be applied to all of the samples to find the optimal way to divide each choice into two daughters. The voting for each prediction result will then be repeated in the final stage, and the outcome will be determined by whatever prediction result received the most votes [54].

2.3.4. Gaussian Process Regression

Several fields, including chemistry and materials science, have benefited from the increased attention paid to the Gaussian process regression technique in recent years. Recent advancements in ML can be traced back to the Bayesian regression method for nonparametric data, known as the Gaussian process regression approach. The approach generates estimates of prediction error and works well on limited datasets, to name just two of its many benefits [27].

2.3.5. Artificial Neural Networks

The back-propagation neural network (BPNN) is a type of commonly known artificial neural network (ANN). In order for the fundamental BPNN design to function properly, there must be input, hidden, and output layers. The data obtained from outside sources are transferred to the input layer, where they are then processed by the hidden levels before being transmitted to a receptor located outside the system. The incoming signals’ accuracy is improved with the use of weight factors W i j , which are networks of weight. The aggregate of the altered signals is then modified through the application of an exchange function that has a sigmoidal form [55,56,57]. The outcome of a regression ANN is a single node, denoted by the letter (y), which is determined by the activation function f and is derived from any node (j) that has been active in the past using the following Equation (2):
y = f i = 1 m W ij x i + b j
where x i represents the input to the layers, b j represents the bias term that is given to the node, and W i j is the weight of the path that can be taken between any two nodes (i and j) in the network layer. The neural network that was used for the AMCs can be seen with its input and output settings in Figure 1. Equation (3) was used to determine the amount of error that exists between the experimental data and the expected values for AMC responses.
Difference   error   % = Target Output Target × 100
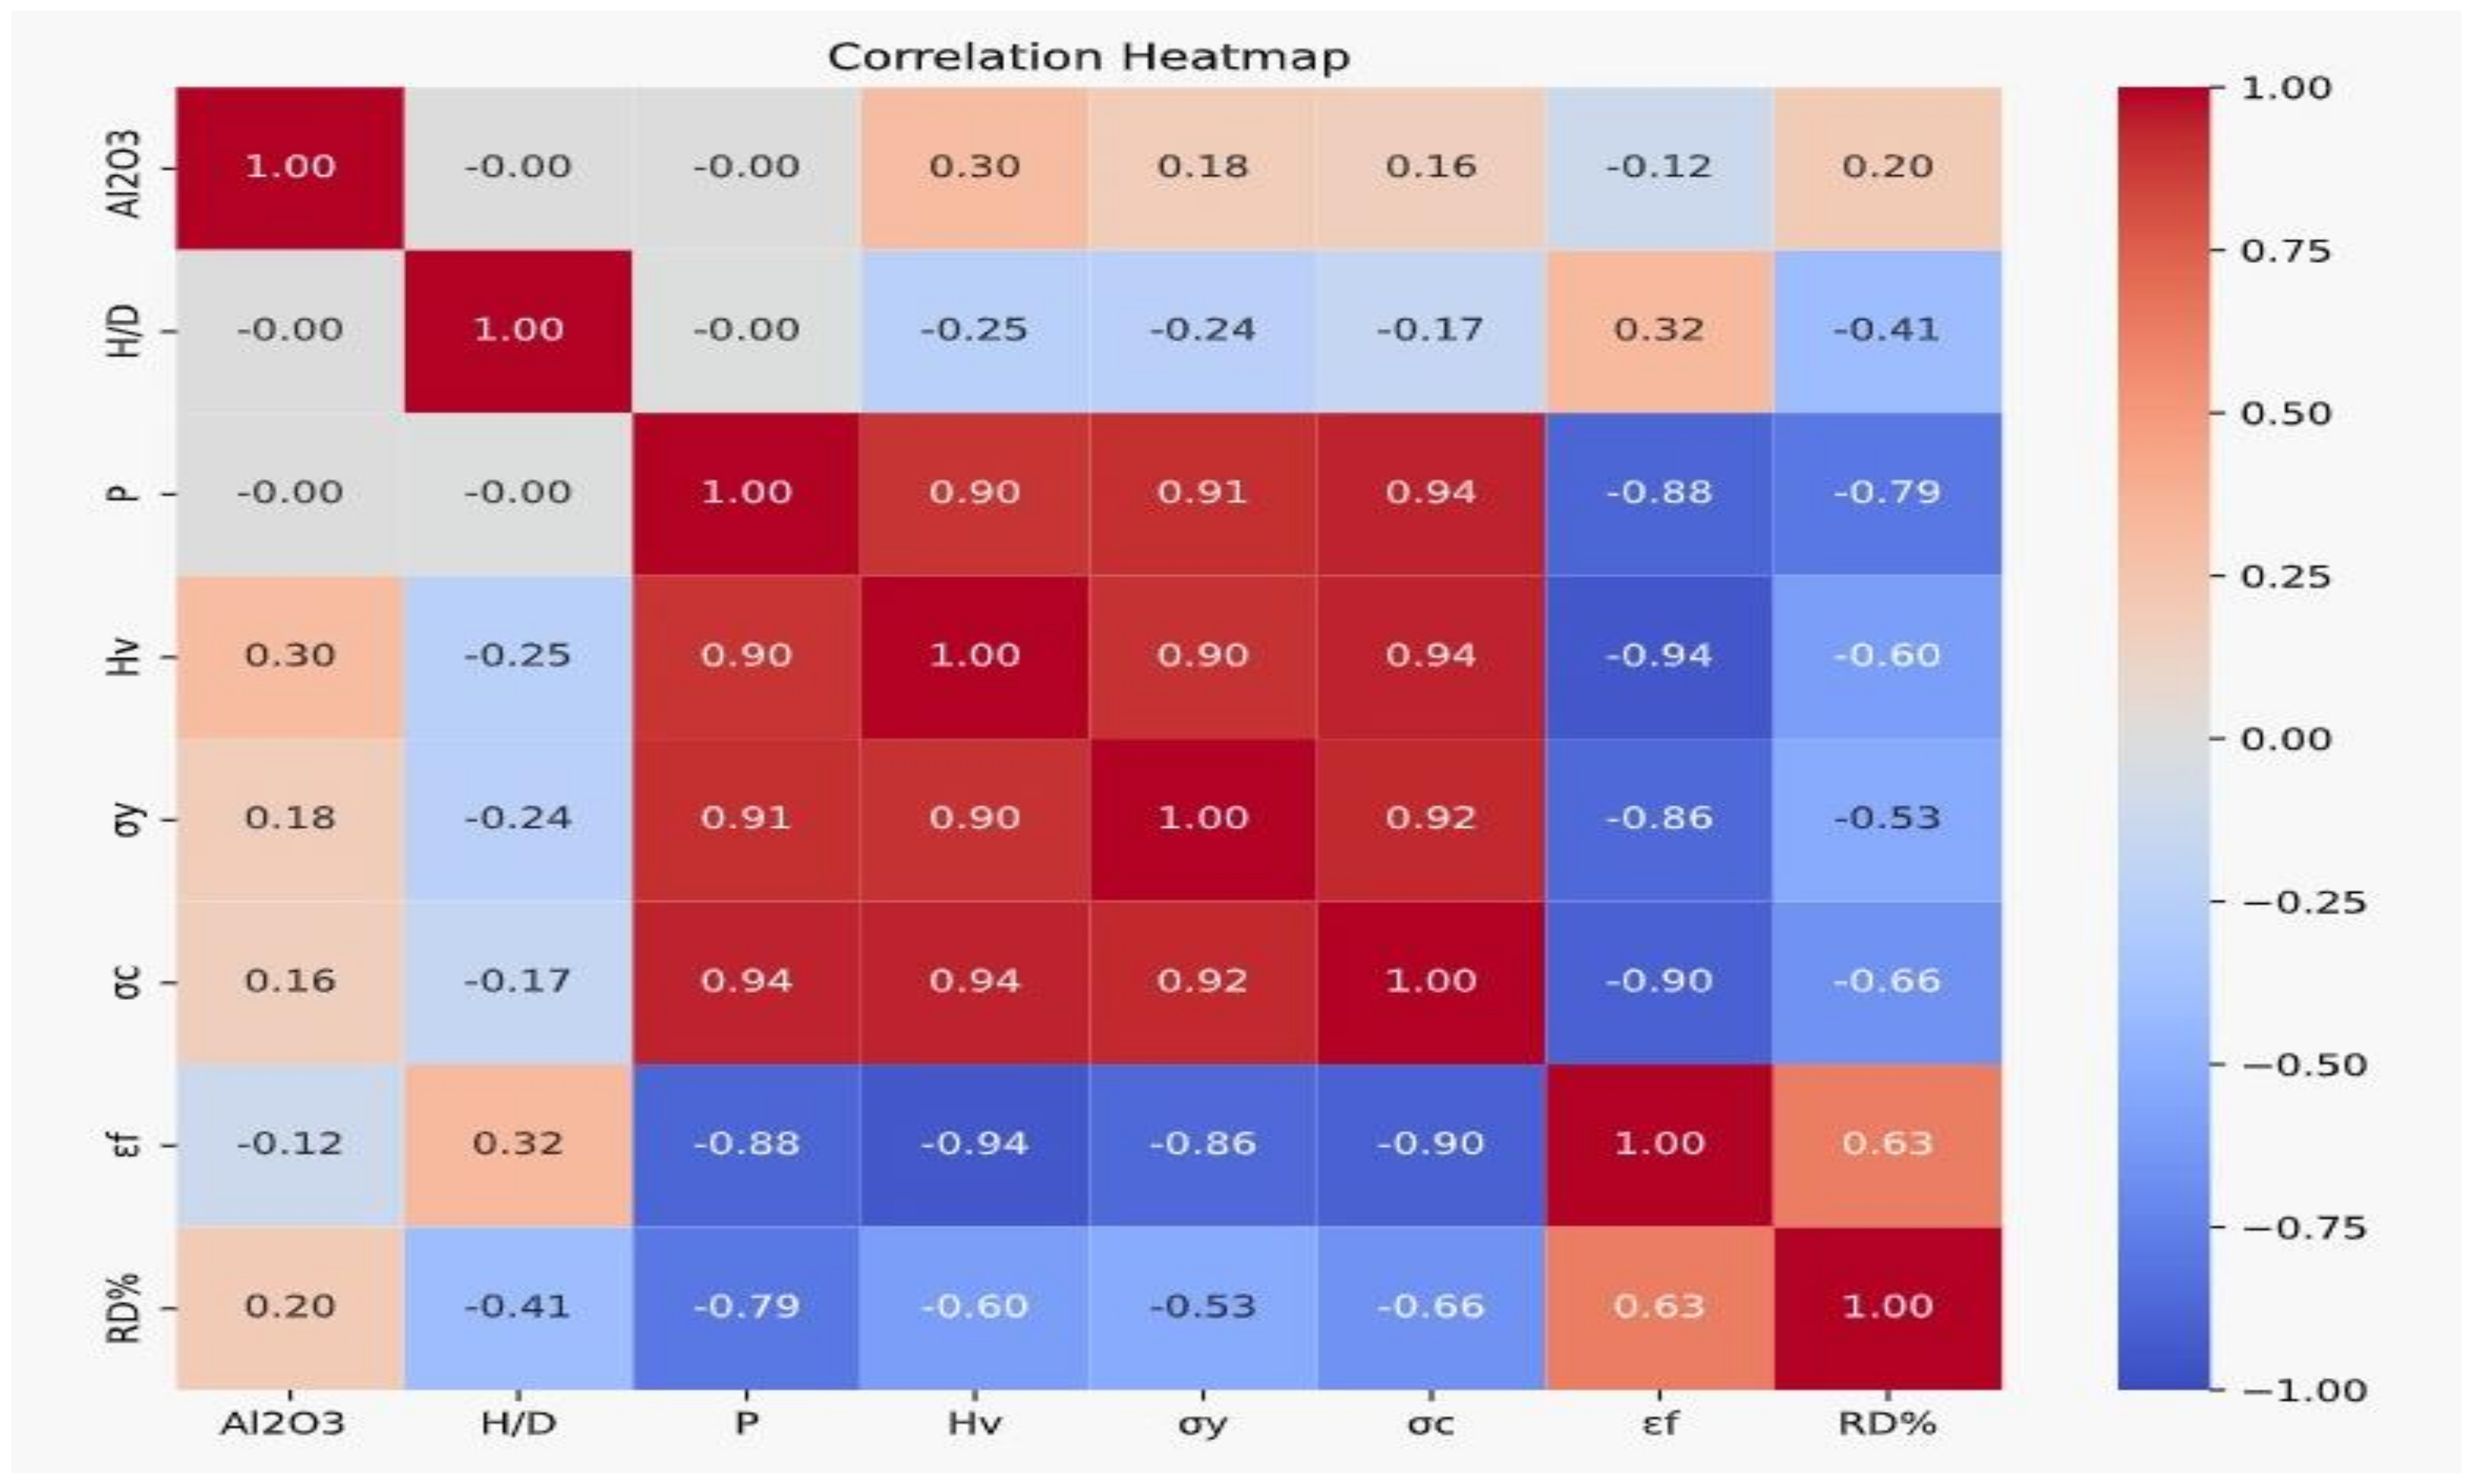
The graph of the correlation between the input factors and the output variables is shown in Figure 2. The correlation coefficients of the input data matrix are displayed for each of the several sets of variables. Every off-diagonal subplot is a scatter plot with two variables and a least-squares reference line. The slope of this line is equal to the correlation coefficient that was provided. This number is derived from an estimate of the Pearson coefficient, which is a metric that determines the degree to which two sets of data are linearly correlated with one another. Assuming that the two different sets of data are related in a linear fashion, the Pearson correlation coefficient, denoted by the symbol ρ(x,y), for this graph can be determined as follows:
ρ x , y = 1 N 1 i = 1 N x i μ x σ x   y i μ y σ y  
where µx, µy and σx, σy are the mean and standard deviation of the variables x and y, respectively. The value that represents the correlation coefficient perpetually falls between −1 and 1. The chart has a diagonal symmetry, and the values that are positive for the two variables indicate an upward trend, while the values that are negative signal a descending inclination. A strong correlation is often indicated by coefficients whose values are close to or equal to 1, whereas a weak correlation is typically indicated by coefficients whose values are close to or equal to 0. The correlation study can be used to obtain an initial idea of the weights assigned to each input feature, as well as the significance of those features in the process of creating the prediction model. Bar charts display the data distribution for each variable in the chart as opposed to showing the correlation coefficient between each variable, which is always 1.
The correlation analysis in Figure 2 shows that the wt. % of Al2O3 had a positive correlation with the hardness, whereas the H/D was negatively correlated with the RD%, with a value of 0.41, and positively correlated with the fracture strain, with a value of 0.32. On the other hand, the pressure shows a tremendously high positive correlation with the compression strength, yield strength, and hardness, with values of 0.94, 0.91, and 0.9, respectively. Moreover, the pressure depicts a clear negative correlation with the RD% and fracture strain, with values of 0.79 and 0.88.

2.4. Statistical Analysis and Regression Model

Analyzing the experimental data (Appendix A; Table A1), collected for this research with analysis of variance (ANOVA), was accomplished with the assistance of the Design Expert computer program (version 13.0.5). The goal of this analysis was to establish which input variables had the largest effect on the response variables, specifically the RD, hardness, and compression properties. The results of the ANOVA are presented in Table 2, which include the F-value, the p-value, the lack of fit, the sufficient precision, the adjusted R2, and the predicted R2 at a confidence level of 95%. All of the results had p-values that were lower than 0.05, which suggests that the independent parameters, individual model coefficients, and interaction terms all had a significant influence on the responses. These data suggest that the models that were anticipated were adequate. It was revealed that the weight percentage of the Al2O3 was the most significant factor in all of the responses. This was followed by the relative H/D and the pressure value. The signal-to-noise ratio (S/N ratio) was computed with “adequate precision” in order to determine whether or not the model was viable. The obtained ratio was greater than four, which indicates that the model was usable in navigating the design space.
In order to model the output responses, the interactions among the independent variables and a wide variety of regression transformation forms were examined. The degree of correlation that existed between the input parameters and the output responses was analyzed using a second-order polynomial regression model. Models created in an experimental study are statistically significant and can be used to predict the outcome responses when their adjusted coefficient of determination (adjusted R2) and predicted coefficient of determination (predicted R2) are close to 1 and the adjusted R2 values are within or close to 0.2 of the predicted R2 [58], as was the case in this study.
Process optimization was established to identify the ideal parameter combination for AMCs for the intended responses based on a thorough analysis of each independent variable. The values of the AMC parameters and responses are shown for all RSM results as red dots and blue ones, respectively, as depicted in Figures 6, 11, and 18. A genetic algorithm (GA) was used to identify the best feasible combination of the AMC’s independent variables that resulted in the material’s maximum RD, hardness, and mechanical properties. To improve the results of the GA, a hybrid of the design of experiments and the GA (DOE-GA) was applied.

3. Results and Discussion

3.1. Relative Density (RD)

As tabulated in Table A1 (Appendix A), the RD of the cold-compacted Al-4Cu/(Al2O3)x at different processing parameters after sintering was experimentally measured. It was revealed that increasing the compaction pressure from 500 MPa to 900 MPa and additionally decreasing the H/D value from 2 to 0.75 resulted in a significant increase in the RD. However, increasing the wt.% of the Al2O3 showed a different performance.
For Al/4Cu at an H/D = 1.5, increasing the compaction pressure up to 500 MPa enhanced the RD to 85.27%. Increasing the pressure up to 600 MPa resulted in an RD increase of 0.23%. A further compaction pressure increases up to 900 MPa resulted in a 0.2% increase in the RD compared to 600 MPa. However, for an H/D = 1.25, the RD was 88.96% at a compaction pressure of 500 MPa, and further increases in the compaction pressure up to 600 and 900 MPa resulted in increases in the RD of 0.04% and 0.067%, respectively. Additionally, a decrease in the H/D to 1 compacted under 500 MPa caused the RD to increase to 89.85%, and increases in the compaction pressure to 600 and 900 MPa led the RD to increase by 0.05% and 0.17%, respectively. A further decrease in the H/D to 0.75 significantly increased the RD to 90.3% as the compaction pressure increased to 600 MPa. Moreover, cold compaction under a pressure of 900 MPa resulted in a further increase of 0.23% in the RD compared to that at 600 MPa.
However, strengthening the Al-4Cu with a 2.5 wt.% of Al2O3 resulted in an increase in the RD to 90.45% at 600 MPa and an additional increase of 0.266% when compacted under 900 MPa compared to 600 MPa. In addition, the RD reached 91.44% and ~92% with a further increase in the Al2O3 to 5% compacted under 600 MPa and 900 MPa, respectively. Furthermore, increasing the wt.% of Al2O3 to 7.5 and 10% under a compaction pressure of 600 MPa resulted in the RD decreasing to 90.27 and 89.67%, respectively.
The RD of the studied Al-Cu/(Al2O3)x was increased (up to 5 Al2O3 wt.%), then decreased. Thus, a reduction in the porosity occurred at Al2O3 up to 5 wt.%, accompanied by a further rise with the Al2O3 increase, which can be attributed to the uneven dispersion of the Al2O3 powder in the Al-4Cu matrix, in good agreement with [59]. Therefore, additional interparticle friction and agglomeration impeded the particles’ rearrangement. The Al2O3 uniform embedding and dispersal were limited to the 5 wt.% addition of Al2O3 because of Al2O3 particle agglomeration, which delimited the contact area amongst the matrix particles, restricted the rearrangement of particles, and prevented the Al2O3 from being sufficiently absorbed into the Al-4Cu powders.

3.1.1. Machine Learning Prediction Models of RD

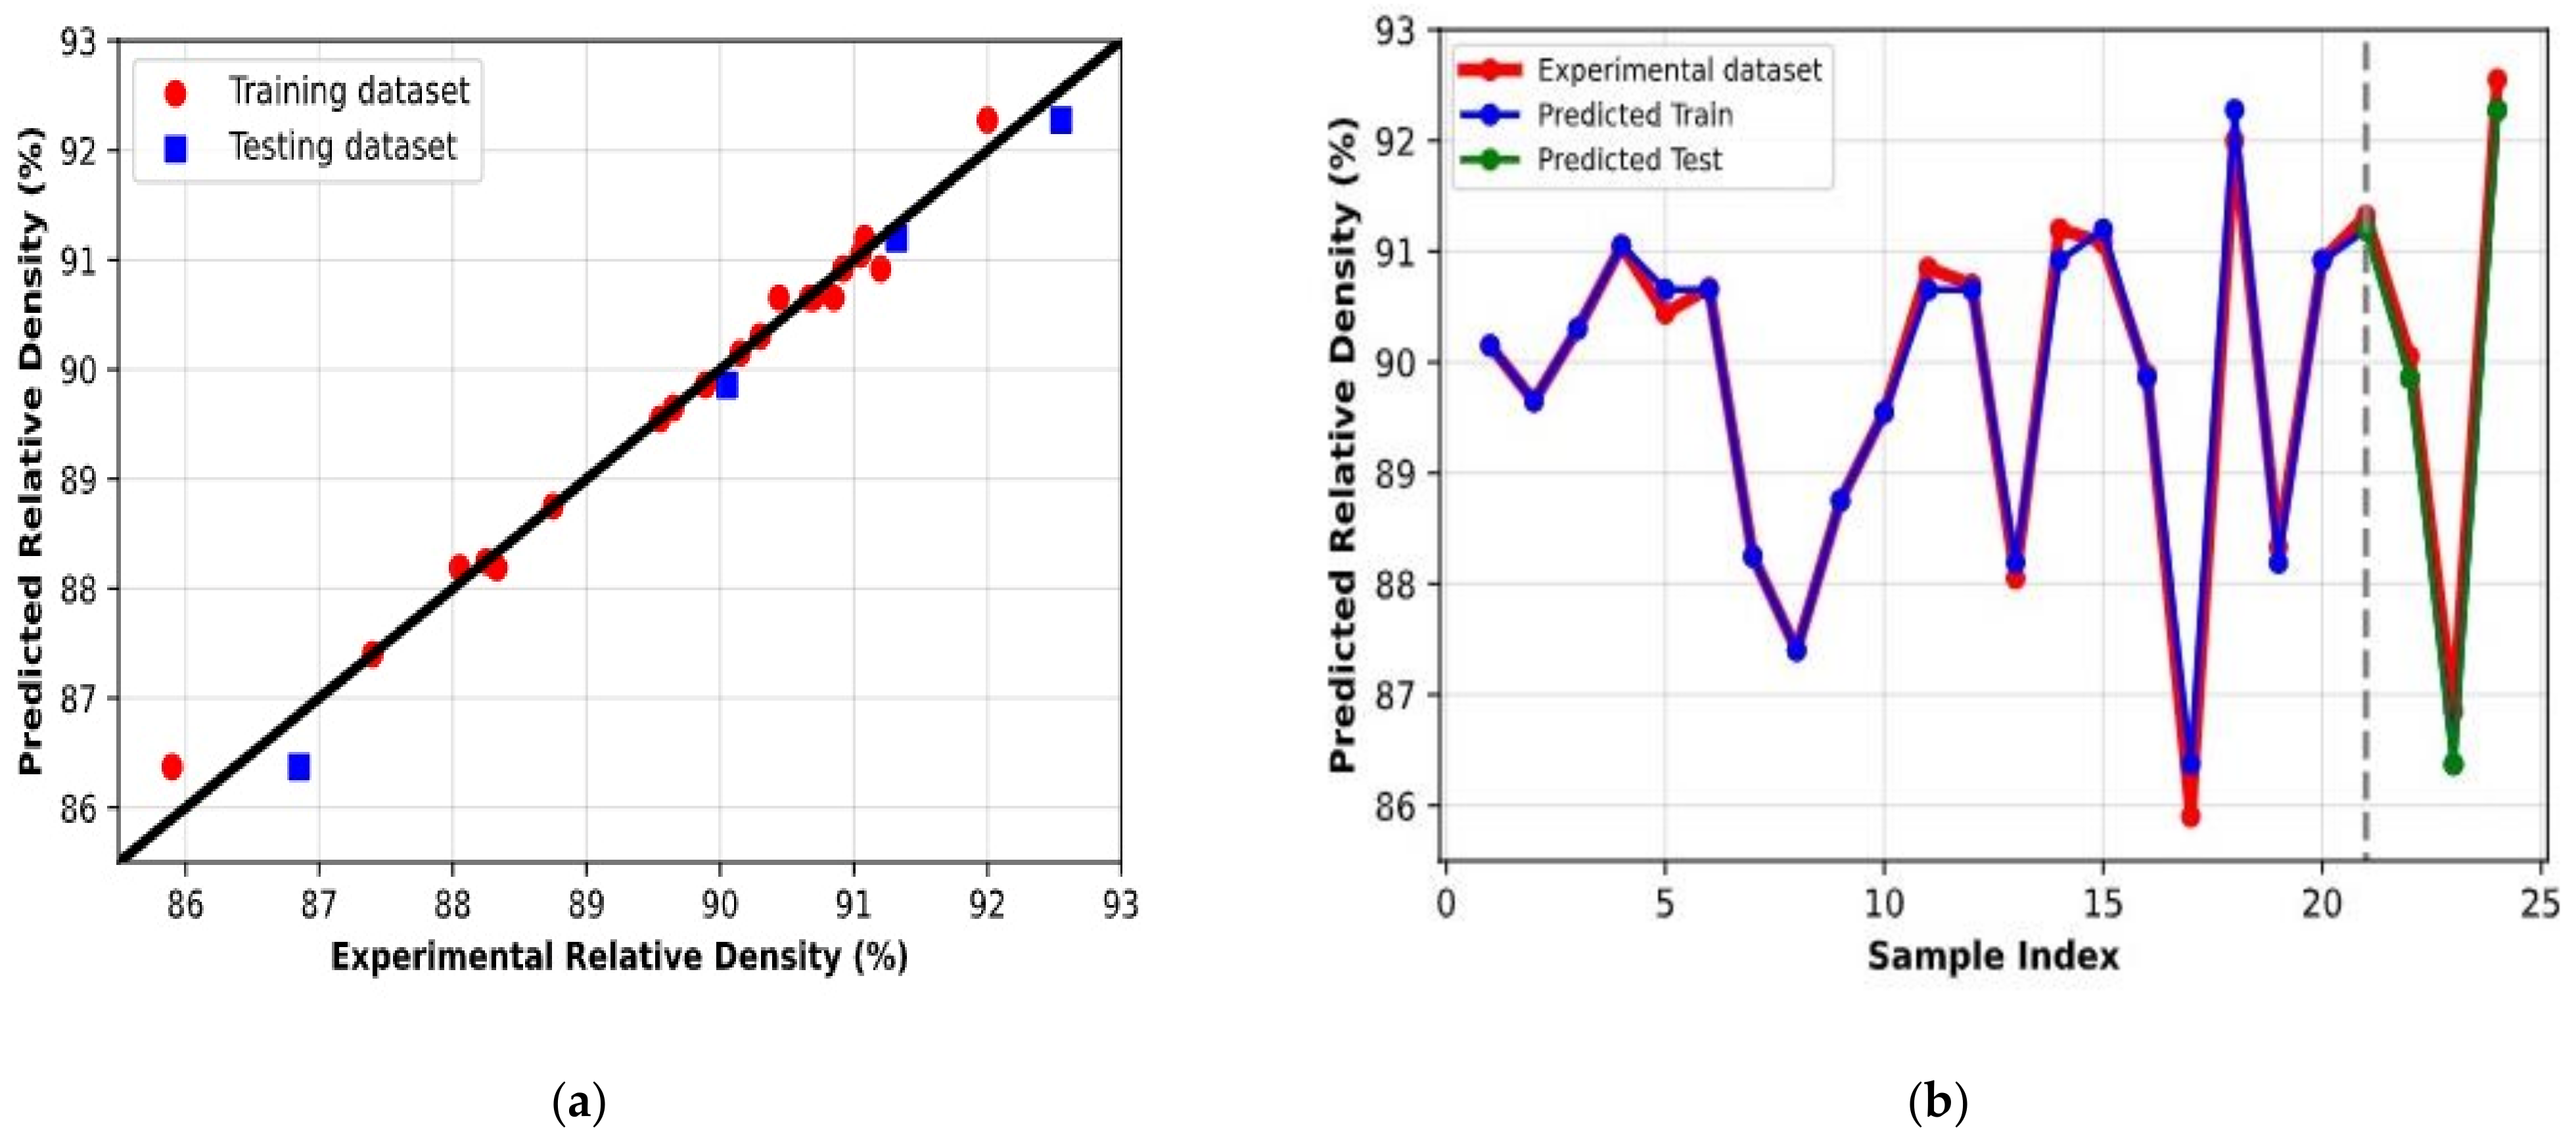
Several ML approaches, such as linear regression, regression trees, random forest regression, Gaussian process regression, and artificial neural networks, were used to predict the properties of the AMC. The experimental data were used to generate random samples for the training and assessment datasets, which respectively comprised 87% and 13% of the input for each dataset. Both groups fell within the same statistical range when looking at the data from the experiment. Following the training, the performance of the model was evaluated utilizing the RMSE as well as the R2-score. The ideal RMSE and R2 values for the RD parameter were 0.19 and 0.98, respectively, for the training set; for the testing set, these values were 0.24 and 1.
As can be seen in Figure 3, both the RD training set and the testing set proved the model’s ability to predict values that were quite similar to the actual data that were given to it. An ANN was enhanced using input, output, two hidden layers, rectified linear unit (ReLU) activation functions, and the levels of input and output in order to obtain these results. The other algorithms, as shown in Table 3, behaved adequately during the training and testing phases; nevertheless, the precisely adjusted ANN that was described earlier performed better than the other algorithms that were picked. The differences in error that can be seen between the predicted findings and the experimental results for the RD of the AMCs are presented in Table 4 and show very minimal differences.

3.1.2. Regression Models and 3D Plots of RD

Equation (5) represents the RD response’s linear regression model. The regression models depend on the input of pressure (P), H/D, and wt. % of the Al2O3 and their interactions. The R2 and adjusted R2 are very close to unity in the current study.
RD% = + 89.42310 + 0.003258 P + 1.81055 H/D − 0.013578 Al2O3 − 1.49493 (H/D)2 − 0.049975 (Al2O3)2
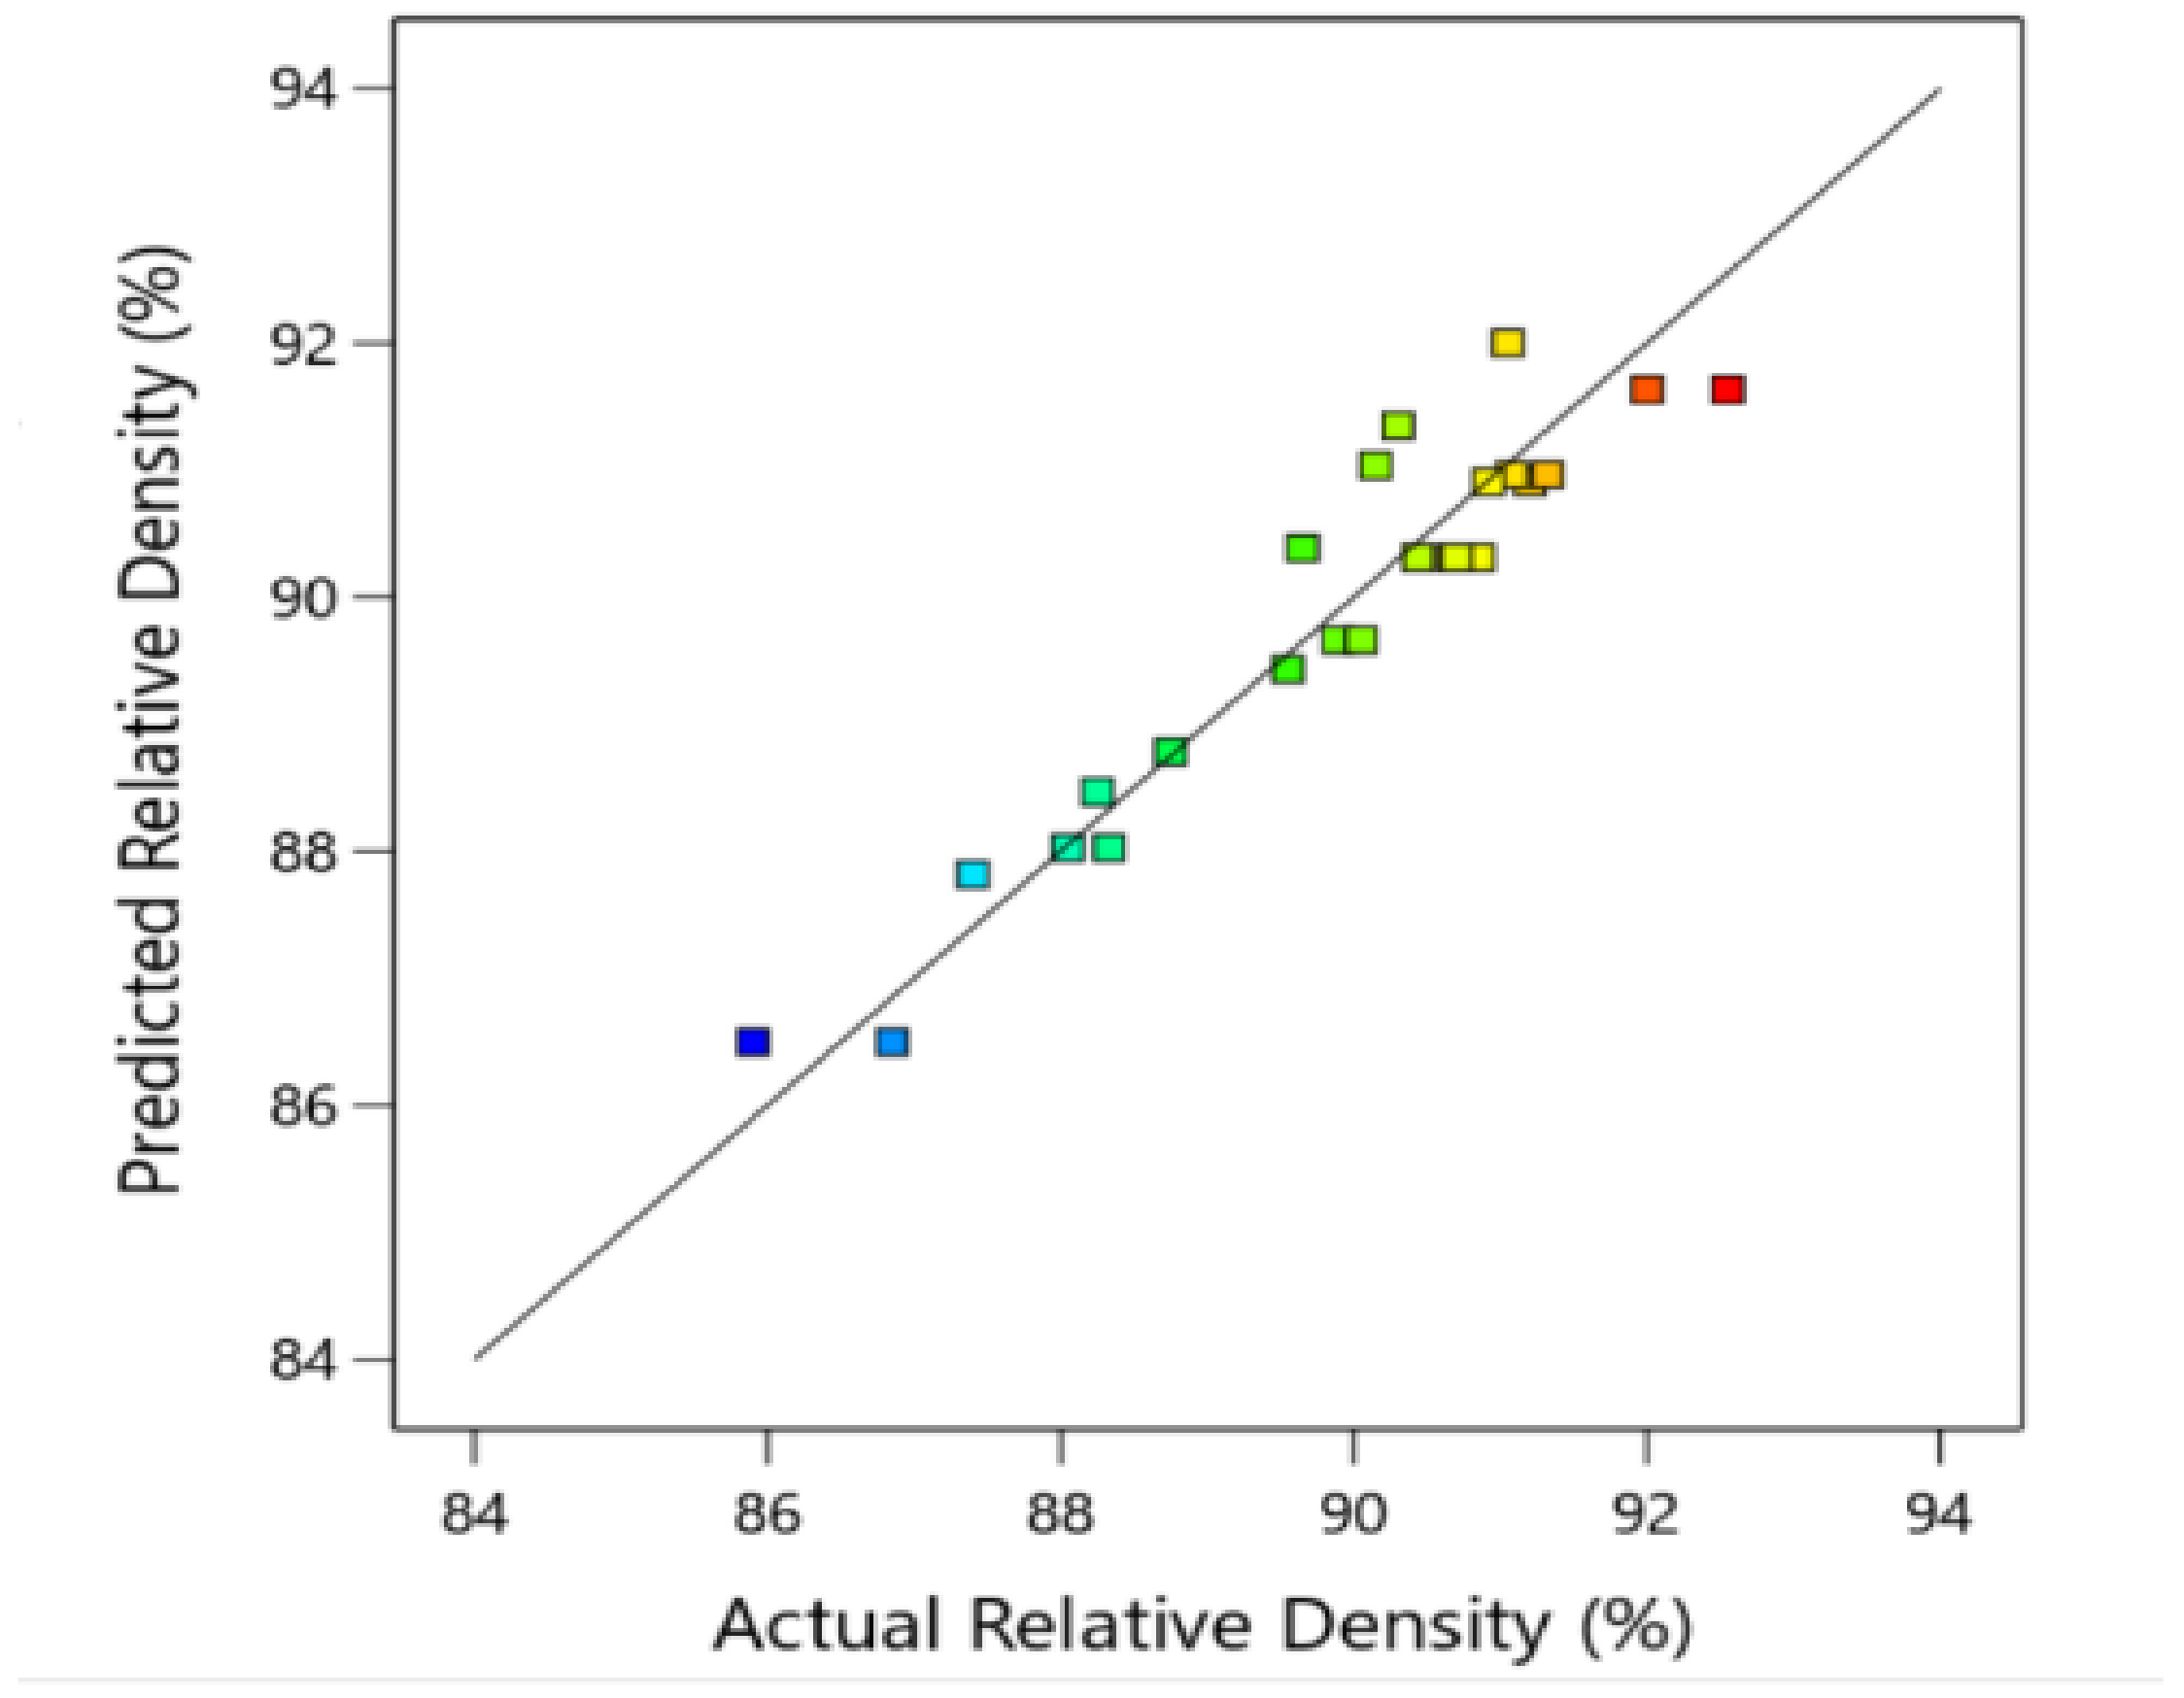
Figure 4 illustrates the relationship between the RD experimental results for the parameters of the Al-4Cu/(Al2O3)x composite and their corresponding anticipated values. The blue points are for minimum output value and gradually changed to red points for maximum output value. It is obvious from these data that the suggested regression models were effective since the experimental and forecast values match up well. This conclusion was drawn from the fact that the majority of the intersections between the experimental and predicted values are located near the median line.
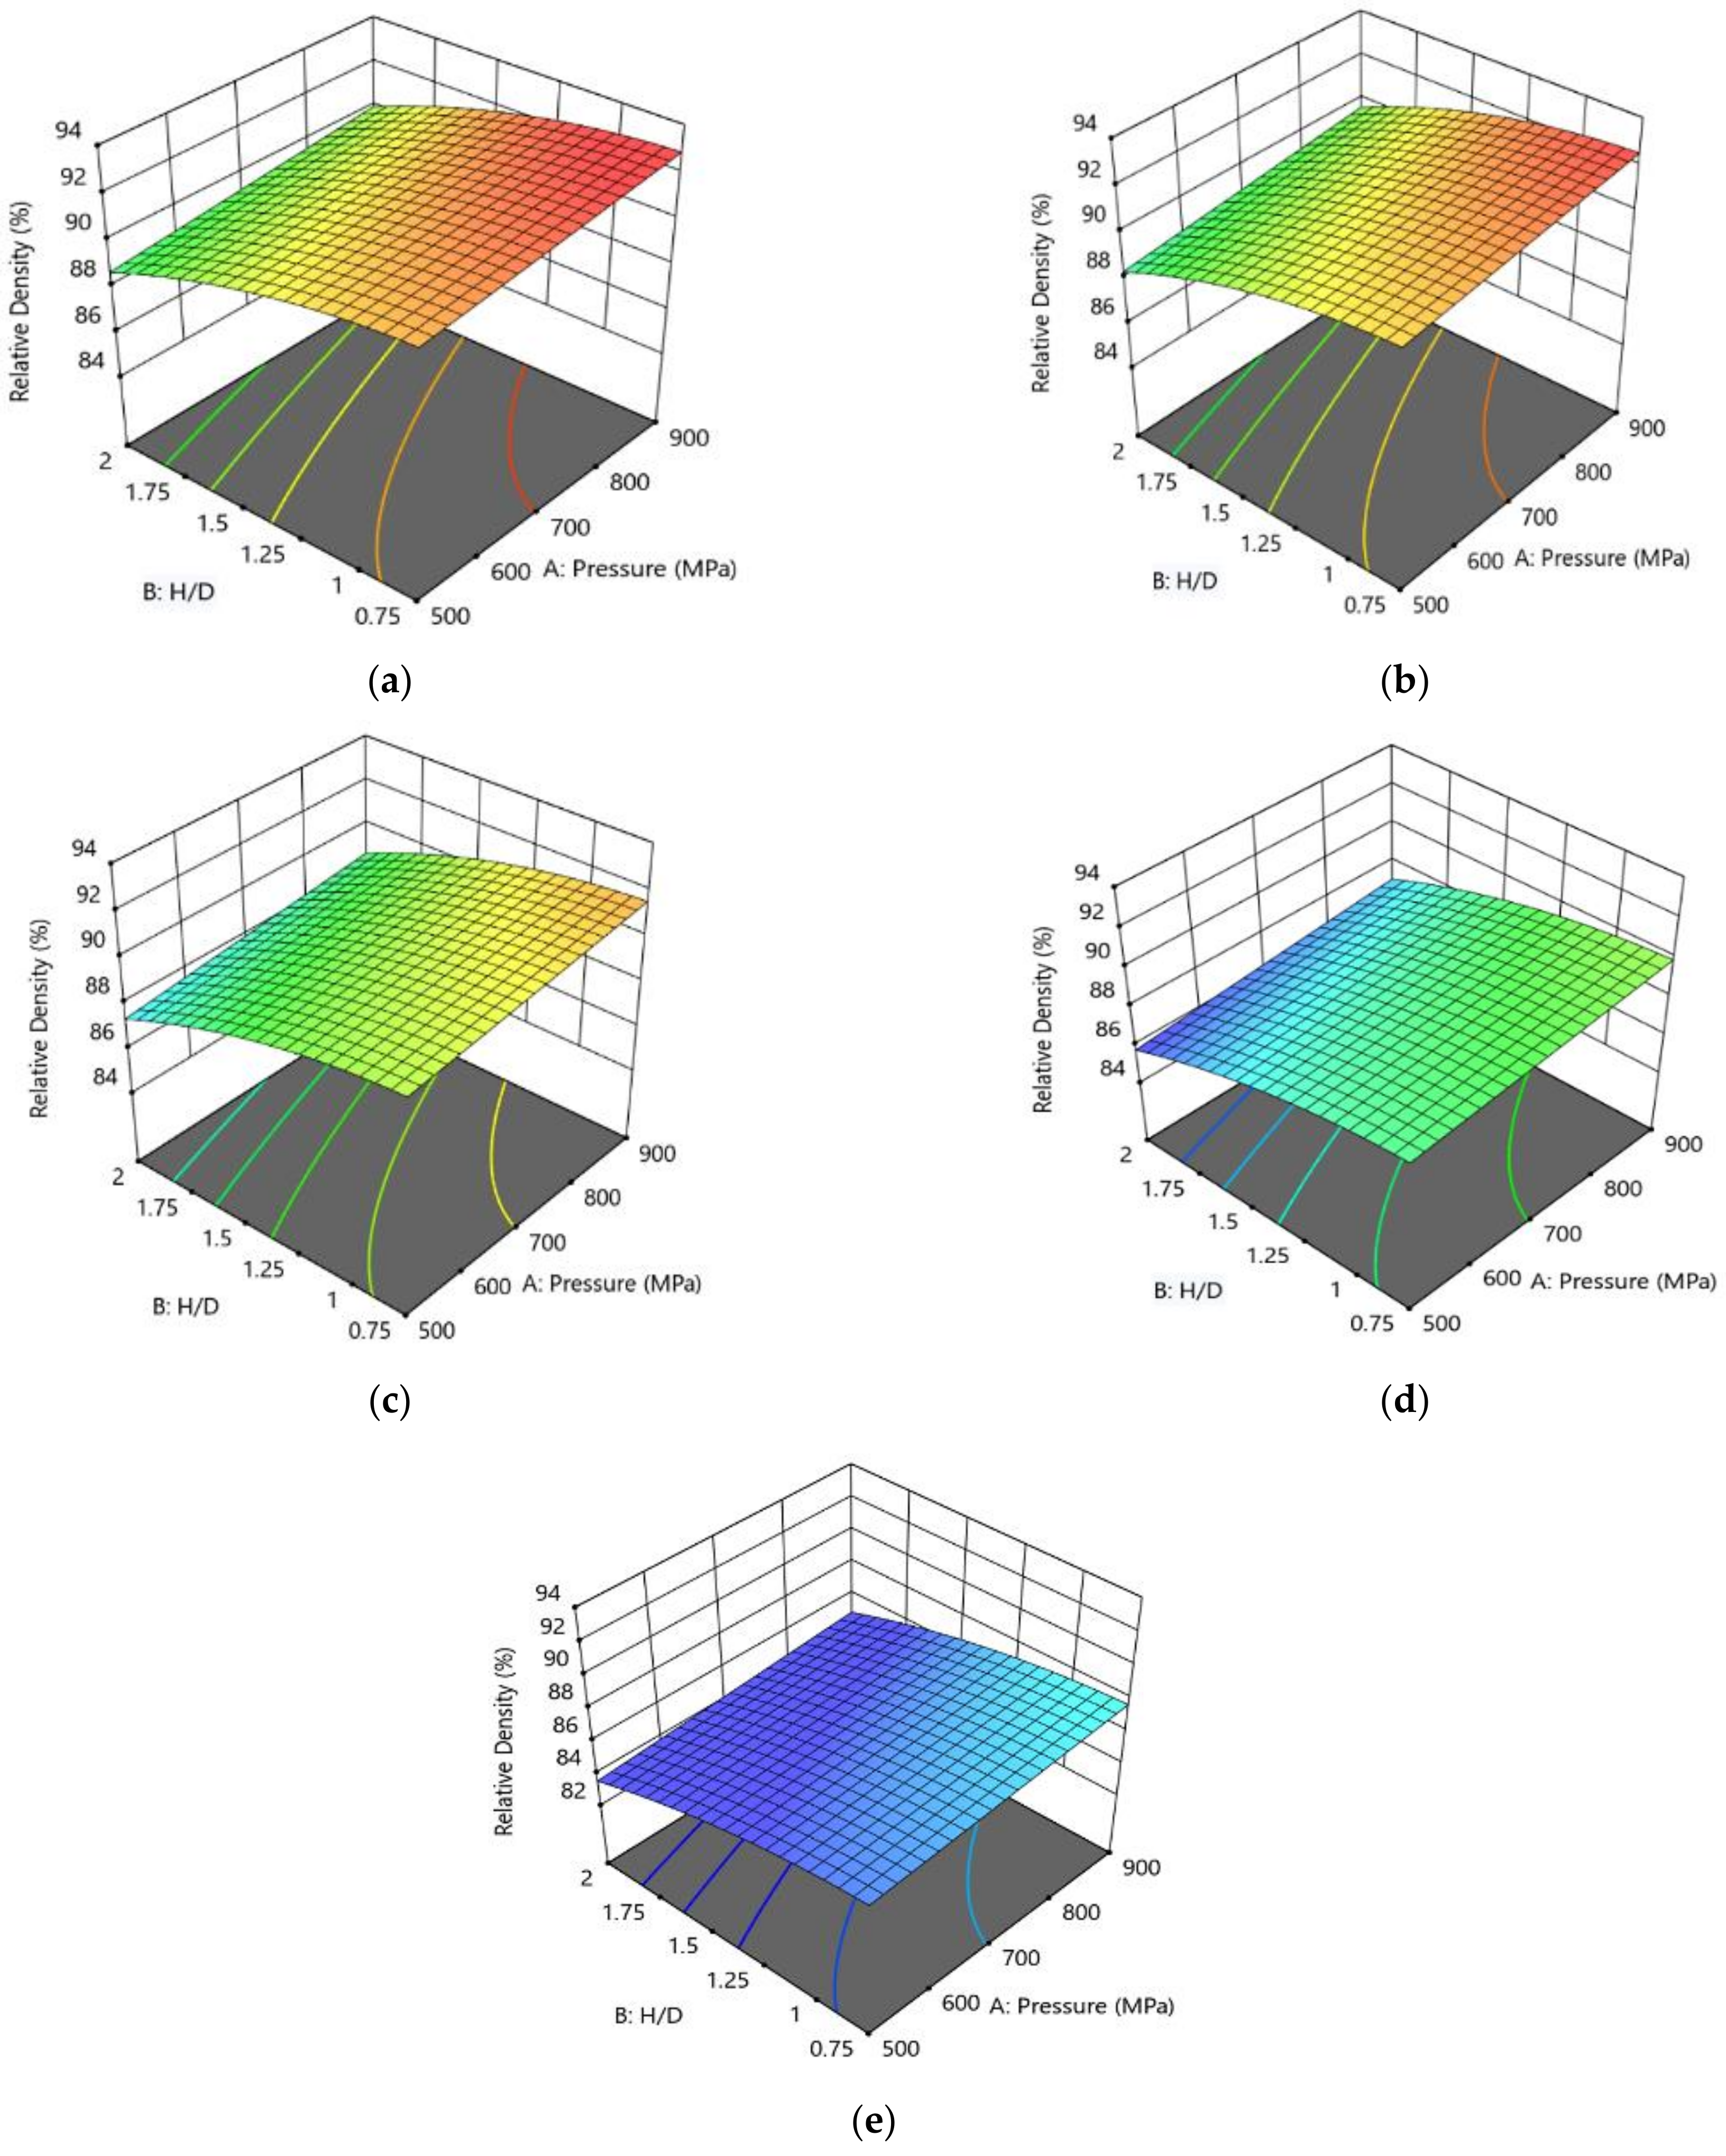
Figure 5 shows the impact that the AMC’s parameters had on the RD in accordance with the regression model’s (Equation (5)) calculations. At different Al2O3% levels, there appears to be a proportional link between the pressure and the RD. The H/D and RD were inversely related at different Al2O3% levels. At a pressure of 900 MPa and an H/D of 0.75, the maximum RD was achieved for all Al2O3% levels. Additionally, the proportion of the RD showed a decrease as a result of an increase in the weight percent of Al2O3. The greatest achievable RD of 92.872% is shown in Figure 5a at 0% Al2O3, 900 MPa, and a 0.75 H/D, which was similar to the value of 92.55% obtained experimentally at 0% Al2O3, 700 MPa, and a 1.25 H/D.

3.1.3. Optimization of RD

Figure 6 demonstrates the outcomes of the RSM optimization performed on the RD, alongside the factors that were pertinent to this analysis. The values of the AMC parameters and responses are shown for all RSM results as red dots and blue ones, respectively. The RD optimization objective was configured to “in range”, using “maximize” as the solution destination, and the anticipated result of the desirability function was in the format of “larger-is-better” attributes. The optimal AMC conditions were found to be P (A) = 893.89 MPa, H/D (B) = 0.854, and Al2O3% (C) = 0.031%. This led to the highest RD value possible, which was 92.791%.
Using a genetic algorithm technique, the objective functions for each response were determined and then subjected to the AMC’s boundary conditions of P, H/D, and Al2O3%. The following are the adopted objective functions along with their constraints:
Minimized P, H/D, Al2O3 % subjected to the AMC’s conditions; 500 ≤ P ≤ 900 (MPa), 0.75 ≤ H/D ≤ 2, 0 ≤ Al2O3 ≤ 10 (%).
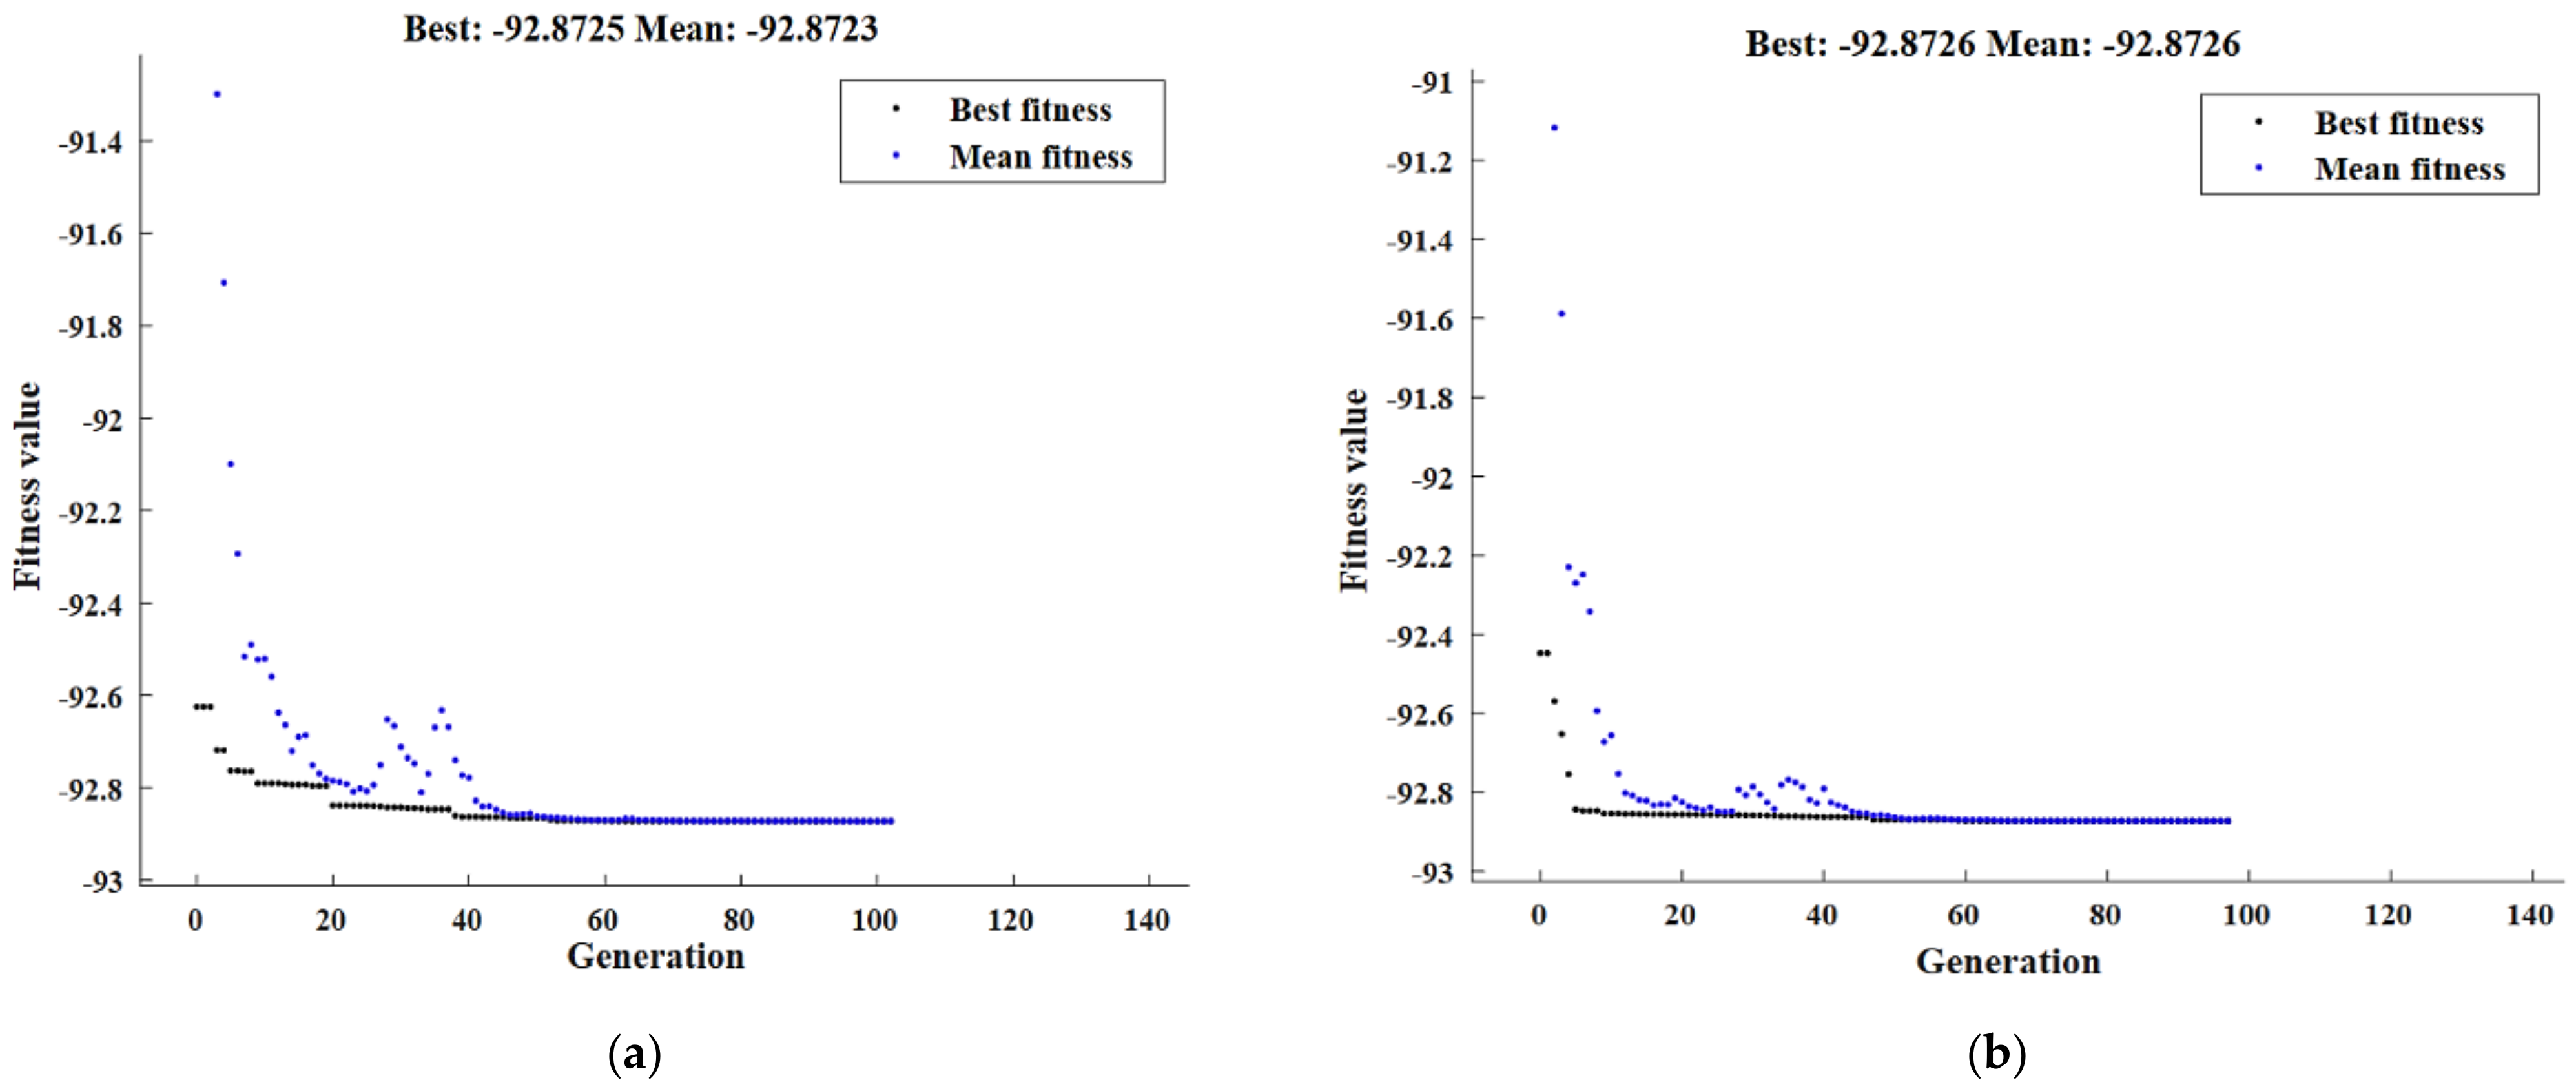
The performance of the fitness value, run solver view, and matching AMC conditions of the best RD for the GA optimization technique are displayed in Figure 7a,b. The fitness function, which was subject to the AMC’s boundary condition, was the maximizing of the RD described in Equation (1). The highest value of RD found by GA was 92.872% when P = 900 MPa, H/D = 0.75, and Al2O3 = 0% (Figure 7a).
An initial population of the hybrid DOE-GA had the following specifications based on the DOE’s ideal AMC conditions: P = 700 MPa, H/D = 1.25, and Al2O3 = 0%. The maximum RD value determined by the hybrid DOE-GA was 92.872% at 900 MPa, a 0.75 H/D, and 0% Al2O3 (Figure 7b).

3.2. Hardness Distribution

The values of Vickers hardness were measured for the studied Al-4Cu/(Al2O3)x AMCs. The increase in the compaction pressure resulted in a momentous increase in the hardness of the compacted discs. Furthermore, increasing the reinforcement percentage of Al2O3 and decreasing the H/D values caused increases in the hardness property. It was clearly revealed that using a compaction pressure of 600 MPa resulted in an 11.48% increase in the Hv of Al-4Cu/(Al2O3)0. Moreover, strengthening with a different wt.% of Al2O3 (2.5, 5, 7.5, and 10) caused increases of 11.29%, 9.09%, 19.12%, and 28.57%, respectively, compared to discs compacted under 500 MPa. Furthermore, increasing the Al2O3 percentage revealed increases of 1.64%, 8.2%, 11.48%, and 47.57% in the Hv values of 2.5, 5, 7.5, and 10 compared to the Al-4Cu/(Al2O3)0 pressed under 600 MPa. A further increase in the compaction pressure up to 900 MPa led to increases of 1.47%, 5.88%, 19.12%, and 32.35% in the Hv Al-4Cu/(2.5, 5, 7.5, 10)Al2O3 compared to discs compacted under 600 MPa. The maximum hardness was reached at 126.27 hv, for Al-4Cu/(Al2O3)10 with an H/D = 0.75 compacted under 900 MPa.
The hardness of the AMCs principally depended on the matrix and the reinforcement materials content. The hardness increase was obviously accompanied by the reinforcement hard particle addition. Moreover, the increase in hardness can be attributed to the grain boundary growth that grain refinement caused [60]. Additionally, the hardness improvement can be argued to reduce the dislocation movement during plastic deformation; consequently, the interface area between the particles increases and impedes the grain’s development during sintering [13].

3.2.1. Machine Learning Prediction Models of Hardness Distribution

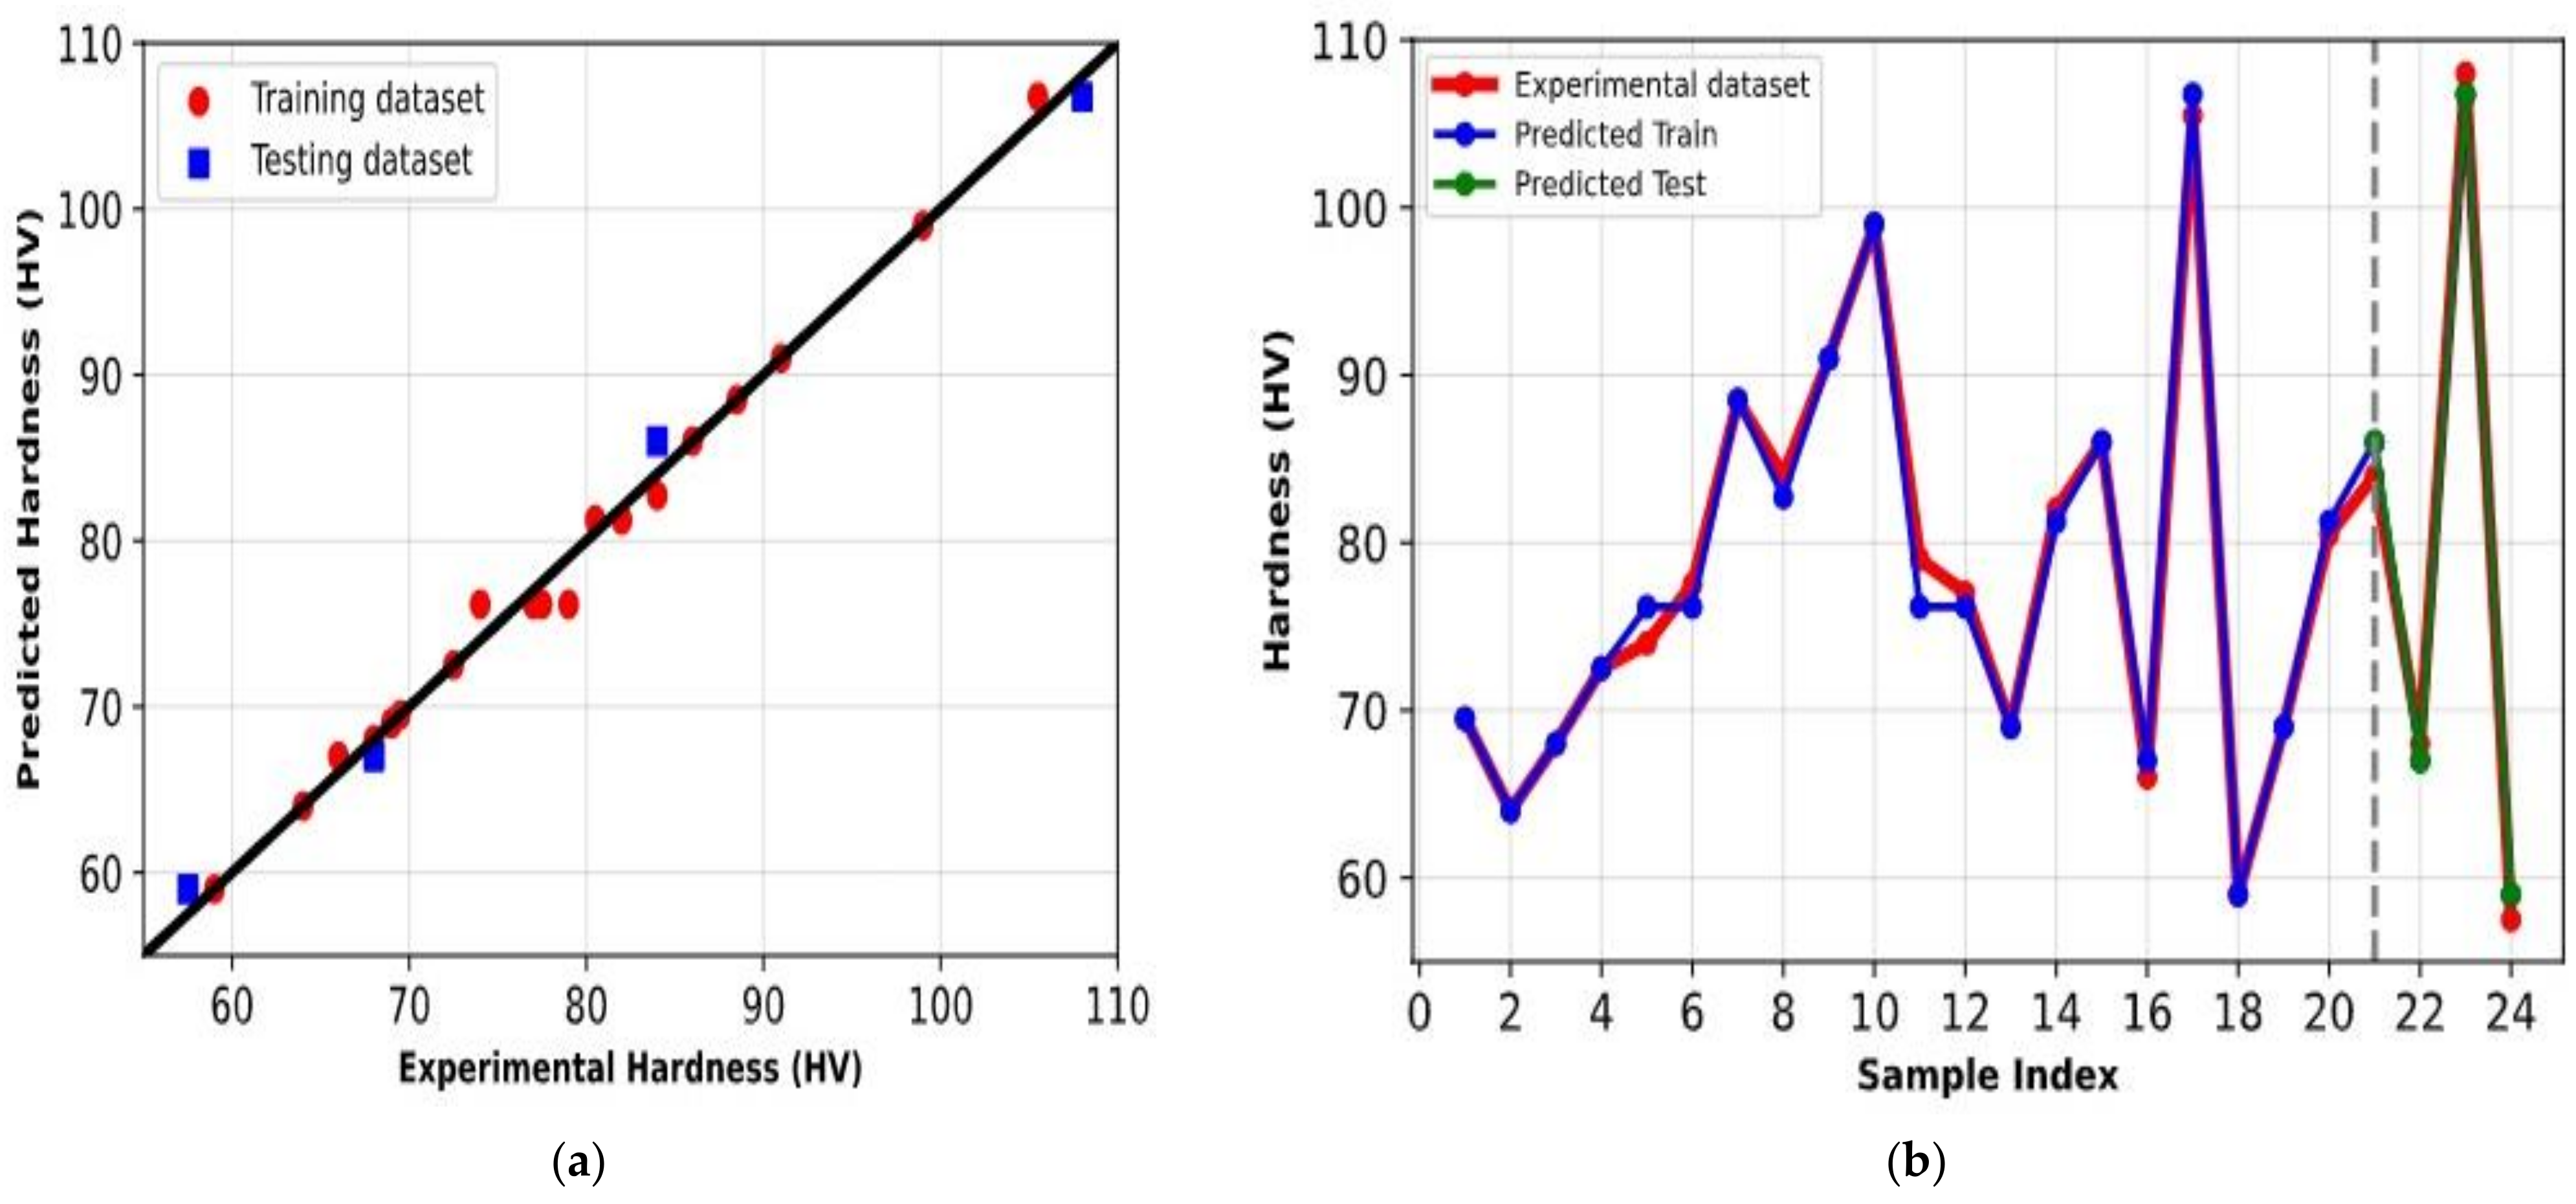
Figure 8 presents the results obtained by modeling the AMC’s hardness. The ANN was successful where other algorithms failed in their attempts to accurately capture the trend of the model. According to Table 5, the optimized network’s RMSE and R2 values achieved for the hardness parameter were 0.818 and 0.996, respectively, for the training set; for the testing set, these values were 2.19 and 1. Consequently, this model inference is appropriate for predicting the hardness of brand-new, unidentified input data under various experimental setup configurations. Table 6 presents an illustration of the differences in error between the experimental and predicted results for the hardness of AMC, which are very minimal.

3.2.2. Regression Models and 3D Plots of Hardness Distribution

Equation (6) was used to express the hardness response’s linear regression model, which was dependent on the amount of pressure (P), the H/D ratio, and the wt.% of Al2O3, as well as the interactions among these variables. In the present research, the R2 and adjusted R2 had values that were quite near the value of 1.
H v   =   +   12.37184   +   0.079765   P   +   11.94833   H / D   +   4.21279   Al 2 O 3     0.012500   P   x   H / D   +   0.001250   P   x * Al 2 O 3 2.10000   H / D   *   Al 2 O 3 0.000022   P 2   1.19594   ( H / D ) 2   +   0.224554   ( Al 2 O 3 ) 2
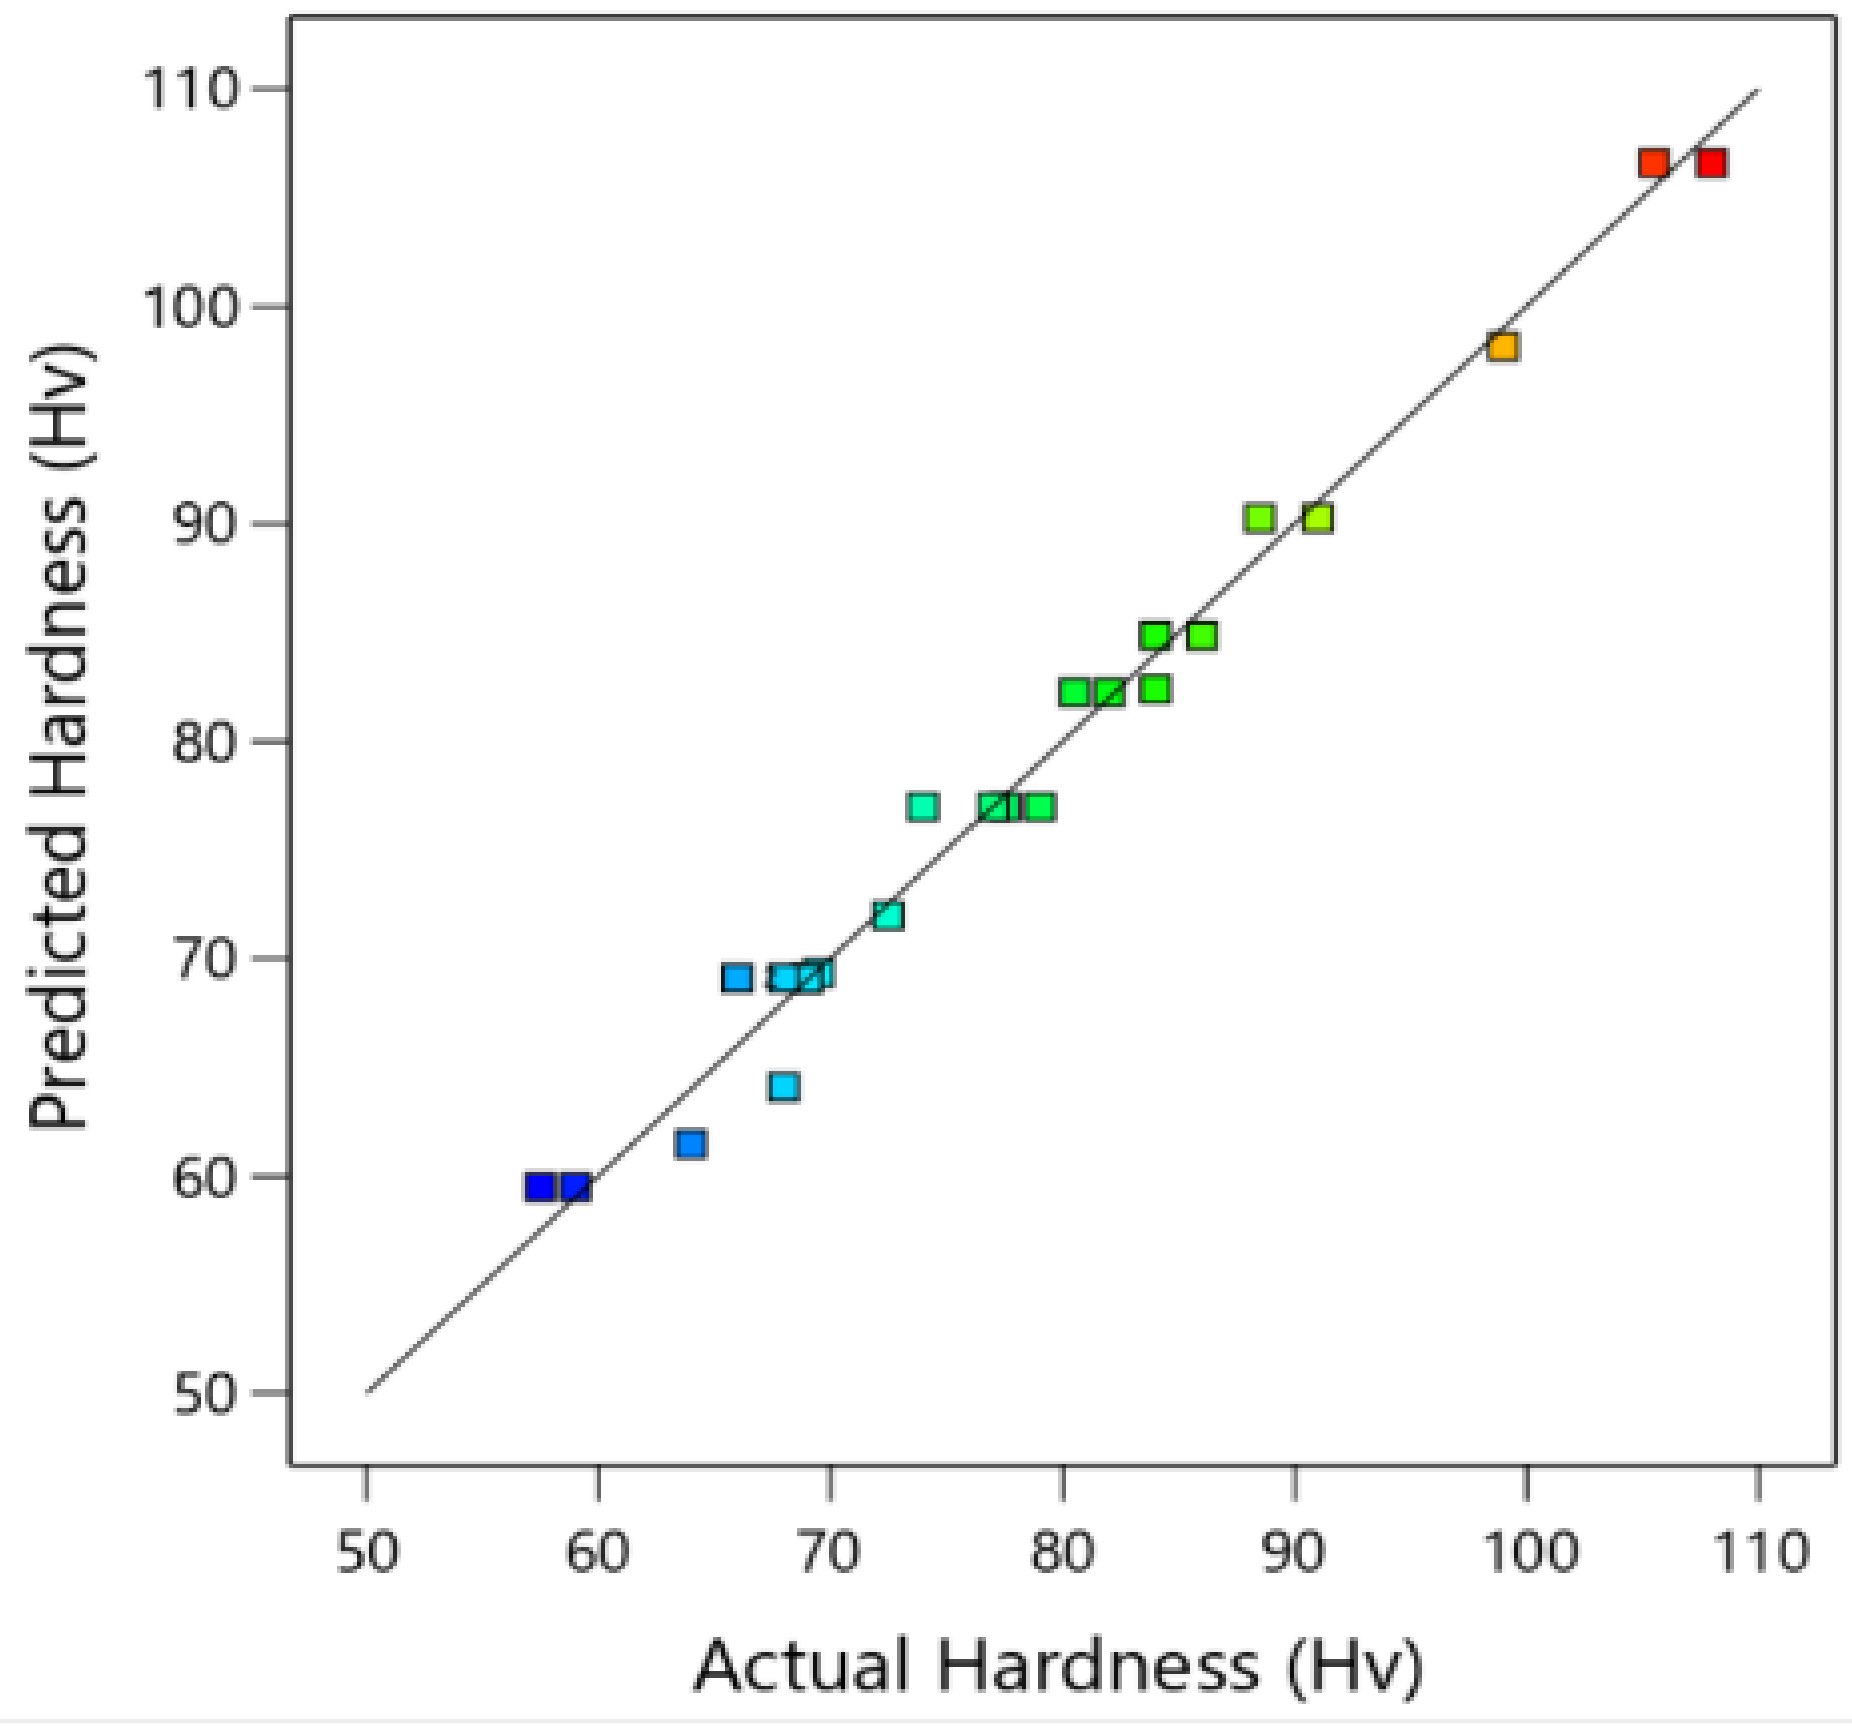
Figure 9 illustrates the relationship between the hardness experimental results for the parameters of the Al-4Cu/(Al2O3)x composite and their corresponding anticipated values. It is obvious from these data that the suggested regression models were effective since the experimental and forecast values match up well. The following conclusion (Table 6) was drawn from the fact that the majority of the intersections among the experimental and predicted values are located near the median line.
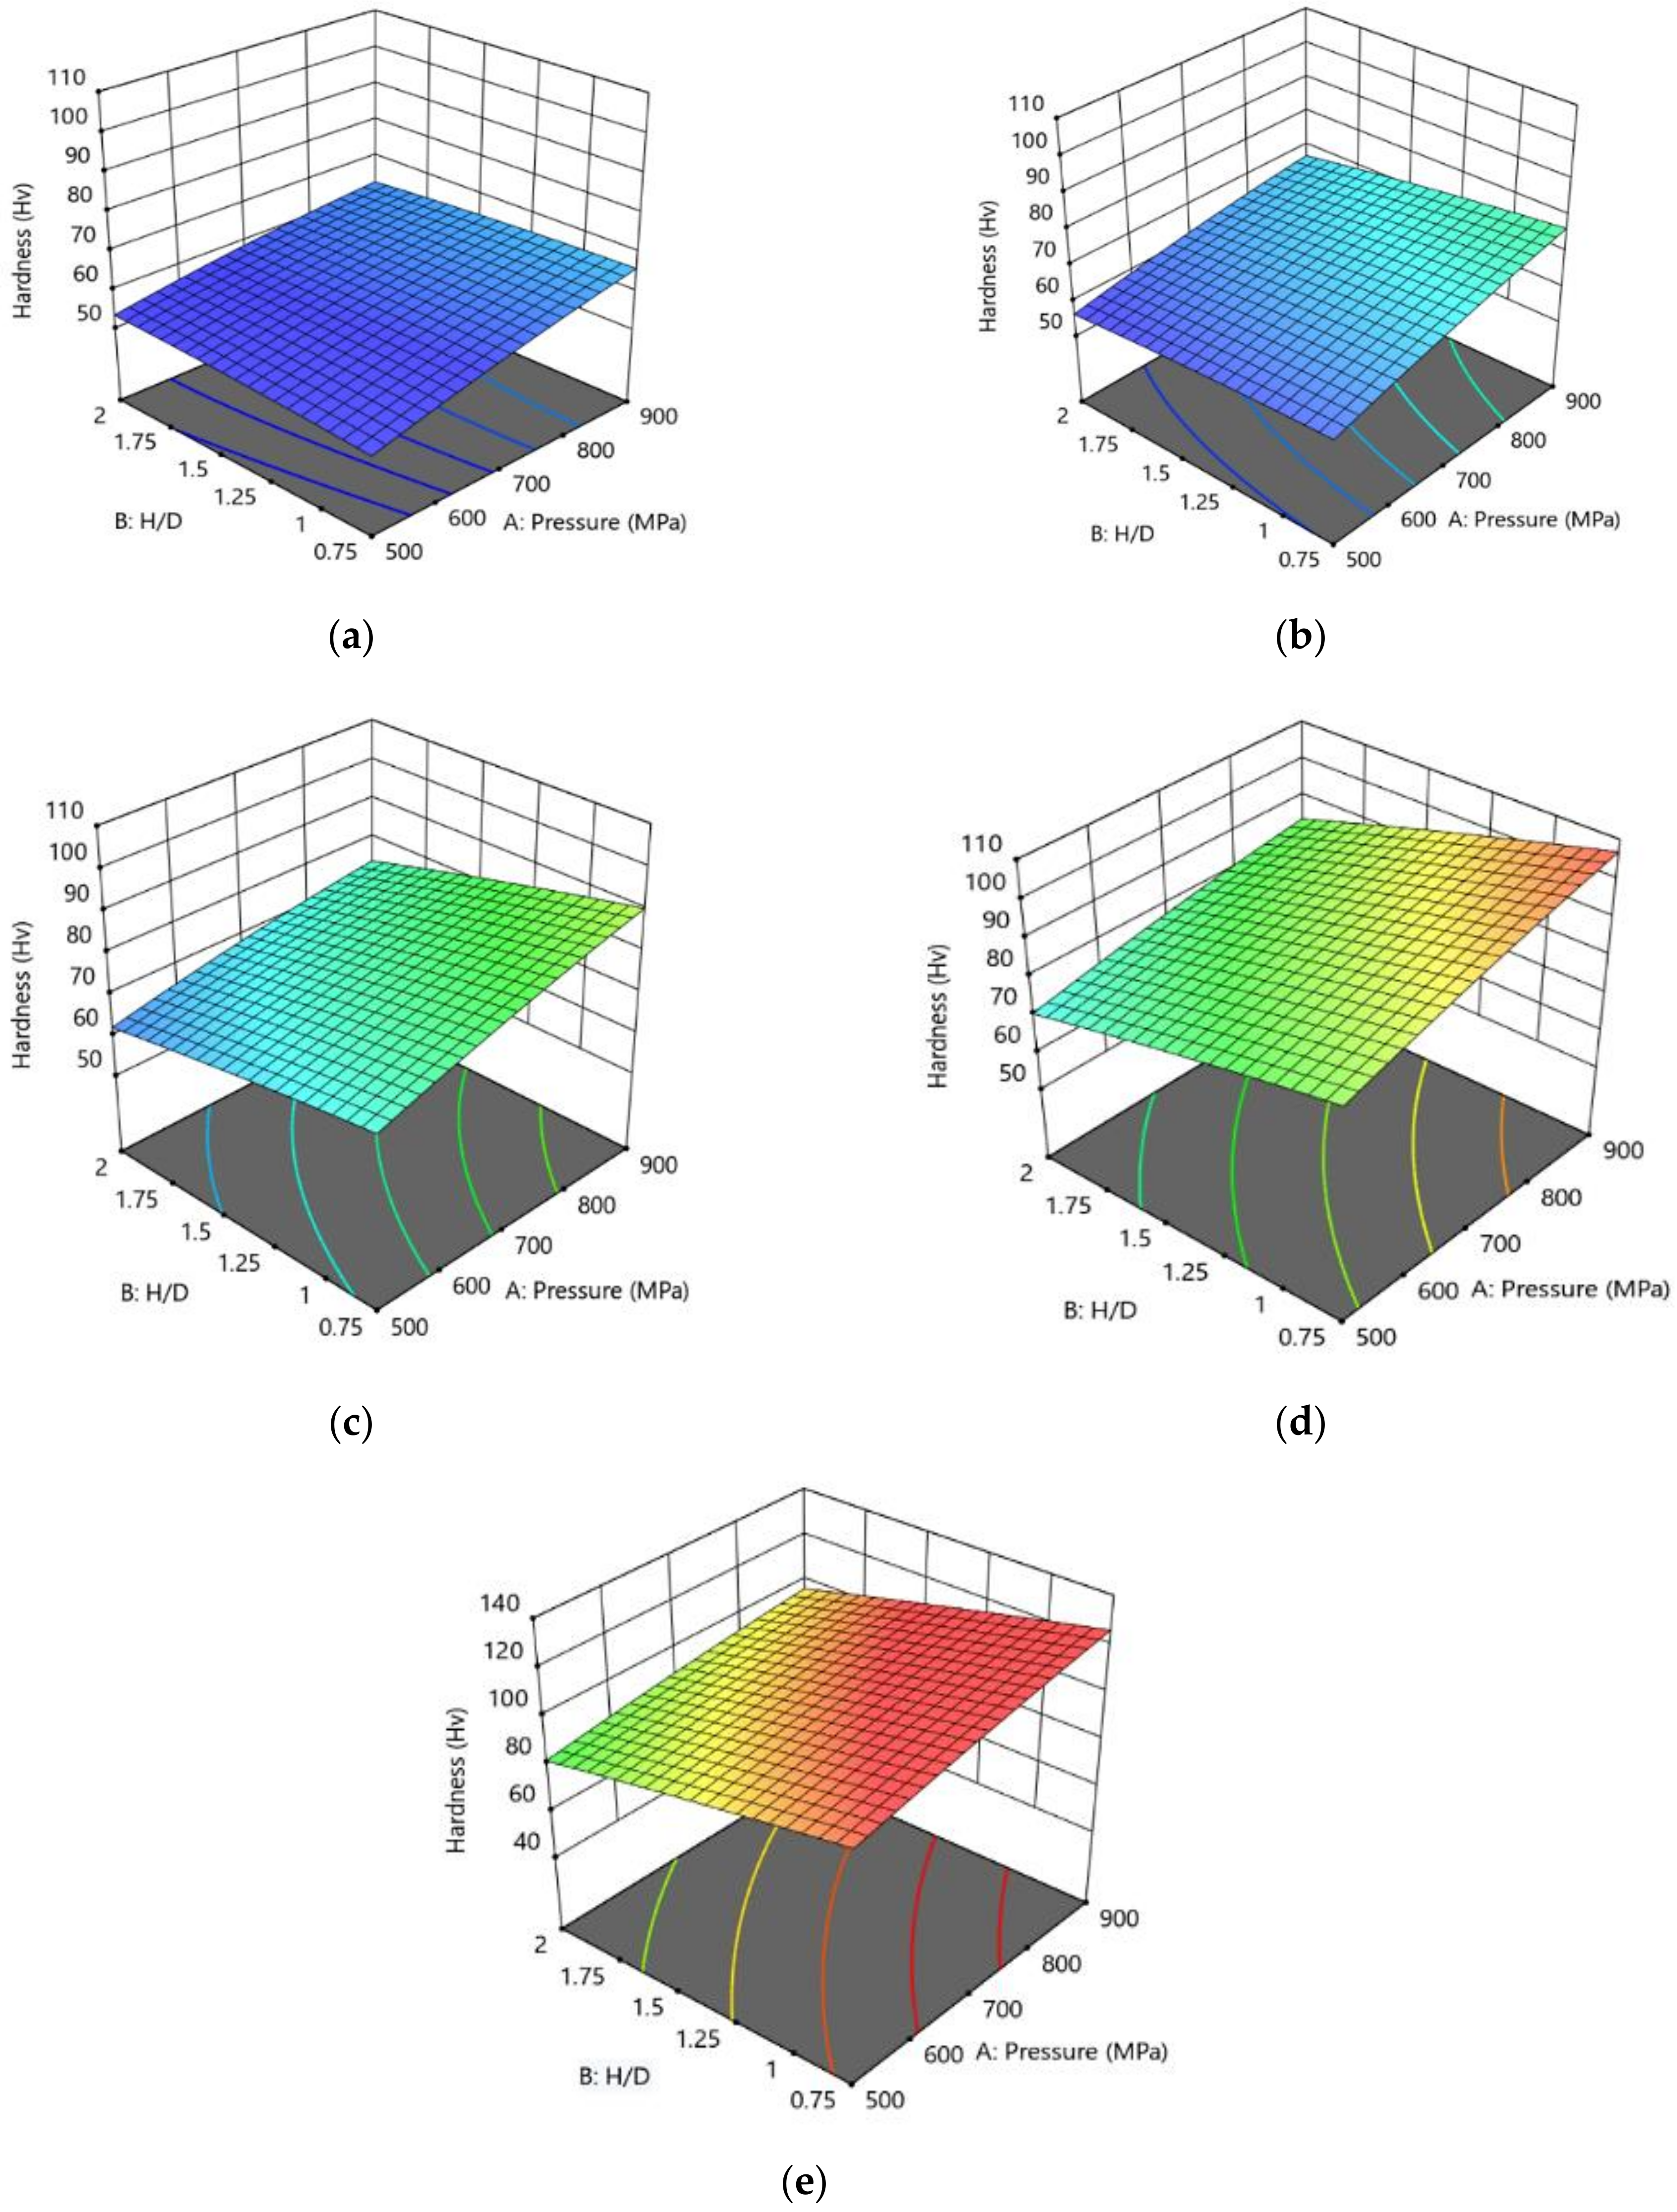
Figure 10 shows how the AMC parameters had an effect on the hardness as measured by the regression models (Equation (6)). It was observed that the parameters of the AMC, specifically the pressure and Al2O3%, had a proportional relationship with the hardness values, while a drop in the specimen’s hardness was noticed with a modest increase in the H/D. The highest Vickers hardness was achieved at 900 MPa and a 0.75 H/D for all Al2O3% percentages tested. Figure 10e displays the highest feasible Vickers hardness that was achieved at 10 Al2O3%, 900 MPa, and a 0.75 H/D with a value of 126.27 Hv. This hardness was superior to the hardness that was produced experimentally with a value of 108 Hv at 700 MPa, a 1.25 H/D, and 10 Al2O3%.

3.2.3. Optimization of Hardness

Figure 11 demonstrates the outcomes of the RSM optimization performed on the hardness, alongside the factors that were pertinent to this analysis. The hardness optimization objective was configured to “in range,” using “maximize” as the solution destination, and the anticipated result of the desirability function was in the format of “larger-is-better” attributes. The optimal conditions were found to be P (A) = 875.087 MPa, (B) H/D = 0.87, and (C) Al2O3 % = 9.845%. This led to the highest hardness value possible, which was 121.199 Hv.
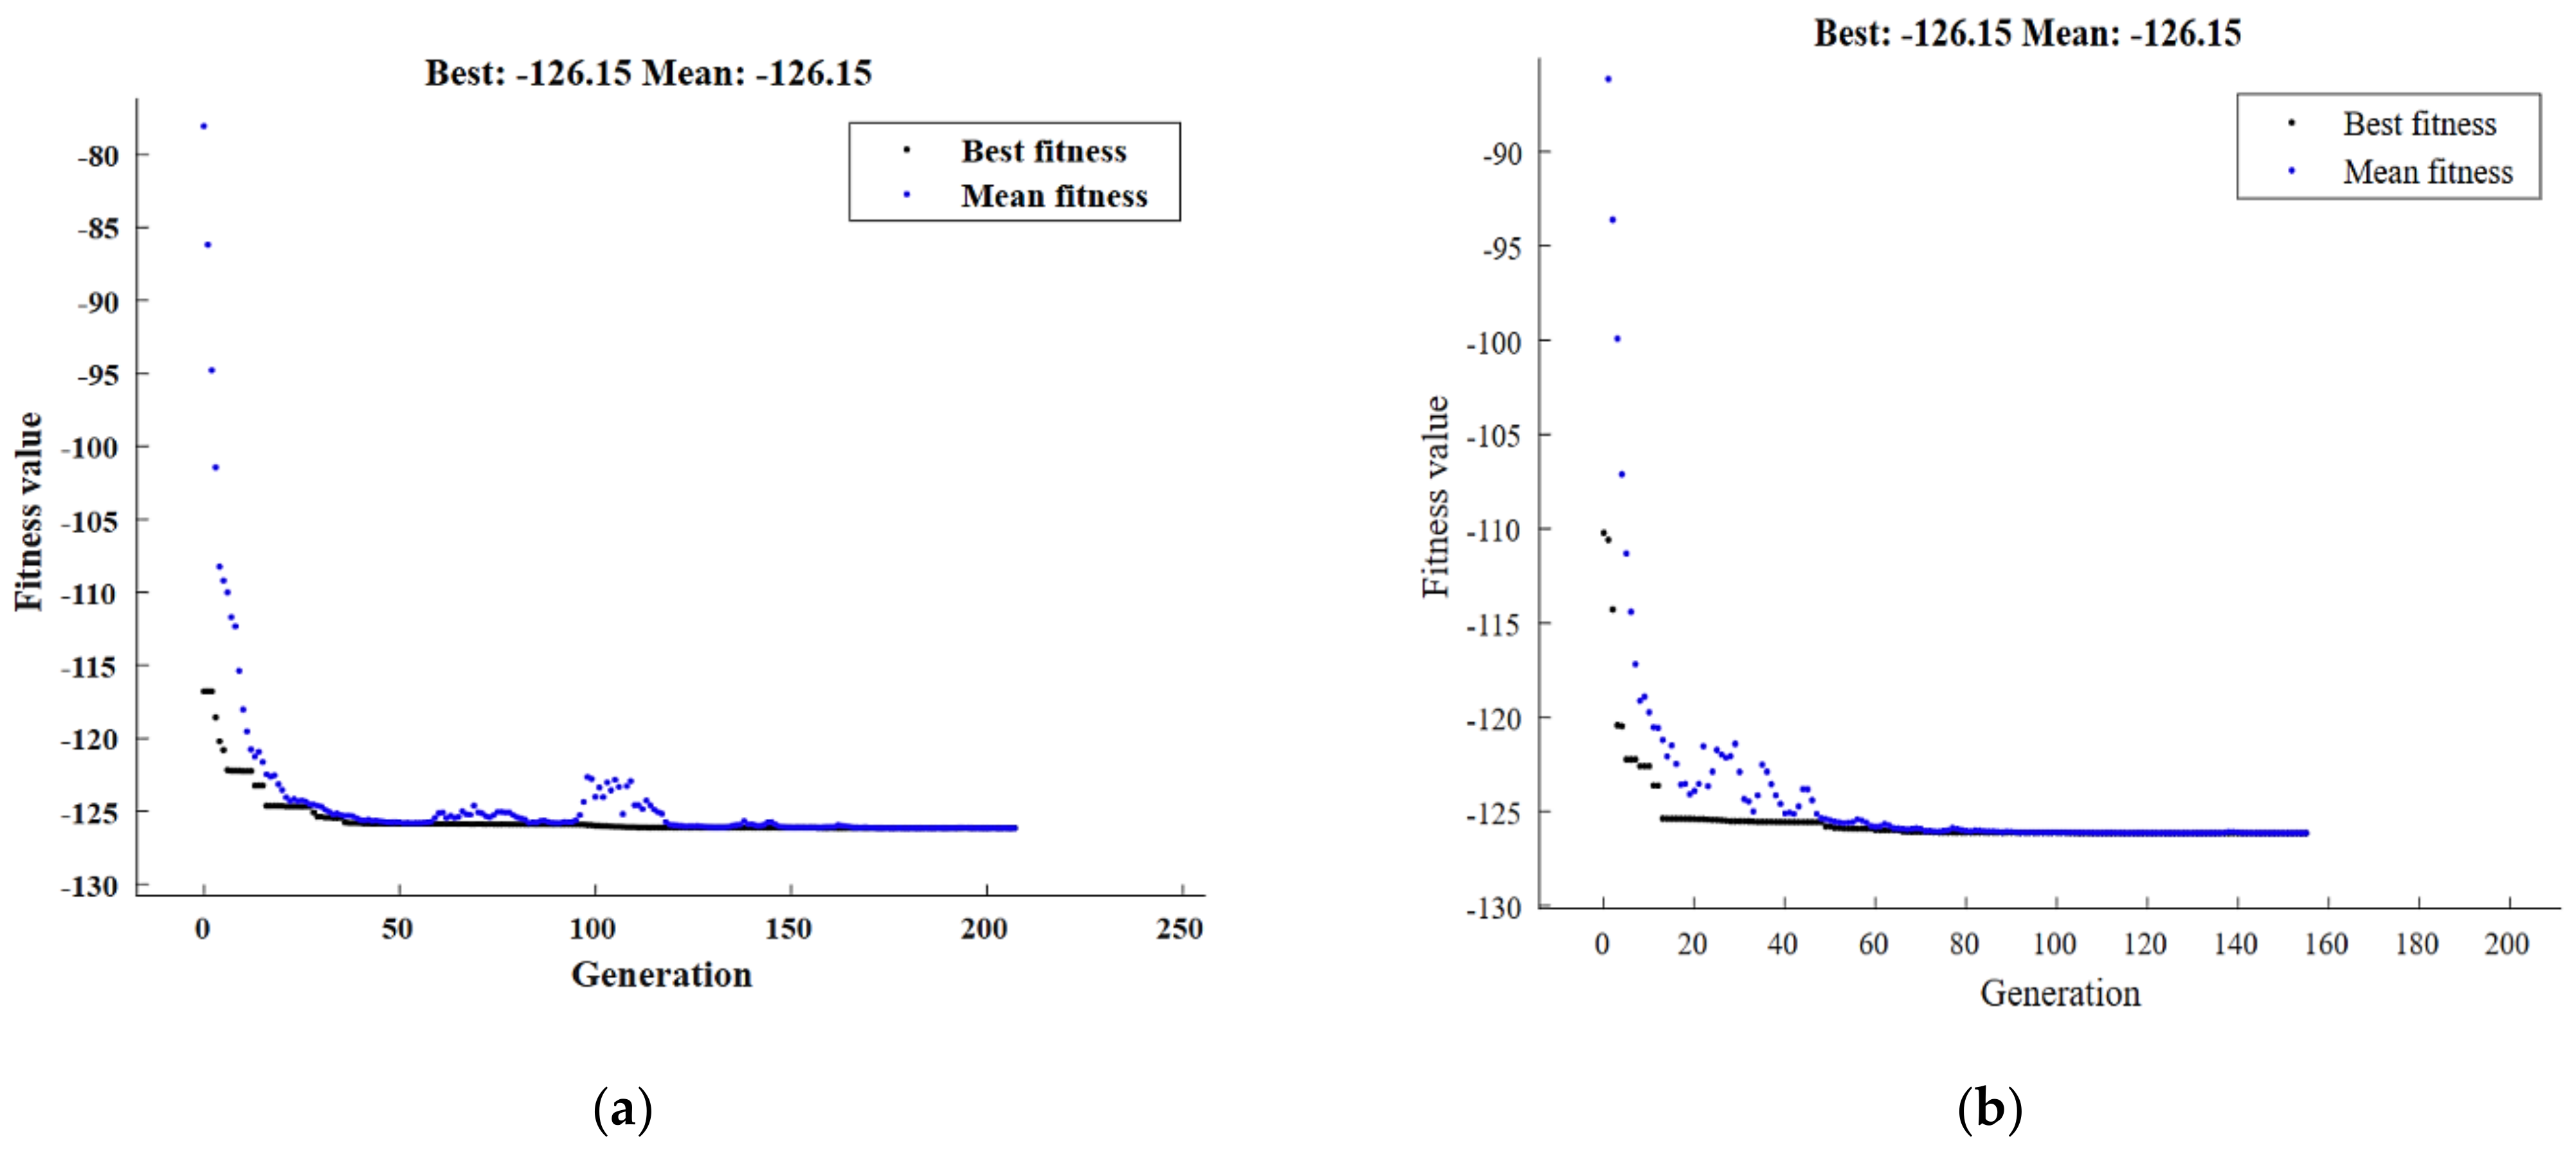
The use of a genetic algorithm technique helped to determine the objective functions for each response. The maximizing of the hardness that is represented by Equation (6) was used as the fitness function, and it was applied to the boundary condition for the AMC. The best Vickers hardness estimate obtained by the GA at 900 MPa, a 0.75 H/D, and 10% Al2O3 was 126.15 Hv, as shown in Figure 12a. Based on the hybrid DOE-GA data, which are displayed in Figure 12b, it was determined that the material with the highest hardness had a value of 126.15 Hv at 900 MPa, a 0.75 H/D, and 10% Al2O3.

3.3. Compression Properties

The compression test provided vital properties such as yield stress (σy), compressive strength (σuc), and fracture strain (εf). The compressive properties of the Al-4Cu/(Al2O3)x AMCs processed under the different studied conditions were measured. It was revealed that increasing the compaction pressure and Al2O3wt.% resulted in significant increases in the σy and σuC of the compacted discs. Moreover, decreasing the H/D value caused an increase in the compressive properties and decreased the εf.
As tabulated in Table A1 (Appendix A), the σy and σuc of the Al-4Cu sintered discs compacted under a pressure of 500 MPa for H/D= 1.5 were 183 MPa and 224 MPa, respectively. To investigate the effect of the compaction pressure, it was revealed that increasing the compaction pressure to 600 MPa using the H/D= 1.5 resulted in 2.73% and 7.6% increases in the σy and σuc, respectively. For a compaction pressure of 600 MPa, the reduction in the H/D to 1 resulted in additional increases in the σy and σuc of 4.8% and 9.1%, whereas an H/D of 0.75 resulted in increases in the σy and σuc of 4% and 6.17%, respectively, compared to the discs compacted at 500 MPa. Moreover, increasing the compaction pressure up to 900 using an H/D = 1.5 resulted in significant increases in both the σy and σuc of 6% and 11.2%, respectively. For the counterparts compacted using an H/D of 1.25, increases in the σy and σuc of 7% and 14.7%, respectively, were recorded. Furthermore, the H/D of 1 led to increases in the σy and σuc of 4.5% and 14.4%, respectively, compared to the discs compacted at 500 MPa.
Furthermore, increasing the Al2O3 content to 2.5 wt.% resulted in 2.27% and 4.03% increases in the σy and σuc for sintered discs with an H/D = 1 compacted under 500 MPa, respectively. Additional Al2O3 strength, with 5, 7.5, and 10 wt.%, resulted in σy increases of 1.95, 0.95, and 2.37, respectively, and σuc increases of 5.1%, 1.41%, and 1.63%, respectively, compared to the Al-4Cu discs compacted at 500 MPa. In addition, increasing the compaction pressure up to 900 MPa increased the σy and σuc compared to the discs compacted under 600 MPa. As the Al-4Cu/(Al2O3)2.5 recorded increases of 23.67% and 21.7%, Al-4Cu/(Al2O3)5 had increases of 32.37 and 37.21%, Al-4Cu/(Al2O3)7.5 had increases of 42.5 and 42.64%, and Al-4Cu/(Al2O3)10 had increases of 45.19 and 34.53% in the σy and σuc, respectively. Additionally, the εf decreased with decreases in the H/D and increases in both the compacted pressure and the Al2O3 content. Increasing the Al2O3 wt.% up to 10 resulted in decreases in the εf of the sintered discs compacted under 900 MPa of 22% for an H/D = 1.5 and of 36% for an H/D = 1, compared to 2.5 wt.% Al2O3. An increase in the strength and a decrease in the εf with increases in the wt.% of Al2O3 and the compaction pressure can be attributed to the grain refinement and the brittle nature of Al2O3.

3.3.1. Machine Learning Prediction Models of Compression Distribution

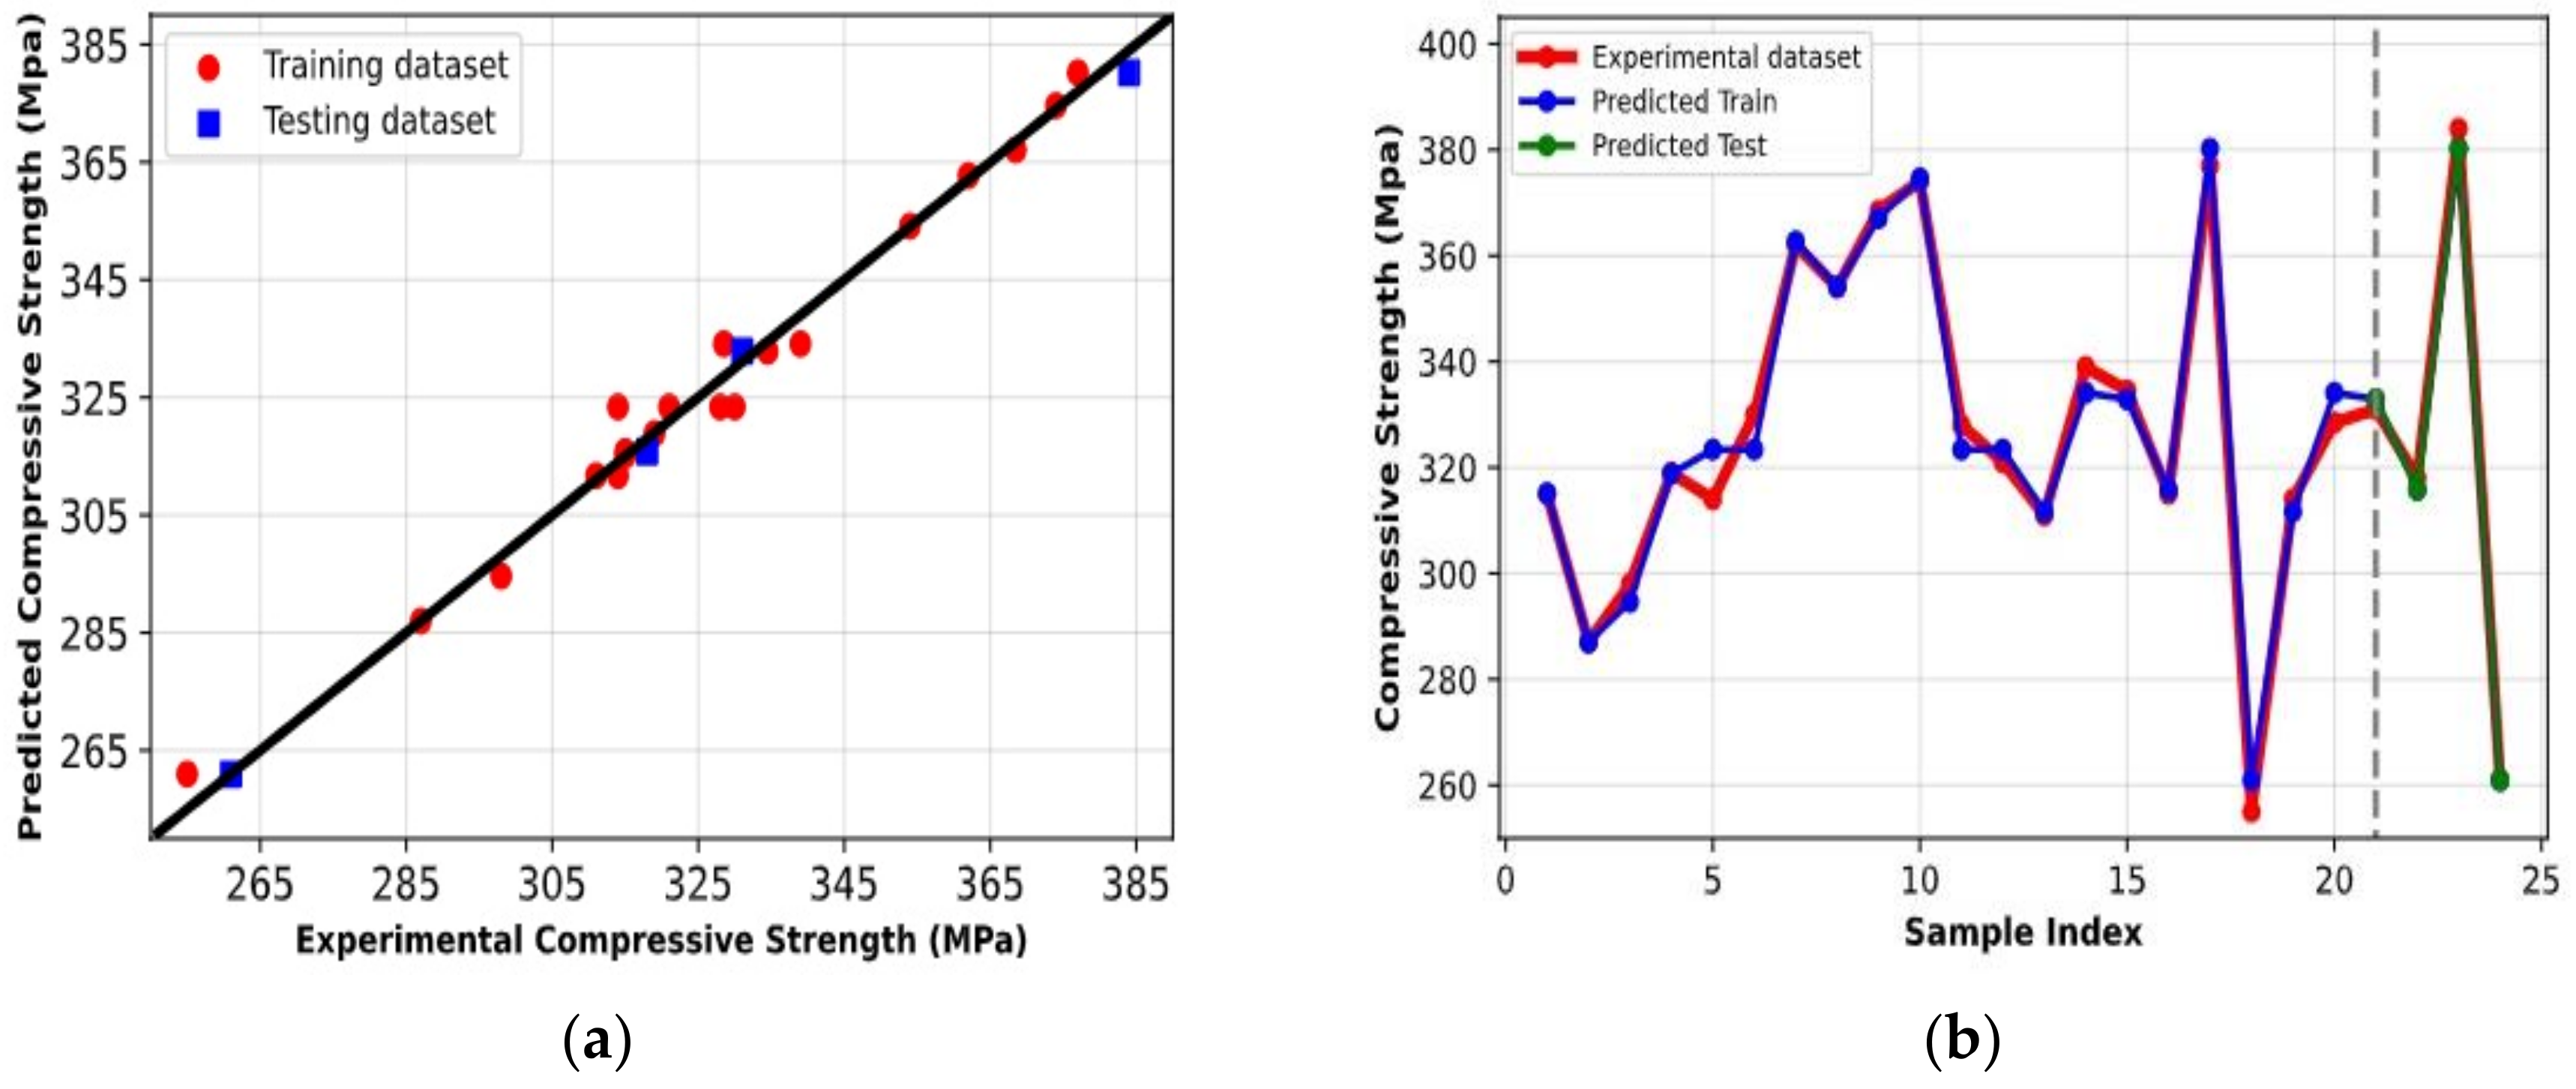
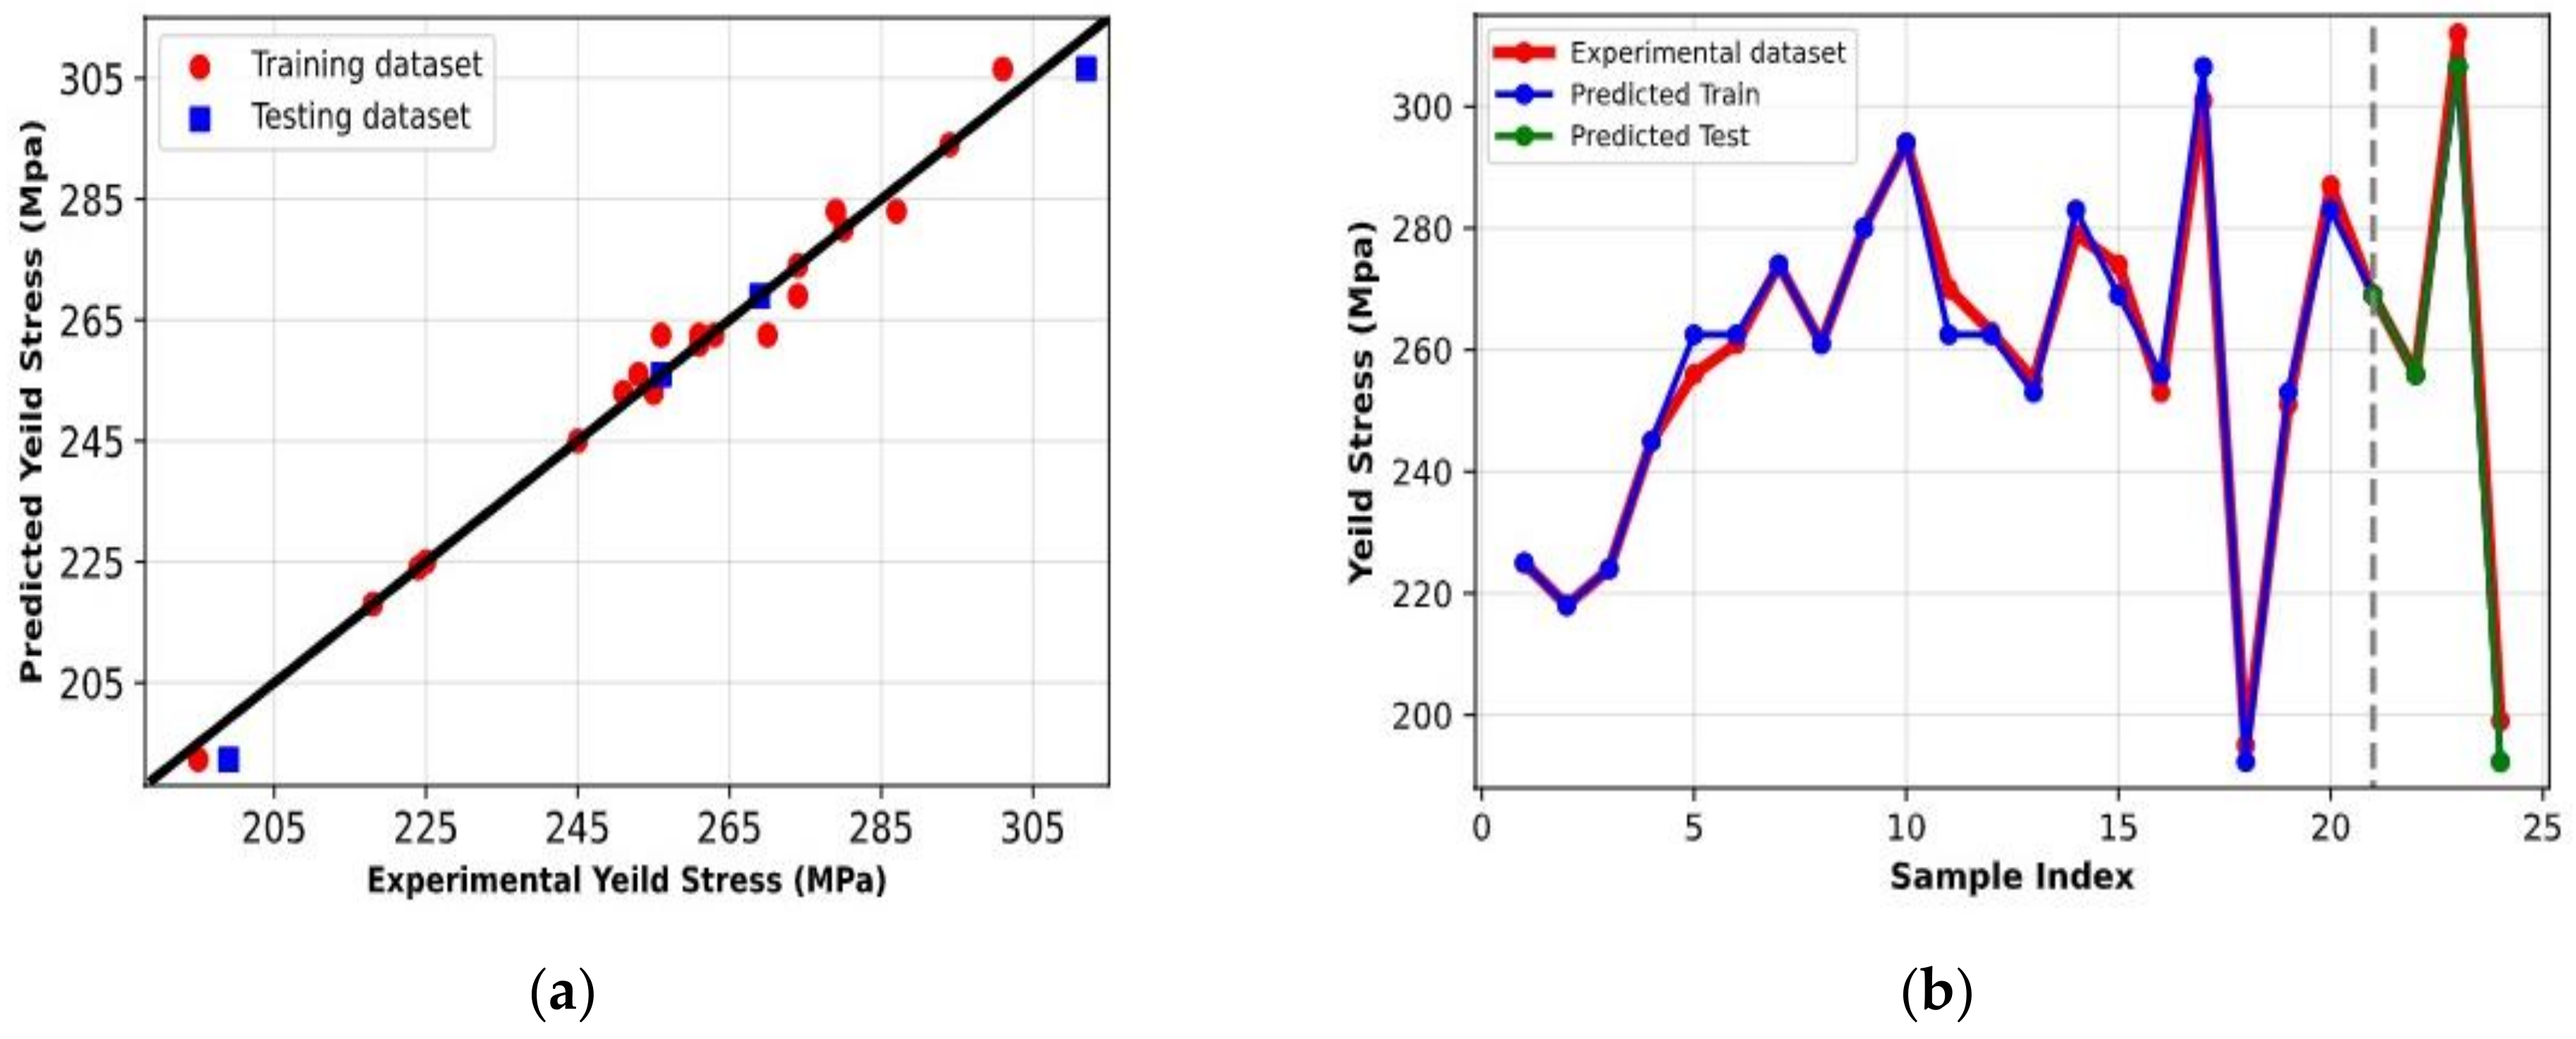
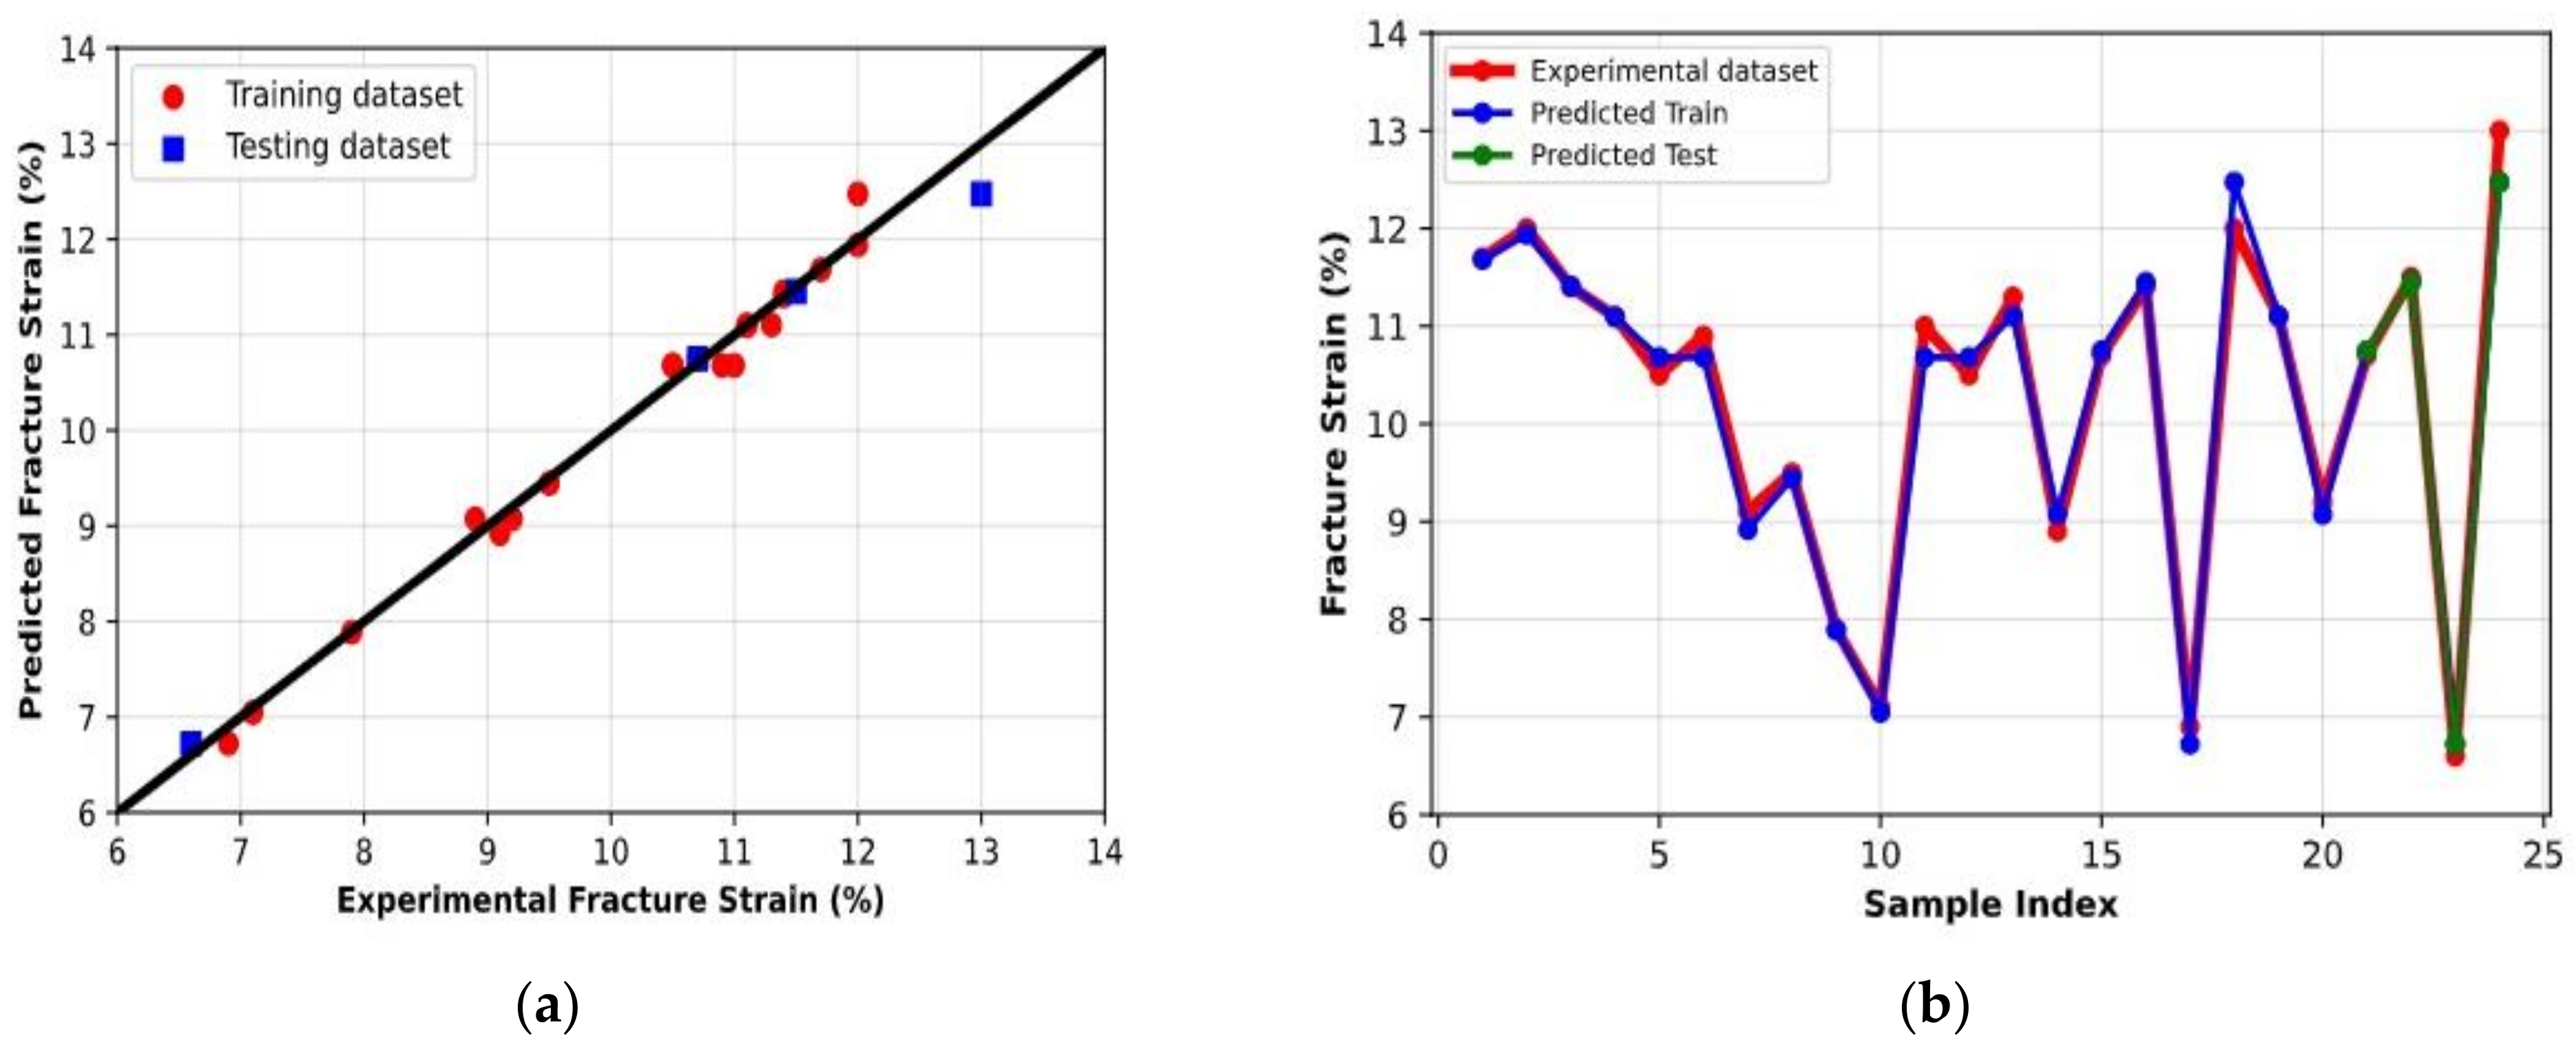
Figure 13, Figure 14 and Figure 15 display the results that were obtained from modeling the tensile properties of AMC. These results include the compressive strength, yield strength, and fracture strain. The results show that there was a significant correlation between the dataset that was predicted and the actual dataset that was collected from the studies. The RMSE and R2 scores shown in Table 7 demonstrate that the tuned ANN with two hidden layers and an activation function of ReLu produced the best results. The ideal RMSE and R2 values for the εf (%) parameter were 0.2 and 0.98, respectively, for the training set; for the testing set, these values were 0.2 and 1. Moreover, the ideal RMSE and R2 values for the σc parameter were 3.58 and 0.98, respectively, for the training set; for the testing set, these values were 4.55 and 0.98. Additionally, the ideal RMSE and R2 values for the σy parameter were 3.17 and 0.98, respectively, for the training set; for the testing set, these values were 5.19 and 0.99. The vast majority of the applied algorithms demonstrated successful performance throughout the data training and testing processes. The experimental and anticipated results for the mechanical properties of AMC are compared in Table 8, which shows the differences in error that existed between the two sets of data.

3.3.2. Regression Models and 3D Plots of Compression Distribution

Inverse models, found in Equations (7)–(9), were used to express the mechanical properties, which included the fracture strain, yield strength, and compression strength. All of the regression models were dependent on the amount of pressure (P), the H/D ratio, and the wt.% of Al2O3, as well as the interactions among these variables. In the present research, the R2 and adjusted R2 had values that were quite near the value of 1.
1 / σ y   =   +   0.005806     2.63547   ×   10 6   P   +   0.000546   H / D     0.000375   Al 2 O 3   +   1.14113   ×   10 6   P * H / D   +   8.67570   ×   10 8   P   ×   Al 2 O 3 0.000363   ( H / D ) 2   +   0.000014   ( Al 2 O 3 ) 2
1 / σ u c   =   +   0.004246     8.95796   ×   10 7   P   +   0.000528   H / D     0.000337   Al 2 O 3     5.56647   ×   10 7   P   ×   H / D   +   2.14145   ×   10 7   P   ×   Al 2 O 3 + 0.000013   ( H / D ) 2   +   6.77649   ×   10 6   ( Al 2 O 3 ) 2
1 / ε f   =   +   0.028701   +   0.000148   P     0.007163   H / D   +   0.004243   Al 2 O 3     0.000049   P   ×   H / D   +   7.19110   ×   10 6   P   ×   Al 2 O 3     0.008654   H / D   *   Al 2 O 3     7.28140   ×   10 8   P 2   +   0.023921   ( H / D ) 2   +   0.000835   ( Al 2 O 3 ) 2
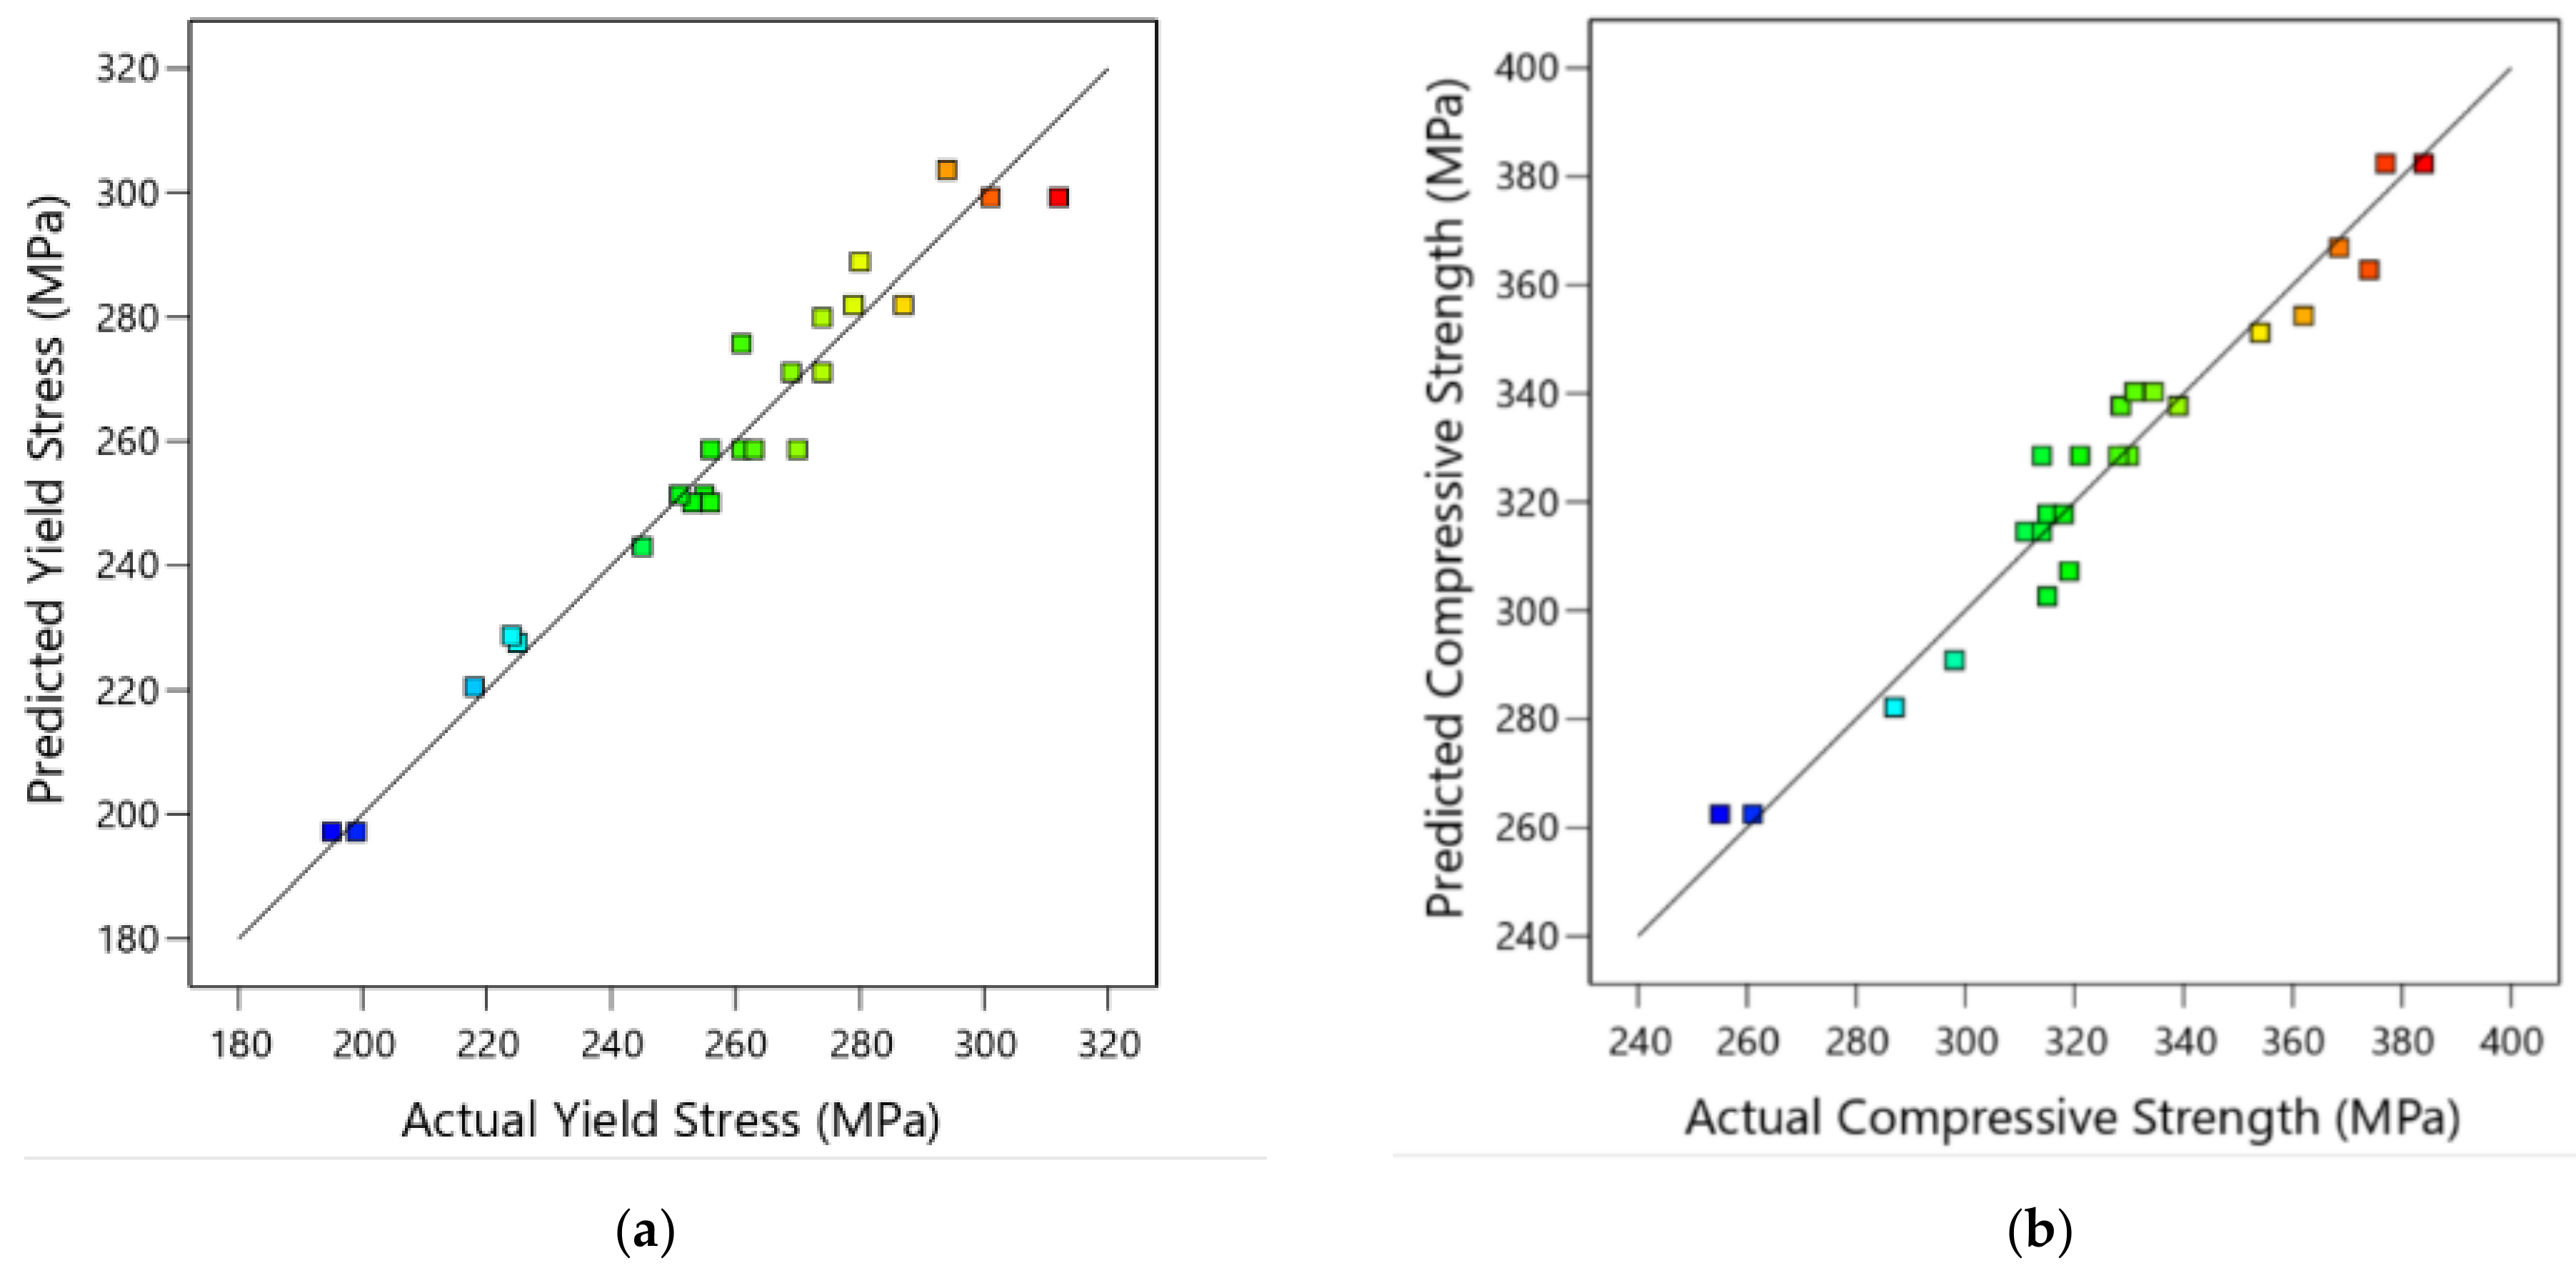
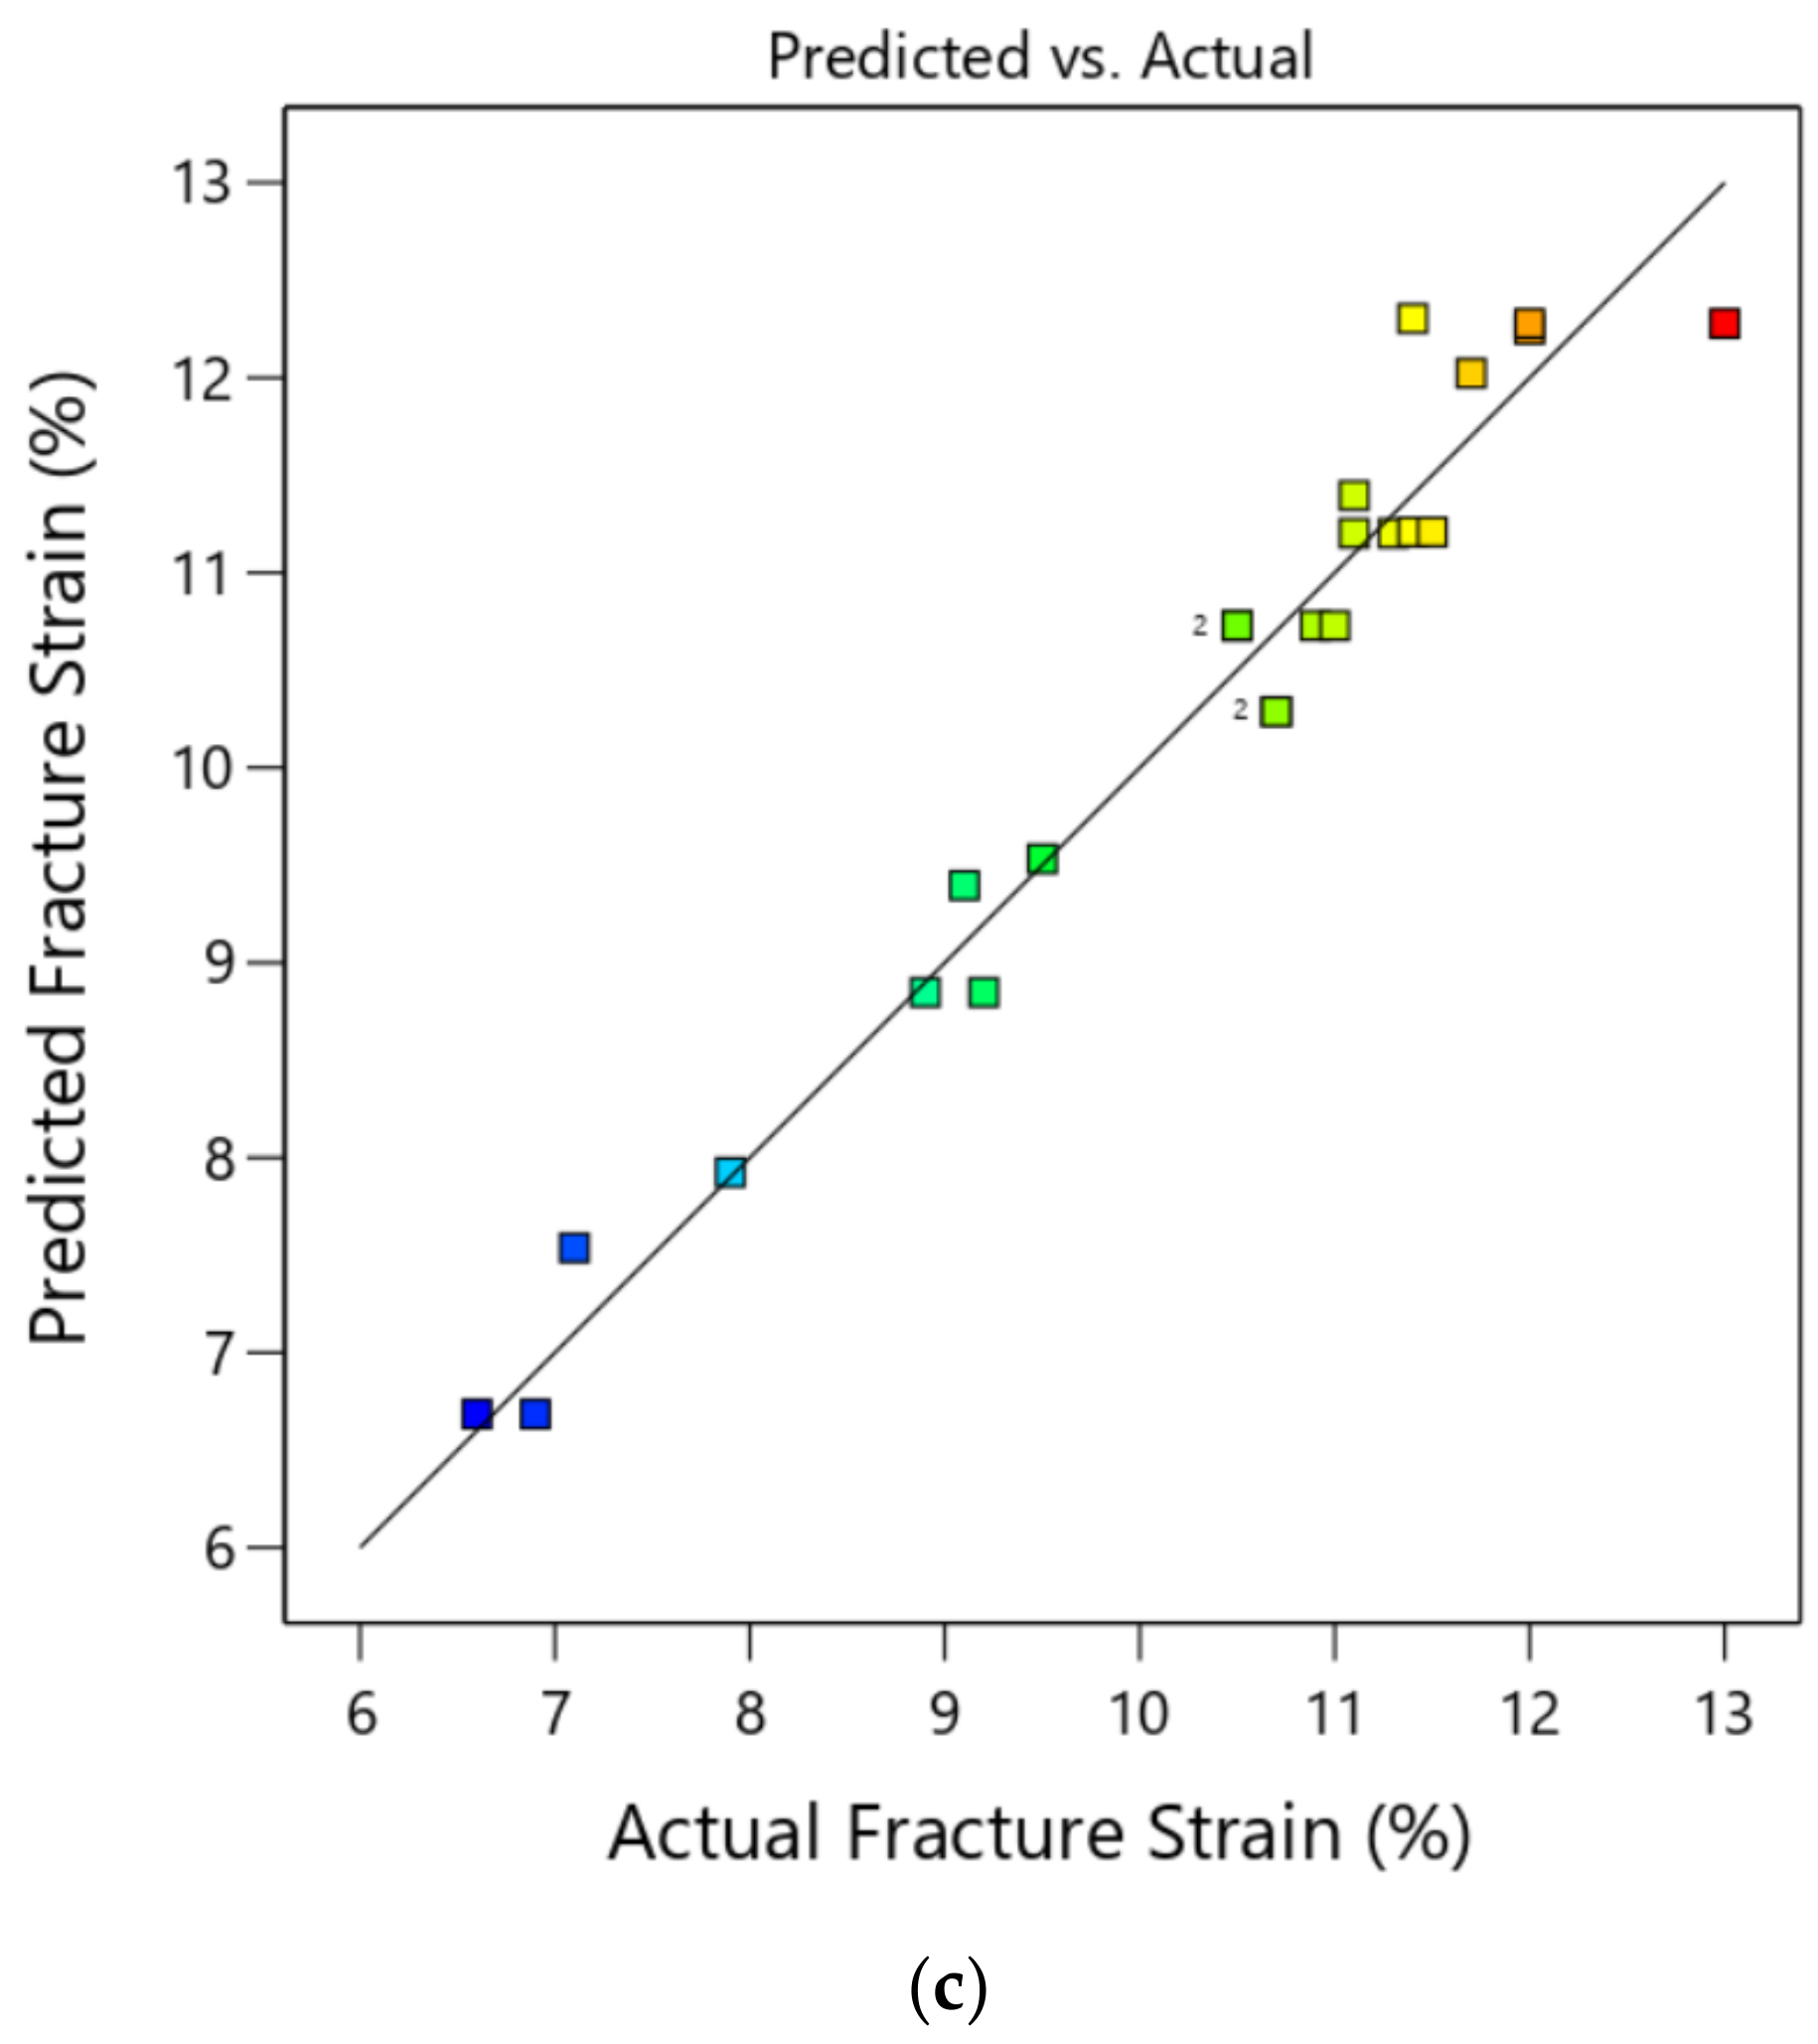
Figure 16 illustrates the relationship between the mechanical property results for the parameters of the Al-4Cu/(Al2O3)x composite and its corresponding anticipated values. It is obvious from these data that the suggested regression models were effective since the experimental and forecast values match up well. The following conclusion (Table 8) was drawn from the fact that the majority of the intersections among the experimental and predicted values are located near the median line.
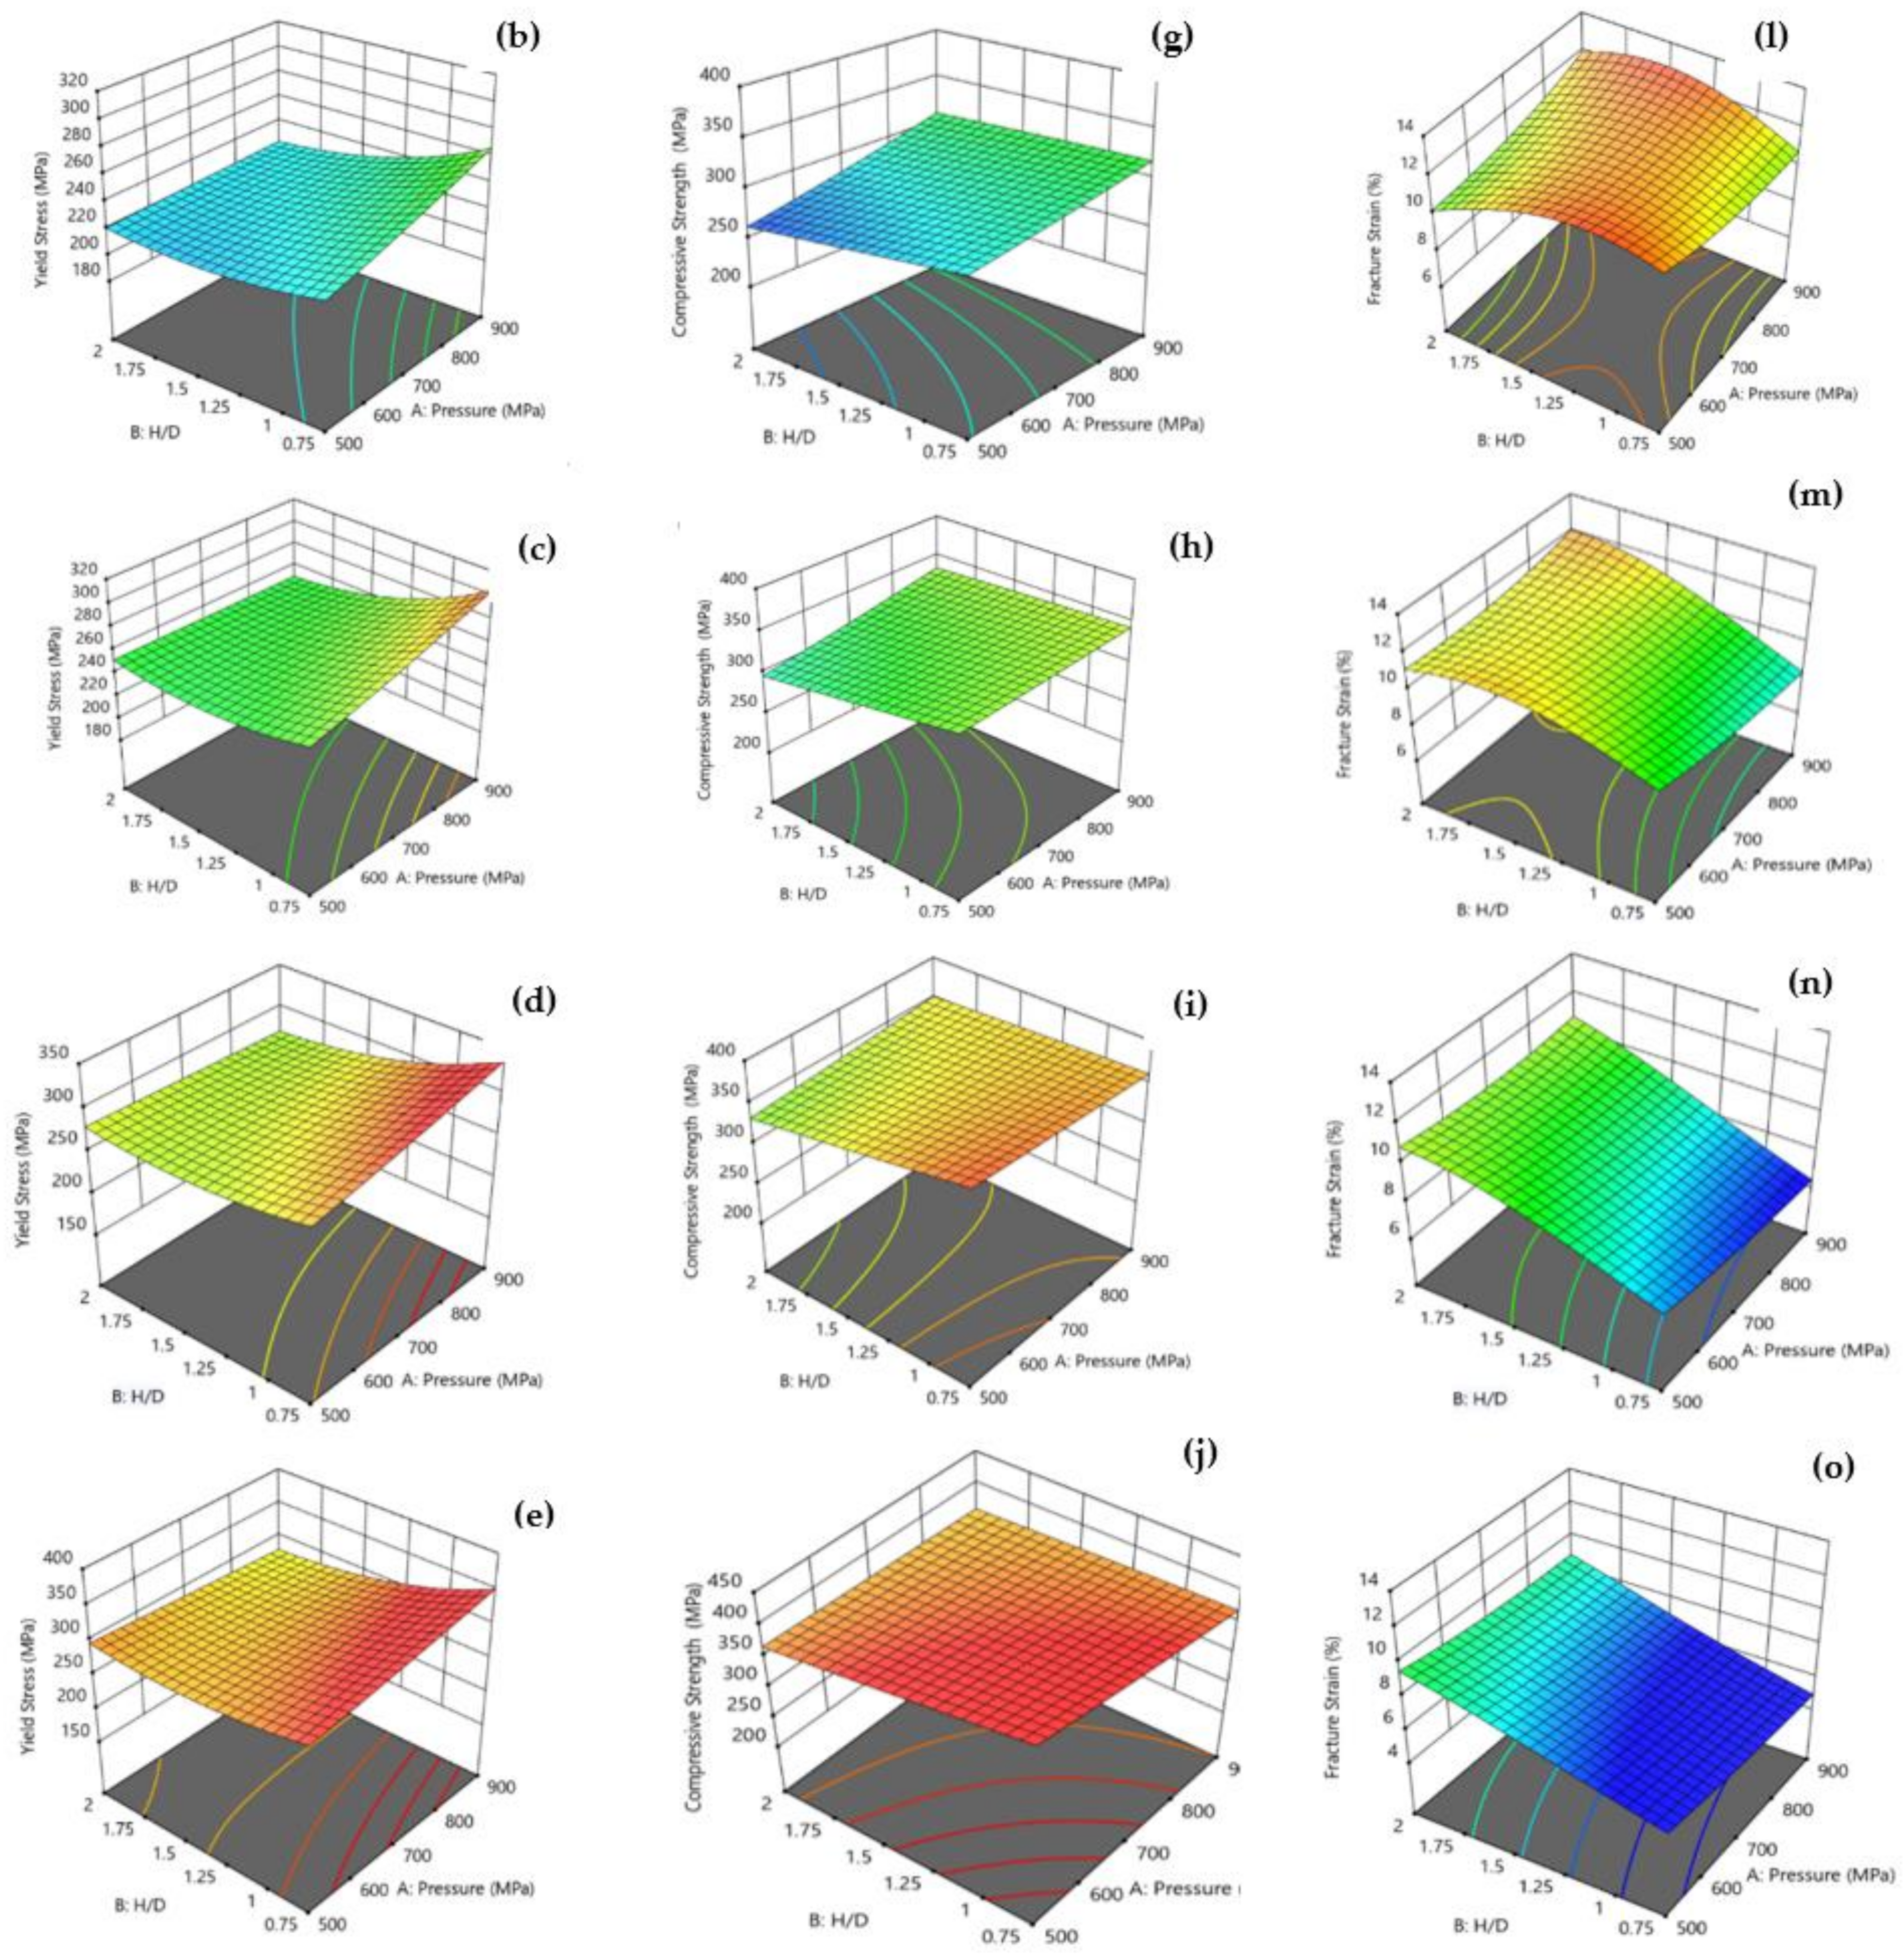
According to the regression models shown in Equations (7)–(9), Figure 17 illustrates the impact of the AMC parameters on the mechanical properties of yield strength, compression strength, and fracture strain. The AMC’s pressure and Al2O3% were observed to have a proportional relationship with the yield strength values, as shown in Figure 17a–e, while the slight decrease in the H/D showed an increase in the specimen’s yield strength. For all percentages of the Al2O3%, the maximum yield strength was attained at 900 MPa and a 0.75 H/D. Figure 17e illustrates the highest possible yield strength, determined using the regression model (Equation (7)), which was attained at 10 Al2O3%, 900 MPa, and a 0.75 H/D, with a value of 352 MPa, which was better than the yield strength obtained experimentally with a value of 312 MPa at 10 Al2O3%, 700 MPa, and a 1.25 H/D.
The interaction charts shown in Figure 17f–j indicate that the best compression strengths of all Al2O3% were discovered at a lower H/D. On the other hand, the effect of pressure on the compression strength was somewhat different. The maximum compression strength of 900 MPa was achieved with Al2O3% at concentrations ranging from 0% to 5%. Aside from that, the greatest compression strength was achieved at 500 MPa when there was 7.5% to 10% Al2O3 in the composition of the material. The best compression strength of 10% Al2O3, as determined by the regression model (Equation (8)), was 421 MPa and was achieved at 500 MPa and a 0.75 H/D, as shown in Figure 17j. This is superior to the compression strength that was obtained experimentally, which had a value of 384 MPa at 700 MPa, a 1.25 H/D, and 10% Al2O3.
Figure 17k–o illustrate the effect on the fracture strain that occurred as a result of modifying the AMC parameters, which were identified by regression models calculated by applying Equation (9). It was found that the fracture strain was inversely related to the pressure, H/D, and Al2O3%. Figure 17k depicts the maximum achievable fracture strain with a value of 13 approximately at 0% Al2O3, 500 MPa, and a 0.75 H/D, which was almost the same as that observed experimentally with a value of 13 at 700 MPa, a 1.25 H/D, and 0% Al2O3.

3.3.3. Optimization Results

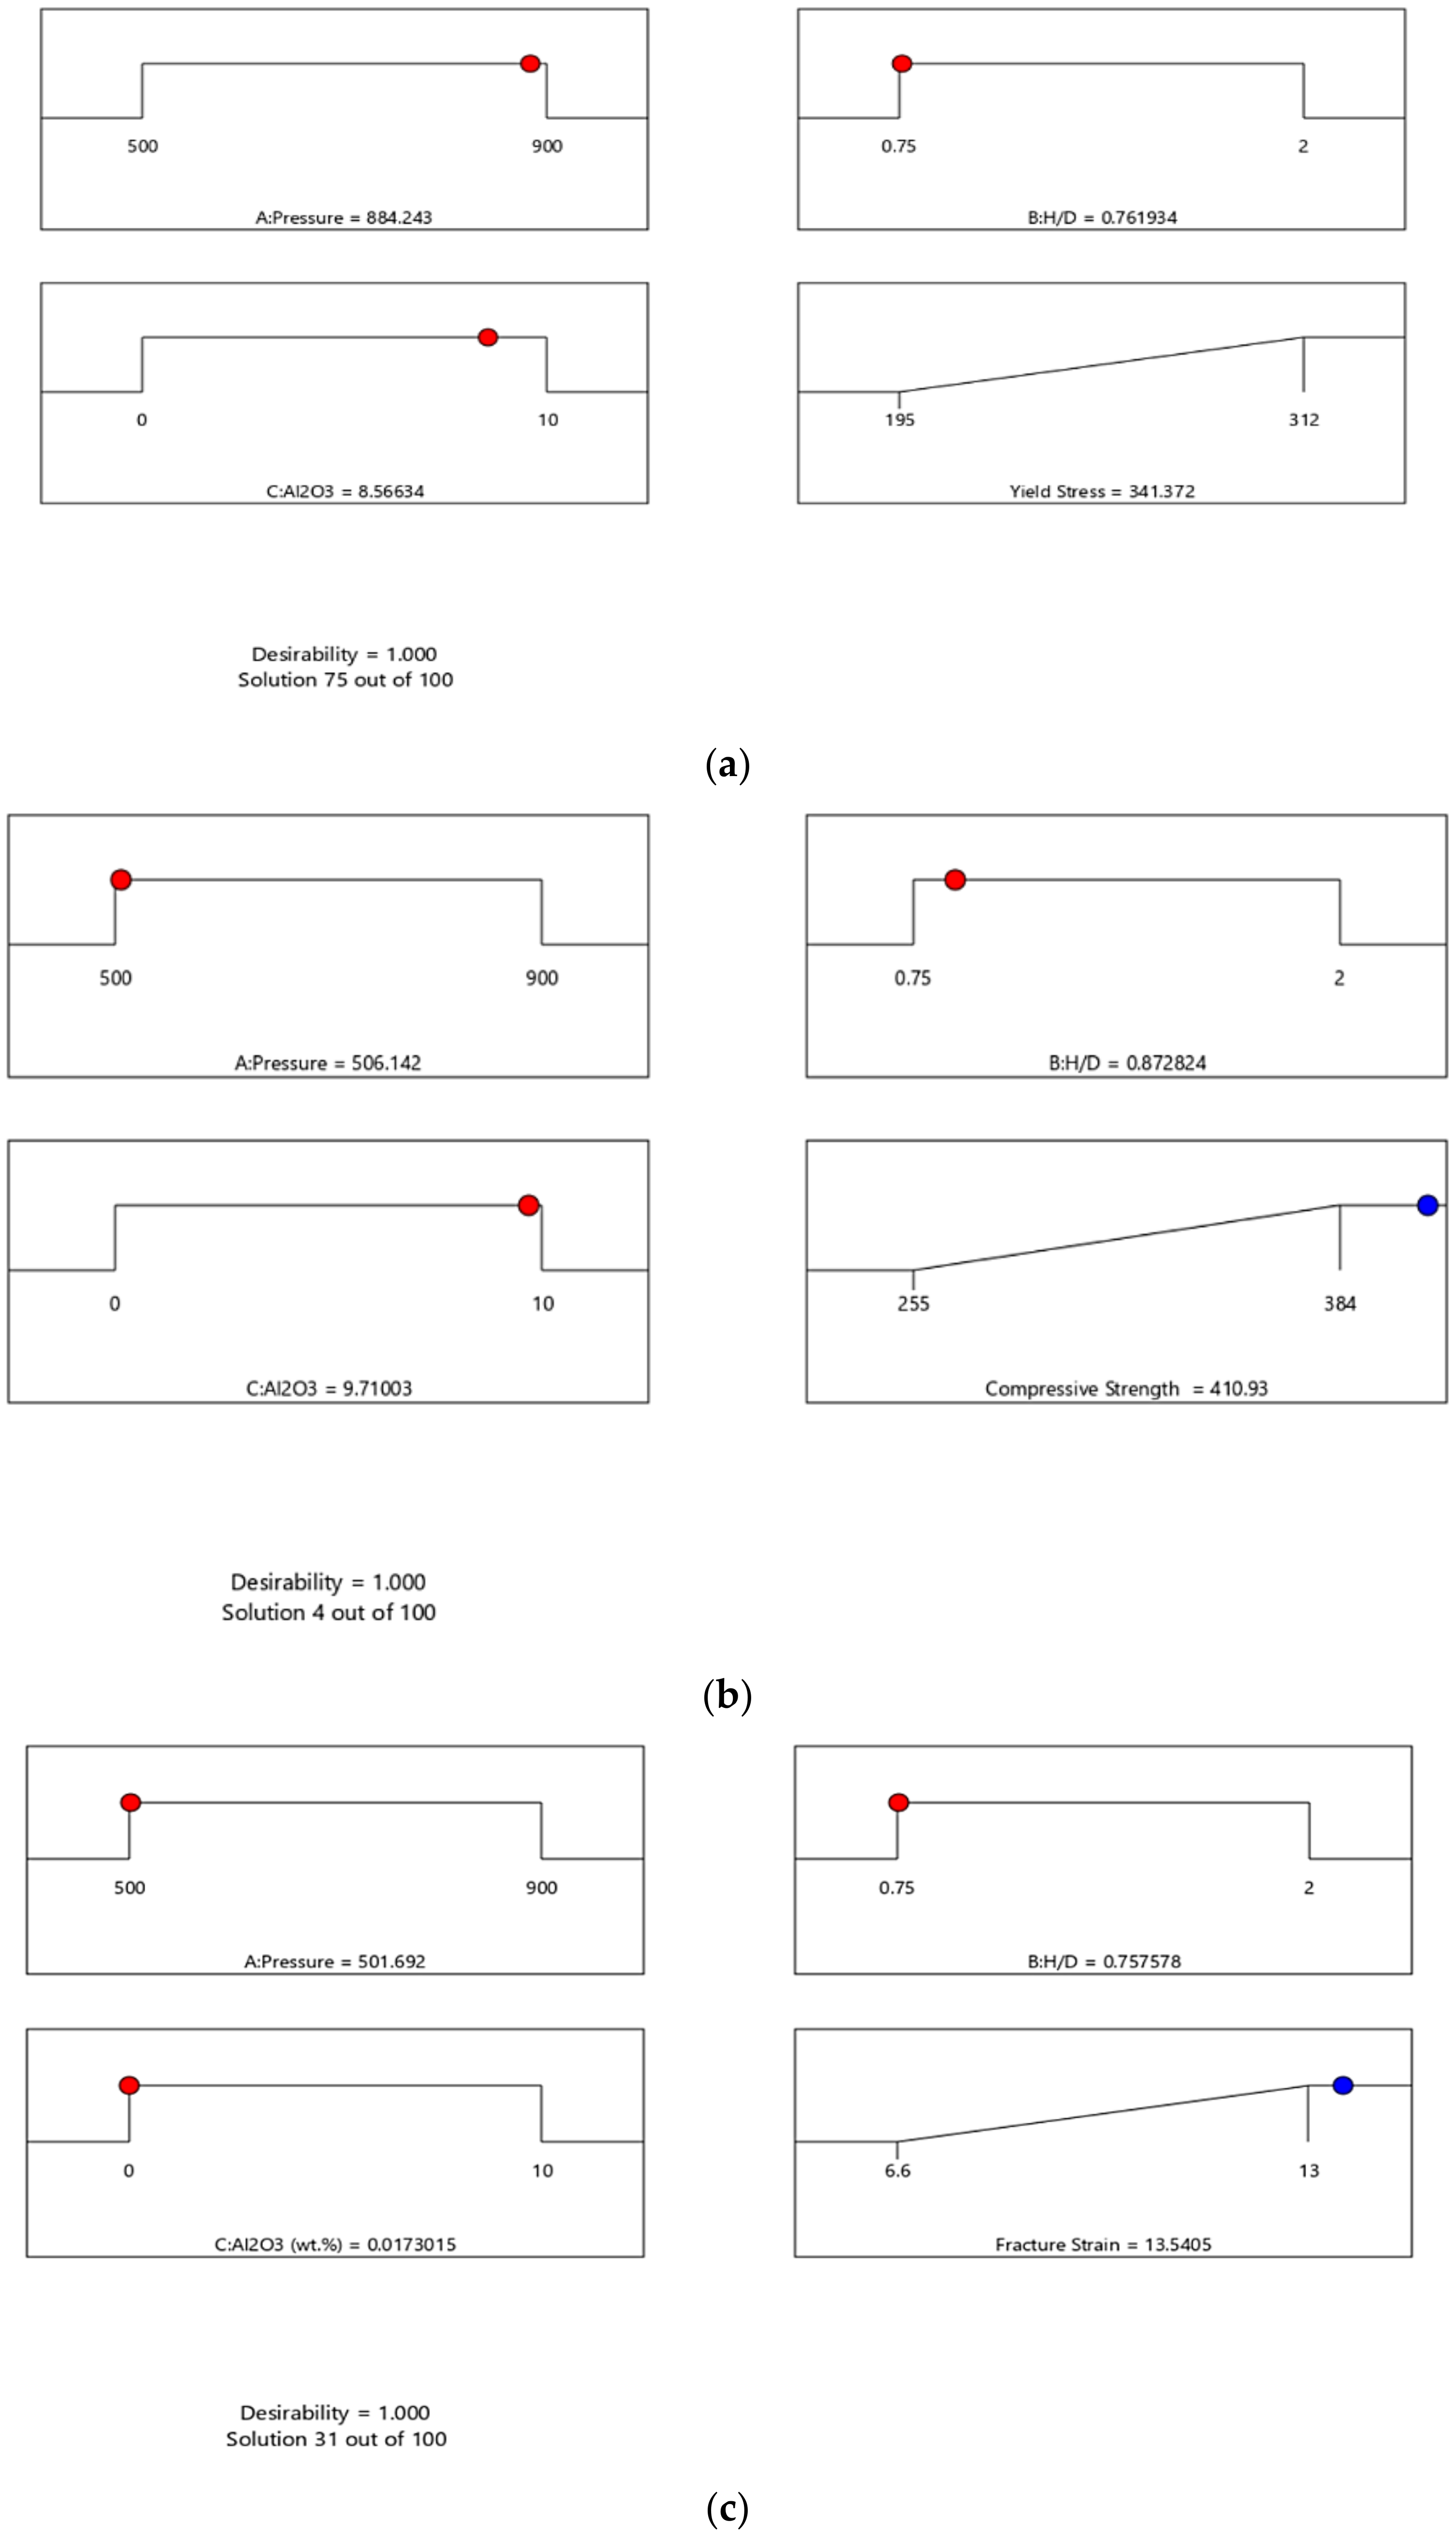
Figure 18 demonstrates the outcomes of the RSM optimization performed on the yield strength (Figure 18a), compression strength (Figure 18b), and fracture strain (Figure 18c), alongside the factors that were pertinent to this analysis. The optimization objective was configured to “in range,” using “maximize” as the solution destination, and the anticipated result of the desirability function was in the format of “larger-is-better” attributes. The optimal AMC conditions were found to be P (A) = 884.2 MPa, (B) H/D = 0.762, and (C) Al2O3% = 8.57% for the yield strength. This led to the highest value of 341.372 MPa for the yield strength. Additionally, for a maximum compression strength of 410.93 MPa, the appropriate AMC parameters were P (A) = 506.142 MPa, H/D (B) = 0.873, and Al2O3% (C) = 9.71%. Finally, the optimum fracture strain of 13.54 was reached at (A) P = 501.692 MPa, (B) H/D = 0.757, and (C) Al2O3% = 0.017%.
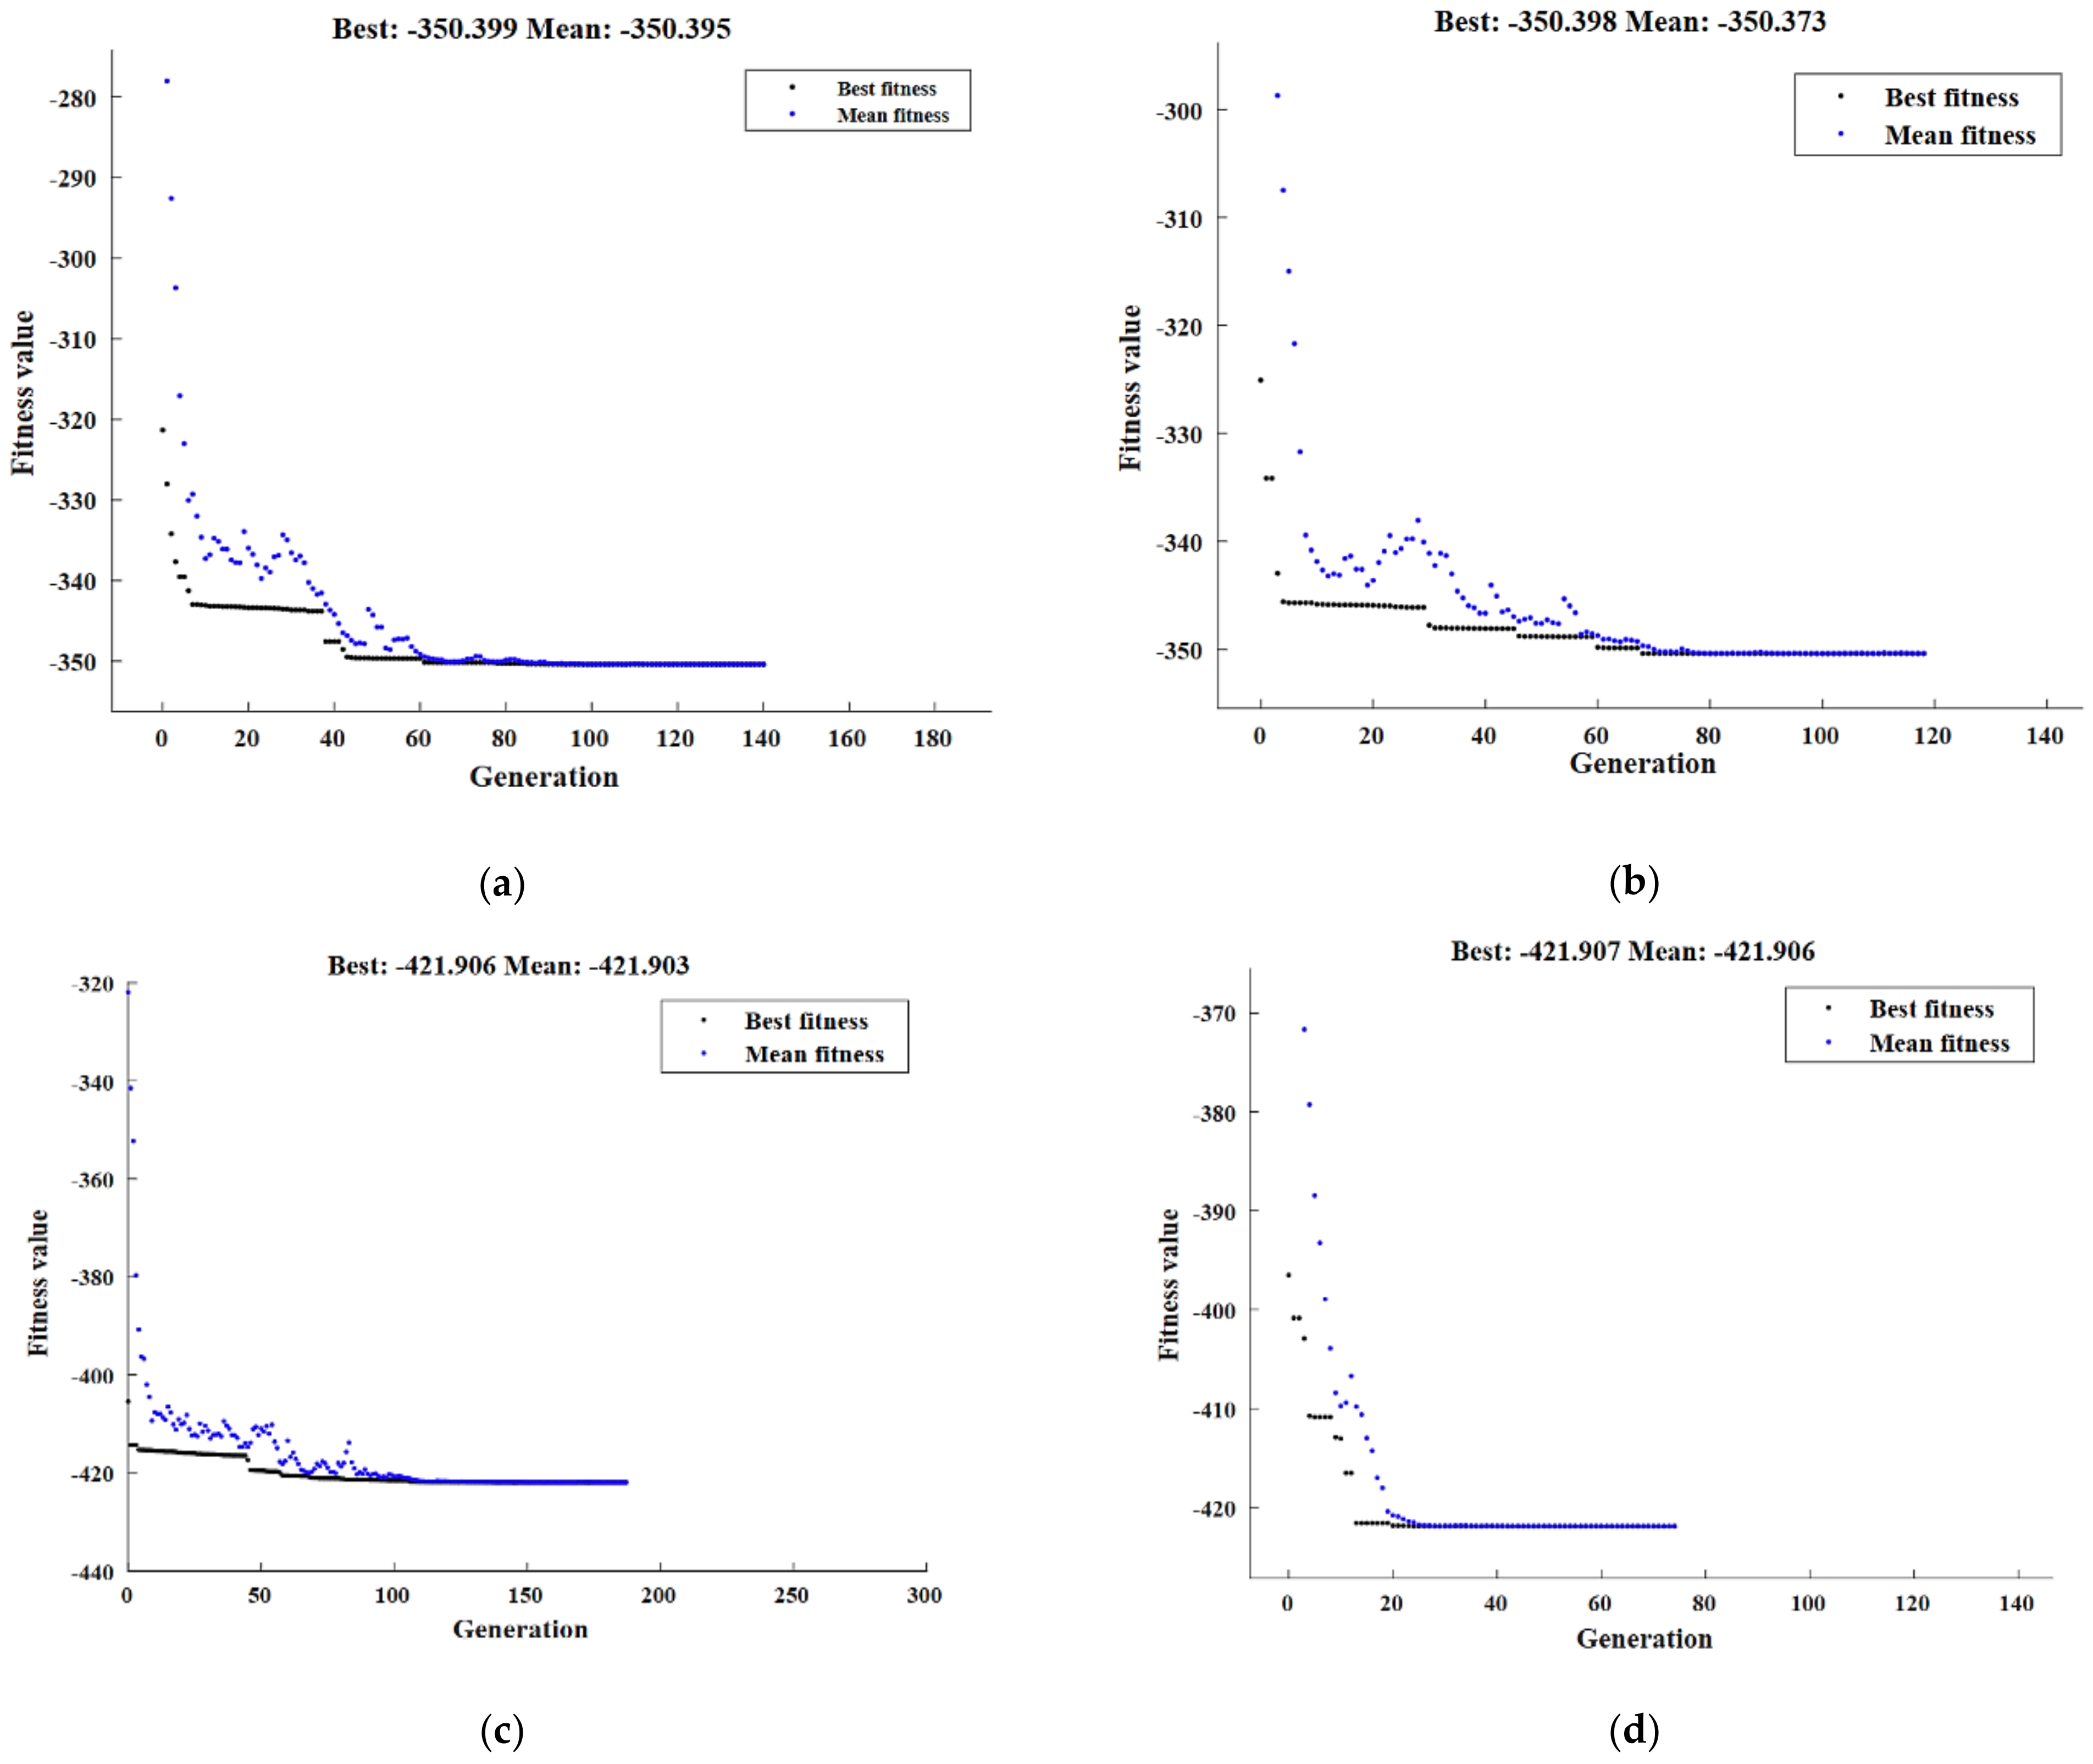
The AMC’s boundary condition, which acted as the fitness function, regulated the maximization of the mechanical properties outlined in Equations (7)–(9). According to the results of the GA, the optimal yield strength value was found to be 350.399 MPa, which was achieved at 900 MPa, a 0.75 H/D, and 10% Al2O3. The highest number for the GA’s estimation of the compression strength was 421.906 MPa at 500 MPa, a 0.75 H/D, and 10% Al2O3. The best fracture strain value was found to be 13.0851, and it was obtained at 501.12 MPa, a 0.758 H/D, and 0% Al2O3. This value is displayed in Figure 19a,c,e.
The hybrid DOE-GA data are displayed in Figure 19b, and they reveal that the greatest yield strength of 350.398 MPa was achieved at 900 MPa, a 0.75 H/D, and 10% Al2O3. Furthermore, the maximum possible value of compression strength was 421.906 MPa, which was achieved at 500 MPa, a 0.75 H/D, and 10% Al2O3, as illustrated in Figure 19d. As can be seen in Figure 19f, the maximum fracture strain was found to be 13.464 when the material was subjected to 510 MPa of pressure, a 0.75 H/D, and 0% Al2O3. Table 9 summarizes the comparison of the AMC response values of the experimental, RSM, GA and hybrid RSM-GA techniques.

4. Conclusions

This work presents a multi-perspective study of modeling the effects of various parameters of the Al-4Cu composite. The influence of the percentage of the Al2O3 reinforcement, the H/D ratio of the compacted samples, and the compaction pressure on the physical and mechanical properties of the composites were investigated using the ML, RSM, and GA methodologies. The ML and RSM models were both validated, and the accuracies of both types of models were evaluated and compared, revealing very close results to the experimental outcomes. The following conclusions can be drawn from this work:
  • The maximum RD obtained experimentally reached a value of 92.55% when the pressure was set at 700 MPa and the H/D was 1.25 for the Al-4Cu discs with no Al2O3;
  • The RSM optimization findings confirm the maximum value of 92.791% and led the optimal AMC conditions to be a pressure = 893.89 MPa, H/D = 0.854, and Al2O3% = 0.031%;
  • The outcomes of the RSM optimization performed on the hardness gave a maximum value of 121.199 Hv and led the optimal AMC conditions to be a pressure = 875.087 MPa, H/D = 0.87, and Al2O3% = 9.845%;
  • The best yield strength obtained experimentally had a value of 312 MPa at 10% Al2O3, 700 MPa, and a 1.25 H/D, whereas the best compression strength obtained experimentally had a value of 384 MPa at 10% Al2O3, 700 MPa, and a 1.25 H/D. Moreover, the maximum fracture strain obtained experimentally had a value of 13 at 700 MPa, a 1.25 H/D, and 0% Al2O3;
  • The outcomes of the RSM optimization performed on the yield strength gave a maximum value of 341.372 MPa and led the optimal AMC conditions to be a pressure = 884.2 MPa, H/D = 0.762, and Al2O3% = 8.57%;
  • The RSM optimization findings show a maximum value of the compressive strength of 410.93 MPa, which led the optimal AMC conditions to be a pressure = 506.142 MPa, H/D = 0.873, and Al2O3% = 9.71%;
  • The outcomes of the RSM optimization performed on the fracture strain gave a maximum of 13.54 and led the optimal AMC conditions to be a pressure = 501.692 MPa, H/D = 0.757, and Al2O3% = 0.017%.

Author Contributions

Conceptualization, A.I.A. and W.H.E.-G.; methodology, H.K., S.E.-S. and S.E.; software, H.K. and M.F.A.; validation, H.K., S.E.-S. and M.K.; formal analysis, S.E., H.K., S.E.-S. and M.K.; investigation, M.O.A. and A.B.; resources, S.E., A.N. and W.H.E.-G.; data curation, A.N.; writing—original draft preparation, S.E., S.E.-S. and M.F.A.; writing—review and editing, S.E., S.E.-S., M.K. and W.H.E.-G.; visualization, M.O.A. and A.B.; supervision, A.I.A., A.N. and W.H.E.-G.; project administration, A.I.A., W.H.E.-G. and M.O.A. All authors have read and agreed to the published version of the manuscript.

Funding

This research received no external funding.

Institutional Review Board Statement

Not applicable.

Informed Consent Statement

Not applicable.

Data Availability Statement

All of the raw data supporting the conclusion of this paper were provided by the authors.

Acknowledgments

The researchers would like to thank the Deanship of Scientific Research, Qassim University, for funding the publication of this project.

Conflicts of Interest

The authors declare no conflict of interest.

Appendix A

Table A1. Experimental data used in the analysis.
Exp. No.Hardness
Hv
Yield Stress
σy
Compressive Strength σucFracture Strain
εf
RD (%)
169.522531511.790.15
2642182871289.65
36822429811.490.30
472.524531911.191.05
57425631410.590.44
677.526133010.990.67
788.52743629.188.25
8842613549.587.40
991280368.57.988.75
10992943747.189.55
11792703281190.85
127726332110.590.70
136925531111.388.05
14822793398.991.20
1586274334.510.791.08
166625331511.489.89
17105.53013776.985.90
18591952551292.00
196925131411.188.33
2080.5287328.59.290.92
218426933110.791.32
226825631811.590.05
231083123846.686.85
2457.51992611392.55

References

  1. Rajan, K. Materials informatics. Mater. Today 2005, 8, 38–45. [Google Scholar] [CrossRef]
  2. Goulding, A.N.; Leung, J.F.W.; Neu, R.W. Communicating Materials Systems Knowledge through Processing-Structure-Properties-Performance (PSPP) Maps; Georgia Institute of Technology: Atlanta, GA, USA, 2018. [Google Scholar]
  3. Koli, D.K.; Agnihotri, G.; Purohit, R. A Review on Properties, Behaviour and Processing Methods for Al- Nano Al2O3 Composites. Procedia Mater. Sci. 2014, 6, 567–589. [Google Scholar] [CrossRef] [Green Version]
  4. Gireesh, C.H.; Prasad, K.D.; Ramji, K.; Vinay, P. Mechanical Characterization of Aluminium Metal Matrix Composite Reinforced with Aloe vera powder. Mater. Today Proc. 2018, 5, 3289–3297. [Google Scholar] [CrossRef]
  5. Miracle, D. Metal matrix composites—From science to technological significance. Compos. Sci. Technol. 2005, 65, 2526–2540. [Google Scholar] [CrossRef]
  6. Kai, X.; Li, Z.; Fan, G.; Guo, Q.; Tan, Z.; Zhang, W.; Su, Y.; Lu, W.; Moon, W.-J.; Zhang, D. Strong and ductile particulate reinforced ultrafine-grained metallic composites fabricated by flake powder metallurgy. Scr. Mater. 2013, 68, 555–558. [Google Scholar] [CrossRef]
  7. Asgharzadeh, H.; Sedigh, M. Synthesis and mechanical properties of Al matrix composites reinforced with few-layer graphene and graphene oxide. J. Alloy. Compd. 2017, 728, 47–62. [Google Scholar] [CrossRef]
  8. Nassef, A.; El-Garaihy, W.H.; El-Hadek, M. Mechanical and Corrosion Behavior of Al-Zn-Cr Family Alloys. Metals 2017, 7, 171. [Google Scholar] [CrossRef] [Green Version]
  9. Nassef, A.; El-Garaihy, W.H.; El-Hadek, M. Characteristics of Cold and Hot Pressed Iron Aluminum Powder Metallurgical Alloys. Metals 2017, 7, 170. [Google Scholar] [CrossRef] [Green Version]
  10. El-Garaihy, W.; El Rassoul, E.-S.A.; Al Ateyah, A.; Alaskari, A.M.; Oraby, S. Data Manipulation Approach and Parameters Interrelationships of the High-Pressure Torsion for AA6061-15%SiCp Composite. SAE Int. J. Mater. Manuf. 2018, 11, 167–182. [Google Scholar] [CrossRef]
  11. Aljohani, T.A.; Alawad, M.O.; Elkatatny, S.; Alateyah, A.I.; Bin Rubayan, M.T.; Alhajji, M.A.; AlBeladi, M.I.; Khoshnaw, F.; El-Garaihy, W.H. Electrochemical Behavior of SiC-Coated AA2014 Alloy through Plasma Electrolytic Oxidation. Materials 2022, 15, 3724. [Google Scholar] [CrossRef]
  12. Seleman, M.M.E.; Ahmed, M.M.Z.; Ataya, S.; Mohamed, M. El-Sayed Seleman, Mohamed, M.Z.; Ahmed, S.A. Microstructure and Mechanical Properties of Hot Extruded 6016 Aluminum Alloy/Graphite Composites. J. Mater. Sci. Technol. 2018, 34, 1580–1591. [Google Scholar] [CrossRef]
  13. Kaykılarlı, C.; Küçükelyas, B.; Akçamlı, N.; Uzunsoy, D.; Cansever, N. Processing and Characterization of Al-4Cu Matrix Composites Reinforced with Few Layered Graphene. Trans. Indian Inst. Met. 2022, 75, 2379–2388. [Google Scholar] [CrossRef]
  14. Gökçe, A.; Findik, F.; Kurt, A.O. Effects of Sintering Temperature and Time on the Properties of Al-Cu PM Alloy. Pract. Metallogr. 2017, 54, 533–551. [Google Scholar] [CrossRef]
  15. El-Katatny, S.M.; Nassef, A.E.; El-Domiaty, A.; El-Garaihy, W.H. Fundamental analysis of cold die compaction of reinforced aluminum powder. Int. J. Eng. Tech. Res. 2015, 3, 180–184. [Google Scholar]
  16. Wolla, D.W.; Davidson, M.J.; Khanra, A. Studies on the formability of powder metallurgical aluminum–copper composite. Mater. Des. 2014, 59, 151–159. [Google Scholar] [CrossRef]
  17. Seleman, M.M.E.-S.; Ataya, S.; Ahmed, M.M.Z.; Hassan, A.M.M.; Latief, F.H.; Hajlaoui, K.; El-Nikhaily, A.E.; Habba, M.I.A. The Additive Manufacturing of Aluminum Matrix Nano Al2O3 Composites Produced via Friction Stir Deposition Using Different Initial Material Conditions. Materials 2022, 15, 2926. [Google Scholar] [CrossRef]
  18. Kumar, A.; Gautam, R.K.; Tyagi, R. Dry sliding wear characteristics of in situ synthesized Al-TiC composites. Compos. Interfaces 2016, 23, 469–480. [Google Scholar] [CrossRef]
  19. Seydibeyoglu, M.O.; Dispinar, D.; Aybarc, U. Aluminum Metal Matrix Composites with SiC, Al2O3 and Graphene—Review. Arch. Foundry Eng. 2018, 18, 5–10. [Google Scholar]
  20. Rohatgi, P.K.; Kumar, P.A.; Chelliah, N.M.; Rajan, T.P.D. Solidification Processing of Cast Metal Matrix Composites Over the Last 50 Years and Opportunities for the Future. JOM 2020, 72, 2912–2926. [Google Scholar] [CrossRef]
  21. Ae, N. Application of Response Surface Methodology in Optimizing the Cold Compaction Parameters of Al-4Cu-xAl2O3 Composites. Adv. Metall. Mater. Eng. 2019, 2, 71–80. [Google Scholar]
  22. Butler, K.T.; Davies, D.W.; Cartwright, H.; Isayev, O.; Walsh, A. Machine learning for molecular and materials science. Nature 2018, 559, 547–555. [Google Scholar] [CrossRef] [PubMed] [Green Version]
  23. Mahmoud, S.M.A.S.; Faraji, G.; Baghani, M.; Hashemi, M.S.; Sheidaei, A.; Baniassadi, M. Design of Refractory Alloys for Desired Thermal Conductivity via AI-Assisted In-Silico Microstructure Realization. Materials 2023, 16, 1088. [Google Scholar] [CrossRef] [PubMed]
  24. Kordijazi, A.; Zhao, T.; Zhang, J.; Alrfou, K.; Rohatgi, P. A Review of Application of Machine Learning in Design, Synthesis, and Characterization of Metal Matrix Composites: Current Status and Emerging Applications. JOM 2021, 73, 2060–2074. [Google Scholar] [CrossRef]
  25. Shen, C.; Wang, C.; Wei, X.; Li, Y.; van der Zwaag, S.; Xu, W. Physical metallurgy-guided machine learning and artificial intelligent design of ultrahigh-strength stainless steel. Acta Mater. 2019, 179, 201–214. [Google Scholar] [CrossRef]
  26. Stricker, M.; Yin, B.; Mak, E.; Curtin, W.A. Machine learning for metallurgy II. A neural-network potential for magnesium. Phys. Rev. Mater. 2020, 4, 103602. [Google Scholar] [CrossRef]
  27. Shaban, M.; Alateyah, A.I.; Alsharekh, M.F.; Alawad, M.O.; BaQais, A.; Kamel, M.; Alsunaydih, F.N.; El-Garaihy, W.H.; Salem, H.G. Influence of ECAP Parameters on the Structural, Electrochemical and Mechanical Behavior of ZK30: A Combination of Experimental and Machine Learning Approaches. J. Manuf. Mater. Process. 2023, 7, 52. [Google Scholar] [CrossRef]
  28. Shaban, M.; Alsharekh, M.F.; Alsunaydih, F.N.; Alateyah, A.I.; Alawad, M.O.; BaQais, A.; Kamel, M.; Nassef, A.; El-Hadek, M.A.; El-Garaihy, W.H. Investigation of the Effect of ECAP Parameters on Hardness, Tensile Properties, Impact Toughness, and Electrical Conductivity of Pure Cu through Machine Learning Predictive Models. Materials 2022, 15, 9032. [Google Scholar] [CrossRef]
  29. Marchand, D.; Curtin, W.A. Machine learning for metallurgy IV: A neural network potential for Al-Cu-Mg and Al-Cu-Mg-Zn. Phys. Rev. Mater. 2022, 6, 053803. [Google Scholar] [CrossRef]
  30. Kamal, T.; Gouthama; Upadhyaya, A. Machine Learning Based Sintered Density Prediction of Bronze Processed by Powder Metallurgy Route. Met. Mater. Int. 2022, 29, 1761–1774. [Google Scholar] [CrossRef]
  31. Harsha, N.; Raju, K.S.R.; Ramana, V.V.; Reddy, V. Fabrication and prediction of tensile strength of Al-Al2O3 nano composites. Mater. Today Proc. 2019, 18, 2197–2200. [Google Scholar] [CrossRef]
  32. Banerjee, T.; Dey, S.; Sekhar, A.P.; Datta, S.; Das, D. Design of Alumina Reinforced Aluminium Alloy Composites with Improved Tribo-Mechanical Properties: A Machine Learning Approach. Trans. Indian Inst. Met. 2020, 73, 3059–3069. [Google Scholar] [CrossRef]
  33. Jokhio, M.H.; Panhwer, M.I.; Unar, M.A. Modeling Mechanical Properties of Aluminum Composite Produced Using Stir Casting Method. arXiv 2016, arXiv:1605.09691. [Google Scholar] [CrossRef]
  34. Adithiyaa, T.; Chandramohan, D.; Sathish, T. Optimal prediction of process parameters by GWO-KNN in stirring-squeeze casting of AA2219 reinforced metal matrix composites. Mater. Today Proc. 2019, 21, 1000–1007. [Google Scholar] [CrossRef]
  35. Shabani, M.O.; Mazahery, A. Artificial Intelligence in numerical modeling of nano sized ceramic particulates reinforced metal matrix composites. Appl. Math. Model. 2012, 36, 5455–5465. [Google Scholar] [CrossRef]
  36. Razli, P.; Povezav, N.U.N.; Izdelavi, P.M.I.E. The performance of various artificial neurons interconnections in the modelling and experimental manufacturing of the composites. Mater. Tehnol. 2012, 46, 109–113. [Google Scholar]
  37. Natrayan, L.; Kumar, M.S. An integrated artificial neural network and Taguchi approach to optimize the squeeze cast process parameters of AA6061/Al2O3/SiC/Gr hybrid composites prepared by novel encapsulation feeding technique. Mater. Today Commun. 2020, 25, 101586. [Google Scholar] [CrossRef]
  38. Altinkok, N.; Koker, R. Neural network approach to prediction of bending strength and hardening behaviour of particulate reinforced (Al–Si–Mg)-aluminium matrix composites. Mater. Des. 2004, 25, 595–602. [Google Scholar] [CrossRef]
  39. Koker, R.; Altinkok, N.; Demir, A. Neural network based prediction of mechanical properties of particulate reinforced metal matrix composites using various training algorithms. Mater. Des. 2007, 28, 616–627. [Google Scholar] [CrossRef]
  40. Ghaedi, M.; Azad, F.N.; Dashtian, K.; Hajati, S.; Goudarzi, A.; Soylak, M. Central composite design and genetic algorithm applied for the optimization of ultrasonic-assisted removal of malachite green by ZnO Nanorod-loaded activated carbon. Spectrochim. Acta Part A Mol. Biomol. Spectrosc. 2016, 167, 157–164. [Google Scholar] [CrossRef] [PubMed]
  41. Alateyah, A.I.; El-Garaihy, W.H.; Alawad, M.O.; El Sanabary, S.; Elkatatny, S.; Dahish, H.A.; Kouta, H. The Effect of ECAP Processing Conditions on Microstructural Evolution and Mechanical Properties of Pure Magnesium—Experimental, Mathematical Empirical and Response Surface Approach. Materials 2022, 15, 5312. [Google Scholar] [CrossRef]
  42. Alawad, M.O.; Alateyah, A.I.; El-Garaihy, W.H.; BaQais, A.; Elkatatny, S.; Kouta, H.; Kamel, M.; El-Sanabary, S. Optimizing the ECAP Parameters of Biodegradable Mg-Zn-Zr Alloy Based on Experimental, Mathematical Empirical, and Response Surface Methodology. Materials 2022, 15, 7719. [Google Scholar] [CrossRef] [PubMed]
  43. Albaijan, I.; Ahmed, M.M.Z.; Seleman, M.M.E.-S.; Touileb, K.; Habba, M.I.A.; Fouad, R.A. Optimization of Bobbin Tool Friction Stir Processing Parameters of AA1050 Using Response Surface Methodology. Materials 2022, 15, 6886. [Google Scholar] [CrossRef] [PubMed]
  44. El-Garaihy, W.H.; Alaskari, A.M.; Ameshaiei, E.A.; Oraby, S.E. On the effect of HPT processing conditions on relative density, mechanical properties and microstructural evolution of hot compacted AA6061– mathematical empirical and response surface approach. Adv. Mater. Lett. 2017, 8, 620–628. [Google Scholar] [CrossRef]
  45. Alateyah, A.I.; El-Shenawy, M.; Nassef, A.; El-Hadek, M.; Ahmed, M.M.Z.; Kouta, H.; El Sanabary, S.; El-Garaihy, W.H. Optimizing the ECAP processing parameters of pure Cu through experimental, finite element, and response surface approaches. Rev. Adv. Mater. Sci. 2023, 62, 20220297. [Google Scholar] [CrossRef]
  46. El-Garaihy, W.H.; Oraby, S.E.; Rassoul, E.-S.M.A.; Salem, H.G. On the Effect of SiC Content and Processing Temperature on Relative Density and Hardness of Hot Compacted Aluminum AA6061 Composite—Mathematical Empirical and Response Surface Approach. J. Mater. Sci. Res. 2015, 4, p1. [Google Scholar] [CrossRef] [Green Version]
  47. Santhosh, A.J.; Tura, A.D.; Jiregna, I.T.; Gemechu, W.F.; Ashok, N.; Ponnusamy, M. Optimization of CNC turning parameters using face centred CCD approach in RSM and ANN-genetic algorithm for AISI 4340 alloy steel. Results Eng. 2021, 11, 100251. [Google Scholar] [CrossRef]
  48. Dadrasi, A.; Fooladpanjeh, S.; Gharahbagh, A.A. Interactions between HA/GO/epoxy resin nanocomposites: Optimization, modeling and mechanical performance using central composite design and genetic algorithm. J. Braz. Soc. Mech. Sci. Eng. 2019, 41, 63. [Google Scholar] [CrossRef]
  49. Nassef, A.E.; Alateyah, A.; El-Hadek, M.A.; El-Garaihy, W.H. Mechanical behavior and fracture surface characterization of liquid-phase sintered Cu-Sn powder alloys. Adv. Mater. Lett. 2017, 8, 717–722. [Google Scholar] [CrossRef]
  50. Alam, M.A.; Hamdan, H.Y.; Azeem, M.; Hussain, P.B.; bin Salit, M.S.; Khan, R.; Arif, S.; Ansari, A.H. Modelling and optimisation of hardness behaviour of sintered Al/SiC composites using RSM and ANN: A comparative study. J. Mater. Res. Technol. 2020, 9, 14036–14050. [Google Scholar] [CrossRef]
  51. Devaneyan, S.P.; Ganesh, R.; Senthilvelan, T. On the Mechanical Properties of Hybrid Aluminium 7075 Matrix Composite Material Reinforced with SiC and TiC Produced by Powder Metallurgy Method. Indian J. Mater. Sci. 2017, 2017, 3067257. [Google Scholar] [CrossRef] [Green Version]
  52. Dubey, V.; Sharma, A.K.; Pimenov, D.Y. Prediction of Surface Roughness Using Machine Learning Approach in MQL Turning of AISI 304 Steel by Varying Nanoparticle Size in the Cutting Fluid. Lubricants 2022, 10, 81. [Google Scholar] [CrossRef]
  53. Behbahani, R.; Sarvestani, H.Y.; Fatehi, E.; Kiyani, E.; Ashrafi, B.; Karttunen, M.; Rahmat, M. Machine learning-driven process of alumina ceramics laser machining. Phys. Scr. 2023, 98, 015834. [Google Scholar] [CrossRef]
  54. Kurdi, F.T.; Amakhchan, W.; Gharineiat, Z. Random Forest Machine Learning Technique for Automatic Vegetation Detection and Modelling in LiDAR Data. Int. J. Environ. Sci. Nat. Resour. 2021, 28, 556234. [Google Scholar] [CrossRef]
  55. Kouta, H.; Elsanabary, S.; Elhadek, M.; Elkaseer, A. FE Simulation of Inertia Friction Welding of Similar PVC-PVC and PA6-PA6 Hollow Cylinders for Process Optimization FE Simulation of Inertia Friction Welding of Similar PVC-PVC and PA6- PA6 Hollow Cylinders for Process Optimization. Sylwan 2020, 6, 407–428. [Google Scholar]
  56. Elattar, Y.M.; Mahdy, M.A.; Sonbol, H.A. Prediction of Abrasive Water Jet Cutting Parameters Using Artificial Neural Network. In The International Conference on Applied Mechanics and Mechanical Engineering, Proceedings of the 18th International Conference on Applied Mechanics and Mechanical Engineering, Cairo, Egypt, 3–5 April 2018; Military Technical College: Cairo, Egypt, 2018; Volume 18, pp. 1–14. [Google Scholar] [CrossRef]
  57. Djavanroodi, F.; Omranpour, B.; Sedighi, M. Artificial Neural Network Modeling of ECAP Process. Mater. Manuf. Process. 2013, 28, 276–281. [Google Scholar] [CrossRef]
  58. Hazir, E.; Ozcan, T. Response Surface Methodology Integrated with Desirability Function and Genetic Algorithm Approach for the Optimization of CNC Machining Parameters. Arab. J. Sci. Eng. 2018, 44, 2795–2809. [Google Scholar] [CrossRef]
  59. Choudhury, A.; Nanda, J.; Das, S.N. The effect of compaction pressure, sintering time, and temperature on the characterization of an aluminum/alumina composite with rising alumina proportions. Curr. Chem. Lett. 2023, 12, 305–316. [Google Scholar] [CrossRef]
  60. Mohanavel, V.; Ravichandran, M. Influence of AlN particles on microstructure, mechanical and tribological behaviour in AA6351 aluminum alloy. Mater. Res. Express 2019, 6, 106557. [Google Scholar] [CrossRef]
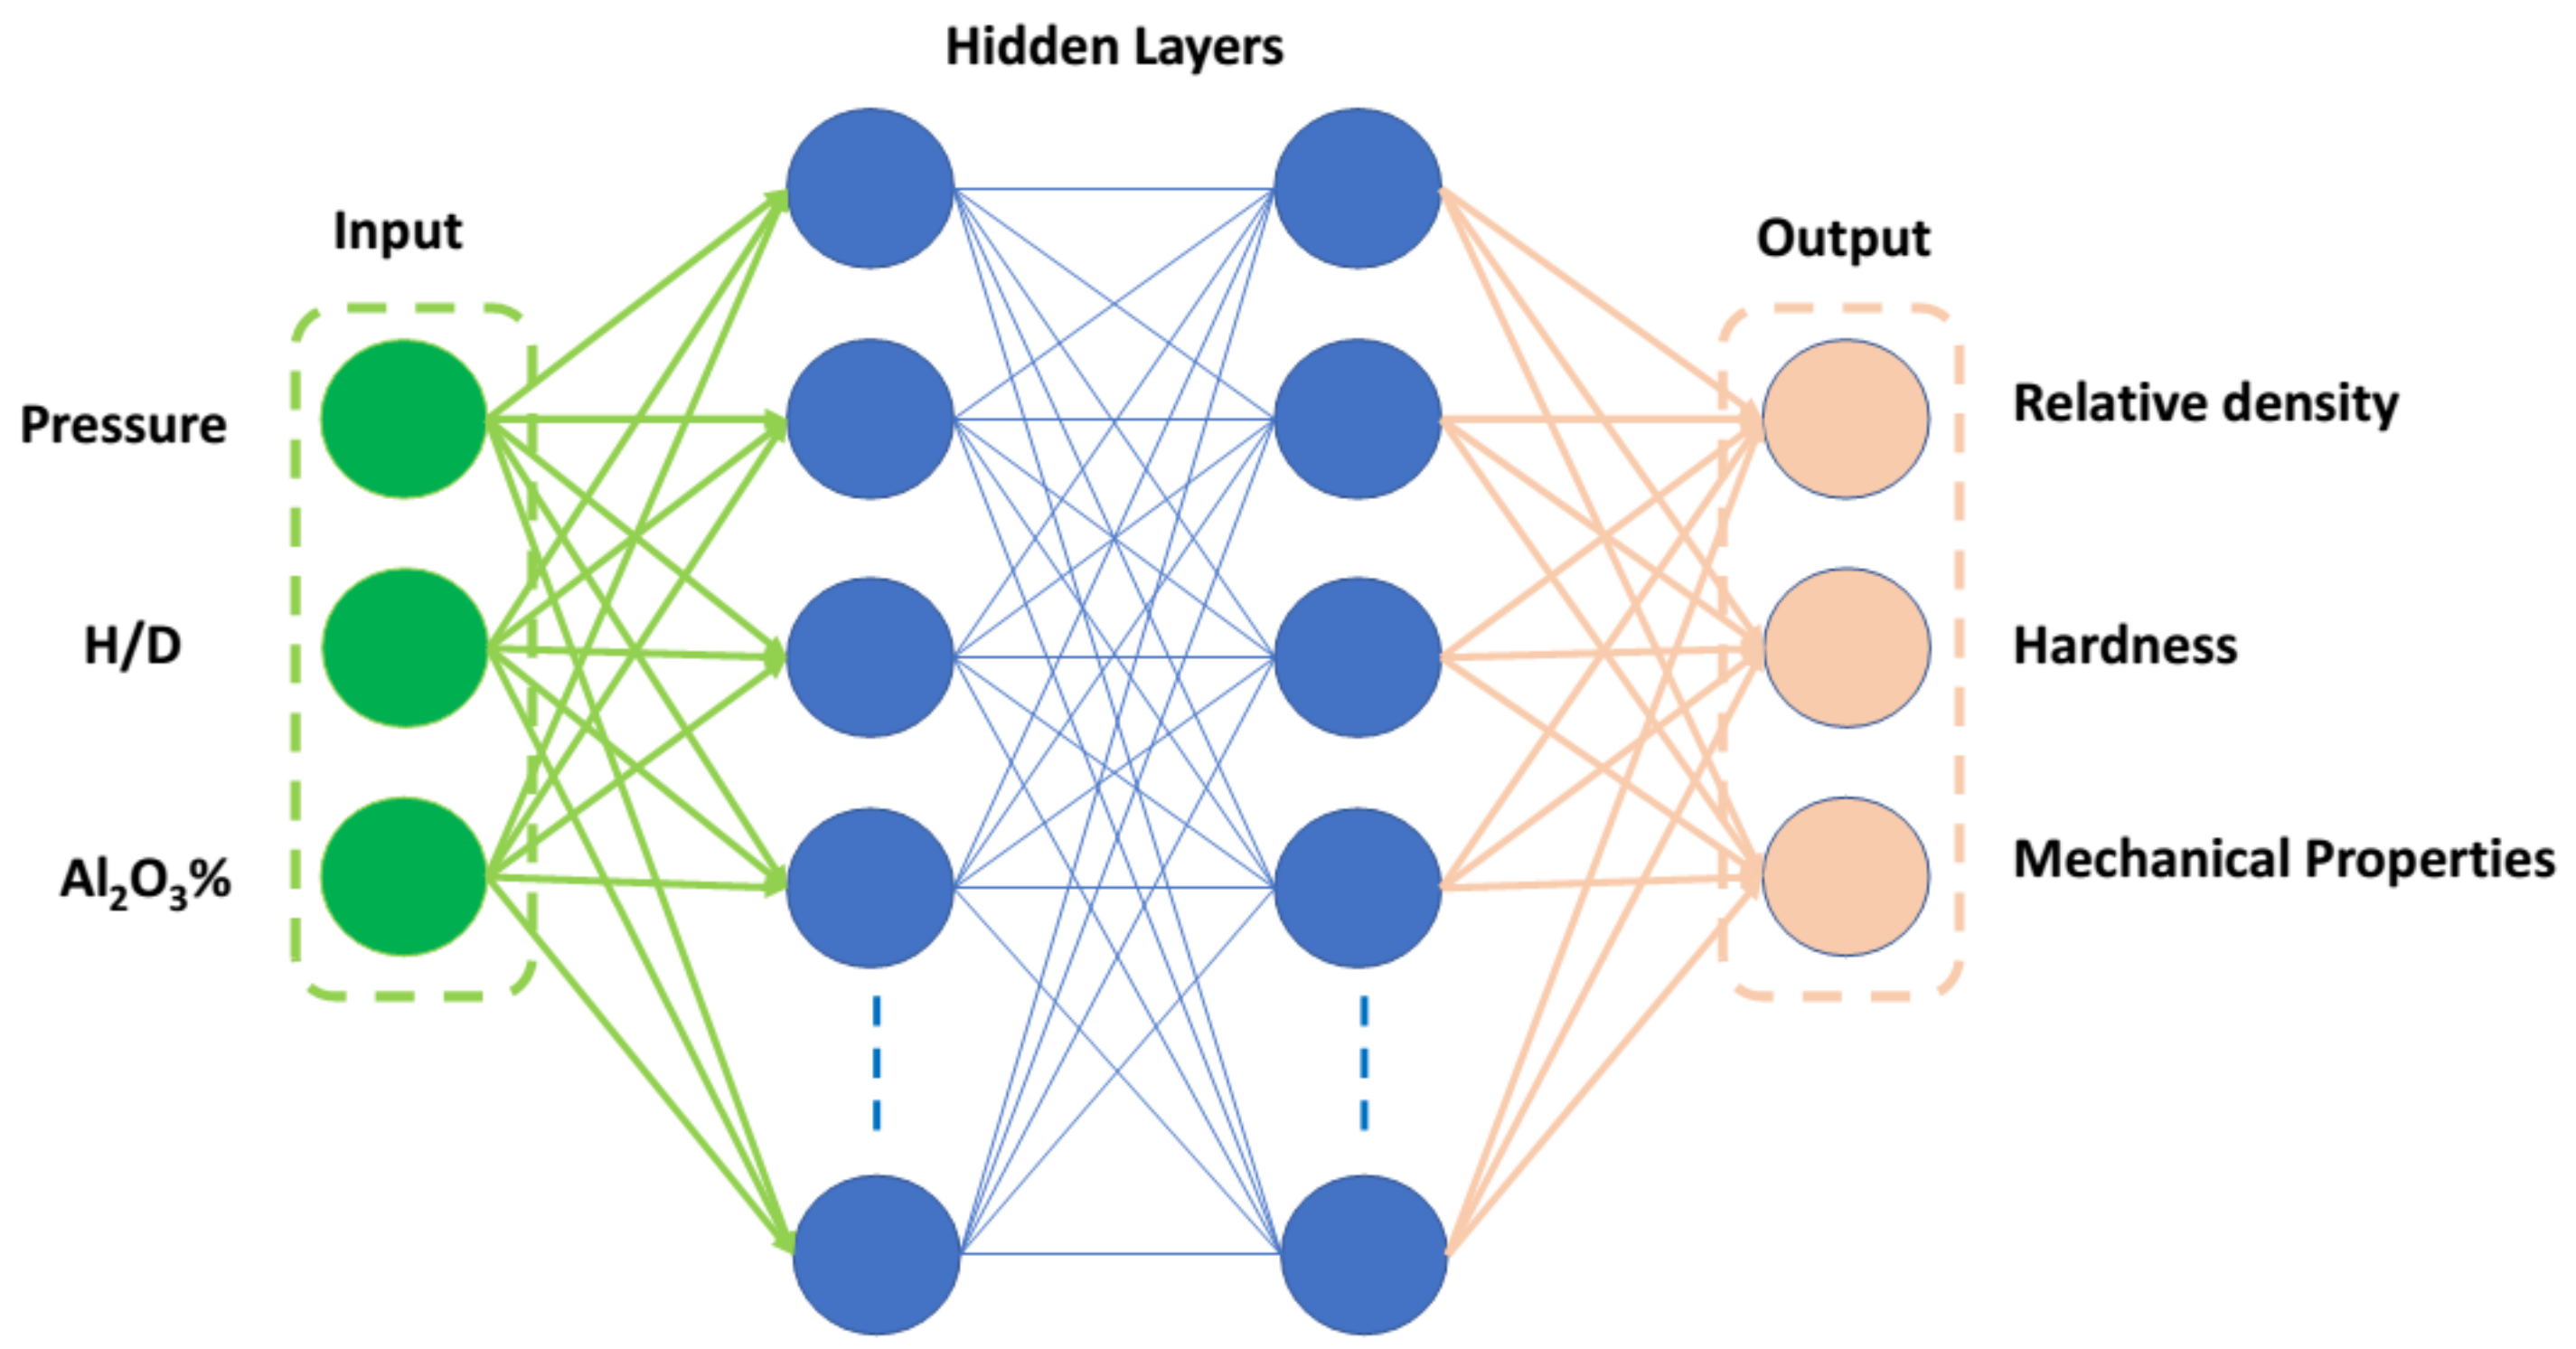
Figure 1. AMC’s artificial neural network.
Applsci 13 07483 g001
Figure 2. Correlation plots of all response AMC parameters versus input parameters.
Applsci 13 07483 g002
Figure 3. (a) Evaluation of predicted versus experimental RD% for the training and testing groups. (b) Predicted train, predicted test, and experimental datasets for the anticipated RD% as a function of the sample index.
Applsci 13 07483 g003
Figure 4. Comparison between RD% of experimental and predicted values of Al-4Cu/(Al2O3)x composites.
Applsci 13 07483 g004
Figure 5. Three-dimensional response plot of RD% at (a) 0% (b) 2.5%, (c) 5%, (d) 7.5%, and (e) 10% of Al2O3.
Applsci 13 07483 g005
Figure 6. RSM optimization results of RD% for AMC.
Applsci 13 07483 g006
Figure 7. Optimal RD% by (a) GA and (b) hybrid DOE-GA.
Applsci 13 07483 g007
Figure 8. (a) Evaluation of predicted versus experimental hardness for the training and testing groups. (b) Predicted train, predicted test, and experimental datasets for the anticipated hardness as a function of sample index.
Applsci 13 07483 g008
Figure 9. Comparison between experimental and predicted values of hardness for Al-4Cu/xAl2O3 composites.
Applsci 13 07483 g009
Figure 10. Three-dimensional response plot of hardness at (a) 0% (b) 2.5%, (c) 5%, (d) 7.5%, and (e) 10% of Al2O3.
Applsci 13 07483 g010
Figure 11. RSM optimization results of hardness for AMC.
Applsci 13 07483 g011
Figure 12. Optimal hardness by (a) GA and hybrid (b) DOE-GA.
Applsci 13 07483 g012
Figure 13. (a) Evaluation of predicted versus experimental σuc for the training and testing groups. (b) Predicted train, predicted test, and experimental datasets for the anticipated σuc as a function of the sample index.
Applsci 13 07483 g013
Figure 14. (a) Evaluation of predicted versus experimental σy for the training and testing groups. (b) Predicted train, predicted test, and experimental datasets for the anticipated σy as a function of the sample index.
Applsci 13 07483 g014
Figure 15. (a) Evaluation of predicted versus experimental εf for the training and testing groups. (b) Predicted train, predicted test, and experimental datasets for the anticipated εf as a function of the sample index.
Applsci 13 07483 g015
Figure 16. Comparison between experimental and predicted values of Al-4Cu/xAl2O3 composites for (a) σy, (b) σuc, and (c) εf.
Applsci 13 07483 g016aApplsci 13 07483 g016b
Figure 17. Three-dimensional response plot of mechanical properties; (ae) σy, (fj) σuc, and (ko) εf at (a,f,k) zero % (b,g,l) 2.5%, (c,h,m) 5%, (d,I,n) 7.5%, and (e,j,o) 10% of Al2O3.
Applsci 13 07483 g017aApplsci 13 07483 g017b
Figure 18. RSM optimization results of mechanical properties (a) σy, (b) σuc, and (c) εf for AMC.
Applsci 13 07483 g018
Figure 19. Optimal mechanical properties by GA (a,c,e) and hybrid DOE-GA (b,d,f) of σy (a,b), σuc (c,d), and εf (e,f), (b,c).
Applsci 13 07483 g019aApplsci 13 07483 g019b
Table 1. The central composite design for three variables with five levels.
Exp. No.Al2O3 (wt. %)H/DPressure (MPa)Remark
12.51.5800Front-facing corners
22.51.5600
32.51.0600
42.51.0800
55.01.25700Repeated center
65.01.25700
77.51.5800Back-facing corners
87.51.5600
97.51.0600
107.51.0800
115.01.25700Repeated center
125.01.25700
135.02.0700Augmented experiments
145.00.75700
155.01.25900
165.01.25500
1710.01.25700
180.01.25700
195.02.0700Repeated augmented experiments
205.00.75700
215.01.25900
225.01.25500
2310.01.25700
240.01.25700
Table 2. ANOVA results of AMC’s responses.
ResponseF-ValueModel
Significant (p < 0.05)
Adeq Precision (Ratio > 4)R2Adjusted R2Predicted R2
Relative density (RD%)78.25<0.000128.82510.90310.89150.8752
Hardness (Hv)276.02<0.000156.95310.98490.98140.9755
Yield strength (σy)184.74<0.000147.70300.97000.96470.9559
Compression strength (σc)122.52<0.000139.34380.95540.94760.9352
Fracture strain (εf)190.89<0.000144.70850.97840.97320.9639
Table 3. Evaluation metrics for the training and testing groups of RD% for ML models.
MLTraining SetTesting Set
RMSER2RMSER2
Linear regression0.680.820.550.89
Regression trees0.280.970.740.79
Random forest regression0.50.910.730.81
Gaussian process regression0.270.970.580.87
Artificial neural networks0.190.980.241
Table 4. Percentage of error between experimental and predicted outcomes of RD%.
InputRD%
Pressure (MPa)H/DAl2O3
(wt. %)
Exp.PredictError
8001.52.590.1590.149738580.000261419
6001.52.589.6589.65010871−1.09 × 10⁻⁴
60012.590.390.30285476−2.85 × 10⁻³
80012.591.0591.05233493−2.33 × 10⁻³
7001.25590.4490.65393441−0.213934408
7001.25590.6790.653934410.016065592
8001.57.588.2588.246403433.60 × 10−3
6001.57.587.487.40036937−0.000369373
60017.588.7588.75127021−1.27 × 10⁻³
80017.589.5589.547293112.71 × 10−3
7001.25590.8590.653934411.96 × 10−1
7001.25590.790.653934414.61 × 10−2
7002588.0588.18914371−1.39 × 10⁻¹
7000.75591.290.91793792.82 × 10−1
9001.25591.0891.19658434−0.116584341
5001.25589.8989.858559760.031440242
7001.251085.986.37184757−4.72 × 10⁻¹
7001.2509292.27624419−0.276244187
7002588.3388.189143711.41 × 10−1
7000.75590.9290.91793792.06 × 10−3
9001.25591.3291.196584341.23 × 10−1
5001.25590.0589.858559761.91 × 10−1
7001.251086.8586.371847574.78 × 10−1
7001.25092.5592.276244190.273755813
Table 5. Evaluation metrics for the training and testing groups of hardness for ML models.
MLTraining SetTesting Set
RMSER2RMSER2
Linear regression2.810.952.210.93
Regression trees1.120.9920.94
Random forest regression2.040.972.990.87
Gaussian process regression1.130.992.150.95
Artificial neural networks0.8180.9962.191
Table 6. Percentage of error between experimental and predicted outcomes of hardness.
InputHardness (HV)
Pressure (MPa)H/DAl2O3
(wt. %)
Exp.PredictError
8001.52.569.569.55.97 × 10−13
6001.52.56464−1.07 × 10⁻¹²
60012.568683.45 × 10−12
80012.572.572.5−2.67 × 10⁻¹²
7001.2557476.166667−2.166667
7001.25577.576.1666671.3333333
8001.57.588.588.57.82 × 10−13
6001.57.58482.7251131.2748867
60017.591911.42 × 10−13
80017.59999−4.55 × 10⁻¹³
7001.2557976.1666672.8333333
7001.2557776.1666670.8333333
7002569697.11 × 10−14
7000.7558281.250.75
9001.25586867.39 × 10−13
5001.2556667−1
7001.2510105.5106.75−1.25
7001.25059599.95 × 10−14
7002569697.11 × 10−14
7000.75580.581.25−0.75
9001.2558486−2
5001.25568671
7001.2510108106.751.25
7001.25057.559−1.5
Table 7. Evaluation metrics for the training and testing groups of compression distribution for ML models.
ResponseMLTraining SetTesting Set
RMSER2RMSER2
σy (MPa)Linear regression8.270.9185.140.91
Regression trees3.870.986.80.83
Random forest regression5.690.969.010.71
Gaussian process regression5.630.9614.440.80
Artificial neural networks3.170.985.190.99
σuc (MPa)Linear regression7.510.953.040.99
Regression trees4.210.987.720.96
Random forest regression5.970.9712.110.91
Gaussian process regression3.520.984.360.98
Artificial neural networks3.580.984.550.98
εf (%)Linear regression0.590.870.680.91
Regression trees0.240.970.510.86
Random forest regression0.260.970.210.97
Gaussian process regression0.1980.980.2640.97
Artificial neural networks0.20.980.21
Table 8. Percentage of error between experimental and predicted outcomes of mechanical properties.
InputCompressive StrengthYield StrengthFracture Strain
Pressure (MPa)H/DAl2O3
(wt. %)
Exp.PredictErrorExp.PredictErrorExp.PredictError
8001.52.5225225.000061−6.17 × 10−5315315.14025−1.40 × 10−111.711.681871.81 × 10−2
6001.52.5218218.000009−9.59 × 10−6287286.980751.92 × 10−21211.939856.01 × 10−2
60012.5224224.000018−1.82 × 10−5298294.623773.38 × 10011.411.40852−8.52 × 10⁻³
80012.5245244.9999861.34 × 10−5319318.845621.54 × 10−111.111.093396.61 × 10−3
7001.255256262.499990−6.499990521314323.39536−9.39536110.510.67984−0.17984
7001.255261262.499990−1.499990521330323.395366.604638710.910.679840.2201605
8001.57.5274273.9999999.57 × 10−7362362.70417−7.04 × 10−19.18.9186511.81 × 10−1
6001.57.5261261.000004−4.03203 × 10−6354354.13551−0.1355149.59.4442700.0557299
60017.5280279.9999972.54 × 10−6368.5367.079231.42 × 1007.97.8873321.27 × 10−2
80017.5294294.000008−8.63 × 10−6374374.60069−6.01 × 10−17.17.0474575.25 × 10−2
7001.255270262.4999907.50 × 100328323.395364.60 × 1001110.679843.20 × 10−1
7001.255263262.4999905.00 × 10−1321323.39536−2.40 × 10010.510.67984−1.80 × 10⁻¹
70025255253.0000372.00 × 100311311.69067−6.91 × 10−111.311.102941.97 × 10−1
7000.755279282.999974−3.99997446339334.109064.89093868.99.073309−0.173309
9001.255274268.9999865.000013937334.5332.863191.636811210.710.74755−0.047559
5001.255253255.999991−3.00 × 100315315.79756−7.98 × 10−111.411.45020−5.02 × 10⁻²
7001.2510301306.499993−5.49999346377380.21001−3.2100146.96.7229161.77 × 10−1
7001.250195192.2964782.70 × 100255260.97904−5.98 × 1001212.47473−4.75 × 10⁻¹
70025251253.000037−2.00 × 100314311.690672.31 × 10011.111.10294−2.94 × 10⁻³
7000.755287282.9999744.00 × 100328.5334.10906−5.61 × 1009.29.0733091.27 × 10−1
9001.255269268.9999861.39 × 10−5331332.86319−1.86 × 10010.710.74755−0.047559
5001.255256255.9999918.36 × 10−6318315.797562.20 × 10011.511.450200.0497917
7001.2510312306.4999935.50000654384380.210013.78998596.66.722916−1.23 × 10⁻¹
7001.250199192.2964786.703521764261260.979040.0209571312.474730.5252705
Table 9. Summary results of RD, HV, and compressive properties of AL-4Cu/xAl2O3 composites.
ResponseDOERSMGADOE-GA
RD%Value92.87292.79192.87292.872
Cond.P = 900 MPa, H/D = 0.75, Al2O3 = 0%P = 893.89 MPa, H/D = 0.854, Al2O3 = 0.031%P = 900 MPa, H/D = 0.75, Al2O3 = 0%P = 900 MPa, H/D = 0.75, Al2O3 = 0%
HvValue126.27121.199126.15126.15
Cond.P = 900 MPa, H/D= 0.75, Al2O3 = 10%P = 875.087 MPa, H/D = 0.870, Al2O3 = 9.845%P = 900 MPa, H/D = 0.75, Al2O3 = 10%P = 900 MPa, H/D = 0.75, Al2O3 = 10%
σy (MPa)Value312341.372350.399350.398
Cond.P = 700 MPa, H/D = 1.25, Al2O3 = 10%P = 884.243 MPa, H/D = 0.762,
Al2O3 = 8.57%
P = 900 MPa, H/D = 0.75, Al2O3 = 10%P = 900 MPa, H/D = 0.75, Al2O3 = 10%
σuc (MPa)Value384410.93421.906421.906
Cond.P = 700 MPa, H/D = 1.25, Al2O3 = 10%P = 506.142 MPa, H/D = 0.873,
Al2O3 = 9.71%
P = 500 MPa, H/D = 0.75, Al2O3 = 10%P = 500 MPa, H/D = 0.75, Al2O3 = 10%
εfValue1313.5413.085113.464
Cond.P = 700 MPa, H/D = 1.25, Al2O3 = 0%P = 501.692 MPa, H/D = 0.757,
Al2O3 = 0.017%
P = 501.12 MPa, H/D = 0.758, Al2O3 = 0% P = 510 MPa, H/D = 0.75, Al2O3 = 0%
Disclaimer/Publisher’s Note: The statements, opinions and data contained in all publications are solely those of the individual author(s) and contributor(s) and not of MDPI and/or the editor(s). MDPI and/or the editor(s) disclaim responsibility for any injury to people or property resulting from any ideas, methods, instructions or products referred to in the content.