Article

Assessment of AC Corrosion Probability in Buried Pipelines with a FEM-Assisted Stochastic Approach

1
Independent Researcher, 29122 Piacenza, Italy
2
Department of Electrical, Electronic and Information Engineering, University of Bologna, 40136 Bologna, Italy
*
Author to whom correspondence should be addressed.
Appl. Sci. 2023, 13(13), 7669; https://doi.org/10.3390/app13137669
Submission received: 12 May 2023 / Revised: 26 June 2023 / Accepted: 27 June 2023 / Published: 28 June 2023

Abstract

:
In this paper, a stochastic approach is combined with field theory and circuit methods to study how the geometrical and electrical properties of holidays (defects or pores in the insulating coating) in a metallic pipeline influence the probability of exceeding the current density limit for corrosion. Three-dimensional FEM simulations are conducted to assess the influence of the shape and electrical resistivity of the pore on the computed spread resistance value. The obtained results are then used to evaluate the probability of exceeding a given current density value for different sizes of pore and soil resistivities. Finally, a case of 50 Hz interference along a pipeline-transmission line routing is examined. The probabilistic approach presented in this paper allows the pipeline sections more subjected to the induced AC corrosion risk to be identified to be used as an auxiliary tool for adopting preventive protection countermeasures. Lastly, unlike most papers devoted to assessing electromagnetic interference on pipelines, the present work uses a probabilistic rather than a deterministic approach, representing its main novelty aspect.

1. Introduction

Long metallic structures installed nearby high-voltage alternate current (HVAC) power lines or electrified AC railway lines are often subjected to electrical stresses due to the time-varying current flowing through the line conductors [1]. A typical example is steel pipelines for transporting liquids or gases, which—for economic reasons—often share the same corridors with electrical transmission lines [2] or AC railways [3,4]. Unless effective protective measures are put in place, buried steel pipelines may be subjected to electrochemical corrosion over time because of the current density flowing from the pipeline metal to earth through imperfections of the pipeline coating [5] (holidays). The corrosion phenomenon may eventually lead to perforations under long-term exposure, thus endangering the transportation and operation safety of the pipeline [6]. While this work focuses on interferences at typical power frequencies (50 or 60 Hz), it is worth adding that pipelines may also be influenced by lightning strikes hitting nearby power lines or failures of nearby electrical apparatuses. In these cases, pipes may be subjected to transients characterized by larger magnitudes and a wider frequency spectrum [7].
Interference on pipelines is usually classified using three distinct mechanisms, namely inductive, conductive, and capacitive coupling. Capacitive coupling is essential only when the victim is located above ground, and conductive coupling occurs only when the earth is actively used as a return path by the interference source, such as in the case of phase-to-ground fault conditions of a three-phase line. Out of these, inductive interference is the only mechanism to which pipelines are exposed under all operational conditions of nearby transmission lines and substations [8]. In general, the three coupling mechanisms of interference may also occur simultaneously [9]. Many efforts have been devoted over the last decades to the development of computational techniques for predicting interference levels. Typical physical quantities of interest include the pipe-to-soil voltage and the pipeline longitudinal and radial current densities. The radial current component (normal to the pipeline geometrical axis) eventually reaches the soil through the pipe insulation layer. It is considered responsible for corrosion when the magnitude exceeds 30   A / m 2 [10].
Computational approaches for calculating these quantities are generally grouped into two main groups, i.e., methods based either on circuit theory/transmission-line theory or field theory. Techniques belonging to the first category require a discretization of the system into an ensemble of smaller sections that share some kind of electromagnetic coupling. Each section is described by means of lumped parameters for circuit approaches and distributed parameters for transmission line methods [11]. The numerical values of the parameters are usually found utilizing exact or approximated analytical formulas. A classic example is constituted by several approximate expressions developed over time to evaluate the well-known Carson’s series for calculating self- and mutual impedances of earth-return conductors [12].
Instead, field theory methods are based on obtaining an approximated solution of Maxwell’s partial differential equations in space (and time for unsteady problems). These can be further subdivided into integral and differential methods. Integral methods are generally very efficient for open-boundary problems and thus have also been employed in this field. An example is the shifting complex images method by Andolfato et al. [13] which combines the moments and the images method. In contrast to integral methods, where only the surfaces of the field sources are discretized, the whole physical domain is discretized when a differential approach is adopted, such as the finite-difference time-domain (FDTD) or the finite element method (FEM) [14]. Since AC interference modelling problems are essentially three-dimensional and given the considerable size of corridors, field-theory-based models have mostly been used with circuital approaches. Hence, FEM is used to infer physical information on selected cross sections of the corridors, subsequently used to build an equivalent circuit representation of the whole geometry. The models in [15,16,17,18,19,20,21] are examples of efforts in this direction. These have been applied to study complex non-parallel configurations in conjunction with complex soil models and the presence of multiple conductors. Some work, such as [22] and later on [23], has also shown the advantages of combining FEM (used only for the pipeline region) with the boundary element method (BEM). Notably, several commercial programs feature comprehensive modelling capabilities regarding electrical interference on pipelines (and grounding systems), often allowing one to perform studies using circuit and electromagnetic field theory models. Examples of such computer programs include CDEGS [24], which originated from the seminal modelling works of Dawalibi and colleagues [25], Elsyca [26,27] and XGSLAB [28,29]. Table 1 summarizes the calculation methodologies employed in the above-discussed works. For each work, the evaluated physical quantities are also reported. A feature shared by most of the listed approaches and corresponding computer codes is that deterministic approaches are applied to estimate the physical quantities of interest. In contrast, this work uses field theory and circuit methods combined with a stochastic approach to study how holidays’ geometrical and electrical properties influence the probability of exceeding the current density limit for corrosion. A similar approach has been used in [30] without considering the presence of coating defects, which are the main focus of the present manuscript.
In this work, three-dimensional FEM simulations are performed to study the electrical properties of a holiday (pore) in the insulation layer of a metallic pipeline. The focus is set on the influence of the shape and electrical resistivity of the pore on the obtained value of spread resistance. Once the physical characteristics of a typical holiday have been defined, an evaluation of the leakage current density is performed using a probabilistic method. The computed quantity is the probability of exceeding a given current density value. In this way, the influence of both pore and external soil resistivity on exceeding the current density limit is assessed. Finally, the developed probabilistic approach is applied to a more complex case by computing the probability of exceeding the limit along a pipeline transmission line routing.
The parametric FEM simulations on the holiday spread resistance are described in Section 2. The probabilistic evaluation of the current density is discussed in Section 3.

2. Finite Element Analysis of the Spread Resistance of a Coating Defect

Corrosion effects in pipelines due to induced AC voltages are related to the spread resistance of a coating fault, which results from three contributions, the resistance of the medium located in the coating fault (pore or holiday resistance, R p ), the leakage resistance in the soil R l and the polarisation resistance of the bare metal at the bottom of the coating fault [35]:
R s = R p + R l + R p o l
Usually, only the first two contributions are considered in the literature as the polarization resistance R p o l It is much smaller than the other two terms [35] and can thus be neglected [36]. In this paper, to evaluate the spread resistance of a coating fault with an angle between the coating and the coating fault gutter, a finite element analysis is carried out.
Specifically, the DC Conduction solver available in Ansys Maxwell 3D is used [37]. It solves the equation:
σ Φ = 0
where Φ is the electric scalar potential and σ the medium electrical conductivity. The symbol denotes the divergence operator. The solved quantity is the electric scalar potential Φ , from which the current density J ¯ and electric field E ¯ are derived.
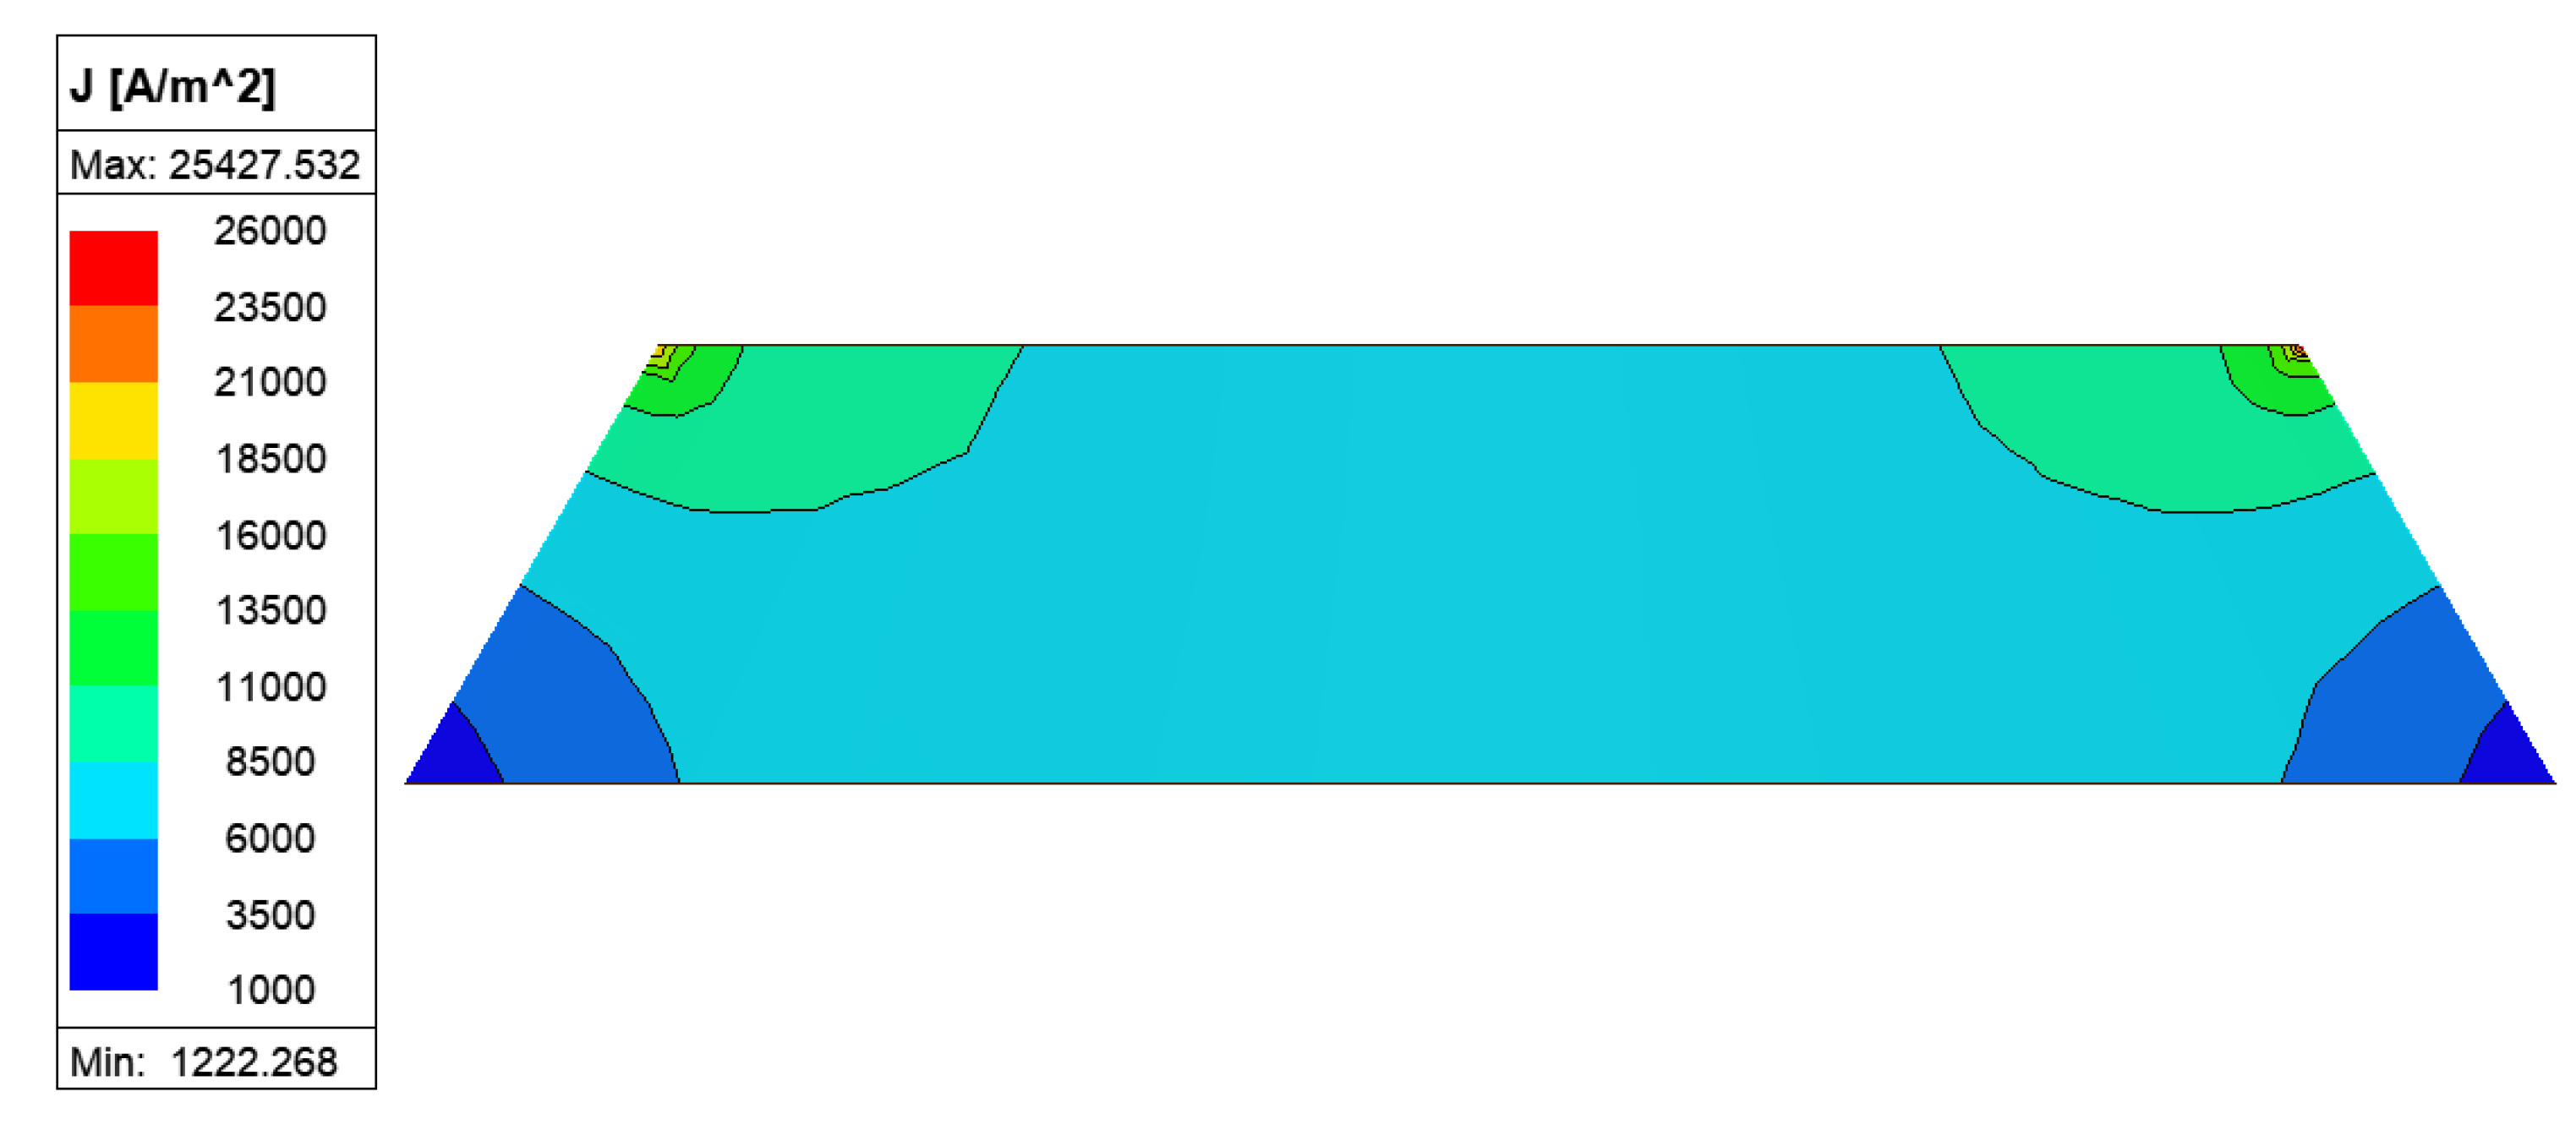
In Figure 1a the vertical cross-section of the finite element model for a defect with finite coating thickness d is shown. The quantities r a and r b represent the radii of the top and bottom bases of the pore, respectively. A constant 1 A current is applied to the top base of the pore, which has an area of 1 cm2; the thickness of the pore is d = 3 mm, and the pore resistivity is ρ p = ρ = 100 Ωm; the bottom base of the pore is set to 0 V potential and the lateral surface of the pore is set to be insulating. The 3D dimetric view of the pore model is shown in Figure 1b, with an indication of the boundary and excitation conditions for each face of the object. Some calculations performed when the medium inside the pore has a constant resistivity equal to that of the soil show that the current density is not uniform along the pore depth (i.e., the thickness of the coating). This can be seen in Figure 2 and Figure 3, where the current density is plotted in a vertical and a horizontal cross-section of the pore, respectively. This result accounts for calculating the pore resistance with finite element analysis, as the analytical calculation assumes a uniform current density along the pore thickness:
R p = ρ p d π   r a   r b = ρ p d π   r a d cot α + r a .
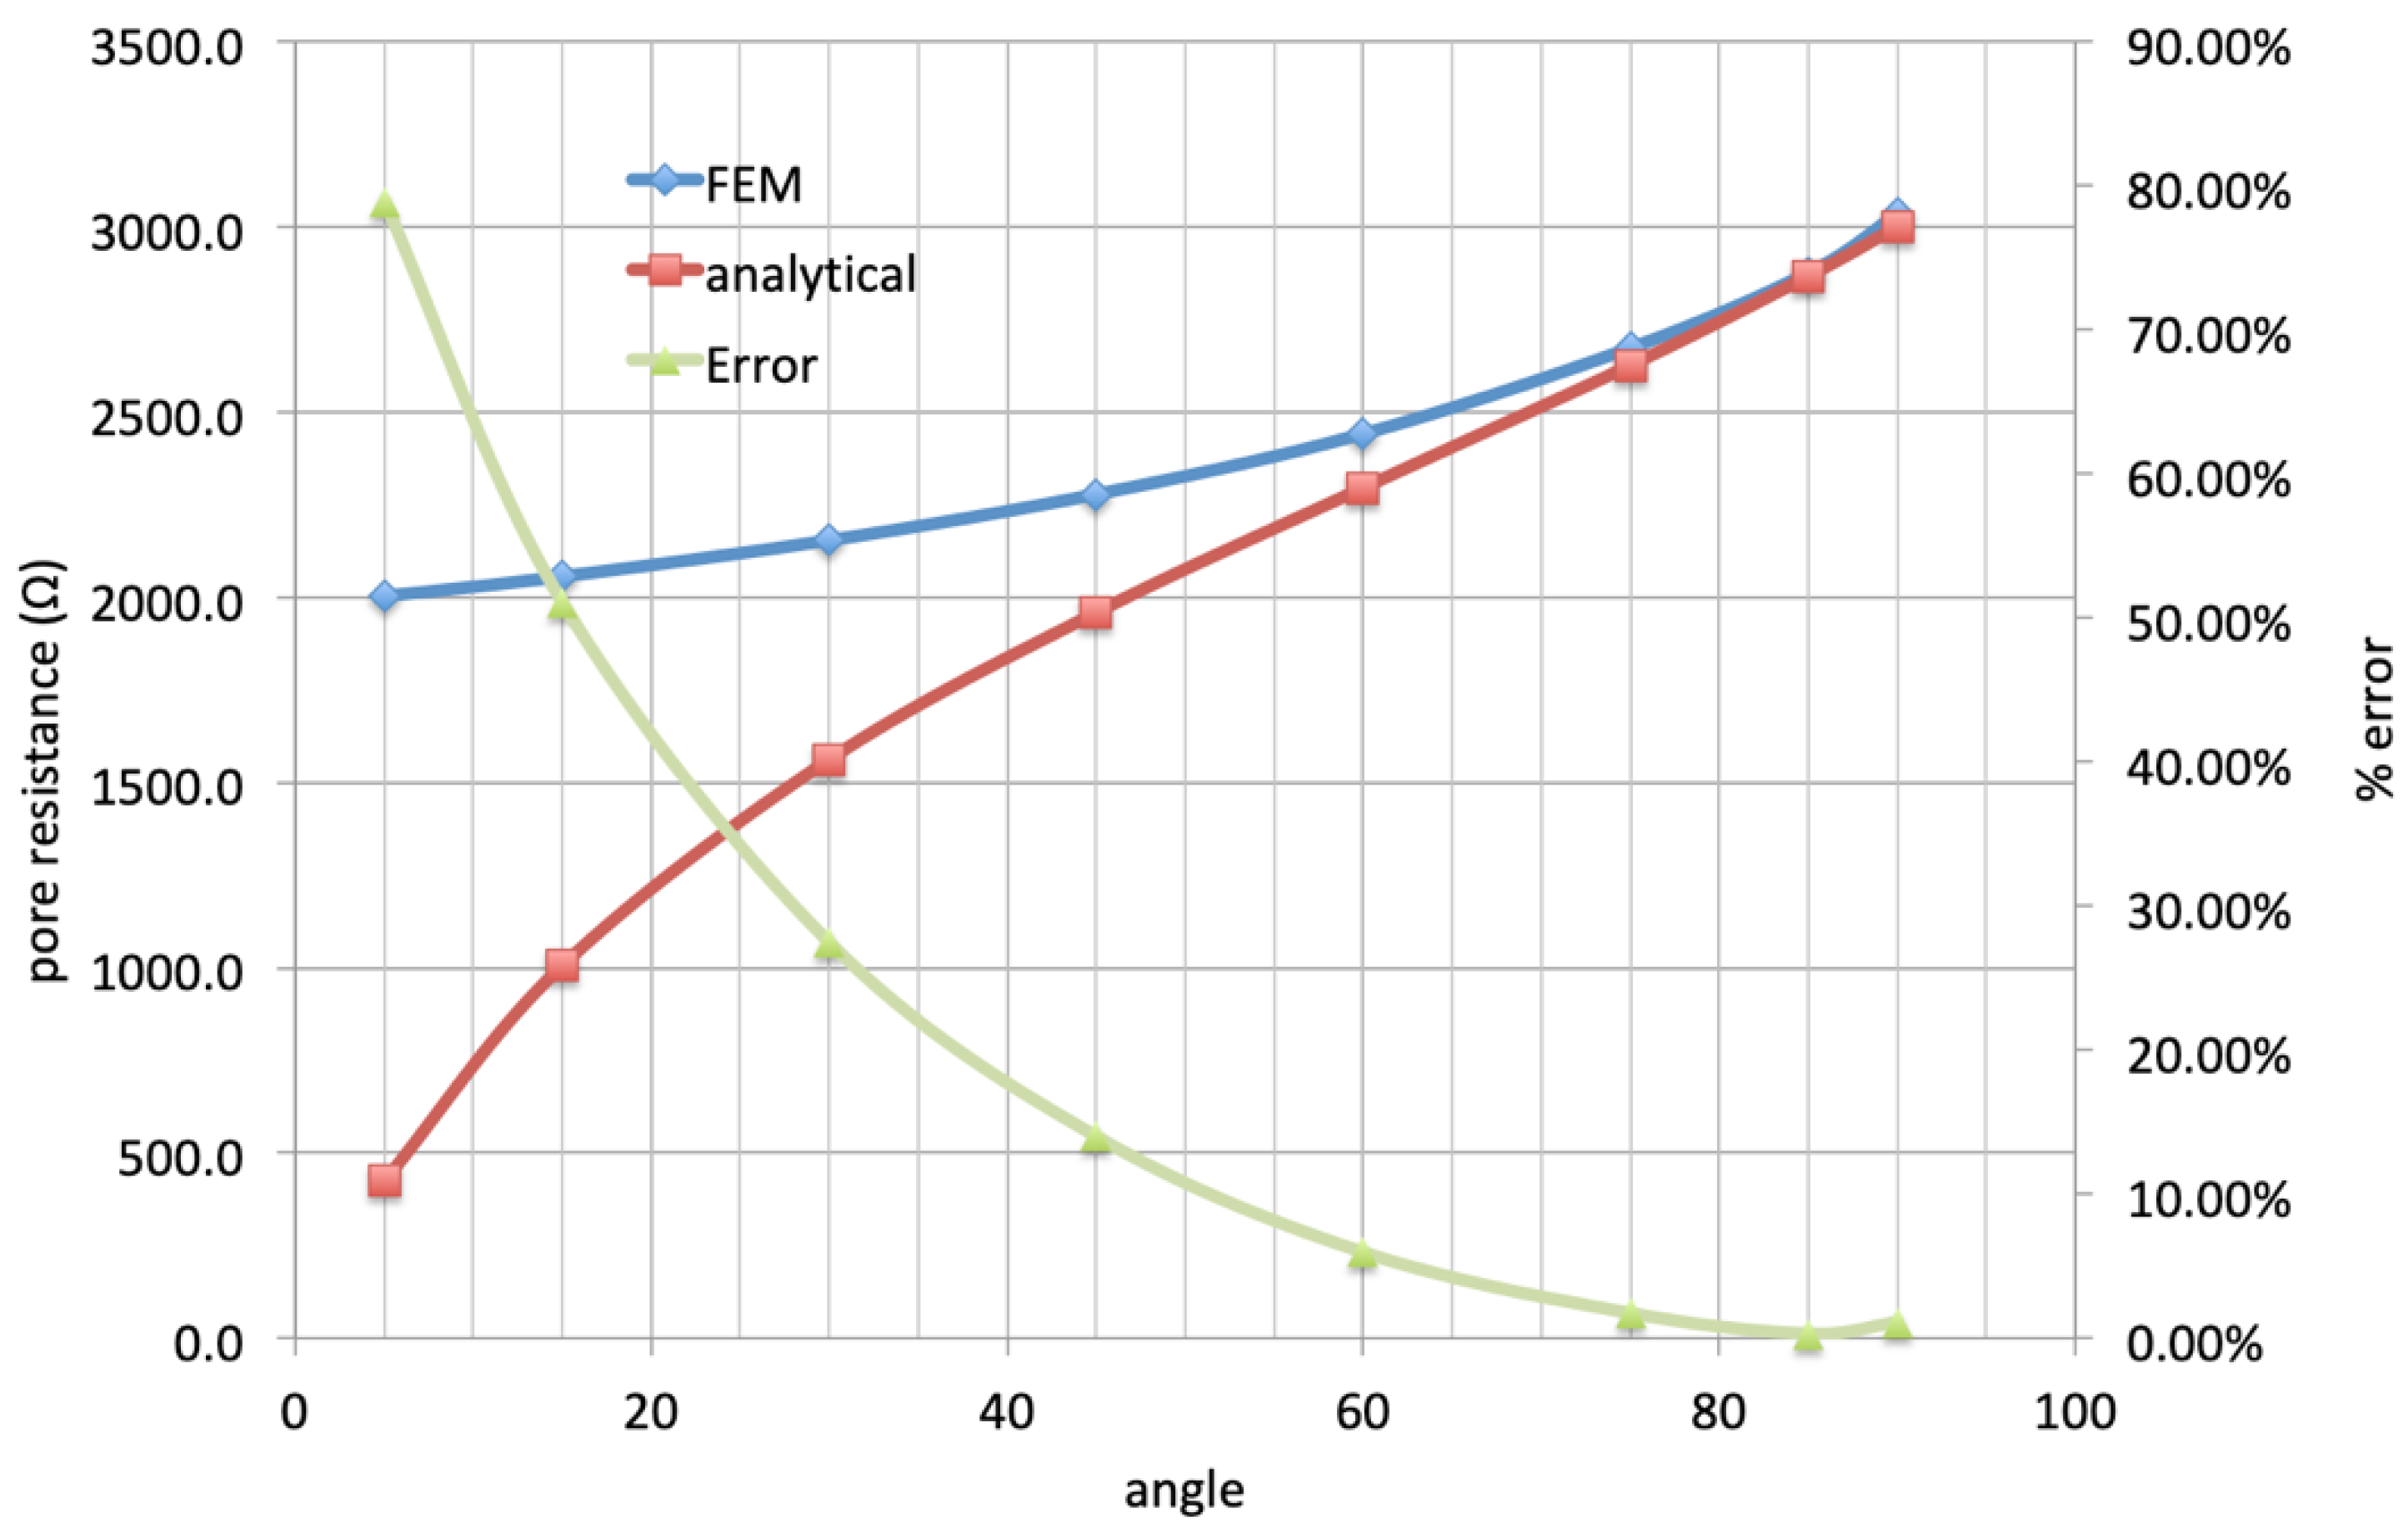
The comparison between the pore resistance R p calculated with the finite element method (FEM) and with (3) is shown in Figure 4, where R p is plotted versus the angle between the coating and the coating fault gutter; the angle α = 90 ° represents a cylindrical pore. The figure shows that the difference between the FEM calculation and (3) increases for a decreasing α , with the percent error reaching about 80% for α = 5 ° .
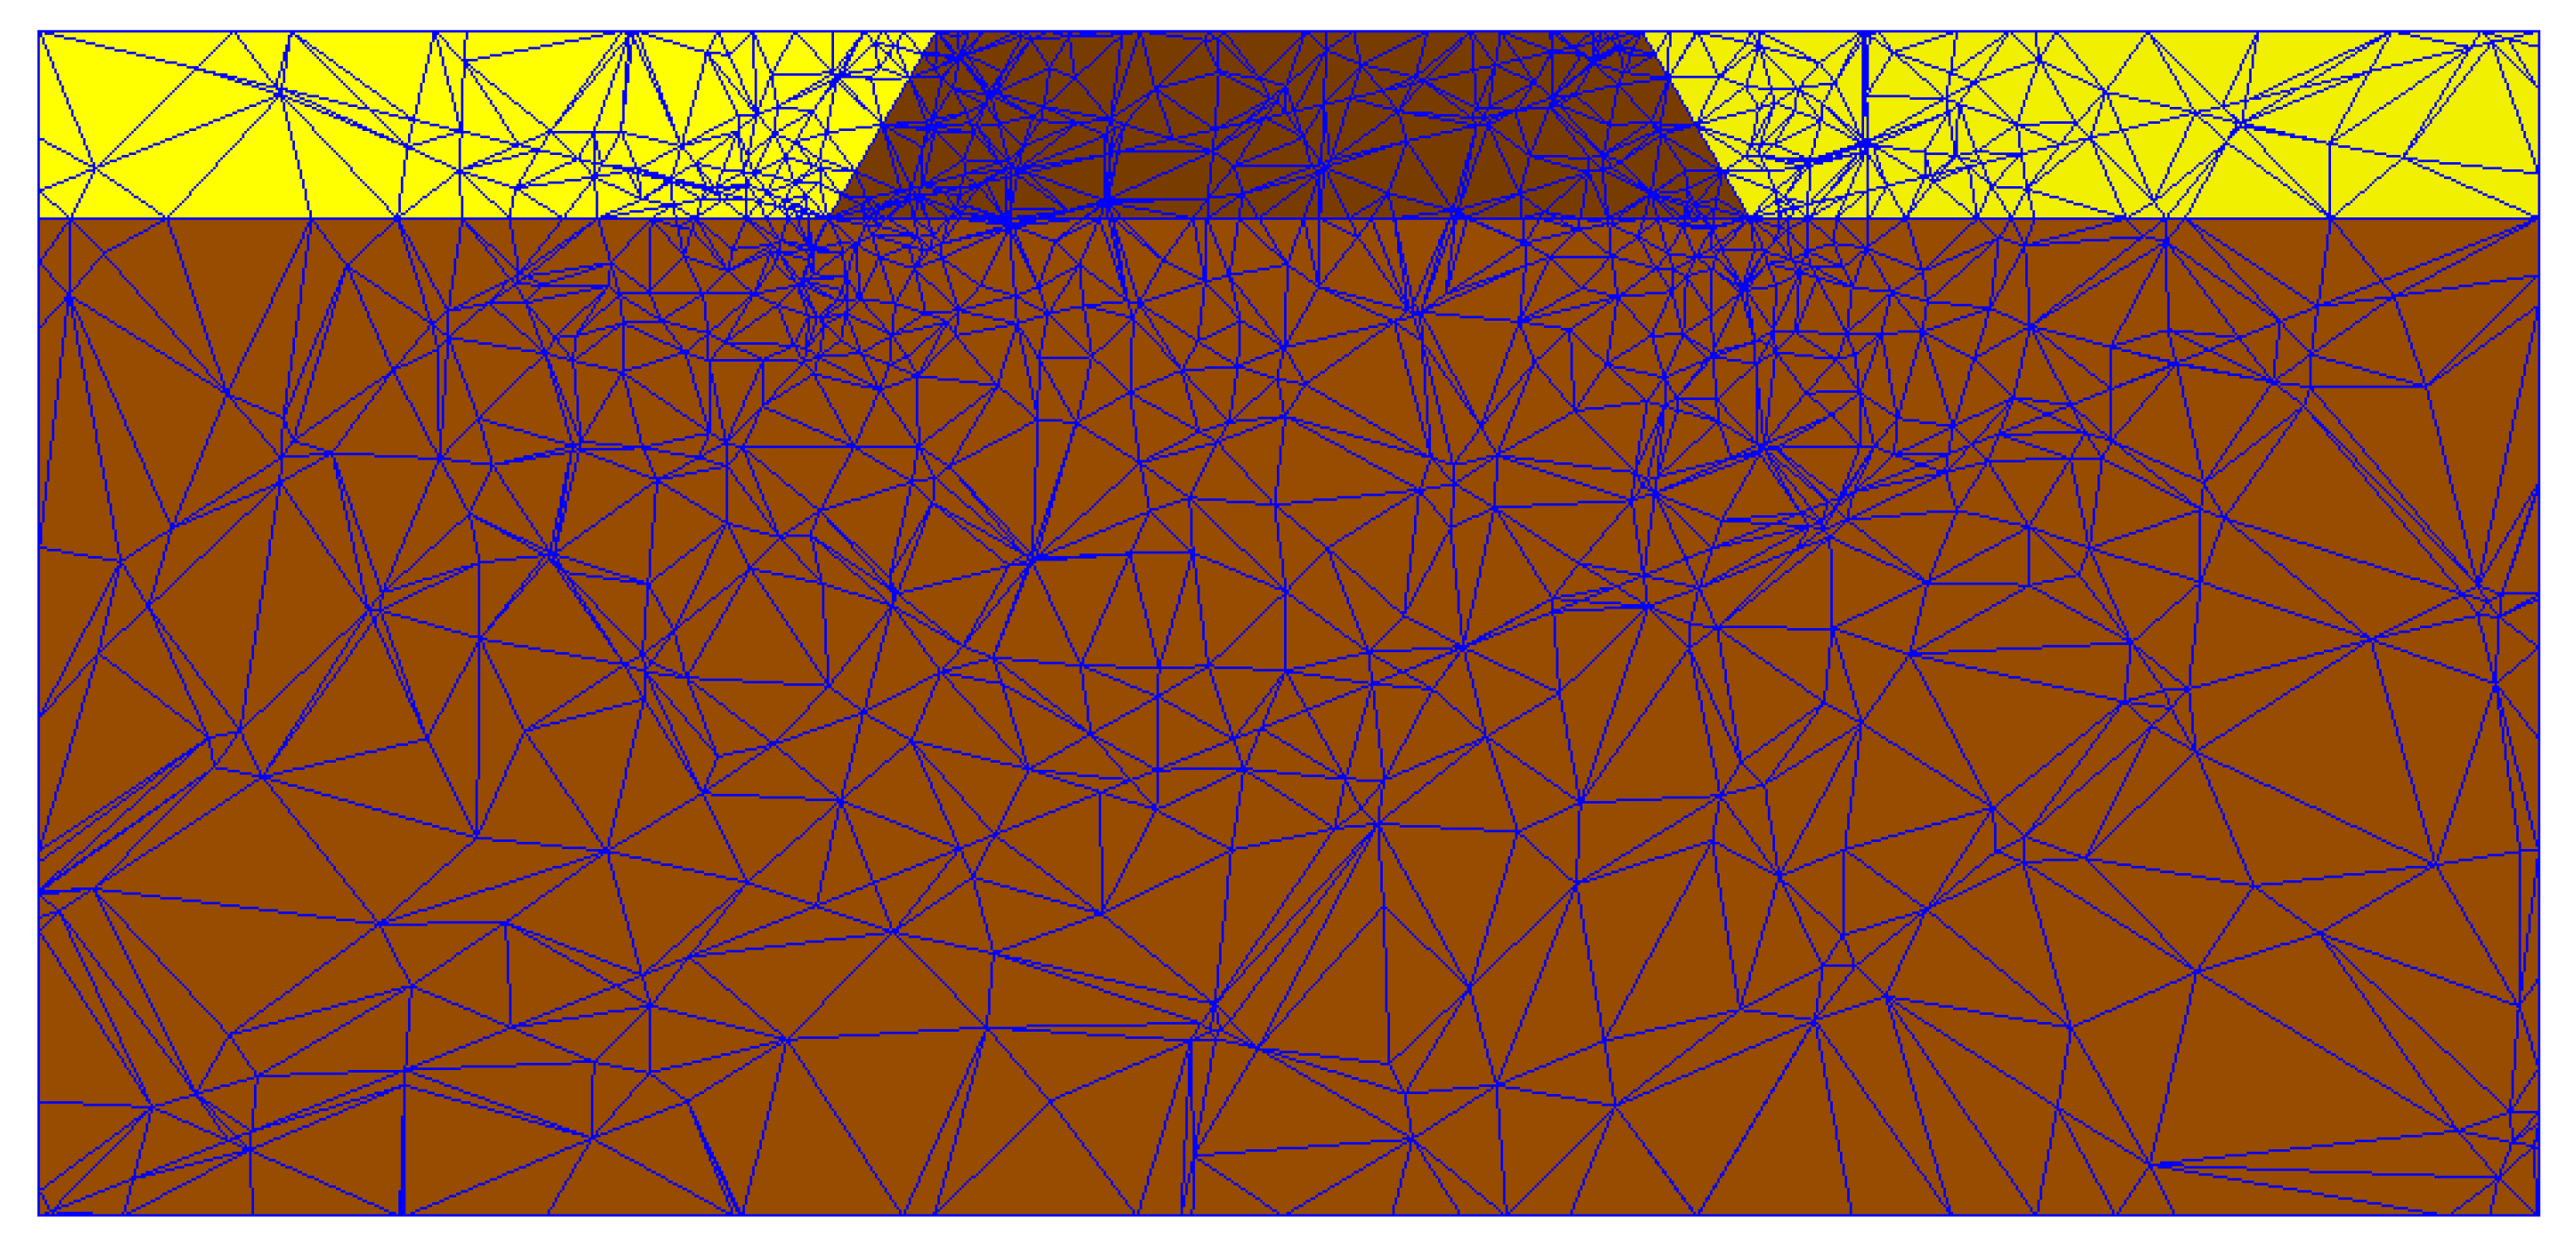
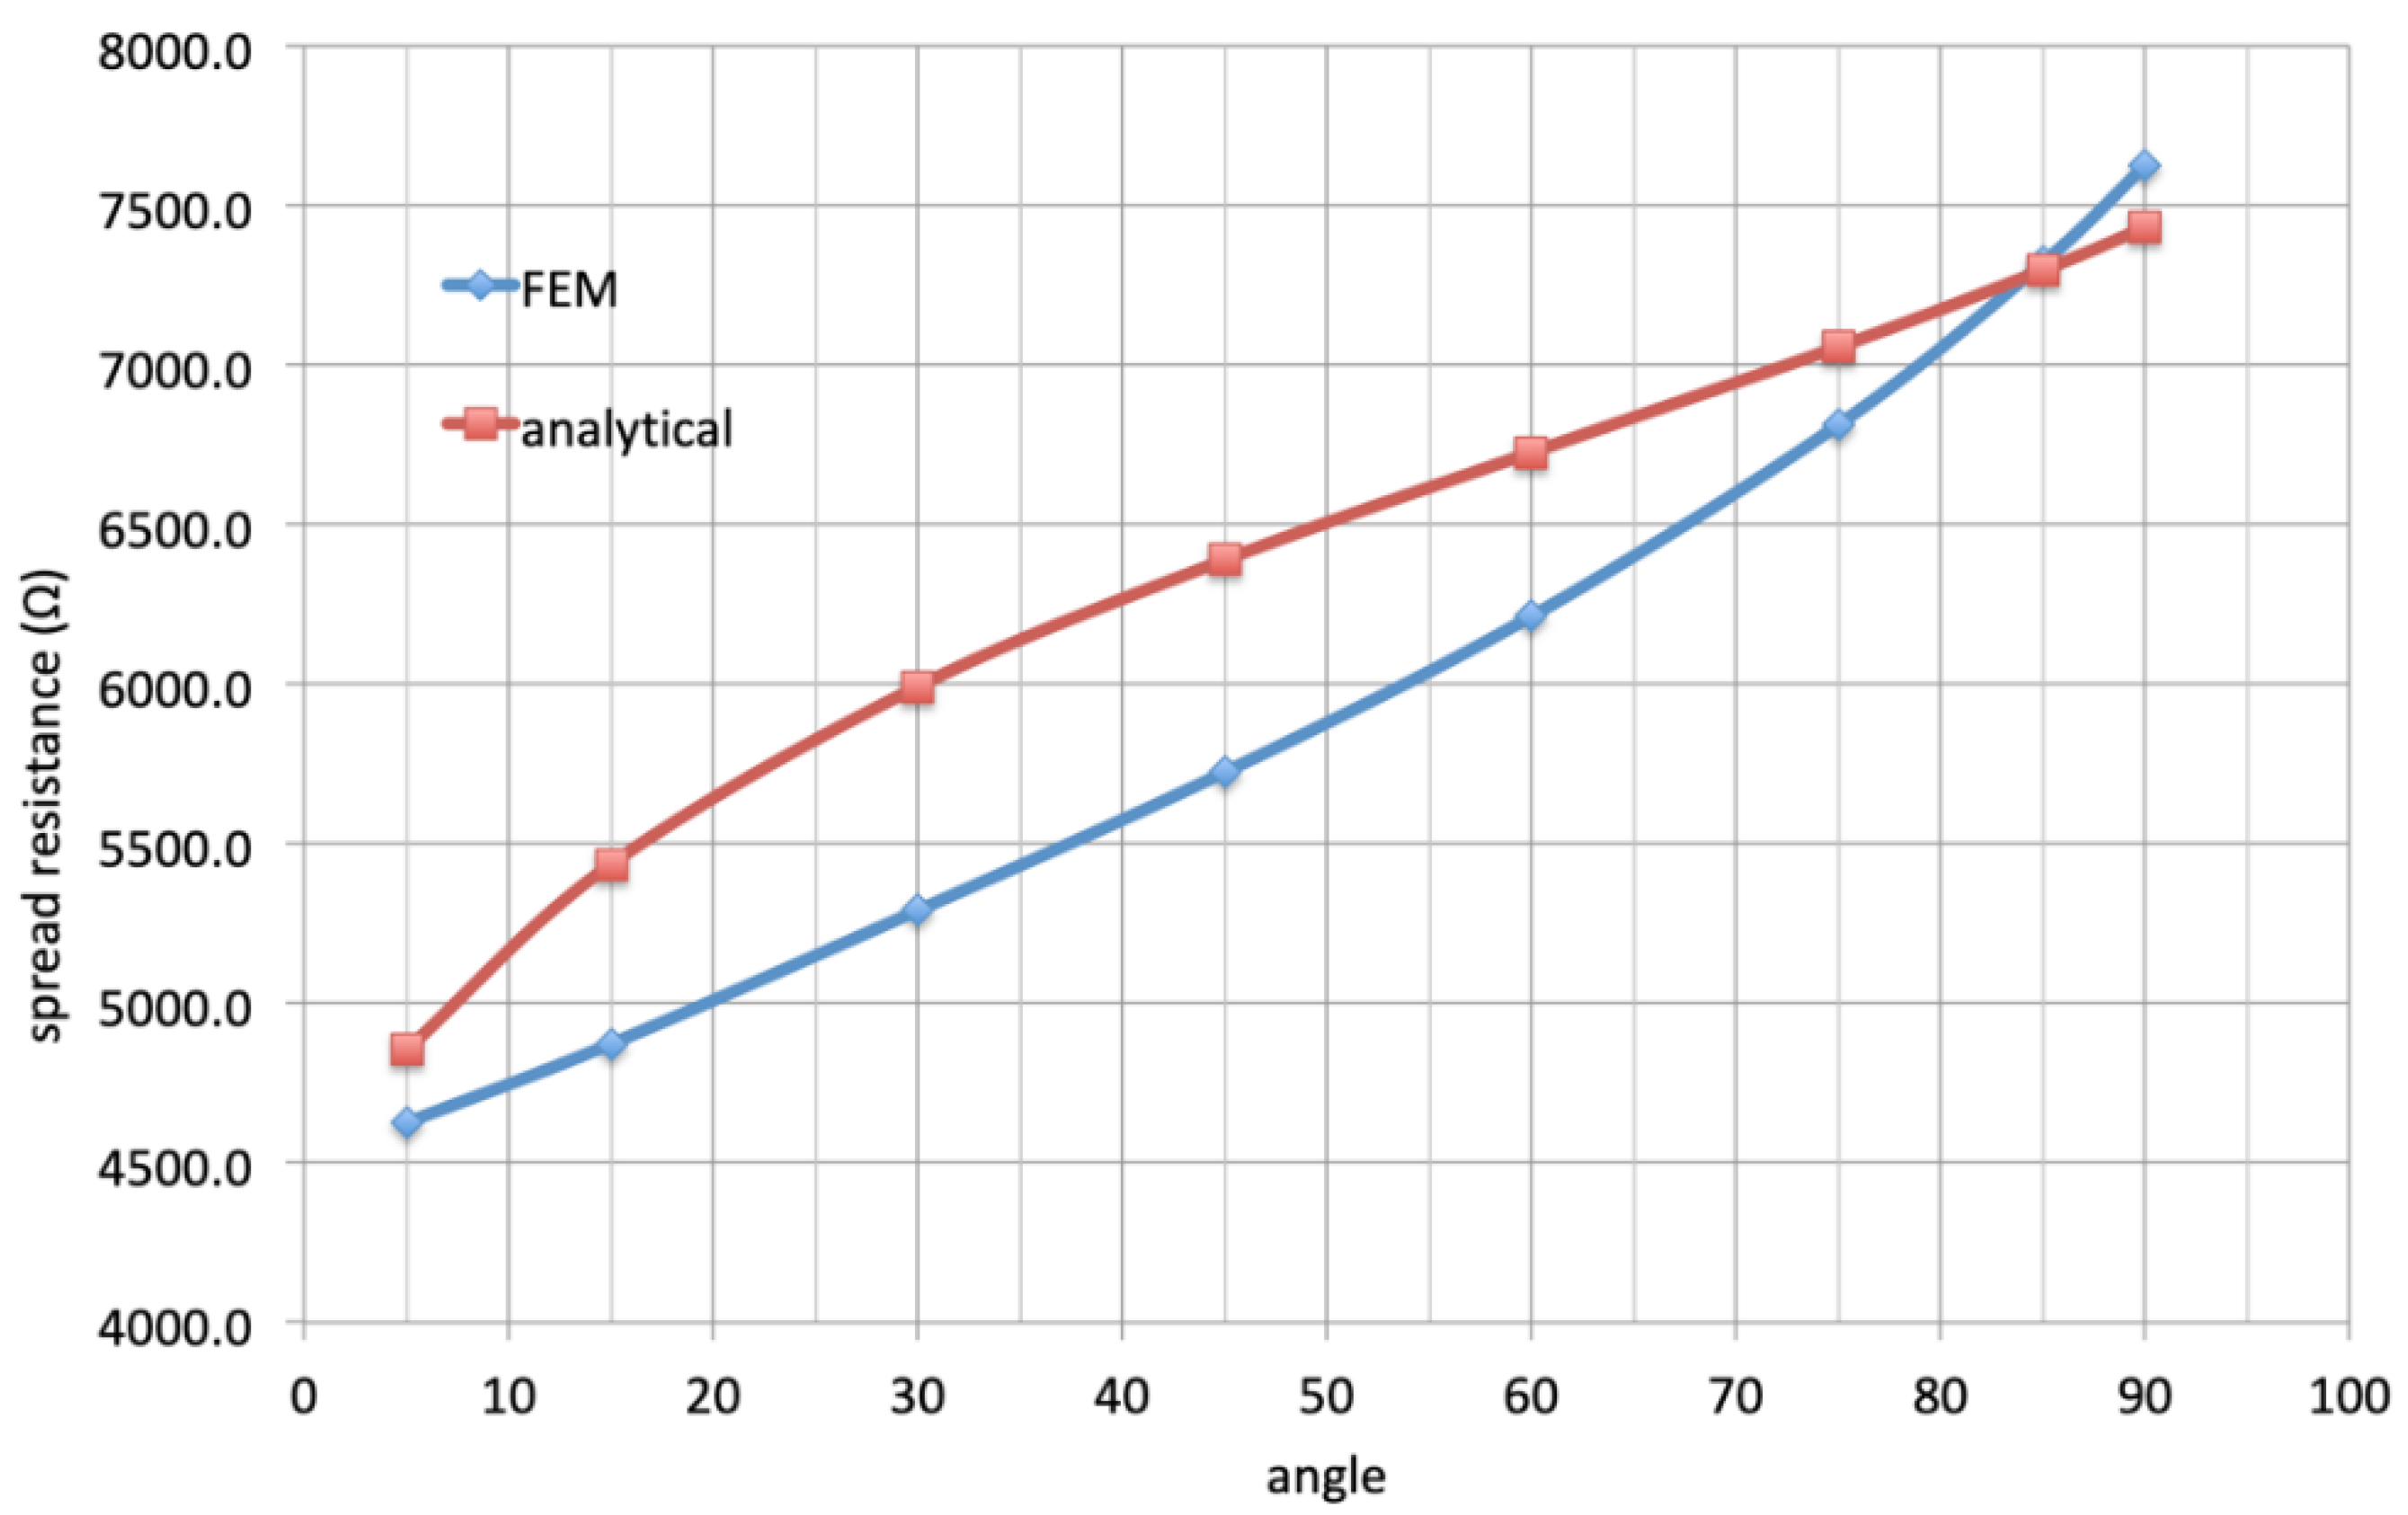
The FEM model is then modified by including a block of resistivity ρ representing the soil; the top face of this block is in contact with the bottom face of the pore, thus allowing the spread resistance to be calculated by applying a constant 1 A current on the top face of the pore and setting a 0 V potential to the faces of the soil block. The FEM model is depicted in Figure 5. The spread resistance is obtained by dividing the potential of the top face of the pore by the 1 A current applied. Analytically, the leakage resistance in (1) can be evaluated as the grounding resistance of a circular plate of radius r a as R l = ρ 2 r a , whereas the pore resistance is estimated with (3). The comparison of the spread resistance versus α obtained with the FEM model and analytically with (1) is plotted in Figure 6. This figure shows that the spread resistance decreases as α decreases and that, apart from α = 90 ° (which represents a cylindrical pore), the spread resistance calculated analytically with (1) is larger than that calculated with finite element analysis. Considering a cylindrical pore of radius r a and a resistivity ρ p = ρ 10 = 10 Ω.m (value supported by field measurements, see [38]), the spread resistance evaluated with (1) is 4731 Ω, very close to the value obtained in the case of a pore with α = 5 ° and ρ p = 100 Ω.m, which is 4627 Ω and represents the minimum value of spread resistance obtained for a pore with an angle. Therefore, in the following analysis for simplicity a cylindrical pore with an averaged resistivity value of ρ p = ρ 10 is considered. This configuration is conservative as the spread resistance equals the minimum value of the spread resistance obtained for a pore with an angle between the coating and the coating fault gutter.

3. Probabilistic Evaluation of the Leakage Current Density through a Holiday in the Coating

Almost always, power frequency electromagnetic interference problems among power/railway lines and pipelines/telecommunication cables are based on a purely deterministic approach that assumes that all the parameters characterizing the calculation model are known and expressed by specific values. Nevertheless, this is not always the case; in certain situations, some of the model parameters have a random behavior that suggests a different approach to the problem that necessarily involves concepts of probabilistic-statistical nature.
Just the issue which is the object of this paper has this kind of characteristic because the area size of the holidays present in the insulating coating of the pipeline can be considered, without any doubt, a random parameter.
Therefore, under the assumption that area A of the holiday is represented by a random variable, this section proposes a probabilistic method to assess the value of the current density leaking from a holiday, present in the pipe insulating coating, to the soil. More explicitly, one may pose the problem as follows by starting from these two assumptions:
  • If V is the value of the induced voltage in a specific point along the pipeline due to the electromagnetic influence produced by nearby High Voltage power lines or electrified railway lines.
  • If, at the same point, a holiday in the pipeline insulating coating is present.
Then, evaluate the probability that the induced AC current density, due to the electromagnetic interference from nearby power/railway lines, exceeds the limit value Jlim established by the standards. See, for example, [10] or [35].
One can summarize the basic steps of the whole calculation procedure in the flow chart in Figure 7.
Before presenting the formulas to assess the above-mentioned probability, it is necessary to summarize some basic relationships, given in [39], that are here reported for convenience.

3.1. Relationships among Induced Voltage, Current Density and Holiday Area

In the previous paragraph devoted to the FEM simulations, it has been shown that the simple model of the holiday inside the pipeline insulating coating given by a cylindrical pore having area A, height d (equal to the thickness of the coating) and constant resistivity ρp is a fair approximation. (See Figure 8 for a schematic drawing).
According to it, one has that the formula for the spread resistance Rs presented in many papers and textbooks, see for example [5,10], is given by:
R s = ρ 4 π A + ρ p d A
the first addendum represents the earth (or leakage) contribution, while the second represents the pore contribution. If V is the AC-induced pipe potential in the point where the holiday coating is located, one has that V / R s represents the AC leakage current to soil; therefore, it is possible to define an average current density J through the holiday (see Appendix A) by means of:
J = V ρ p d + ρ 4 π A
This quantity has to be compared with the limit value J l i m suggested by the standards to assess the AC corrosion risk for the pipeline, i.e., it has to be J < J l i m . Thus, from Formula (5), one must have:
π A 4 ρ V J l i m ρ p d
that yields:
A A m a x V = 16 π ρ 2 V J l i m ρ p d
A m a x represents, for a given value of the induced potential V, the maximum value of the holiday area such that one can have a current density exceeding J l i m .
At the same time, being the left-hand-side of Formula (6) a positive quantity, it must be V J l i m   ρ p d . Thus, one obtains a threshold value V m i n for the induced potential; such a quantity represents the minimum value for the induced potential V able to generate a current density greater than J l i m leaking to the soil through the holiday. Therefore, one has:
V V m i n = J l i m ρ p d
Notice that V m i n does not depend on soil resistivity but only on the resistivity of the material inside the pore.
Finally, it is useful to emphasize that the above formulas involve only the area size of the holiday and are not based on a particular shape. See Appendix A for further details.

3.2. Probability Distribution of the Holidays Area

Based on the experimental data and their processing presented in [39], one has that the empirical probability density distribution w A of the holidays area is sufficiently well fitted by a log-normal distribution given by:
w A = 1 A σ 2 π e 1 2 l n   A μ 2 σ
In (9), the parameters μ and σ characterizing the distribution have the following values: μ = −8.207 and σ = 1.419.

3.3. Probability of Exceeding the Limit Value Jlim

By considering Formulas (7)–(9), it is possible to write the following relationship expressing the probability that a leakage current J , flowing through a holiday located in a point at potential V , exceeds the limit value J l i m . One has:
P ( J ( V ) J lim ) = P ( A A max ( V ) ) = 0 A max ( V ) 1 A σ 2 π e 1 2 ( ln A μ ) 2 σ d A i f   V > V min 0 o t h e r w i s e
Therefore, if the induced voltage profile is known along all the pipeline routes, the above formula calculates the probability that the leakage current J exceeds J l i m at any point of the pipeline provided that a holiday is present at the same point. In such a way, it is possible to identify along the pipeline route the sections that are more exposed to the induced AC corrosion risk.

3.4. Influence of the Main Parameters

In this paragraph, some plots are presented that describe the probability of exceeding the value J l i m = 30 A/m2 (suggested by [10,35]) versus the induced AC potential V by varying the main parameters involved in the model that is: the soil resistivity ρ , the resistivity of the material inside the pore ρp and the insulating coating thickness d . As far as the parameter ρ p is concerned, two cases are considered:
(1)
The resistivity of the material inside the pore is equal to the soil resistivity, i.e.,: ρ p = ρ ;
(2)
The resistivity ρ p is one order of magnitude smaller than ρ i.e., ρ p = ρ / 10 . This hypothesis is suggested by some results based on field measurements and described in [38].
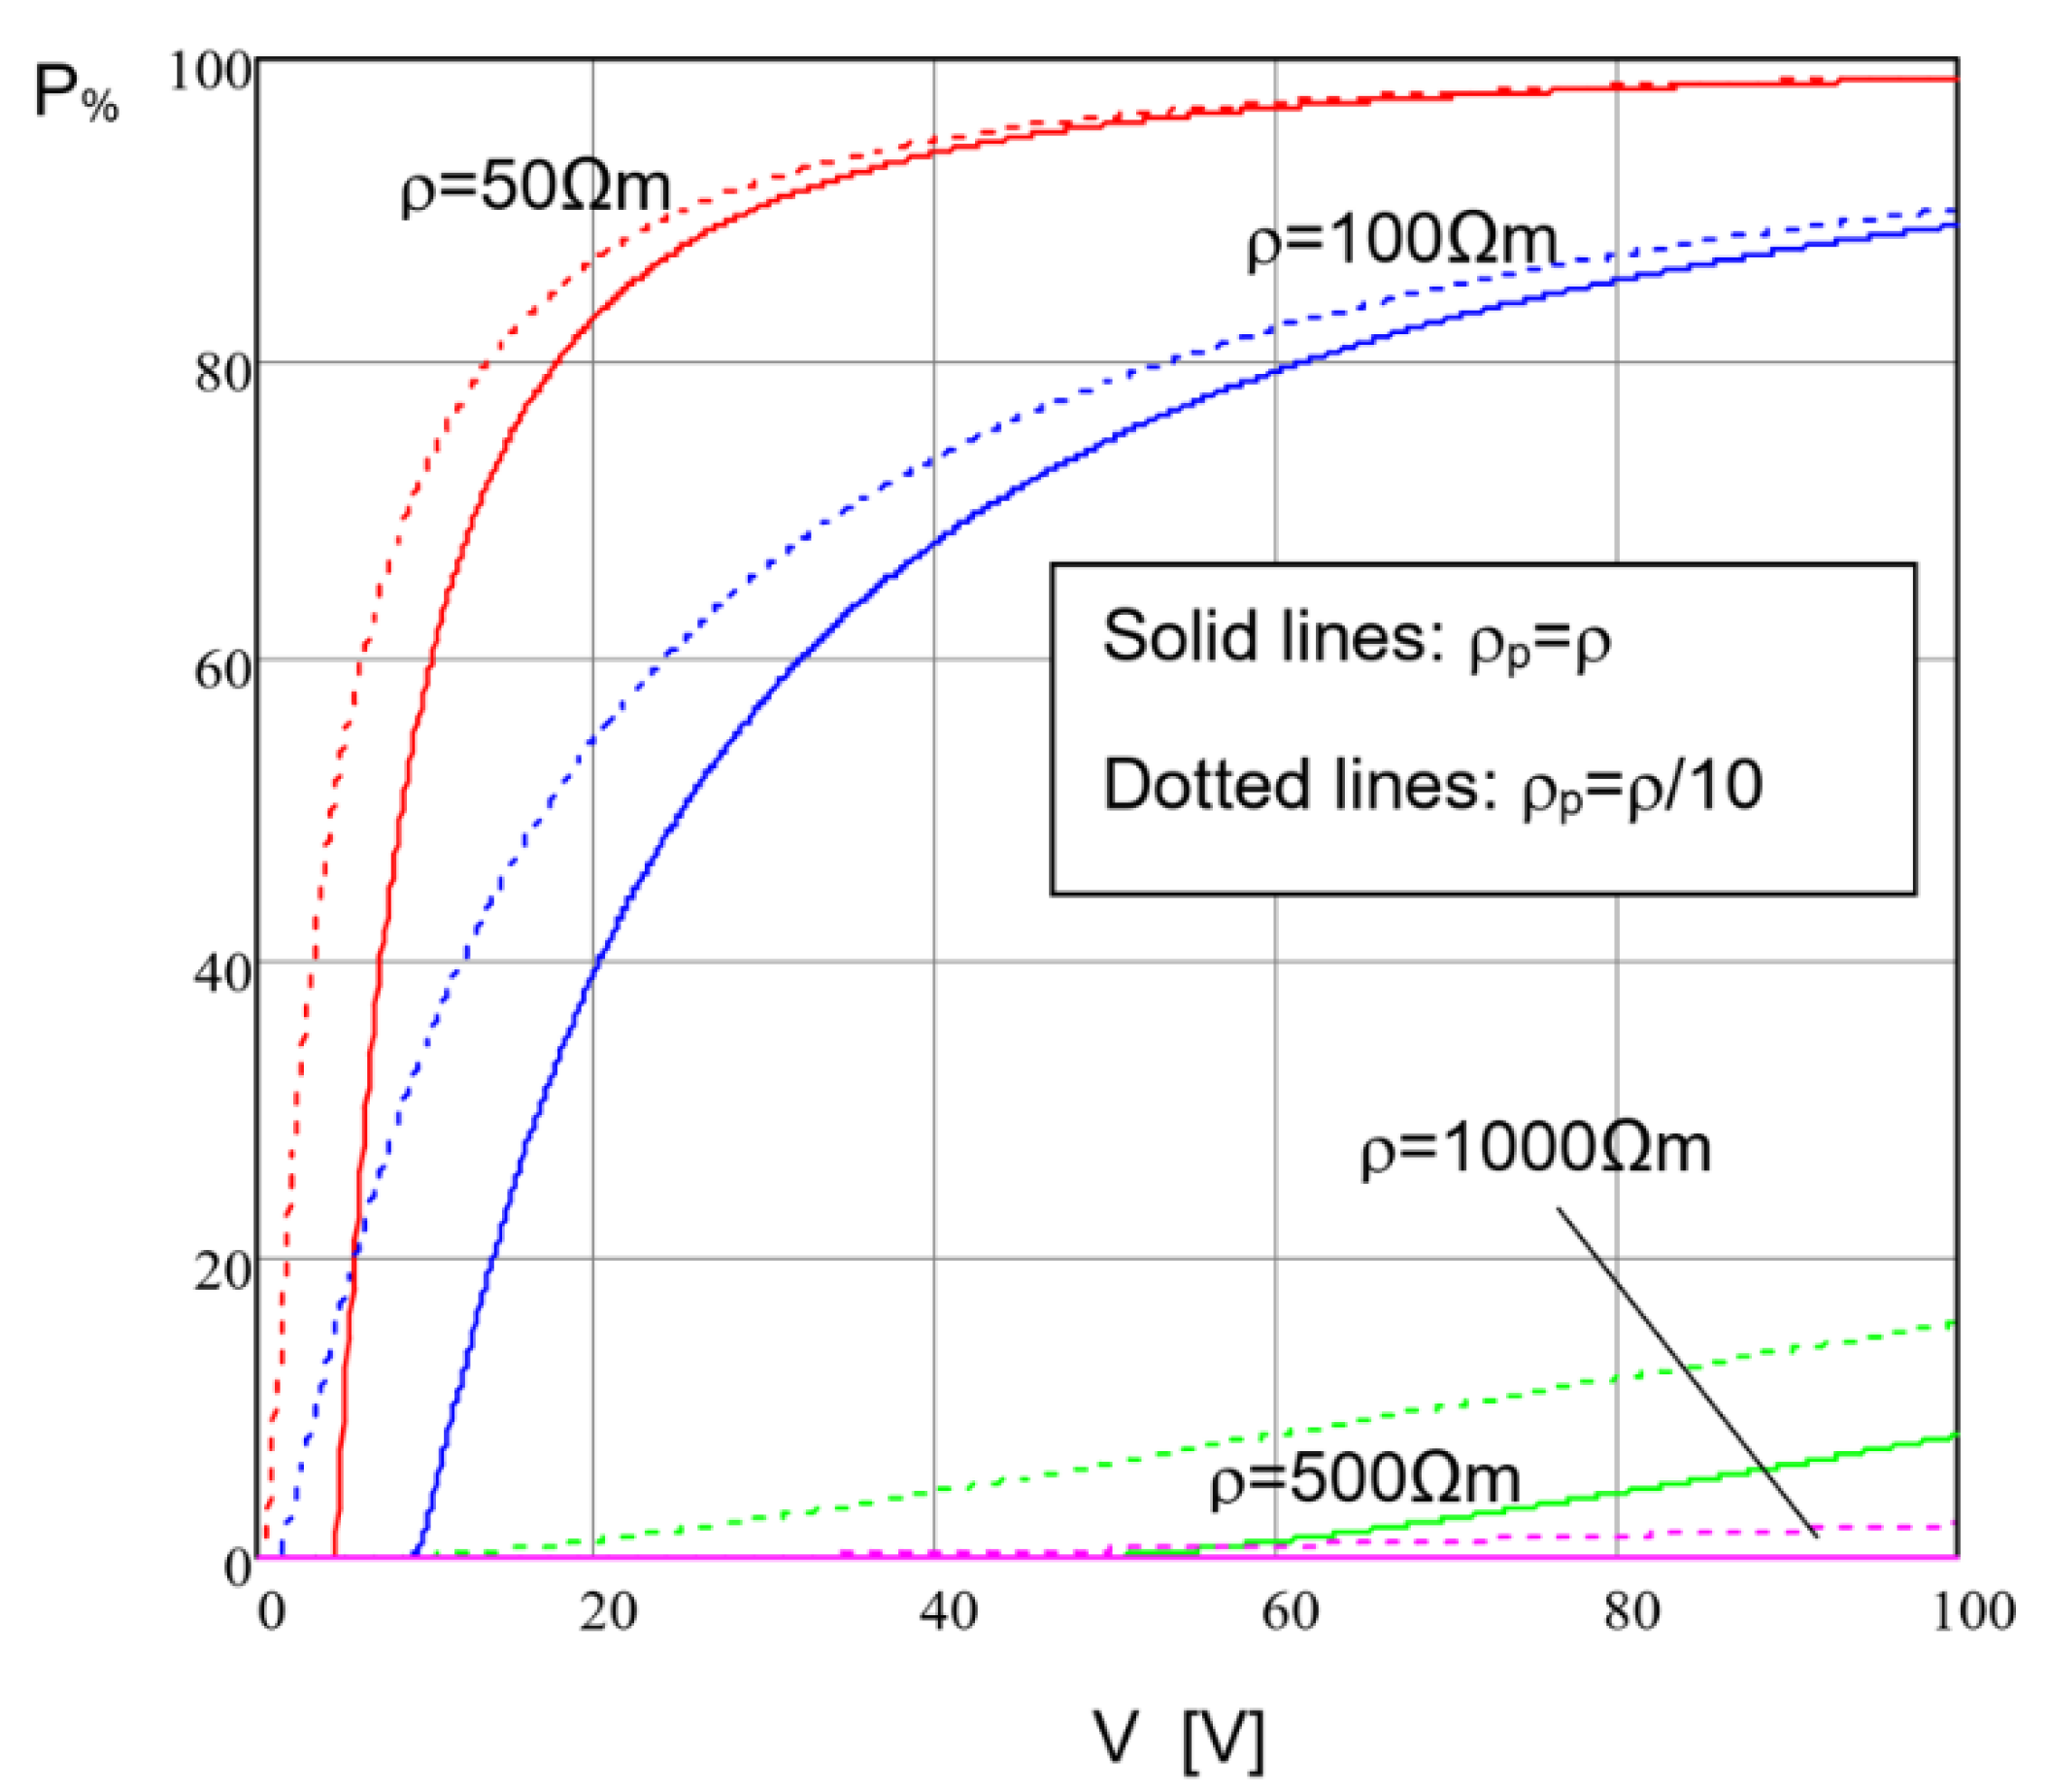
In Figure 9, the probability, of the induced AC current density exceeding the value of 30 A/m2 versus the induced potential is shown; in particular, the curves have been plotted in correspondence with different values of soil resistivity by considering both cases (1) and (2).
Figure 9 clearly confirms what is also known from experience, i.e., the probability of exceeding the limit value of 30 A/m2 is much higher for low and medium-low soil resistivities than for high and medium-high resistivities. Moreover, as one could expect, the case with ρ p = ρ / 10 is associated with higher probabilities because the spread resistance Rs is smaller than the cases with ρ p = ρ .
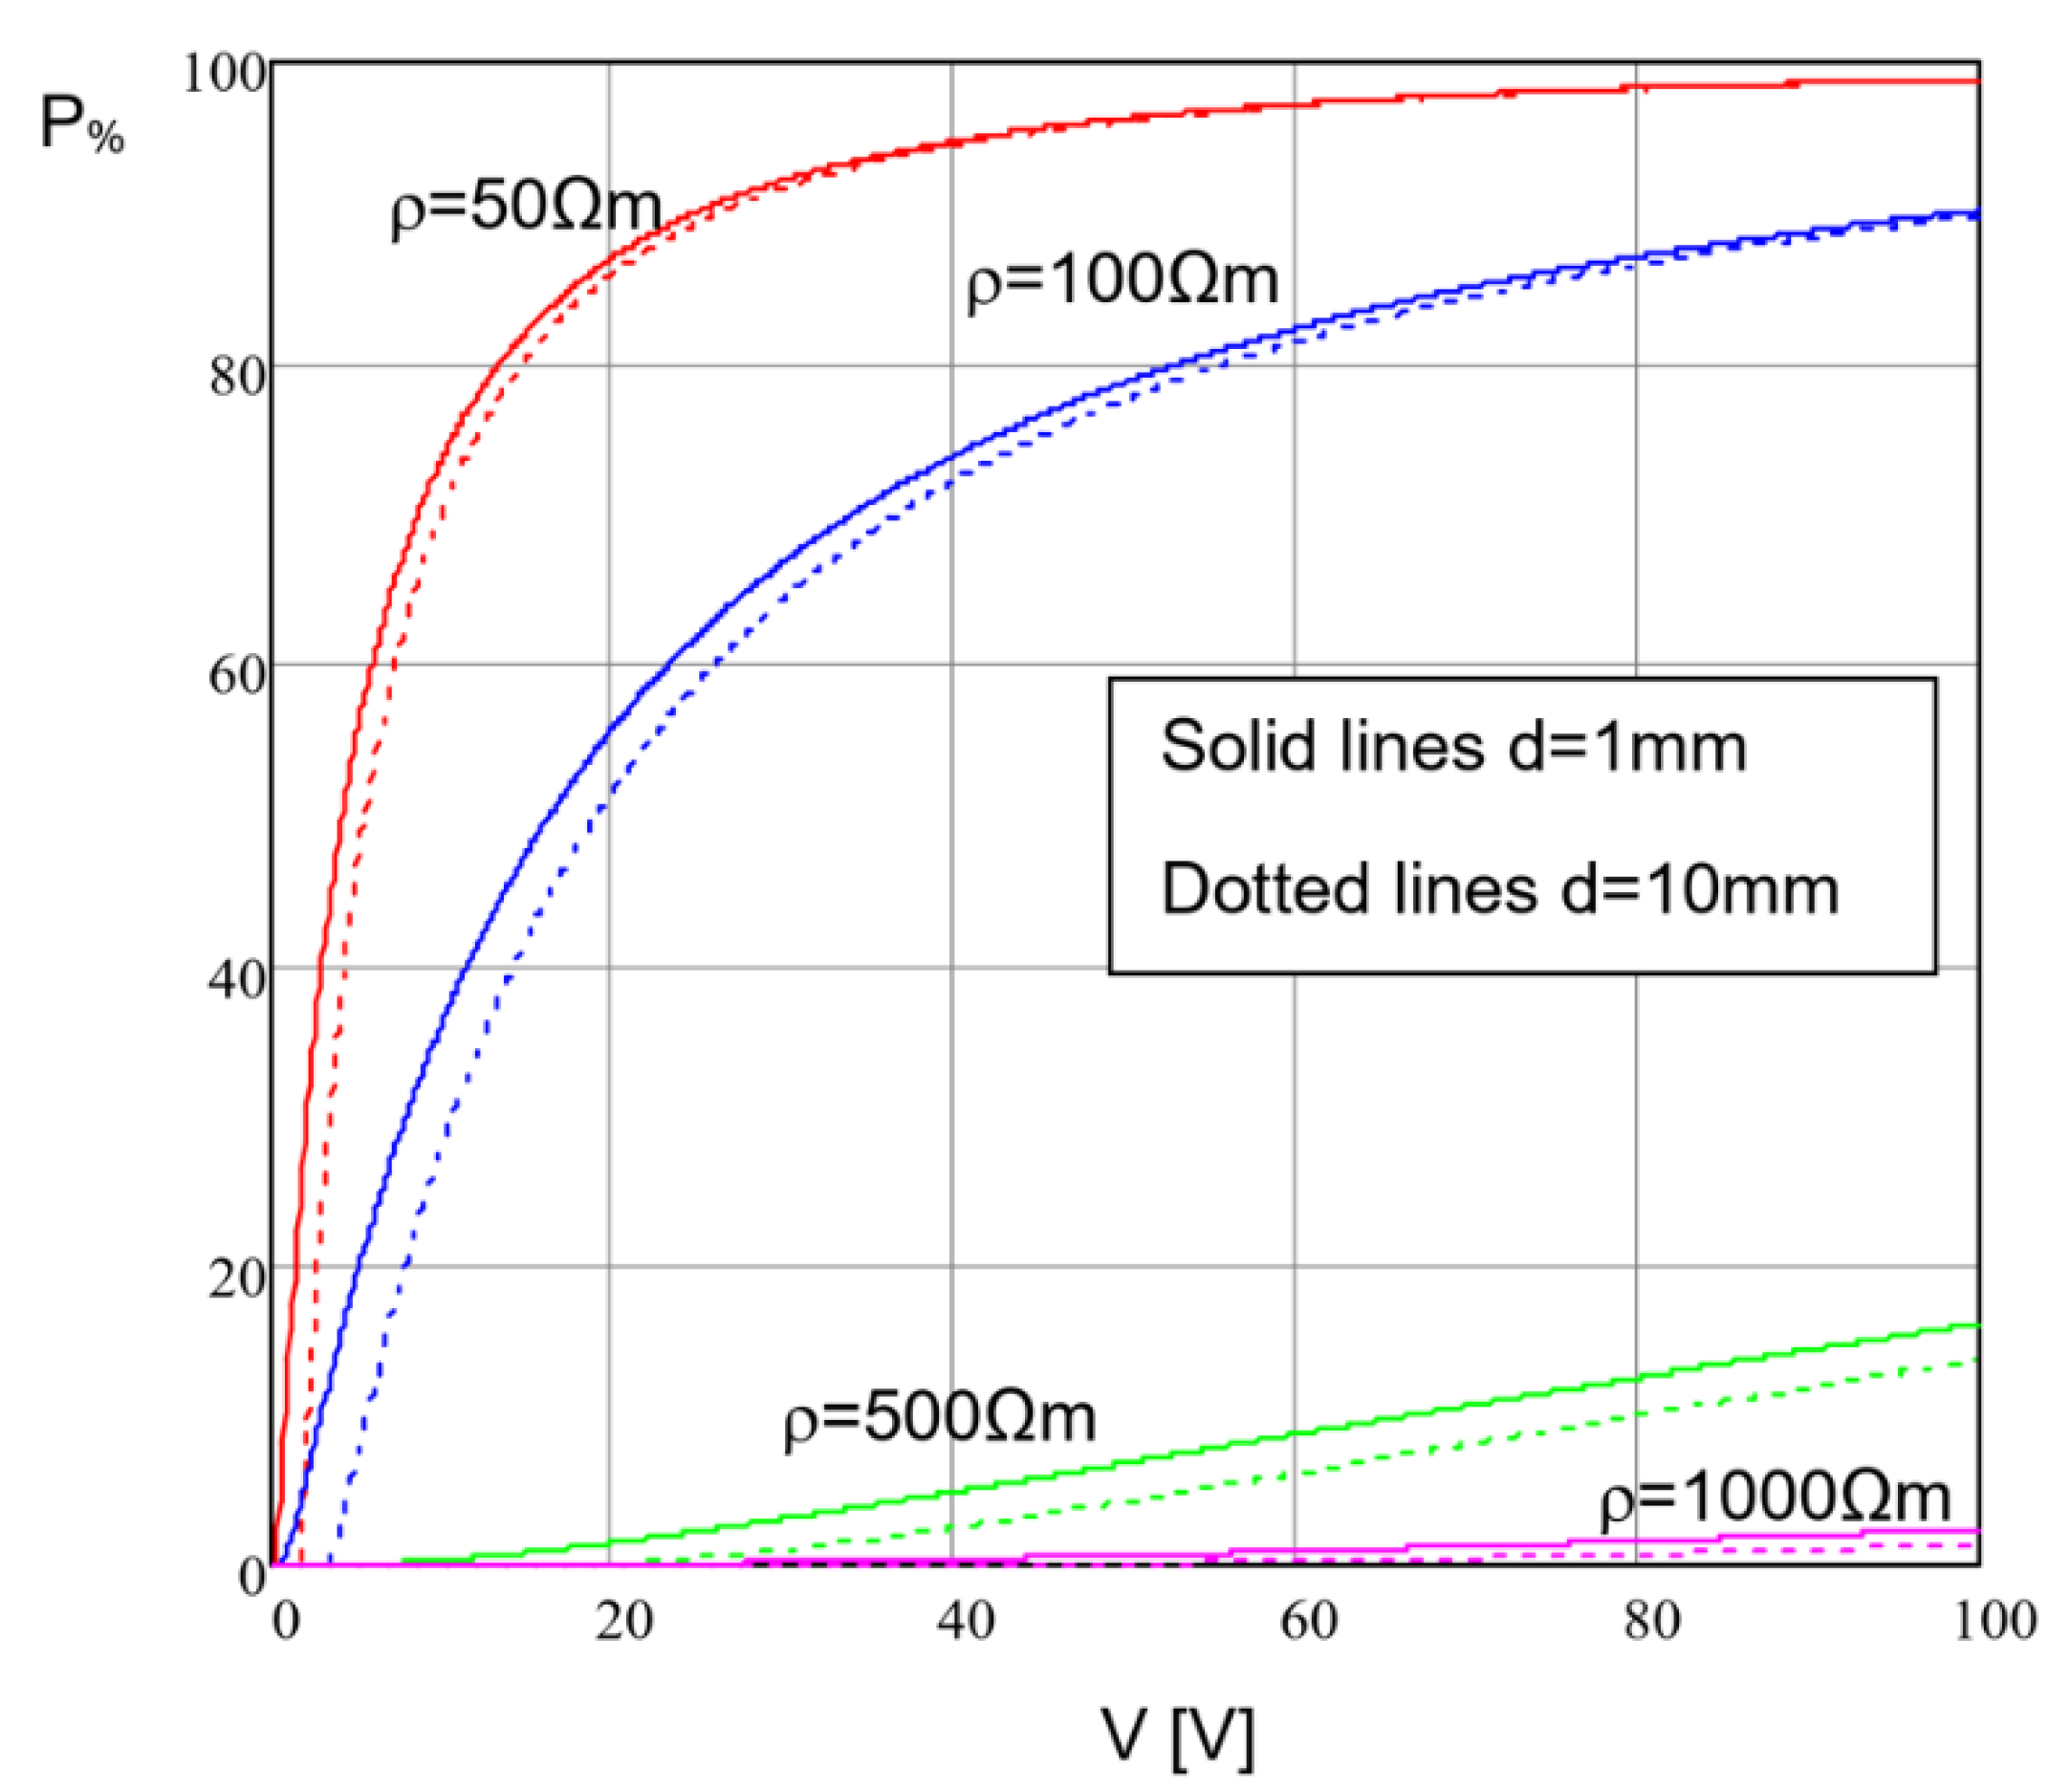
Figure 10 has been plotted by considering different values for soil resistivity and very different values of the coating thickness i.e., d = 1 mm and d = 10 mm, representing the extreme values inside the typical range for d. Moreover, it has been assumed that ρ p = ρ / 10 .
By looking at Figure 10, since ρ p = ρ / 10 , one has that the second addendum in (4) contributes only in a minor way to the spread resistance R s ; for such a reason, the probability curves corresponding to the same value ρ differ between them only slightly. Therefore, one can conclude that if the resistivity inside the pore is much smaller than the soil resistivity, the coating thickness has a scarce influence on the probability of exceeding the 30 A/m2 limits.

3.5. Example of Application to a Real Case of 50 Hz Interference

In this paragraph, one considers a 50 Hz interference case between a 380 kV power line carrying, under normal operating conditions, a balanced current of 630 A and a nearby pipeline 28.5 km long having a coating thickness of 3 mm; the soil resistivity is 100 Ωm; the layouts of the two plants are shown in Figure 11 where one can notice a close approaching between them for almost the whole pipeline route.
By means of a two-step calculation method based on treating both power line and pipeline by means of equivalent transmission line models one can obtain the 50 Hz induced voltage along the pipeline versus the pipeline abscissa s (see Figure 12).
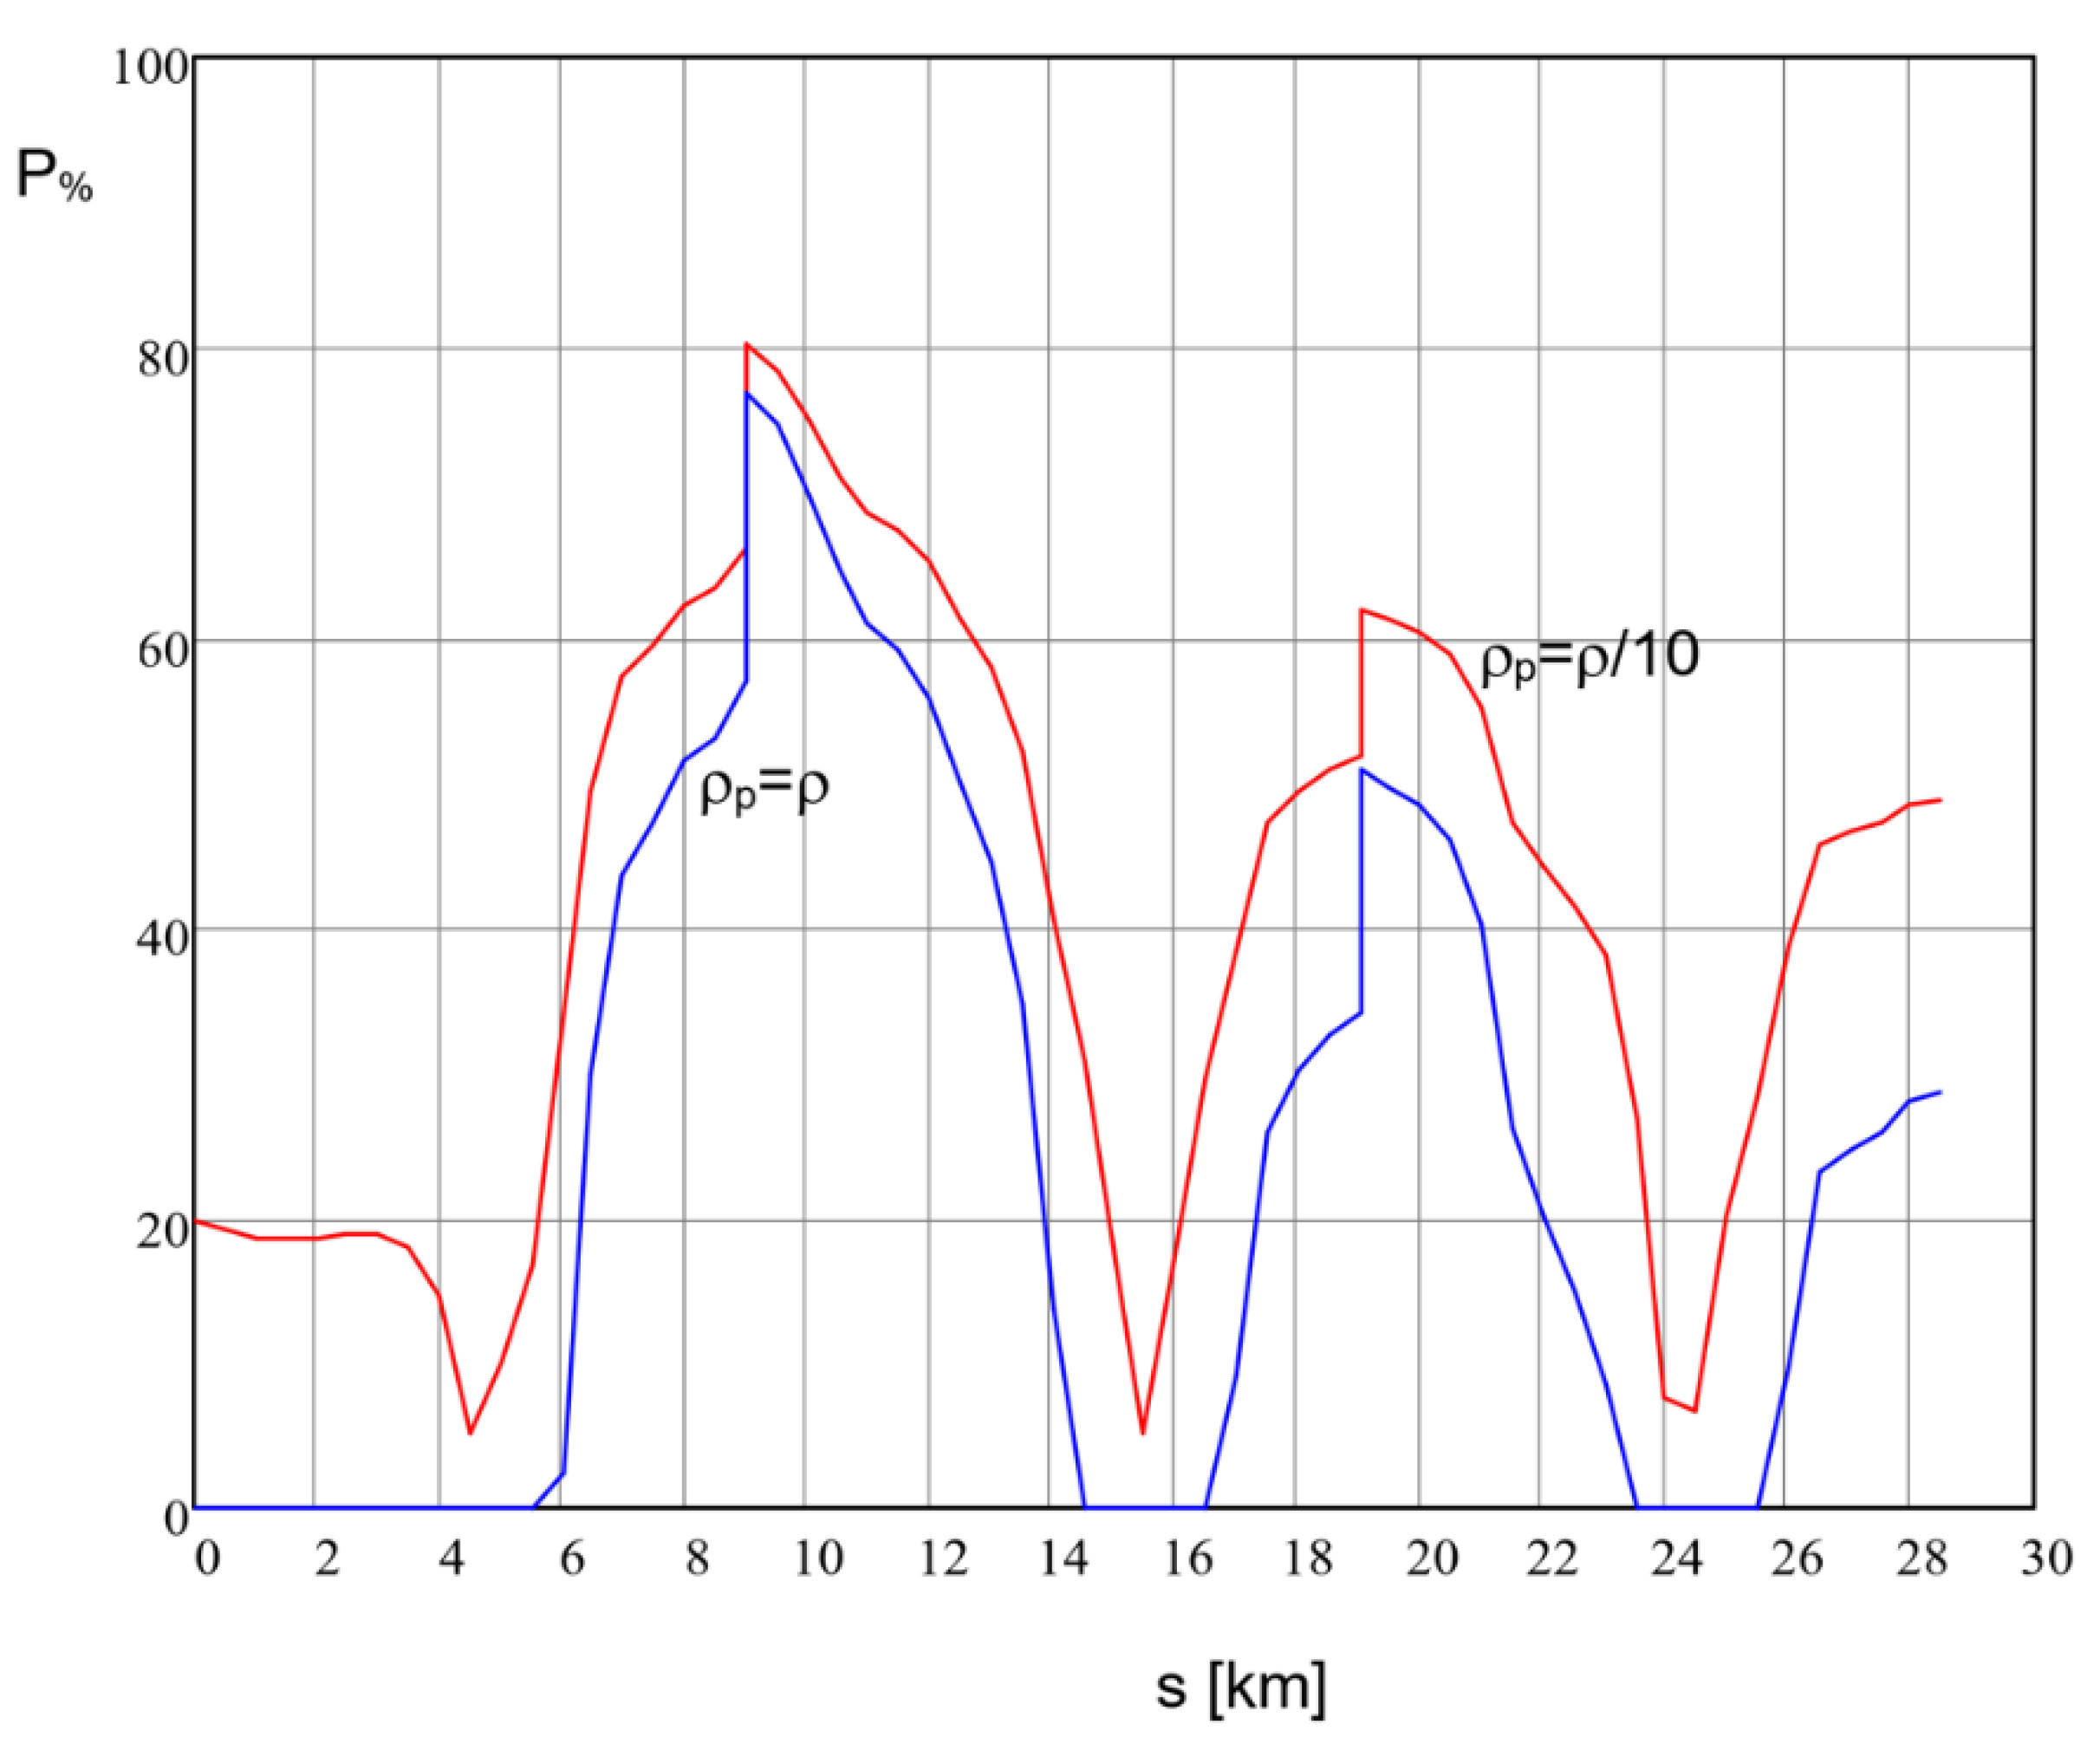
By applying (10), one can determine the probability that the limit of 30   A / m 2 for the induced current density is exceeded in a generic point of abscissa s along the pipeline provided that a holiday exists in the insulating coating in the same point. As far as the pore resistivity is concerned, the two hypotheses previously presented have been considered i.e., ρ p = ρ and ρ p = ρ / 10 . The results are shown in Figure 13.
As one can expect, the probability profiles of Figure 13 are like the induced voltage profile of Figure 12 just because, according to Formula (4), the current density J is directly proportional to the voltage V. According to the expectations, the plot in Figure 13 corresponding to the case ρ p = ρ is always lower than the one corresponding to the case ρ p = ρ / 10 and in certain intervals, along the pipeline route it is zero.

4. Conclusions

This paper presents an approach consisting of field theory and circuit methods combined with a stochastic approach for analysing the probability of exceeding the current density limit for corrosion in metallic pipelines. The FEM analysis shows that the pore shape influences the values of spread resistance; in particular, pores with an angle between the coating and the coating fault gutter have a resistance that decreases when the angle decreases. It is shown that conservative results from the point of view of the probability of exceeding the current density limits for pipeline corrosion are found when the pore has a cylindrical shape, with a resistivity for the medium inside the pore equal to one-tenth of the soil resistivity. The method allows plots showing the induced voltage along the pipeline to be found; based on these plots and knowledge of the probabilistic distribution of holidays area, it is possible to individuate the sections along the pipeline route, more exposed to potential AC corrosion risk. Therefore, the proposed calculation method can be considered an auxiliary tool, especially at the design stage of new power lines or pipelines, to adopt suitable protective measures against AC corrosion.

Author Contributions

Conceptualization, G.L., A.C., L.S. and A.P.; methodology, G.L., L.S. and M.S.; software, G.L., L.S. and M.S.; validation, L.S. and M.S.; formal analysis, G.L.; investigation, G.L., A.C., L.S., A.P. and M.S.; resources, A.P, L.S. and A.C.; data curation, G.L. and L.S.; writing—original draft preparation, G.L., A.P., L.S. and M.S.; writing—review and editing, G.L., A.P. and L.S., M.S.; visualization, G.L., L.S. and M.S.; supervision, G.L., A.C., L.S. and A.P.; project administration, G.L., A.C., L.S. and A.P.; funding acquisition, A.C., A.P. and L.S. All authors have read and agreed to the published version of the manuscript.

Funding

This research received no external funding.

Institutional Review Board Statement

Not applicable.

Informed Consent Statement

Not applicable.

Conflicts of Interest

The authors declare no conflict of interest.

Appendix A

The purpose of this Appendix is to show that the shape of the holiday inside the pipeline insulating coating has a minimal influence on the probability of exceeding or not a certain limit for the current density and, for such a reason, it is reasonable to consider, in the calculation model, only the area A of the holiday itself.
Often, in literature, the holiday in the insulating coating of a pipeline is modelled by supposing that the small portion of the pipeline, in correspondence with the coating defect, which is in contact with the soil, (that is, the exposed area) can be represented by a metallic circular plate placed at the air-soil interface.
The circular shape is, of course, an extreme idealization, so one could further proceed by introducing a more realistic shape, that is the ellipse.
Starting point is the paper [40]; the authors consider an electrostatic problem involving an elliptic metallic plate of area Se with semi-major axis a and semi-minor axis b having potential V and unknown surface charge density η = η x , y . In practice, they found the solution of the following integral equation:
V = 1 4 π ϵ 0 S e η x , y x x 2 + y y 2 d x d y ,
which is given by:
η x , y = 2 ϵ 0 V b K k 1 1 x a 2 y b 2 ,
where K k is the complete elliptic integral of the first kind that is:
K k = 0 π 2 d θ 1 k 2 sin 2 θ
k is the ellipse eccentricity ( 0 k < 1 ) expressed by:
k = 1 b a 2 ,
and ϵ 0 is the absolute vacuum permittivity.
If the plate is in contact with a conductive medium having resistivity ρ (in the case of the present paper the soil) and by remembering the relationship between current density J x , y and surface charge density η x , y i.e.,:
J x , y = η x , y 2 ρ ϵ 0 ,
one finally has the expression of the current density on the elliptic plate, at potential V , and placed at the surface of the soil:
J x , y = V ρ b K k 1 1 x a 2 y b 2 .
By looking at (A6), one can notice that the current density is minimum at the center of the plate and tends to infinity by approaching the borders; nevertheless, one is interested in calculating an average (or equivalent) current density that is constant over all the area S e of the plate so that its flux through it is equal to current leaked to soil I e .
By integrating (A6) over S e one gets:
I e = S e V ρ b K k d x d y 1 x a 2 y b 2 = 4 V a K k ρ π 2 .
Finally, by remembering that the area of the ellipse is given by S e = π a b , one can obtain the average current density J e by means of:
J e = I e π a b = 2 V b ρ K k .
In the particular case when the plate has a circular shape of radius r , one has a = b = r ,   k = 0 and K 0 = π / 2 ; thus, the average current density J c is given by:
J c = 4 V ρ r π = 4 V ρ A π .
To assess the influence of the eccentricity on the current density leaked to the soil, it is useful to study the ratio λ between J e and J c for a given value of the plate area A in the function of the eccentricity k ; to do that, it also necessary to add that the semi-minor axis b can be expressed as:
b = 1 k 2 1 / 4 A π .
By considering (A8)–(A10) one finally has:
λ = J e J c = π 2 K k 4 1 k 2
Notice that λ is a function of the only eccentricity.
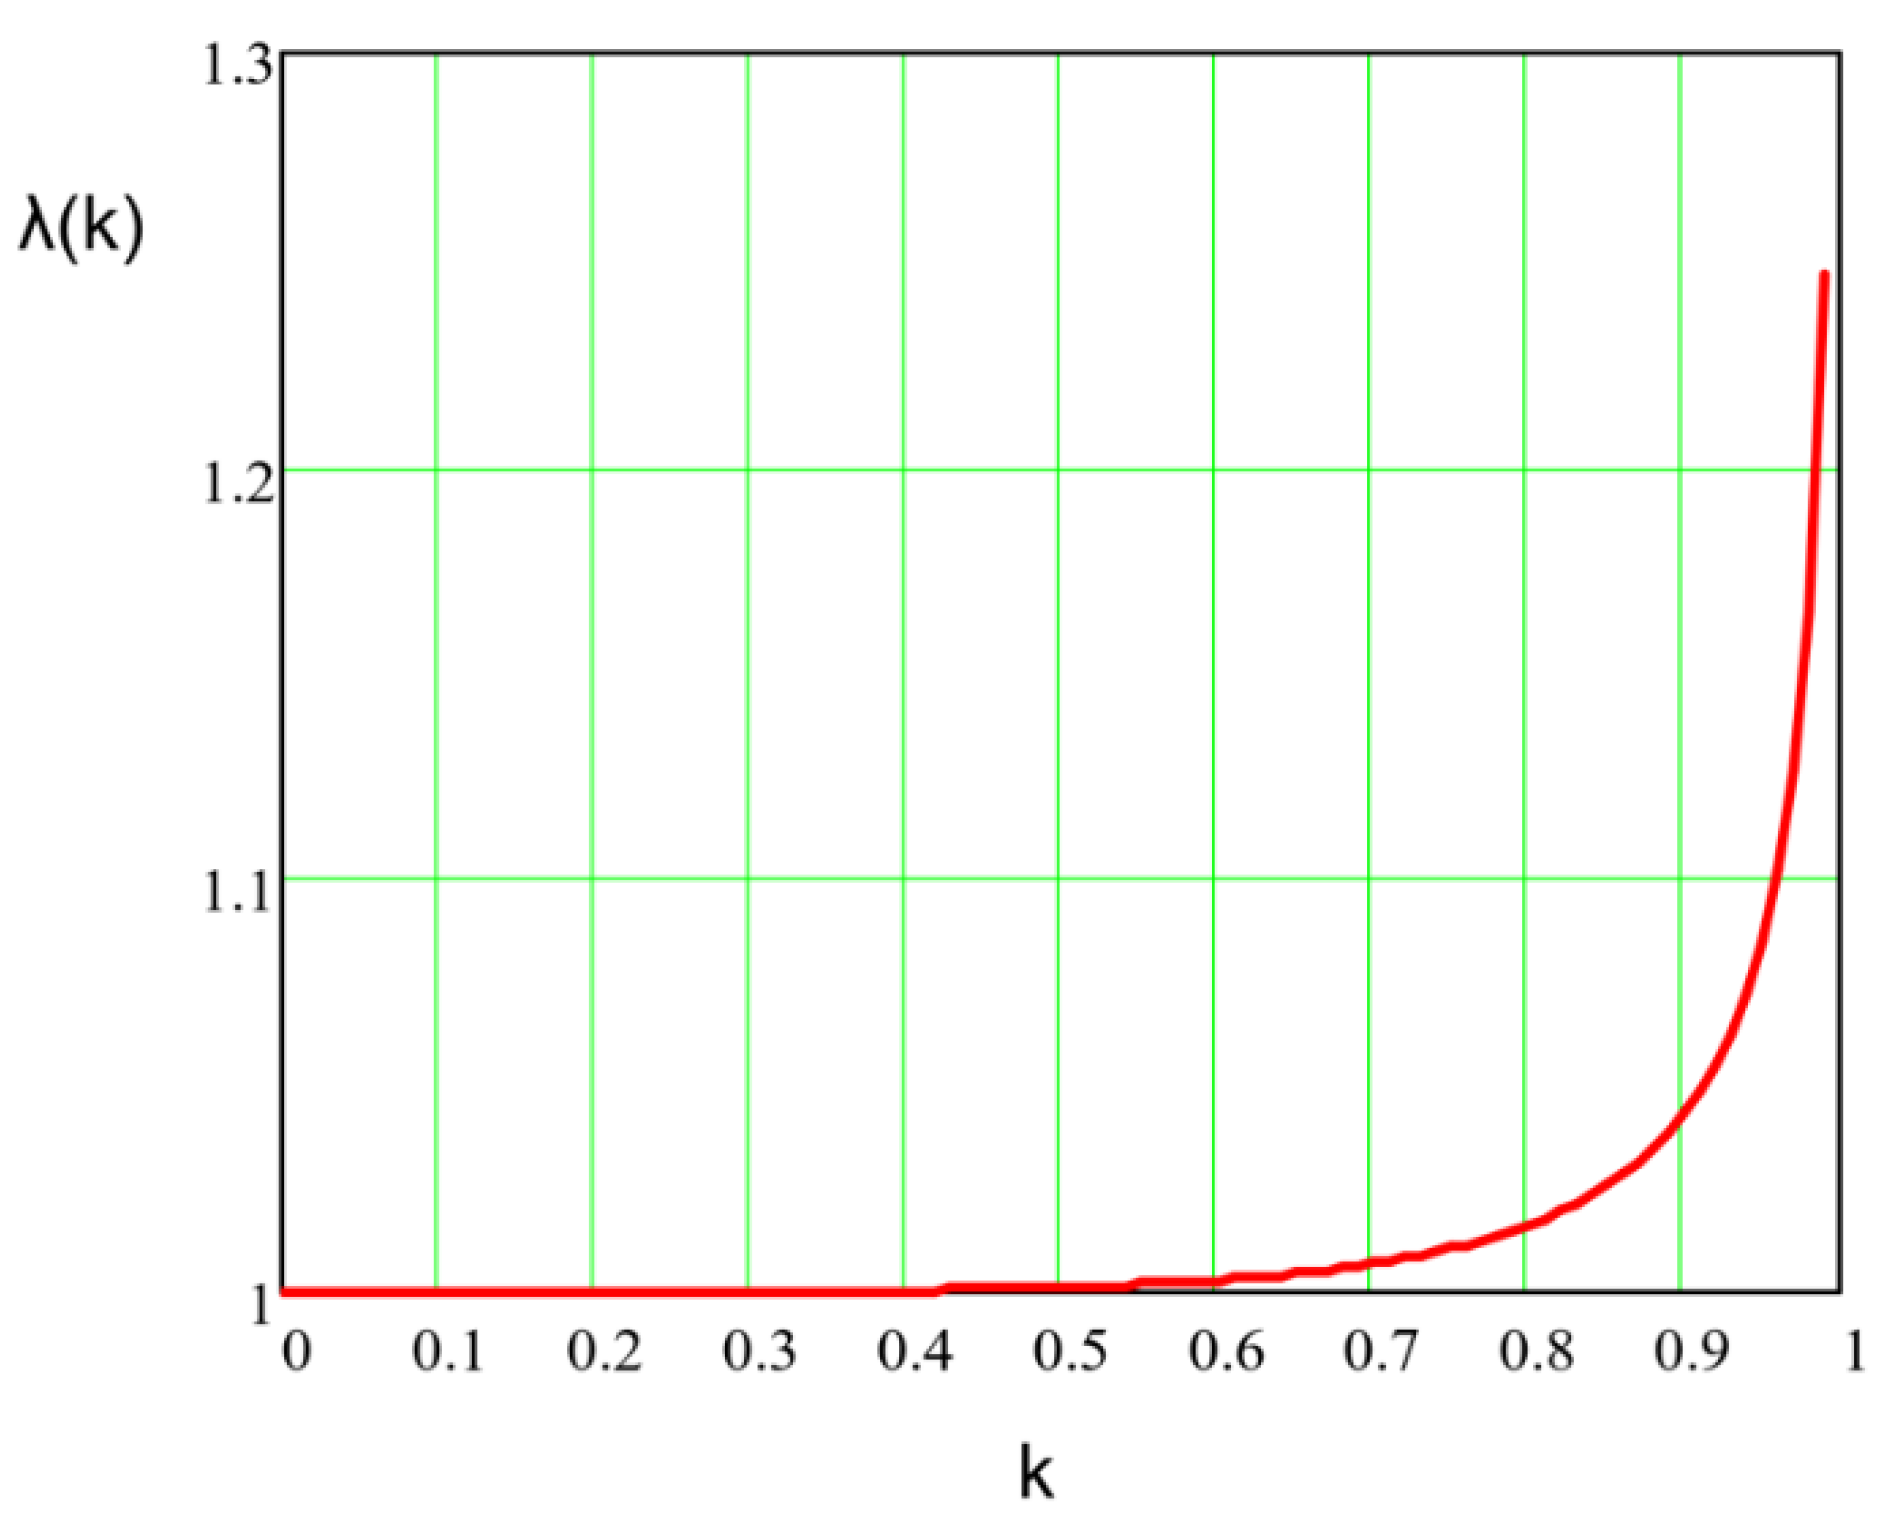
In Figure A1 the function λ = λ k has been plotted.
Figure A1. Plot of the function λ.
Applsci 13 07669 g0a1
Figure A1 clearly shows that, for a given area A , the differences between the current density flowing through an elliptical holiday and the one through a circular holiday can be considered significative only for values of k greater than 0.95; this means considering ellipses having an extremely eccentric shape that can be found only very seldom in practice.
It is reasonable to assume that such a result also holds for more irregular holiday shapes, and that leads to considering the area of the holiday and not its shape as a basic parameter for the model introduced in this paper.
To test such a conclusion, a Monte Carlo procedure has been applied to obtain the probability of exceeding the limit of 30 A/m2 for holidays having elliptical and circular shapes but for the same value of area A .
In the Monte Carlo procedure, the random variables are:
  • The holiday area A with log-normal distribution given by (9);
  • The ellipse eccentricity k with uniform distribution inside the interval [0, 1).
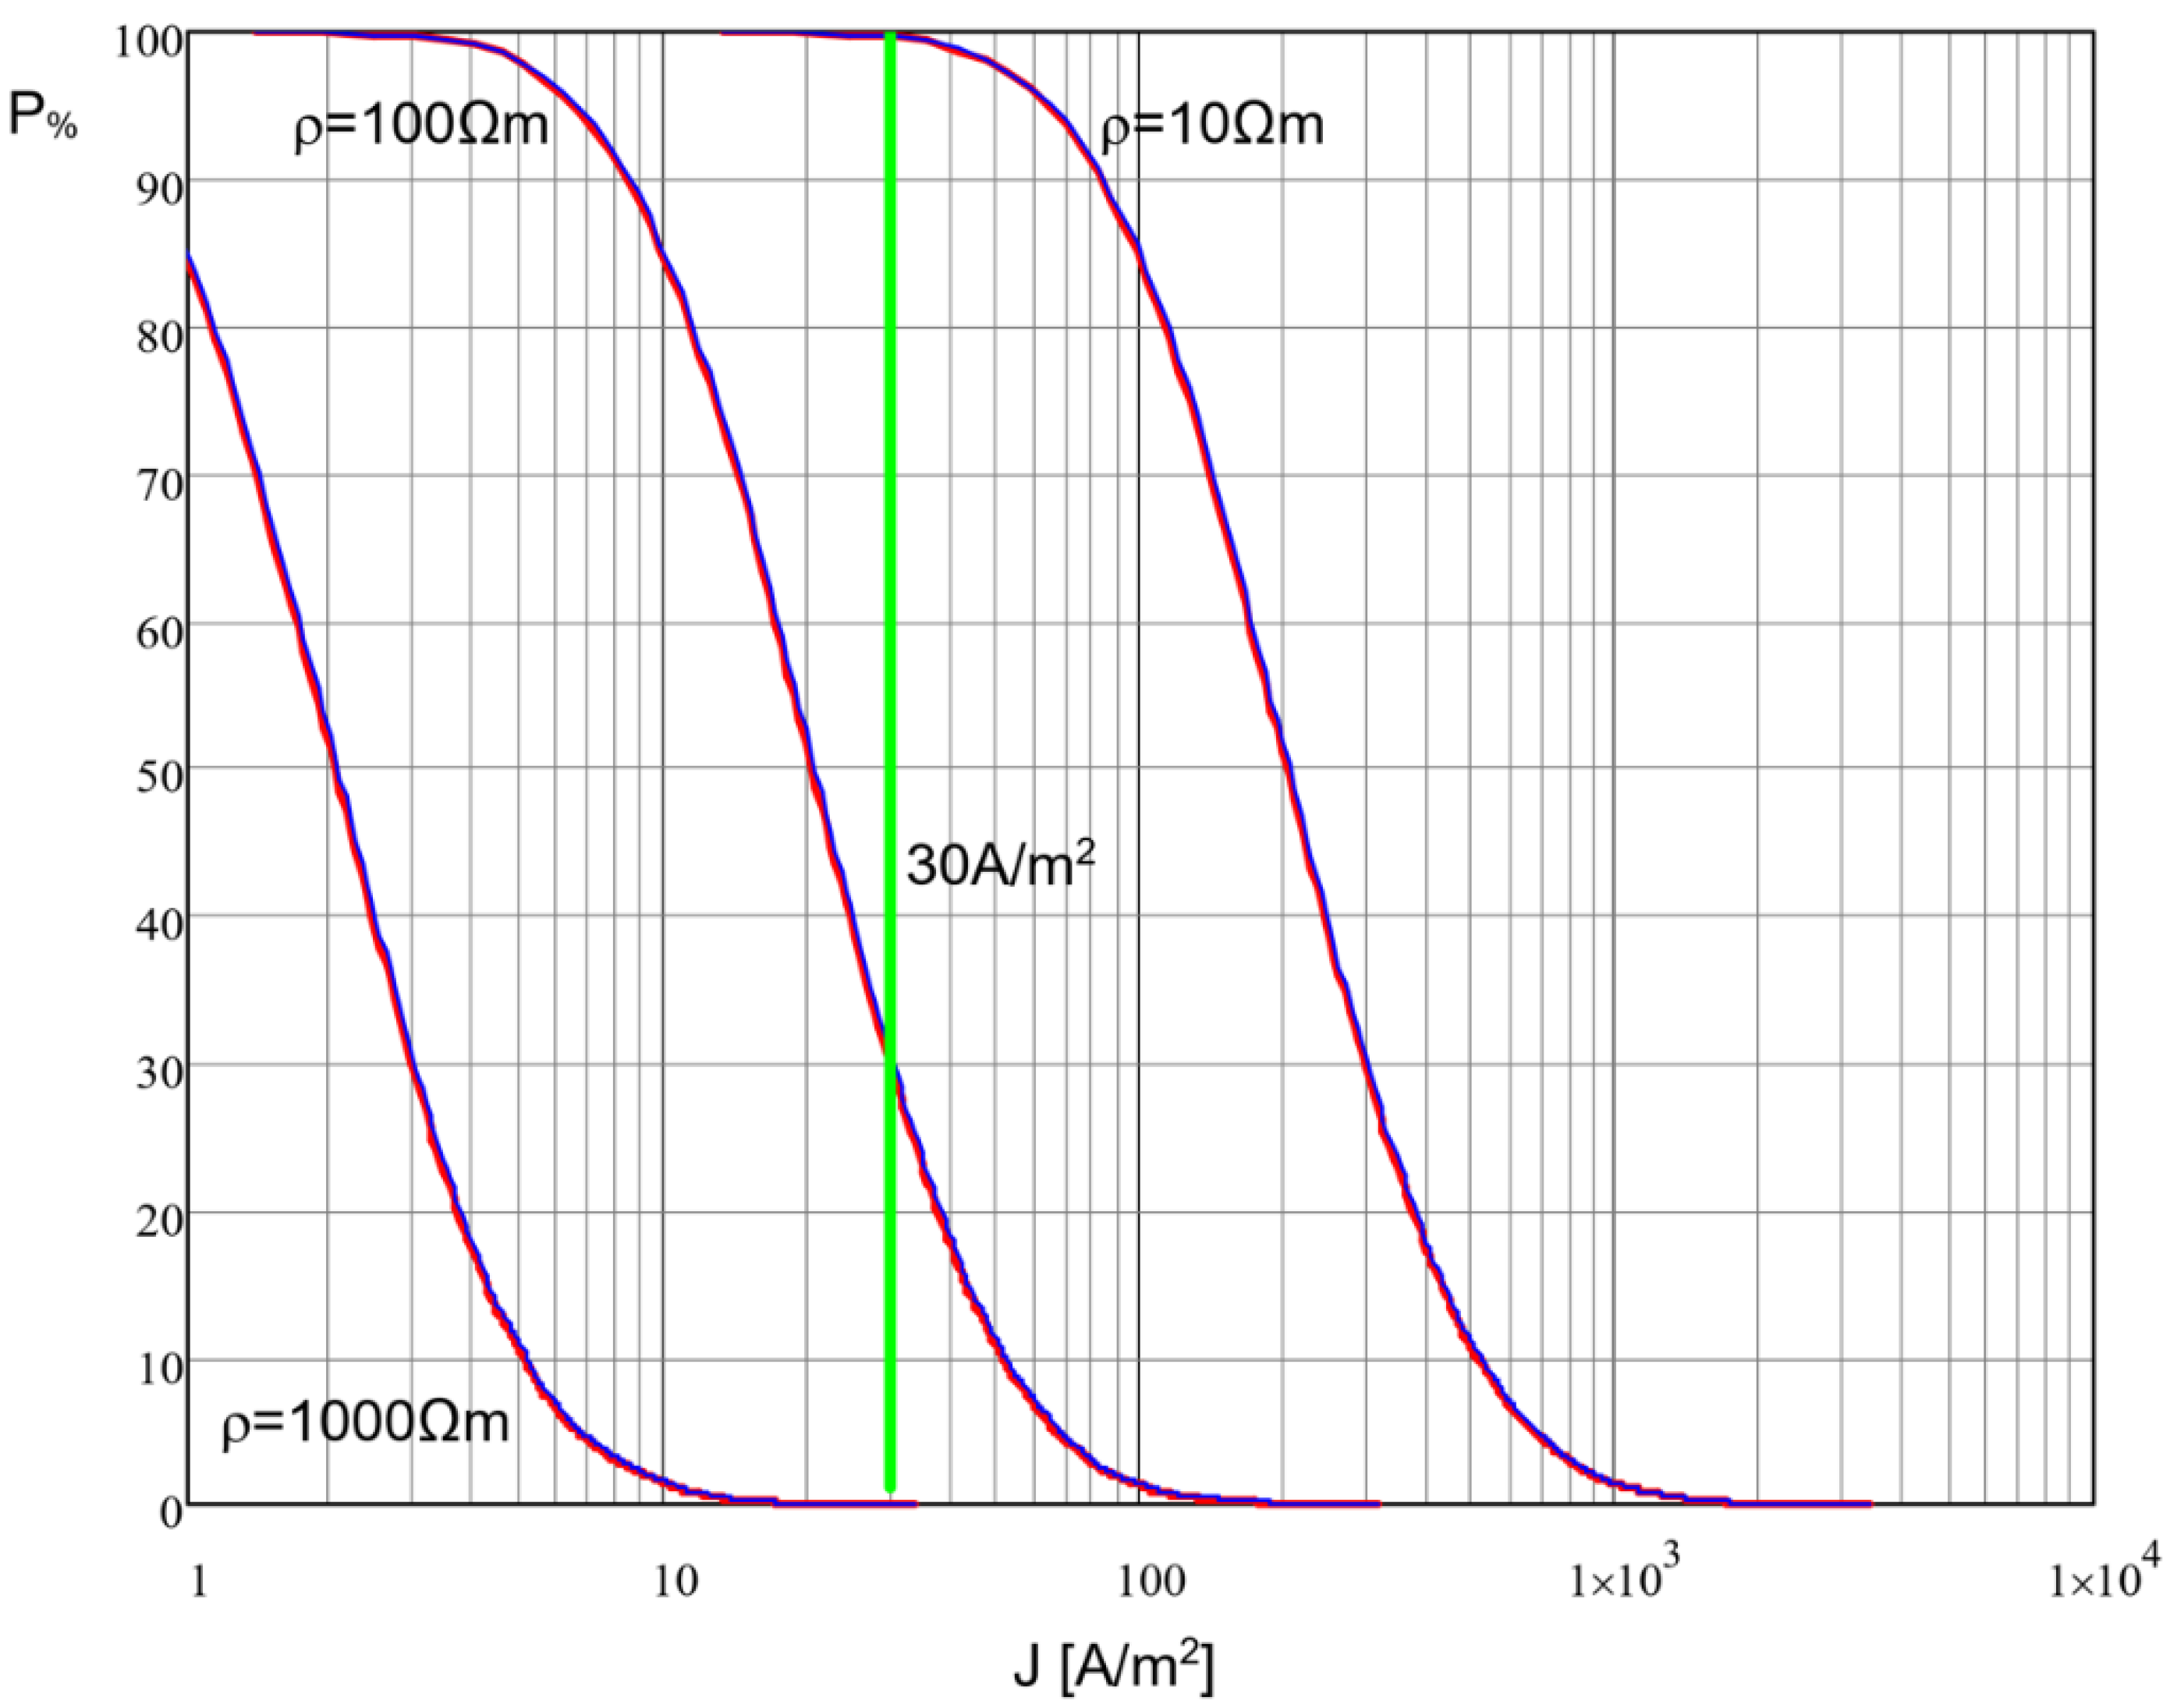
Hence, considering a large number N of trials ( N = 10,000), it is possible to construct two empirical probability distributions: the first one relevant to elliptical shapes and the second to circular shapes. The results are shown in Figure A2, which shows the per cent probability of exceeding the value of 30 A/m2 in correspondence with different values of soil resistivity.
Figure A2. Per cent probability of exceeding the value of 30 A/m2 for different values of soil resistivity and V = 15 V.
Applsci 13 07669 g0a2
As one can notice, the curves relevant to elliptical holidays (in blue) are practically superimposed on the ones relevant to circular holidays (in red) so, confirming that the holiday shape has minimum influence on the results.

References

  1. Taflove, A.; Dabkowski, J. Prediction Method for Buried Pipeline Voltages Due to 60 Hz AC Inductive Coupling Part I-Analysis. IEEE Trans. Power Appar. Syst. 1979, PAS-98, 780–787. [Google Scholar] [CrossRef]
  2. Al-Gabalawy, M.A.; Mostafa, M.A.; Hamza, A.S.; Hussien, S.A. Modeling of the KOH-Polarization Cells for Mitigating the Induced AC Voltage in the Metallic Pipelines. Heliyon 2020, 6, e03417. [Google Scholar] [CrossRef]
  3. Chen, M.; Liu, S.; Zhu, J.; Xie, C.; Tian, H.; Li, J. Effects and Characteristics of AC Interference on Parallel Underground Pipelines Caused by an AC Electrified Railway. Energies 2018, 11, 2255. [Google Scholar] [CrossRef] [Green Version]
  4. Charalambous, C.A.; Demetriou, A.; Lazari, A.L.; Nikolaidis, A.I. Effects of Electromagnetic Interference on Underground Pipelines Caused by the Operation of High Voltage AC Traction Systems: The Impact of Harmonics. IEEE Trans. Power Deliv. 2018, 33, 2664–2672. [Google Scholar] [CrossRef]
  5. Cigré Working Group 36.02. Guide on the Influence of High Voltage AC Power Systems on Metallic Pipelines; CIGRE: Paris, France, 1995; p. 135. [Google Scholar]
  6. Brenna, A.; Beretta, S.; Ormellese, M. AC Corrosion of Carbon Steel under Cathodic Protection Condition: Assessment, Criteria and Mechanism. A Review. Materials 2020, 13, 2158. [Google Scholar] [CrossRef] [PubMed]
  7. Wu, X.; Zhang, H.; Karady, G.G. Transient Analysis of Inductive Induced Voltage between Power Line and Nearby Pipeline. Int. J. Electr. Power Energy Syst. 2017, 84, 47–54. [Google Scholar] [CrossRef]
  8. Muresan, A.; Papadopoulos, T.A.; Czumbil, L.; Chrysochos, A.I.; Farkas, T.; Chioran, D. Numerical Modeling Assessment of Electromagnetic Interference Between Power Lines and Metallic Pipelines: A Case Study. In Proceedings of the 2021 9th International Conference on Modern Power Systems (MPS), Cluj-Napoca, Romania, 16–17 June 2021; pp. 1–6. [Google Scholar]
  9. Moraes, C.M.; de Matos, G.H.S.; Martins-Britto, A.G.; Silva, K.M.; Lopes, F.V. Total AC Interferences Between a Power Line Subject to a Single-Phase Fault and a Nearby Pipeline with Multilayered Soil. IEEE Trans. Electromagn. Compat. 2023, 65, 1–10. [Google Scholar] [CrossRef]
  10. Cigré Working Group C4. 2.02. AC Corrosion on Metallic Pipelines Due to Interference from AC Power Lines—Phenomenon, Modelling and Countermeasures; CIGRE: Paris, France, 2006. [Google Scholar]
  11. Ametani, A.; Paolone, M.; Yamamoto, K.; Haddad, A.M.; He, J.; Ishii, M.; Judendorfer, T.; Jung-Wook, W.; Keri, A.J.F.; Nucci, C.A.; et al. Guideline for Numerical Electromagnetic Analysis Method. CIGRE Tech. Broch. 543 2013, 1, 1–106. [Google Scholar]
  12. Lucca, G. Different Approaches in Calculating AC Inductive Interference from Power Lines on Pipelines. IET Sci. Meas. Technol. 2018, 12, 802–806. [Google Scholar] [CrossRef]
  13. Andolfato, R.; Bernardi, L.; Fellin, L. Aerial and Grounding System Analysis by the Shifting Complex Images Method. IEEE Trans. Power Deliv. 2000, 15, 1001–1009. [Google Scholar] [CrossRef]
  14. Steele, C.W. Numerical Computation of Electric and Magnetic Fields; Springer Science & Business Media: Berlin/Heidelberg, Germany, 2012. [Google Scholar]
  15. Micu, D.; Christoforidis, G.; Czumbil, L. AC Interference on Pipelines Due to Double Circuit Power Lines: A Detailed Study. Electr. Power Syst. Res. 2013, 103, 1–8. [Google Scholar] [CrossRef]
  16. Christoforidis, G.; Labridis, D.; Dokopoulos, P. A Hybrid Method for Calculating the Inductive Interference Caused by Faulted Power Lines to Nearby Buried Pipelines. IEEE Trans. Power Deliv. 2005, 20, 1465–1473. [Google Scholar] [CrossRef]
  17. Christoforidis, G.; Labridis, D.; Dokopoulos, P. Inductive Interference on Pipelines Buried in Multilayer Soil Due to Magnetic Fields from Nearby Faulted Power Lines. IEEE Trans. Electromagn. Compat. 2005, 47, 254–262. [Google Scholar] [CrossRef]
  18. Cristofolini, A.; Popoli, A.; Sandrolini, L. Numerical modelling of interference from AC Power Lines on buried metallic pipelines in presence of mitigation wires. In Proceedings of the 2018 IEEE International Conference on Environment and Electrical Engineering and 2018 IEEE Industrial and Commercial Power Systems Europe (EEEIC/I&CPS Europe), Palermo, Italy, 12–15 June 2018; pp. 1–6. [Google Scholar]
  19. Popoli, A.; Sandrolini, L.; Cristofolini, A. Finite element analysis of mitigation measures for AC interference on buried pipelines. In Proceedings of the 2019 IEEE International Conference on Environment and Electrical Engineering and 2019 IEEE Industrial and Commercial Power Systems Europe (EEEIC/I&CPS Europe), Genova, Italy, 11–14 June 2019; pp. 1–5. [Google Scholar]
  20. Popoli, A.; Sandrolini, L.; Cristofolini, A. A Quasi-3D Approach for the Assessment of Induced AC Interference on Buried Metallic Pipelines. Int. J. Electr. Power Energy Syst. 2019, 106, 538–545. [Google Scholar] [CrossRef]
  21. Popoli, A.; Sandrolini, L.; Cristofolini, A. Inductive Coupling on Metallic Pipelines: Effects of a Nonuniform Soil Resistivity along a Pipeline-Power Line Corridor. Electr. Power Syst. Res. 2020, 189, 106621. [Google Scholar] [CrossRef]
  22. Munteanu, C.; Mates, G.; Purcar, M.; Topa, V.; Pop, I.T.; Grindei, L.; Racasan, A. Electromagnetic Field Model for the Numerical Computation of Voltages Induced on Buried Pipelines by High Voltage Overhead Power Lines. Eur. Phys. J. Appl. Phys. 2012, 58, 30902. [Google Scholar] [CrossRef]
  23. Schoonjans, B.; Deconinck, J. Calculation of HVAC Inductive Coupling Using a Generalized BEM for Helmholtz Equations in Unbounded Regions. Int. J. Electr. Power Energy Syst. 2017, 84, 242–251. [Google Scholar] [CrossRef]
  24. Dawalibi, F.P.; Donoso, F. Integrated Analysis Software for Grounding, EMF, and EMI. IEEE Comput. Appl. Power 1993, 6, 19–24. [Google Scholar] [CrossRef]
  25. Dawalibi, F.P.; Southey, R.D. Analysis of Electrical Interference from Power Lines to Gas Pipelines. I. Computation Methods. IEEE Trans. Power Deliv. 1989, 4, 1840–1846. [Google Scholar] [CrossRef]
  26. Haynes, G.J.; Manning, T.; Baete, C.; Barton, L. Variances in pipeline AC interference computational modeling. In Proceedings of the Corrosion Conference and Expo 2019, 24–28 March 2019; NACE International: Nashville, TN, USA, 2019; Volume 2019. [Google Scholar]
  27. Baete, C.; Haynes, G.; Marmillo, J. Unmasking AC Threats on Petrochemical Pipelines. In CORROSION 2021; OnePetro: Richardson, TX, USA, 2021; p. D121S049R011. [Google Scholar]
  28. Dinzi, R.; Hutauruk, Y.; Siregar, Y.; Mubarakah, N.; Sinulingga, E.P. Optimization design of grounding system substation with multilayer soil model. In Proceedings of the 2022 6th International Conference on Electrical, Telecommunication and Computer Engineering (ELTICOM), Medan, Indonesia, 22–23 November 2022; pp. 85–91. [Google Scholar]
  29. Turri, R.; Andolfato, R.; Cuccarollo, D. A Numerical Simulation Tool for Cathodic Protection and Electromagnetic Interference Analysis. In Proceedings of the NACE Milano Italia Section–Conference & Expo 2016 A European Event for the Corrosion Prevention of Oil&Gas Industry, Genoa, Italy, 29–31 May 2016; Volume 17. [Google Scholar]
  30. Lucca, G. AC Corrosion on Pipelines: Influence of the Surface Layer Soil Resistivity in Evaluating the Current Density by a Probabilistic Approach. Prog. Electromagn. Res. M 2019, 79, 175–186. [Google Scholar] [CrossRef] [Green Version]
  31. Djogo, G.; Salama, M.M.A. Calculation of Inductive Coupling from Power Lines to Multiple Pipelines and Buried Conductors. Electr. Power Syst. Res. 1997, 41, 75–84. [Google Scholar] [CrossRef]
  32. Paul, C.R. Analysis of Multiconductor Transmission Lines; John Wiley & Sons: Hoboken, NJ, USA, 2007. [Google Scholar]
  33. ITU-T. Directives concerning the protection of telecommunication lines against harmful effects from electric power and electrified railway lines. In Capacitive, Inductive and Conductive Coupling: Physical Theory and Calculation Methods; ITU-T: Geneva, Switzerland, 1989; Volume 3. [Google Scholar]
  34. Ruehli, A.; Antonini, G.; Jiang, L. Circuit Oriented Electromagnetic Modeling Using the PEEC Techniques; John Wiley & Sons: Hoboken, NJ, USA, 2017. [Google Scholar]
  35. EN 15280; Evaluation of a.c. Corrosion Likelihood of Buried Pipelines Applicable to Cathodically Protected Pipelines. CEN: Brussels, Belgium, 2013.
  36. Nielsen, L.V.; Petersen, M.B.; Bortels, L.; Parlongue, J. Effect of Coating Defect Size, Coating Defect Geometry, and Cathodic Polarization on Spread Resistance: Consequences in Relation to AC Corrosion Monitoring; CeoCor: Bruges, Belgium, 2010; pp. 1–14. [Google Scholar]
  37. ANSYS. Maxwell Release 2022 R2, 275 Technology Drive; ANSYS: Canonsburg, PA, USA, 2022. [Google Scholar]
  38. Di Biase, L. CEOCOR: AC Corrosion on Cathodically Protected Pipelines—Guidelines for Risk Assessment and Mitigation Measures, Annex N. 2: Corrosion Due to Alternating Current on Metallic Buried Pipelines: Background and Perspectives, CeoCor, 2001.
  39. Lucca, G.; Di Biase, L.; Moro, M. AC Corrosion on Buried Pipelines: A Probabilistic Approach. In Proceedings of the 6th CEOCOR 6th International Congress, Giardini Naxos, Italia, 13–16 May 2003. [Google Scholar]
  40. Boersma, J.; Danick, E. On the Solution of an Integral Equation Arising in Potential Problems for Circular and Elliptic Disks. SIAM J. Appl. Math. 1993, 53, 931–941. [Google Scholar] [CrossRef] [Green Version]
Figure 1. (a) Vertical cross-section of the finite element model for a defect with finite coating thickness d (only the defect is depicted) and angle α between the coating and the coating fault gutter. The upper base of the fault is in contact with the metal, and the lower base is with the soil. (b) 3D dimetric view of the pore model with excitation and boundary conditions.
Applsci 13 07669 g001
Figure 2. Current density in the central vertical cross-section of the pore depicted in Figure 1.
Applsci 13 07669 g002
Figure 3. Current density in a cross-section orthogonal to the axis of the pore depicted in Figure 1. The cross-section is distant 0.8 mm from the top base of the pore.
Applsci 13 07669 g003
Figure 4. Comparison of calculations of pore resistance versus angle between coating and coating fault gutter: FEM, analytical Formula (3) and relative percent error.
Applsci 13 07669 g004
Figure 5. Vertical cross-section of the finite element model for evaluating the spread resistance of a coating fault in the presence of the soil (the holiday is in dark brown and the soil in light brown). The mesh is shown in blue.
Applsci 13 07669 g005
Figure 6. Comparison spread resistance versus angle between coating and coating fault gutter obtained with FEM and analytical Formula (1).
Applsci 13 07669 g006
Figure 7. Flowchart of the calculation procedure.
Applsci 13 07669 g007
Figure 8. Schematic representation of a pore inside a pipeline coating.
Applsci 13 07669 g008
Figure 9. Per cent probability of exceeding 30 A/m2 versus induced potential and for different values of soil resistivity; d = 3 mm.
Applsci 13 07669 g009
Figure 10. Per cent probability of exceeding 30 A/m2 versus induced potential and for different values of soil resistivity and coating thickness; ρ p = ρ / 10 .
Applsci 13 07669 g010
Figure 11. Layouts of inducing and induced plants.
Applsci 13 07669 g011
Figure 12. Induced voltage profile along the pipeline.
Applsci 13 07669 g012
Figure 13. Per cent probability profile along the pipeline.
Applsci 13 07669 g013
Table 1. Summary of calculation methodologies and evaluated quantities.
PaperApplied MethodologyPhysical Quantities EvaluatedType of Calculation
Taflove and Dabkowski, 1979 [1]
Dawalibi and Southey, 1989 [25] Djogo and Salama, 1997 [31]
Equivalent Transmission Line Circuit aInduced voltageDeterministic
Christoforidis et al., 2005 [16,17]2D FEM + Circuit theoryInduced voltage
Induced current
Deterministic
Micu et al., 2013 [15]2D FEM + Circuit theoryInduced voltageDeterministic
Wu et al., 2017 [7]Equivalent Transmission Line Circuit (time domain)Induced voltage
Induced current
Deterministic
Cristofolini et al., 2018 [18]
Popoli et al., 2019 [19]
2D FEM Induced voltage
Induced current
Deterministic
Lucca, 2019 [30]Equivalent Transmission Line CircuitCurrent densityProbabilistic
Popoli et al., 2019 [20]
Popoli et al., 2020 [21]
2D FEM + Circuit theory (Quasi-3D method)Induced voltage
Induced current
Deterministic
Muresan et al., 2021 [8]Equivalent Transmission Line Circuit (EMTP-RV), PEEC b (XGSLab)Induced voltageDeterministic
Moraes et al., 2023 [9]Equivalent Transmission Line Circuit (EMTP)Induced voltage
Induced current
Deterministic
This workEquivalent Transmission Line CircuitCurrent densityProbabilistic
a See [32,33]. b Partial element equivalent circuit method, see [34].
Disclaimer/Publisher’s Note: The statements, opinions and data contained in all publications are solely those of the individual author(s) and contributor(s) and not of MDPI and/or the editor(s). MDPI and/or the editor(s) disclaim responsibility for any injury to people or property resulting from any ideas, methods, instructions or products referred to in the content.