Abstract
Mechanical characterization of soft materials is a complicated inverse problem that includes nonlinear constitutive behavior and large deformations. A further complication is introduced by the structural inhomogeneity of tested specimens (for example, caused by thickness variations). Optical methods are very useful in mechanical characterization of soft matter, as they provide accurate full-field information on displacements, strains and stresses regardless of the magnitude and/or gradients of those quantities. In view of this, the present study describes a novel hybrid framework for mechanical characterization of soft membranes, combining (i) inflation tests and preliminary in-plane equi-biaxial tests, (ii) a one-shot projection moiré optical setup with two symmetric projectors that project cross-gratings onto the inflated membrane, (iii) a mathematical model to extract 3D displacement information from moiré measurements, and (iv) metaheuristic optimization hybridizing harmony search and JAYA algorithms. The use of cross-gratings allows us to determine the surface curvature and precisely reconstruct the shape of the deformed object. Enriching metaheuristic optimization with gradient information and elitist strategies significantly reduces the computational cost of the identification process. The feasibility of the proposed approach wassuccessfully tested on a 100 mm diameter natural rubber membrane that had some degree of anisotropy in mechanical response because of its inhomogeneous thickness distribution. Remarkably, up to 324 hyperelastic constants and thickness parameters can be precisely identified by the proposed framework, reducing computational effort from 15% to 70% with respect to other inverse methods.
1. Introduction
In inverse engineering applications, causal factors that govern the response of a currently analyzed system must be determined. For example, one of the most common inverse problems in mechanics is to identify material properties (e.g., Young’s modulus, viscoelastic or hyperelastic constants, etc.) and/or stiffness properties (e.g., tension/bending/shear terms in shells, fiber orientations and ply thicknesses in composite laminates, etc.) corresponding to the given displacements {u(x,y,z), v(x,y,z), w(x,y,z)}. The most popular approaches adopted in material identification are the finite element model updating method (FEMU) [1,2,3,4,5] and the virtual fields method (VFM) [3,4,5,6]. FEMU has a higher computational cost, while VFM can be easily implemented. Measured displacements are compared at NCNT selected control points with the corresponding displacement values computed by an FE model simulating the experiment. Measured and computed displacements match if actual materials/structural properties are inputted to the FE model: the difference is the error functional Ω, which depends on the NDV properties to be identified. The inverse problem is hence stated as an optimization problem:
In Equation (1), the design vector XPROP(X1, X2, …, XNDV) includes the NDV unknown properties ranging between lower and upper bounds “L” and “U”, respectively; and , respectively, denote computed and target measured displacements for the ith control point; and constraint functions Gp(XPROP) in the unknown properties guarantee the existence of a solution for the inverse problem.
The formulation of error functional Ω depends on the type of identification problem; for example, in indentation/nanoindentation problems, reaction forces at the indenter/body interface also may be considered, while in dynamic problems, natural frequencies and modal shapes can be utilized as target quantities; strains and stresses also may be involved in the definition of Ω. Maier and his collaborators [7,8,9,10,11,12,13,14,15,16,17,18,19,20,21] carried out pioneering work on mechanical identification of materials and structures, considering a variety of cases such as, for example, elasto-plasticity (also accounting for material anisotropy, inhomogeneity and functional grading), indentation, residual stresses, multiaxial fatigue, damage and fracture, thin foil mechanics, etc.
The inverse problem defined by Equation (1) may be highly nonlinear and nonconvex if there are many unknown material/structural parameters to be determined and each new evaluation of error functional Ω requires a new FE analysis. Since the Ω functional may be sensitive only to some of the unknown parameters, sensitivity analyses should be carried out to select experimental data most related to these parameters. Such a strategy makes the inverse problem well posed but increases the computational cost of the identification process (see, for example, [10,15,18,22,23] for detailed discussions on this issue). However, model reduction techniques may be used to speed up computations [24].
The non-smooth optimization problem (1) can be solved using metaheuristic optimization algorithms (MOAs) that randomly generate trial designs according to some principles inspired by physics, evolution, biology, social sciences, human activities, etc. MOAs explore larger portions of design space than gradient-based optimizers (GBOs), thus increasing the probability of finding a global optimum (i.e., the actual properties to be identified). For this reason, MOAs have progressively replaced GBOs, such as sequential unconstrained minimization techniques, with penalty functions (SUMT), sequential quadratic programming (SQP), trust region algorithms (TRA), etc.
However, according to the no-free-lunch theorem, no metaheuristic algorithm inherently outperforms all other metaheuristic optimizers in all optimization problems [25,26]. Another issue in metaheuristic optimization is the computational cost of the search process. Hence, metaheuristic algorithms for material characterization should neither be computationally expensive nor converge to “false” values of material/structural properties. Furthermore, convergence behavior should be independent of the setting of the algorithm’s internal parameters. The blooming of metaheuristic methods favored by their inherent ability of finding global optima (or at least nearly global optimum solutions) as well as by the exponentially increasing computational power has led many researchers to use these algorithms in inverse problems. A comprehensive literature survey on applications of metaheuristic algorithms to mechanical characterization of materials is given in [27]. The interpretation of structural engineering from the perspective of inverse problems and the role played by metaheuristic algorithms and artificial intelligence in such a context are thoroughly reviewed in [28].
It should be noted that the mechanical identification process becomes even more complicated in the case of soft matter, which is usually characterized by nonlinear constitutive behavior and large deformations. Further complications derive from the presence of material anisotropy and structural inhomogeneity. The selected material model (usually stated by one of the many hyperelastic laws available in the literature) should fully “exploit” the features of the chosen experimental protocol for characterization. Furthermore, the inverse FE procedure should focus on material models as well as on the choice of deformation range. Although the latter aspect may sound obvious, it is often not properly taken into account by analysts (see, for example, the discussion reported in [29]).
Optical methods (Oms) [30,31,32,33] are highly suited for mechanical characterization of materials because they provide accurate full-field information on displacements, strains and stresses (i.e., the basic entities that form the error functional Ω defined in inverse mechanics problems) in real time. Oms may utilize visible light as well as X-rays and infrared radiation. Any target measurement scale can be achieved by properly selecting the illumination type and the experimental setup parameters. Nanoscale resolution can be achieved by adopting non-conventional illumination and super-resolution techniques.
In Oms, light wave fronts are modulated by the deformed body’s surface [30,31,32,33]. This results in the formation of a system of fringes (isodisplacement loci) whose spatial frequency relates with the strain field. Displacement information may be extracted from a deterministic signal (e.g., moiré follows the spatial modulation of a regularly spaced grating), a random signal (e.g., speckle exploits the modulation of surface roughness caused by deformation) or image correlation (e.g., a random pattern printed on the specimen’s surface is modulated by the applied load).
The multiscale capability of Oms isvery useful in the characterization process if the measured displacement components are very different in magnitude. For example, the 3D displacement field of a soft membrane may be determined by combining intrinsic moiré and projection moiré, respectively, to measure in-plane and out-of-plane displacements [34]. However, displacement components measured optically should be expressed in the same reference system set in the numerical simulation of the experiments. This becomes necessary in the case of moiré, as measured displacement components are taken in the deformed configuration of the object while displacements computed by finite element models are referred to the undeformed configuration of the specimen. As is clear, the error functional Ω is not correctly defined and the inverse problem is ill-posed if reference systems of measured and computed displacements do not match. It is hence of paramount importance to use an optical setup that can measure the 3D displacement vector by recording just one image of the deformed object. This avoids the need for matching reference systems relative to the different displacement components, an inherently complicated process especially when one has to relate in-plane displacements with out-of-plane displacements.
Another critical issue in mechanical characterization of materials is the quantity of data matched in the optimization problem, which may depend on the number of control points as well as on the number of displacement components involved in the definition of the error functional Ω. It would be good to compare all displacement components {u(x,y,z), v(x,y,z), w(x,y,z)}, but optical setups may be sensitive only to some of them. Using an optical setup able to perform a one-shot measurement of the 3D displacement vector certainly improves the efficiency of the identification process because (i) the number of experimental tests entailed by the characterization is reduced and the whole identification process becomes faster, (ii) the displacement vector is determined with respect to just one scale, and (iii) numerical noise and nonconvexity of the optimization process caused by any difference in scale between displacement components are significantly reduced.
Projection moiré can provide information on the 3D displacement components of a deformed body. In fact, displacement components are the difference of coordinates between corresponding points of an object’s surface measured with respect to a reference plane before and after the object itself deforms. Strains are determined by differentiating displacements, and stresses are determined from a constitutive model. Measuring the deformed shape of an object is equivalent to contouring the surface of the deformed object. The contouring problem is a very complicated topic, and this explains the variety of approaches proposed in the literature. Sciammarella et al. [35,36] pointed out that cross-gratings must be projected onto the specimen to determine the local curvature of the object’s surface and consequently to precisely reconstruct the 3D shape of the object. Orthogonal lines give information on the first and second derivatives of the function defining the analyzed surface, which is treated as a tensor entity similar to a strain tensor.
In summary, the mechanical characterization of soft hyperelastic membranes brings at least four major challenges: (i) dealing with the inherently nonlinear behavior of the material, which may be amplified by structural inhomogeneity; (ii) measuring the whole 3D displacement field with just one optical setup and performing a single experiment; (iii) making sure that the inverse problem is well posed; and (iv) solving the inverse problem (1) with an efficient, robust and computationally cheap optimization algorithm.
The above challenges fully motivate the study documented in this article, which presents a novel hybrid framework for mechanical characterization of soft membranes combining biaxial tests, moiré measurements and metaheuristic optimization. A one-shot projection moiré setup including two projectors that project cross-gratings onto the tested specimen and one camera is utilized. The two projectors are symmetrically disposed with respect to the optical axis of the camera, thus realizing double illumination with projection from infinity. A novel mathematical model is developed to extract 3D displacement information from the moiré measurements—the deformed shape of the membrane is approximated by a set of curved surface segments for which the model determines the average curvature.
A fast, population-based metaheuristic optimization algorithm (HS–JAYA), combining the harmony search (HS) and the JAYA optimization methods, is implemented in order to solve the inverse problem entailed by mechanical characterization. The two methods combined into HS–JAYA have been selected for two reasons: (i) HS is one of the most common metaheuristic algorithms in engineering applications including also the solution of inverse problems; and (ii) JAYA has the most straightforward and inherently efficient formulation ever implemented in metaheuristic optimization. HS–JAYA always attempts to generate trial solutions that may improve the current best record included in the population of candidate solutions. For that purpose, gradient information and elitist strategies are utilized. Furthermore, exploration and exploitation are properly integrated into HS–JAYA and continuously alternated in the metaheuristic search process so as to minimize the computational cost of the inverse problem (1).
Besides the novelty introduced by the proposed projection moiré model and the hybrid HS–JAYA optimization formulation, the present identification framework also accounts for structural inhomogeneity of tested specimens, an aspect not very often considered in the literature on mechanical characterization of hyperelastic materials (see discussions in [37,38] and references cited therein). For this purpose, the inverse problem variants formulated in this study include up to 324 design variables, an unusually large number of unknown parameters in the mechanical characterization of soft matter. In summary, the contribution of this study to the field of mechanical characterization of soft materials is at least three-fold:
- Development of a novel characterization framework for hyperelastic membranes, which may account for structural inhomogeneity and induced anisotropic response to symmetric loading;
- Development of a novel one-shot projection moiré model able to recover the whole 3D displacement field of inflated membranes;
- Development of a fast, efficient and robust enhanced hybrid metaheuristic optimization algorithm for solving large-scale variants of the inverse problem (1).
The feasibility of the proposed approach was successfully tested on a natural rubber membrane, which exhibited some degree of anisotropy in mechanical response because of its inhomogeneous thickness. The inflation test [39] was selected as the experimental loading protocol in the characterization process of the rubber membrane and the corresponding 3D displacement field was measured with the one-shot projection moiré setup. The anisotropic response of the tested material was confirmed by planar equi-biaxial tests [40] carried out on five specimens of different sizes, and the corresponding 2D displacement fields were measured with intrinsic moiré. The inflation test and the planar equi-biaxial test were selected for this study because they are the most commonly used experimental protocols for characterizing soft membranes made of hyperelastic material (e.g., [41,42,43,44,45,46] and the studies cited therein).
The rest of the article is organized as follows. Section 2 describes the proposed one-shot projection moiré model and the experimental setup used in the study; the use of intrinsic moiré for the additional in-plane tests also is documented. Section 3 describes the optimization algorithm used in the identification process. Section 4 presents and discusses the results of the identification process including also the results of preliminary intrinsic moiré experiments. Section 5 summarizes the study and outlines future research.
2. The One-Shot Projection Moiré: Model and Experimental Setup
2.1. Background
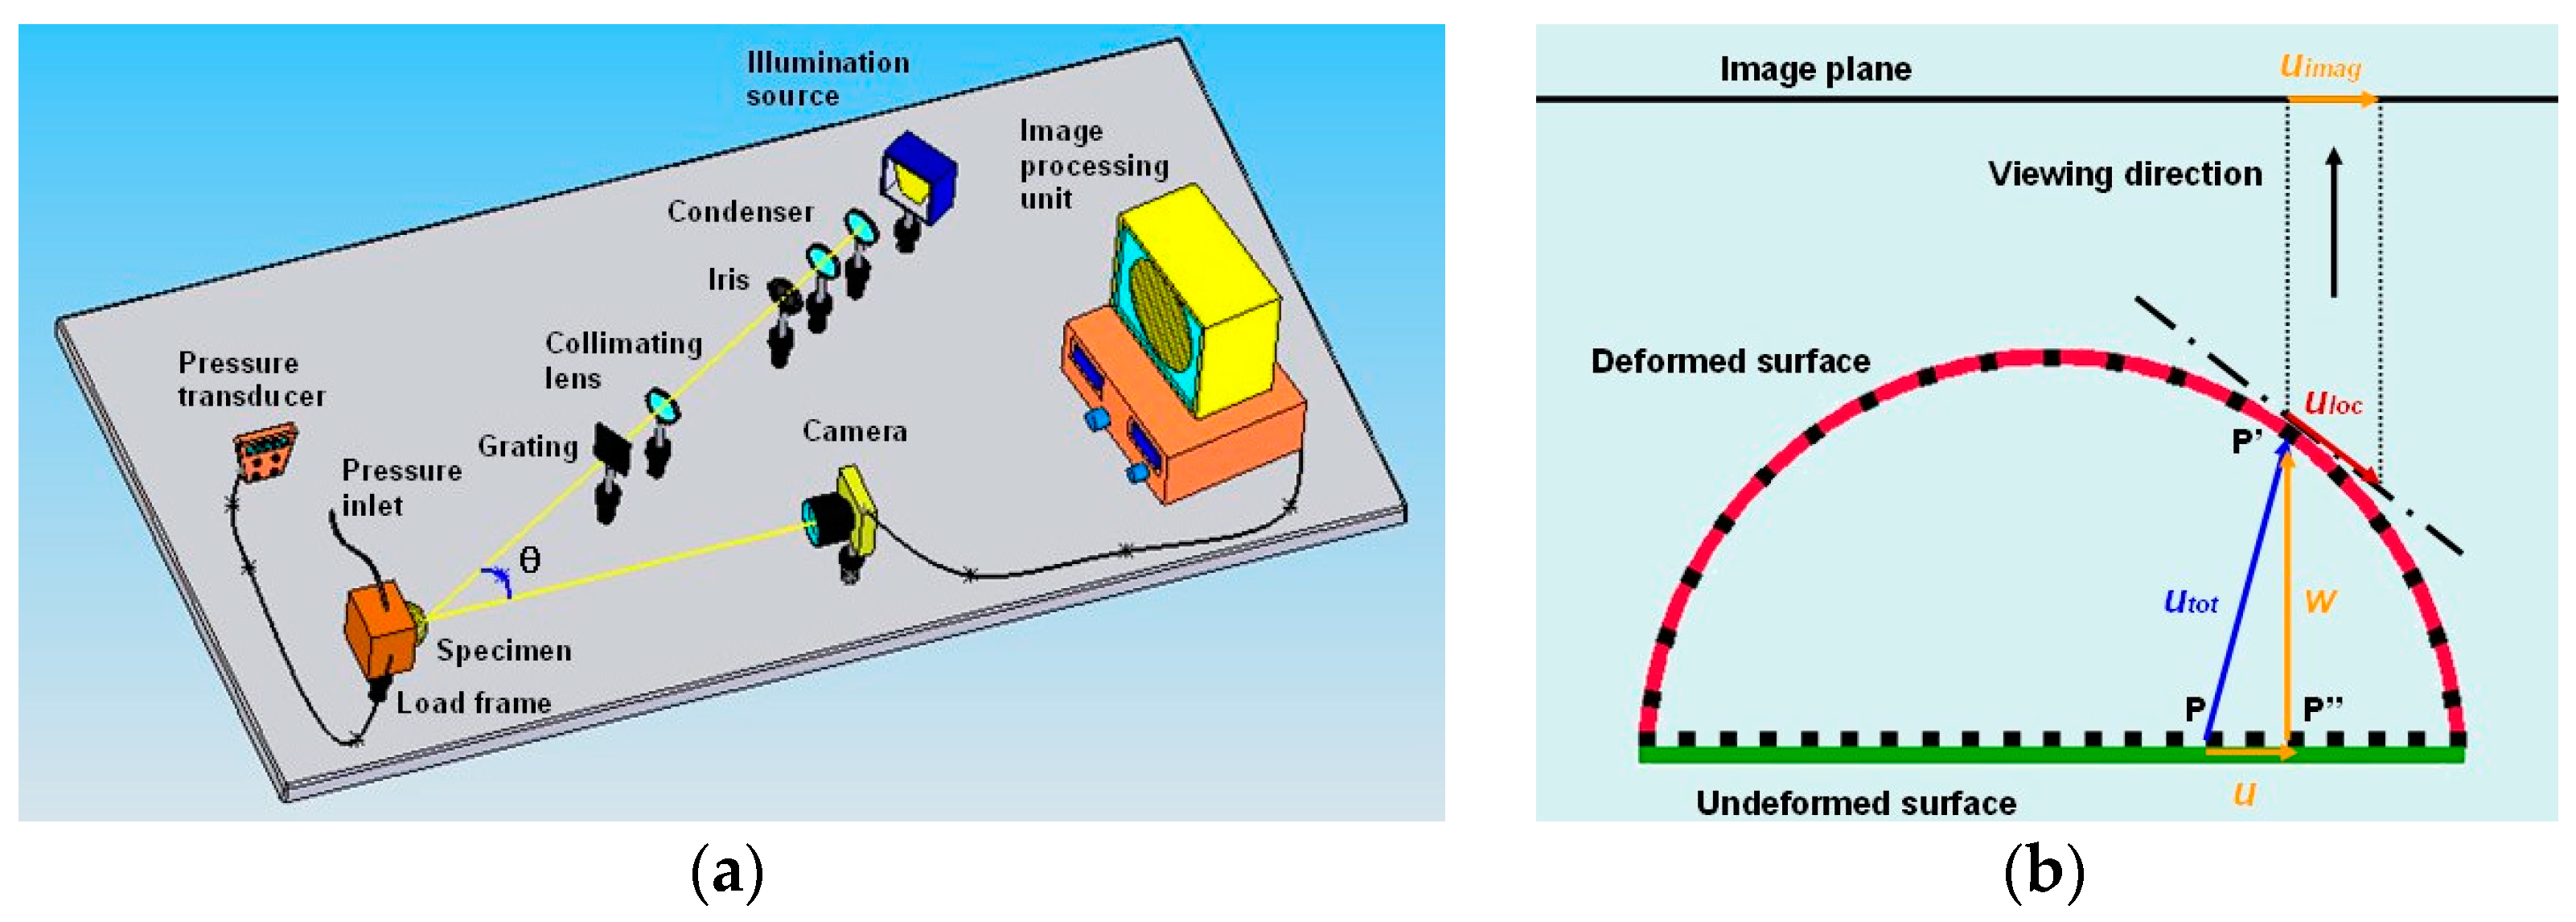
Cosola et al. [34] combined intrinsic moiré (IM) and projection moiré (PM) to simultaneously measure 3D displacements u,v,w(x,y,z) of inflated membranes. Their IMPM experimental setup is shown in Figure 1a.
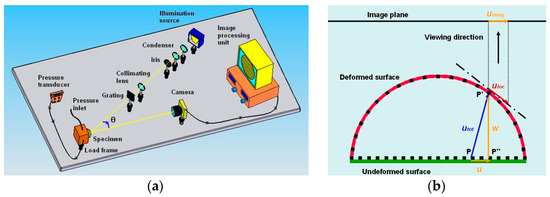
Figure 1.
(a) IMPM optical setup of [34] combining intrinsic and projection moiré; (b) displacement determination from moiré pattern. (taken from [34]).
The dot grating printed on the inflated membrane sensed in-plane deformation while the grating projected onto the membrane sensed out-of-plane deformation of the specimen. In-plane displacements were transformed in order to match reference systems of the two moiré measurements. For example, Figure 1b refers to the XZ plane and the corresponding in-plane (u) and out-of-plane (w) displacements. The point P of the object’s surface displaces to the deformed position P′. For a moiré fringe passing through P′, the corresponding order is numbered with respect to the deformed configuration. The deformed surface is approximated by its tangent plane Π in the neighborhood of P′. The difference between the displacement uloc measured with IM and the real displacement u experienced by the membrane increases with the out-of-plane deformation. Since the w distance of P′ from the reference plane is the actual out-of-plane deformation of P, the w-quantity evaluated at P′ must be combined with the u-displacement of P to correctly determine the total deformation utot of P. However, moiré fringes actually are projections of spatial functions u, v and w onto the image plane (i.e., the uimag segment of Figure 1b). Hence, in [34], projected in-plane displacements measured by IM had to be “shifted” by an amount related to the surface slope caused by inflation. The displacement corresponding to point P′ was transformed into that of point P by simply considering projection uloc·(cosγ), where γ is the slope of the deformed surface.
2.2. The Proposed Moiré Model for Inflated Membranes
The IMPM setup recalled in Section 2.1 brings three important questions: (i) How many systems of lines should be projected onto a surface in order to determine the whole 3D deformation of that surface? (ii) Should those systems of lines have different directions? (iii) Can in-plane displacements of a deformed object be measured without physically applying a grating onto the object surface? To answer these questions, the present study proposed a one-shot projection moiré optical setup for reconstructing the 3D deformed configuration of the loaded object. A simple analytical model that evaluates the deformed object shape starting from the curvature information was developed and integrated with the projection moiré data.
The topography of an object’s surface is fully defined if the coordinates of points sampling the surface are known. The displacement vector of a given point P(x,y,z) of the object’s surface that moves to the position P′(x′,y′,z′) in the deformed configuration is defined by the differences of coordinates {(x′−x);(y′−y);(z′−z)} between P′ and P. Projection moiré can give information on the Z-coordinates of surface points as well as on slopes and curvatures of the surface, provided that cross-gratings are projected onto the specimen [31,35,36]. The modulation of vertical lines projected onto the specimen gives information on the X–Z surface profiles defined by coordinates x and z, while the modulation of projected horizontal lines provides information on the Y–Z surface profiles defined by coordinates y and z. The X–Z and Y–Z profiles obviously share the same z at their intersections. By combining such information, it is possible to determine the position of each surface point with respect to the reference system selected in the measurements.
Each surface is a tensor entity with two curvatures that refer to orthogonal directions, as well as a torsional curvature. This model resembles the deformation of a solid body: the surface strain tensor includes stretching/compression/shear components (see [31,35,36] for detailed explanations of the connections between moiré and differential geometry). The surface can be reconstructed with respect to a properly selected reference system if principal curvatures are known, similar to recovering a strain field from principal strains.
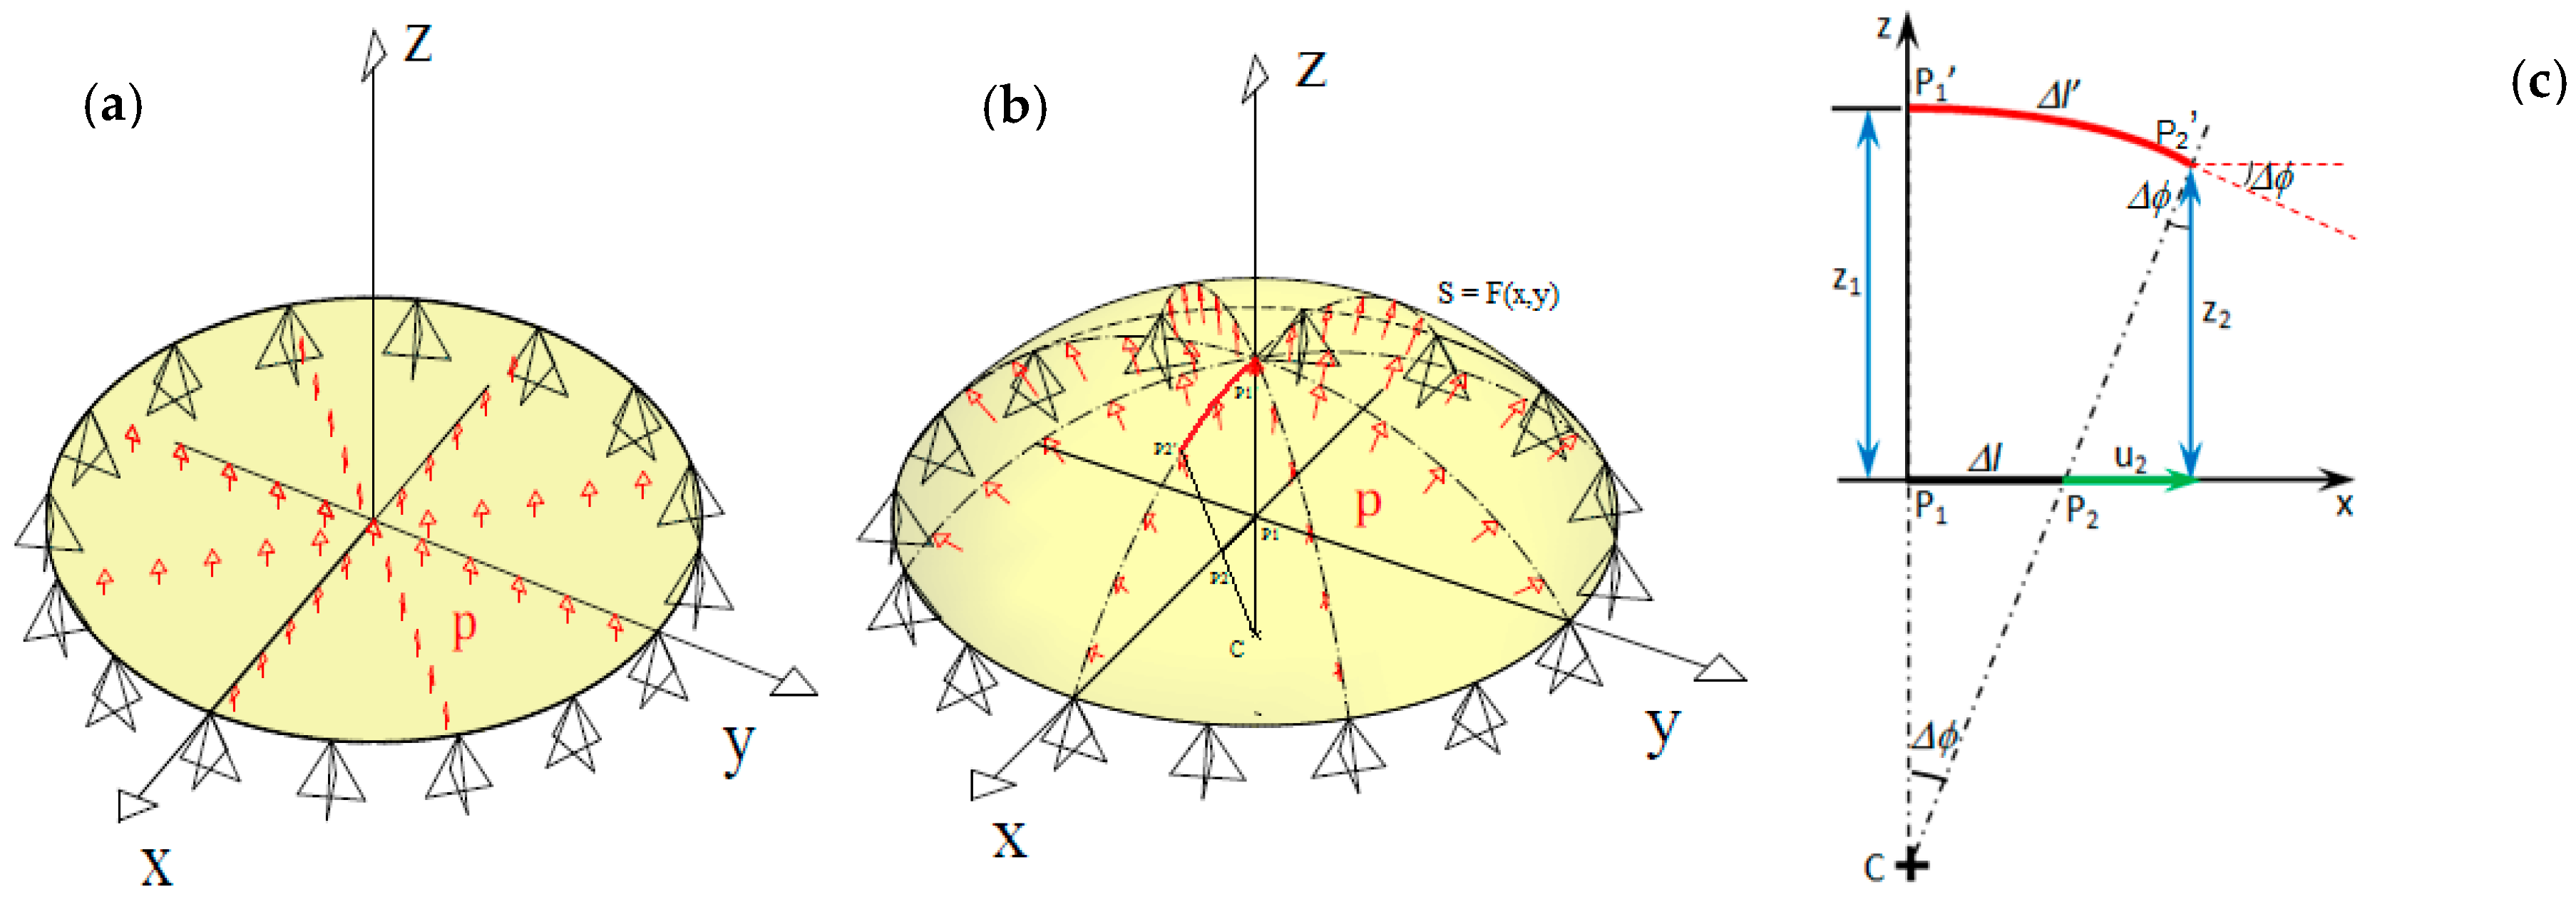
In order to prove the above statements, the schematic of Figure 2 can be considered. A circular membrane is inflated by pressure, thus passing from the undeformed configuration (Figure 2a) to the deformed configuration (Figure 2b). The simplest case regards an axi-symmetrically deformed specimen (i.e., there are only two displacement components u = v and w, respectively, in the X/Y- and Z-directions; see Figure 2b) and the reference configuration is a flat surface (see Figure 2a). Figure 2c presents a X–Z diametrical section of the deformed membrane. The undeformed state corresponds to the straight segment while the deformed configuration corresponds to the arc . Furthermore, if point P1 lies on the symmetry axis of the investigated object, it does not displace in the X/Ydirection.
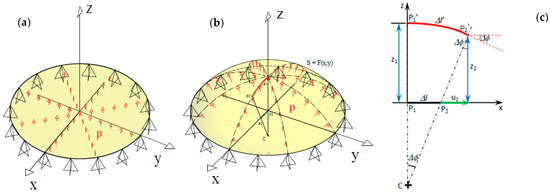
Figure 2.
Determination of the 3D displacement field for an axiallysymmetric deformed membrane subjected to inflation: (a) undeformed configuration; (b) deformed configuration; and (c) deformed profile in the diametrical section X–Z of the inflated membrane.
Under the action of applied loads, point P1 in the reference (undeformed) state displaces to the deformed position of point P1′, while point P2 displaces to point P2′. The length of the deformed arc is:
where Rc is the local curvature radius of the deformed membrane; the angle Δϕ is limited by the arc , portraying the local surface’s deformation. If the deformed arc belongs to a circumference, the curvature radius is constant. Otherwise, the average of the curvature radii evaluated at points P1′ and P2′ has to be determined. For example, for the X–Z deformed profile of Figure 2c, the values of curvature radii at P1′ and P2′ are obtained by evaluating the 1/(∂2w/∂x2) function at xP1′ and xP2′. The same argument can be made for the Y–Z deformed profile, considering the 1/(∂2w/∂y2) function and coordinates yP1′ and yP2′. The w-displacements are determined with projection moiré.
The length Δℓ′ of the deformed configuration can be determined because X positions of points P1′ and P2′ are known from the image (for example, by multiplying the pixel difference between the currently analyzed position and the origin of the reference system by the pixel size), and the w-displacements z1 and z2 are known from projection moiré measurements. By differentiating moiré patterns with respect to X, the radius of curvature Rc of the deformed surface also can be determined. By combining Equations (2) and (3), it is possible to compute Δℓ and Δϕ. Finally, the u-displacement of point P2 (i.e., u2) is the difference between the X-coordinate of point P2′ and the length Δℓ. The same arguments can be made for the Y–Z profiles.
It can be seen from Figure 3 that it holds:
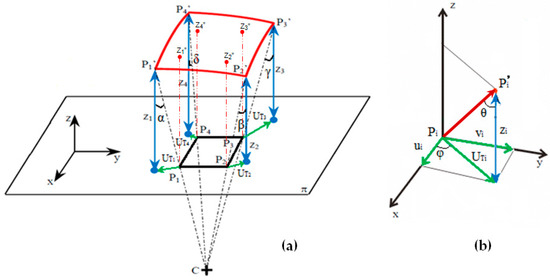
Figure 3.
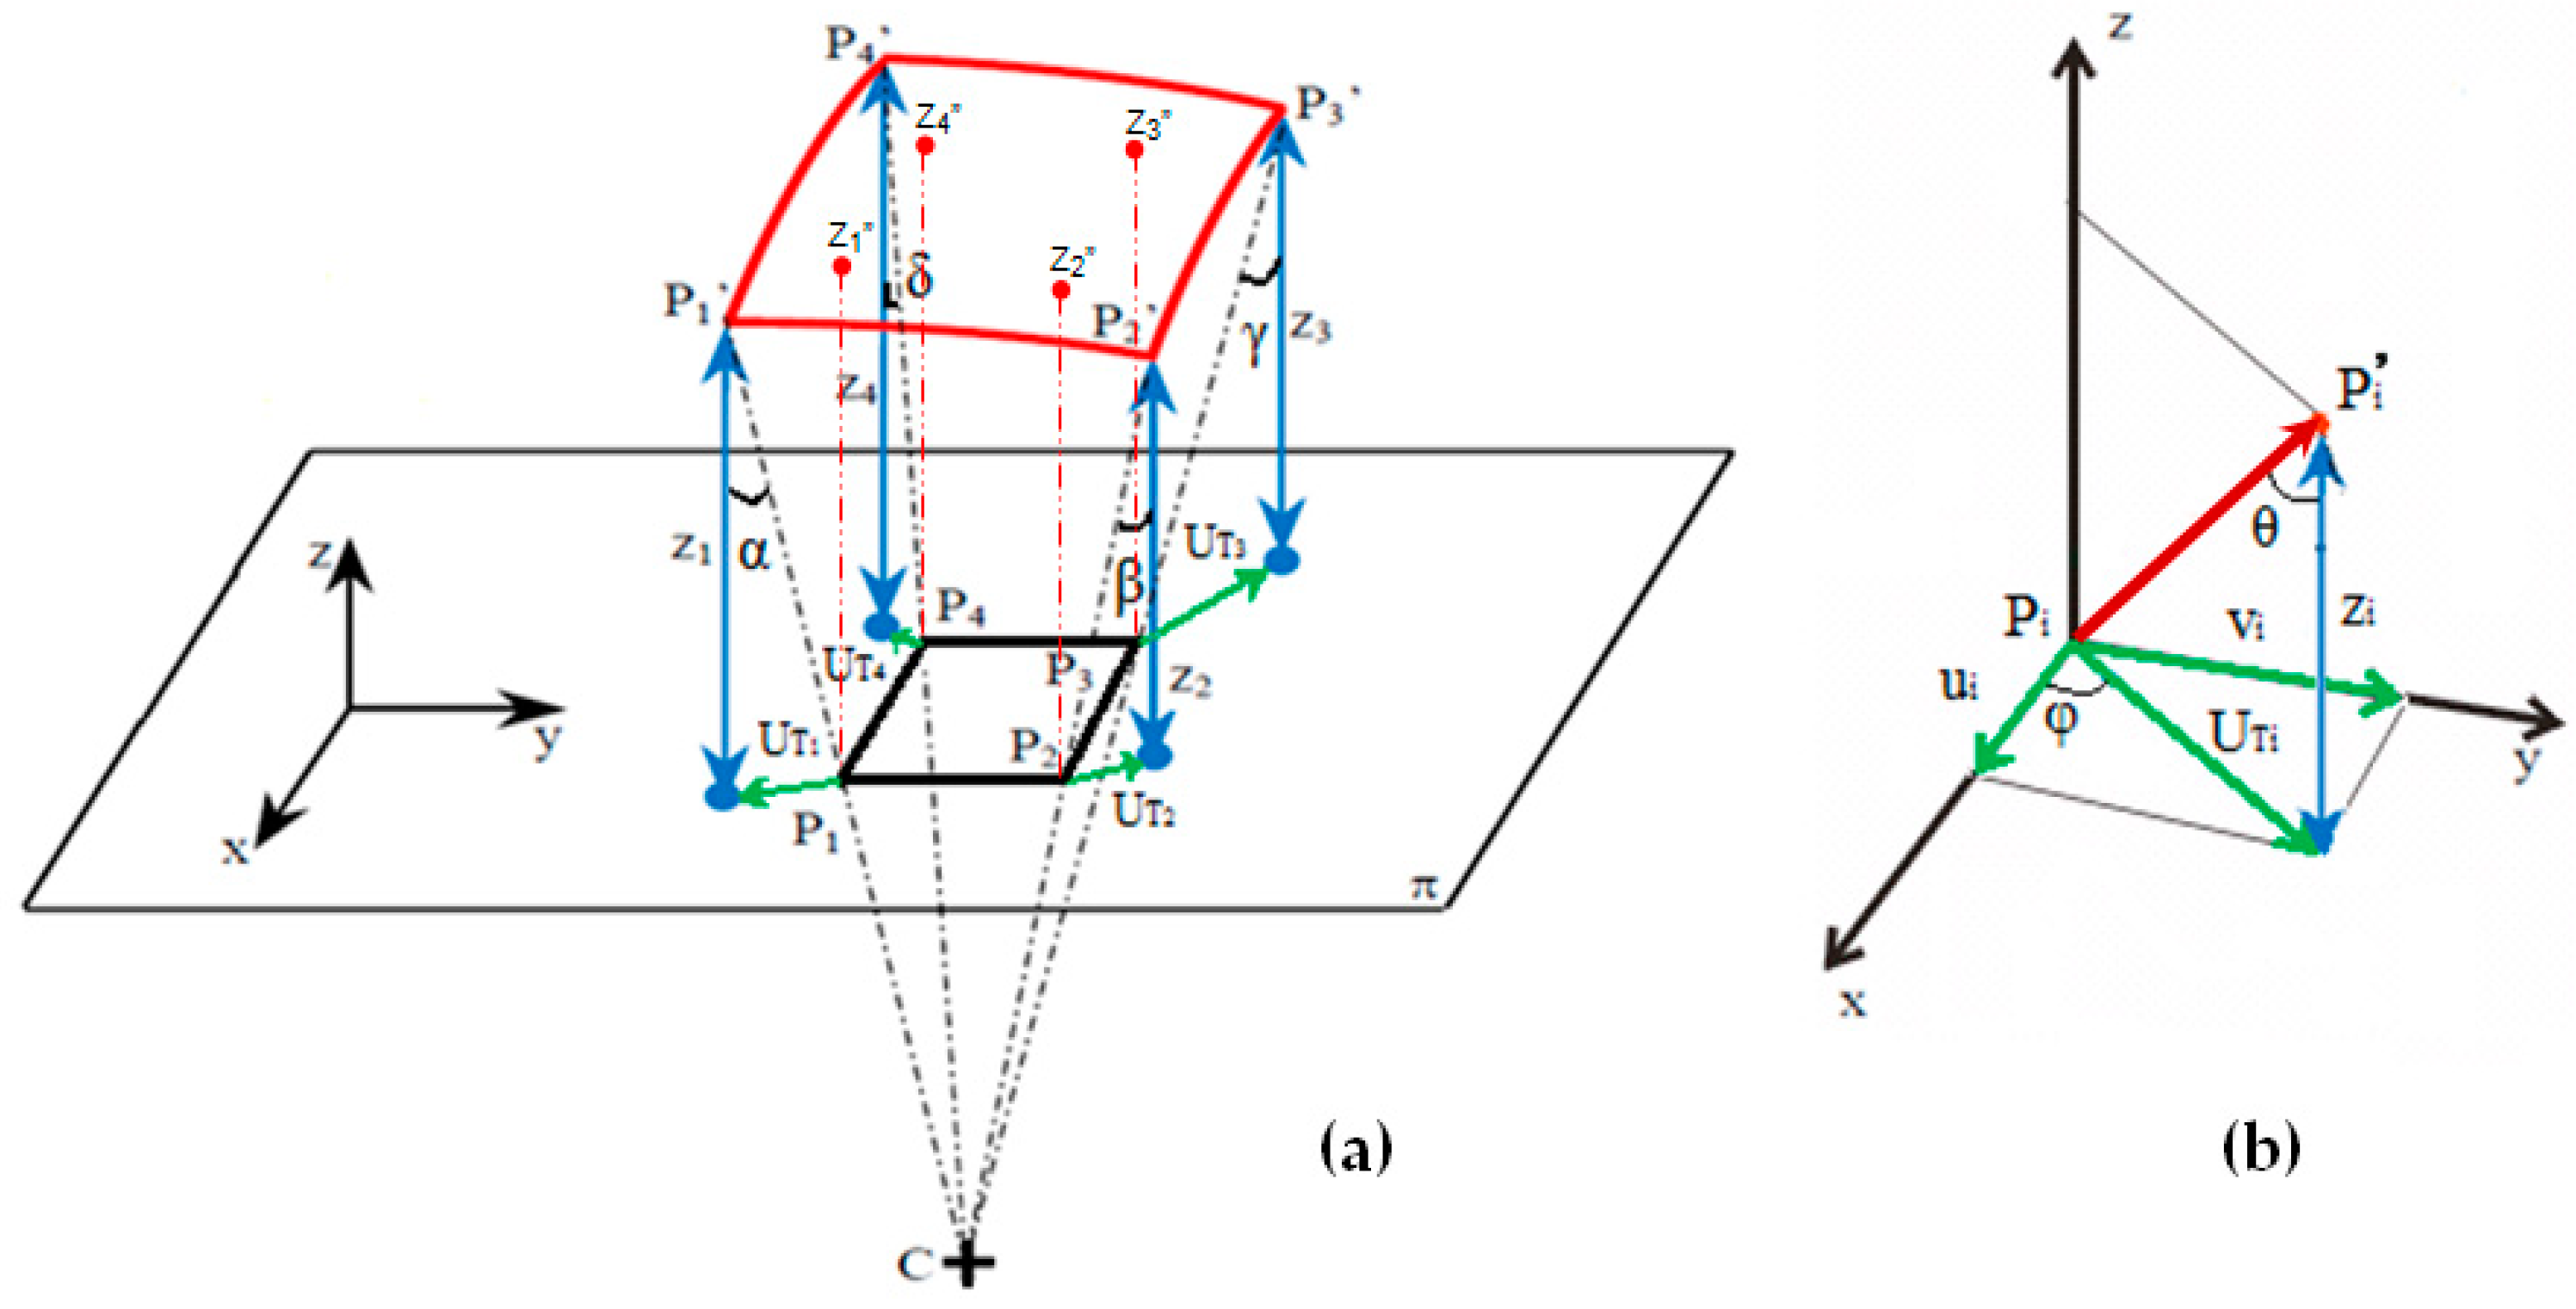
Determination of 3D displacement field for a generically deformed membrane subjected to inflation: (a) deformed configuration vs. undeformed configuration; and (b) components of displacement vector for a generic point of the membrane with indication of azimuthal and parallax angles.
Figure 3 also shows that the Δϕ angle corresponds to the slope of the deformed arc at point P2′ because the local curvature radius is normal to . Hence, from geometrical considerations, Equation (4) can be rewritten as:
In summary, the u-displacement of point P2 can be directly determined from the moiré fringe pattern relative to w-displacements and the corresponding derivative ∂w/∂x if the deformed configuration coordinate x2′ is known. A similar relationship can be found for the Y–Z profiles. This property may be very useful for estimating in-plane displacements from the available w-displacement moiré pattern.
It should be noted that Equation (3) loses its validity if the undeformed specimen is curved. In fact, the curvature radius of element changes from Rco (initial configuration) to Rc (deformed configuration ). The length variation from Δℓ to Δℓ′ has to be determined with shells theory [47,48]. Curvature information is still extracted from moiré data [35,36].
The simple derivation described above may be generalized to the 3D case (Figure 3). An elementary segment of the deformed surface is defined in the XYZ global coordinate system by the “displaced” points P1′(x1′,y1′,z1′), P2′(x2′,y2′,z2′), P3′(x3′,y3′,z3′) and P4′(x4′,y4′,z4′). The corresponding undeformed positions are defined by points P1(x1,y1,z1), P2(x2,y2,z2), P3(x3,y3,z3) and P4(x4,y4,z4). Let us assume that the tested membrane has a planar undeformed configuration, that is zi = 0, consistent with the inflation test protocol: the undeformed membrane lies in the reference plane π of moiré measurements.
Figure 3a shows how the P1P2P3P4 surface portion deforms into the corresponding P1′P2′P3′P4′ surface portion. Let Rc be the average curvature radius of the deformed surface segment, defined as the average distance of points P1′, P2′, P3′ and P4′ from the center of curvature C(xc,yc,zc) of the segment itself. If the P1′P2′P3′P4′ surface is locally approximated by a spherical segment (as it may occur for an inflated membrane), it holds:
Equation (6) corresponds to four relationships containing in total 16 unknown parameters: 12 coordinates of “displaced” points P1′, P2′, P3′ and P4′ (i.e., x1′, y1′, z1′, x2′, y2′, z2′, x3′, y3′, z3′, x4′, y4′, z4′), 3 coordinates of curvature center C (i.e., xc,yc,zc) and the curvature radius Rc of the deformed surface segment.
Figure 3b refers to a generic vertex Pi (i = 1, 2, 3, 4) of the surface element under analysis, which displaces to the deformed position Pi′ (i = 1, 2, 3, 4): the 3D displacement vector (Pi′ − Pi) comprises the total in-plane displacement UTi and the distance zi of Pi′ from the reference plane π. The following relationships hold true for each vertex of the selected portion of the membrane:
where φ and θ, respectively, are the azimuthal angle and the parallax angle for the generic point Pi‘ of the deformed surface. The θ angle of Figure 3b hence corresponds in turn to one of the parallax angles α, β, γ and δ indicated in Figure 3a.
The in-plane displacements ui and vi (respectively, in the X and Y directions) and the total in-plane displacement UTi of each vertex may be determined as:
Substituting the first two relationships of Equation (8) into the third relationship of the same equation, and recalling the last relationship of Equation (7), it can be written:
where α, β, γ and δ are the parallax angles defined in projection moiré [31,35,36].
As mentioned before, Equation (6) contains 16 unknown parameters: 12 coordinates of “displaced” points P1′, P2′, P3′ and P4′, 3 coordinates of curvature center C and the curvature radius of the deformed surface segment. Coordinates x1′, y1′, x2′, y2′, x3′, y3′, x4′, and y4′ of deformed points can be obtained from Equation (8) once moiré fringes are processed and displacements u and v are determined; hence, the total number of unknowns reduces to 8, i.e., z1′, z2′, z3′, z4′, xc, yc, zc and Rc. Alternatively, one can use an approximated 2D version of Equation (5) to estimate in-plane displacements ui and vi (i = 1, 2, 3, 4), respectively, as (zi″∂w/∂x) and (zi″∂w/∂y), where zi″ are the deformed surface heights (i.e., the red etched lines in Figure 3a limited by P1 and Z1″, P2 and Z2″, P3 and Z3″, P4 and Z4″) obtained from the moiré pattern for “undeformed” points P1, P2, P3 and P4.
However, the determination of surface heights z1′, z2′, z3′, z4′ is not straightforward even if u- and v-displacements are known/estimated. In fact, since any location (xi,yi) of the undeformed configuration displaces to the corresponding location (xi′,yi′), each height zi′ (i.e., the w-displacement of the Pi point that becomes the Pi‘ point of the deformed surface) has to be referred to the corresponding deformed coordinates (xi′, yi′), not to the original coordinates (xi,yi). Equation (9) relates the total in-plane displacements with the out-of-plane displacements of the membrane segment vertices P1′, P2′, P3′ and P4′ but introduces four additional unknowns, the parallax angles α (between and z1′), β (between and z2′), γ (between and z3′) and δ (between and z4′). In this way, the number of unknowns rises to 12 (i.e., z1′, z2′, z3′, z4′; α, β, γ and δ; and xc, yc, zc and Rc) but Equations (8) and (9) provide only eight relationships. However, the curvature radii , , and also pass through points P1, P2, P3 and P4 of the undeformed surface. This leads us to write four other relationships (it obviously holds that z1 = z2 = z3 = z4 = 0):
By combining Equations (6), (9) and (10), it is hence possible to determine the remaining 12 unknowns z1′, z2′, z3′, z4′; α, β, γ, δ; and xc, yc, zc, Rc and fully define the deformed surface. Overall, this method deals with 20 unknowns (i.e., x1′, y1′, z1′, x2′, y2′, z2′, x3′, y3′, z3′, x4′, y4′, z4′; α, β, γ, δ; and xc, yc, zc, Rc) and utilizes Equation (6) (four relationships), Equation (8) (eight relationships, that is, two relationships for each point Pi), Equation (9) (four relationships) and Equation (10) (four relationships). This process is repeated for all surface segments. In order to speed up computations, the surface can be sampled in elements whose size is equal to an integer multiple Nps of the pixel size; computation time is reduced by the factor 1/Nps2.
Coordinates x1′, y1′, x2′, y2′, x3′, y3′, x4′, y4′ of some deformed points may be initially estimated. For example, points belonging to any diameter of the inflated membrane should not displace in the transverse direction to the selected diameter. Boundary conditions taking into account the fixture applied to the membrane boundary also may be considered. For example, the displacements of the circular ring corresponding to the constrained boundary of the membrane can be set equal to 0: the conditions x′ = x, y′ = y and z′ = z hold true for the points of surface elements that include some constrained edges.
An alternative strategy for estimating coordinates may regard points close to the pole of the inflated membrane: the distance Δξi = (ξi − ξo) between a generic point Pi of the currently selected diameter and the membrane pole Po (i.e., the center point of inflated membrane, which should displace only in thez-direction but not in the x/ydirections) is multiplied by the nominal strain εp generated by the applied pressure. Nominal strain may even be corrected to εpcorr to account for the local variations of membrane thickness, for example, by using in first approximation the εpcorr/εp = to/tloc relationship taken from linear elasticity where tloc and to, respectively, are the local and nominal thickness values. The displaced position ξi′ of point Pi′ is determined from the Δξi′ = (1 + εp)ξi equation, where the distance Δξi′ = (ξi′ − ξo) is referred to the deformed configuration. The local ξ′-coordinates are finally transformed into x′- and y′-coordinates of deformed points based on the orientation of the selected diameter, and the corresponding in-plane displacements are determined from Equation (6). Interestingly, [49] analyzed the strain distributions in the radial (longitude) and circumferential (latitude) directions that develop in an inflated natural rubber membrane of diameter 120 mm and thickness 0.9 mm, very similar to the test case documented in the present article. Surface elements located within a circular area with a radius up to 20% of the membrane’s radius can be considered in an equi-biaxial state. Furthermore, radial strain remains nearly constant over the whole membrane. This information may bevery useful in the above-mentioned alternative strategy for determining the x1′, y1′, x2′, y2′, x3′, y3′, x4′, y4′ coordinates of the displaced points.
Although the process described above may appear complicated, it should be noted that points of adjacent surface segments obviously share the same coordinates and the same displacements. This reduces significantly the number of unknowns and speeds up the contouring process. However, continuity conditions on curvature radii and surface slopes at the interface points between adjacent elements also have to be considered. Information on local slopes and curvatures at each point of the deformed surface can be obtained by differentiating the moiré patterns relative to the two systems of orthogonal lines projected onto the surface. Slopes of X–Z profiles are proportional to first-order spatial derivatives ∂w/∂x of moiré patterns, while slopes of Y–Z profiles are proportional to first-order spatial derivatives ∂w/∂y. Curvature terms are proportional to second-order spatial derivatives ∂2w/∂x2, ∂2w/∂y2 and ∂2w/∂x∂y of moiré patterns. Values of coordinates x and y at which first- and second-order derivatives are evaluated obviously are those relative to the deformed configuration. Displacement derivatives are given in input to vector and tensor expressions of local slopes/curvatures of the deformed surface to satisfy continuity conditions. The use of cross-gratings allows surface slopes and curvatures to be computed regardless of the fact that surface elements are arbitrarily located in the space and no simplifying assumption is made on displacement distributions. Since the system of orthogonal lines gives information on the first- and second-order derivatives of the function defining the deformed surface, slope information is embedded in curvature information.
In this study, moiré patterns were differentiated as indicated in [31,35,36], which illustrate relationships between differential geometry of surfaces and projection moiré measurements. The iterative process described below was implemented here to properly account for variations of local slopes/curvatures over the deformed surface:
- (1)
- The inverse of curvature radius Rc(k) determined with Equations (6) and (8)–(10) for the kth element of the deformed surface is computed. The 1/Rc(k) term represents the average curvature of the kth surface element.
- (2)
- Local curvatures of deformed surface (κi)(k) are computed at each point (Pi′)(k) of the kth element by differentiating moiré fringes. Since fringes do not necessarily pass through (Pi′)(k) points, the phase map relative to w-displacements must be differentiated with respect to x and y coordinates.
- (3)
- The average of (κi)(k) curvatures—indicated as <κ>(k) in the rest of article—is computed.
- (4)
- The <κ>(k) curvature is compared to 1/Rc(k), and the % curvature difference κ is defined as Δκ = 100·||<κ>(k)–1/Rc(k)||/Min{<κ>(k);1/Rc(k)}. The minimum curvature in the denominator of the Δκ expression makes it harder to verify the validity of the assumption that the deformed membrane segment is spherical.
- (5)
- If Δκ ≤ 0.01%, then the solution provided by Equations (6) and (8)–(10) is retained. A new surface element is considered and steps 1–4 are repeated.
- (6)
- If Δκ > 0.01%, then in Equations (6) and (10), Rc(k) is replaced by the (Rc(k) + 1/<κ>(k))/2 average. Equations (6) and (8)–(10) are solved again and steps 1–5 are reiterated for the kth surface element.
The above-described correction process was found to satisfy the Δκ ≤ 0.01% convergence condition for the whole surface within 3–5 iterations. Hence, the model for reconstructing the 3D deformed shape of the inflated membrane developed in this study is fully consistent with projection moiré data. This confirmed that curvature information is the basic start point to be considered in the 3D contouring of objects.
2.3. One-Shot Projection Moiré Measurements and IMPM Variant
According to [31,35,36], the 3D shape of a surface (and hence the 3D deformed configuration of a loaded body) can be fully reconstructed using a projection moiré setup with four projectors and one camera whose optical axis coincides with the axis of symmetry of each pair of projectors in the corresponding epipolar planes. Two projectors limit the horizontal direction (i.e., the X-axis of the global reference system) and project vertical lines while the other two projectors limit the vertical direction (i.e., the Y-axis of the global reference system) and project horizontal lines. Each system of lines forms vertical or horizontal fringes that are modulated by the deformed surface, thus providing the X–Z and Y–Z surface profiles, respectively. However, only two projectors are needed if cross-gratings are projected onto the surface to be contoured. In view of this, a two-projectors, one-camera arrangement where cross-gratings are projected onto the specimen was adopted in this study.
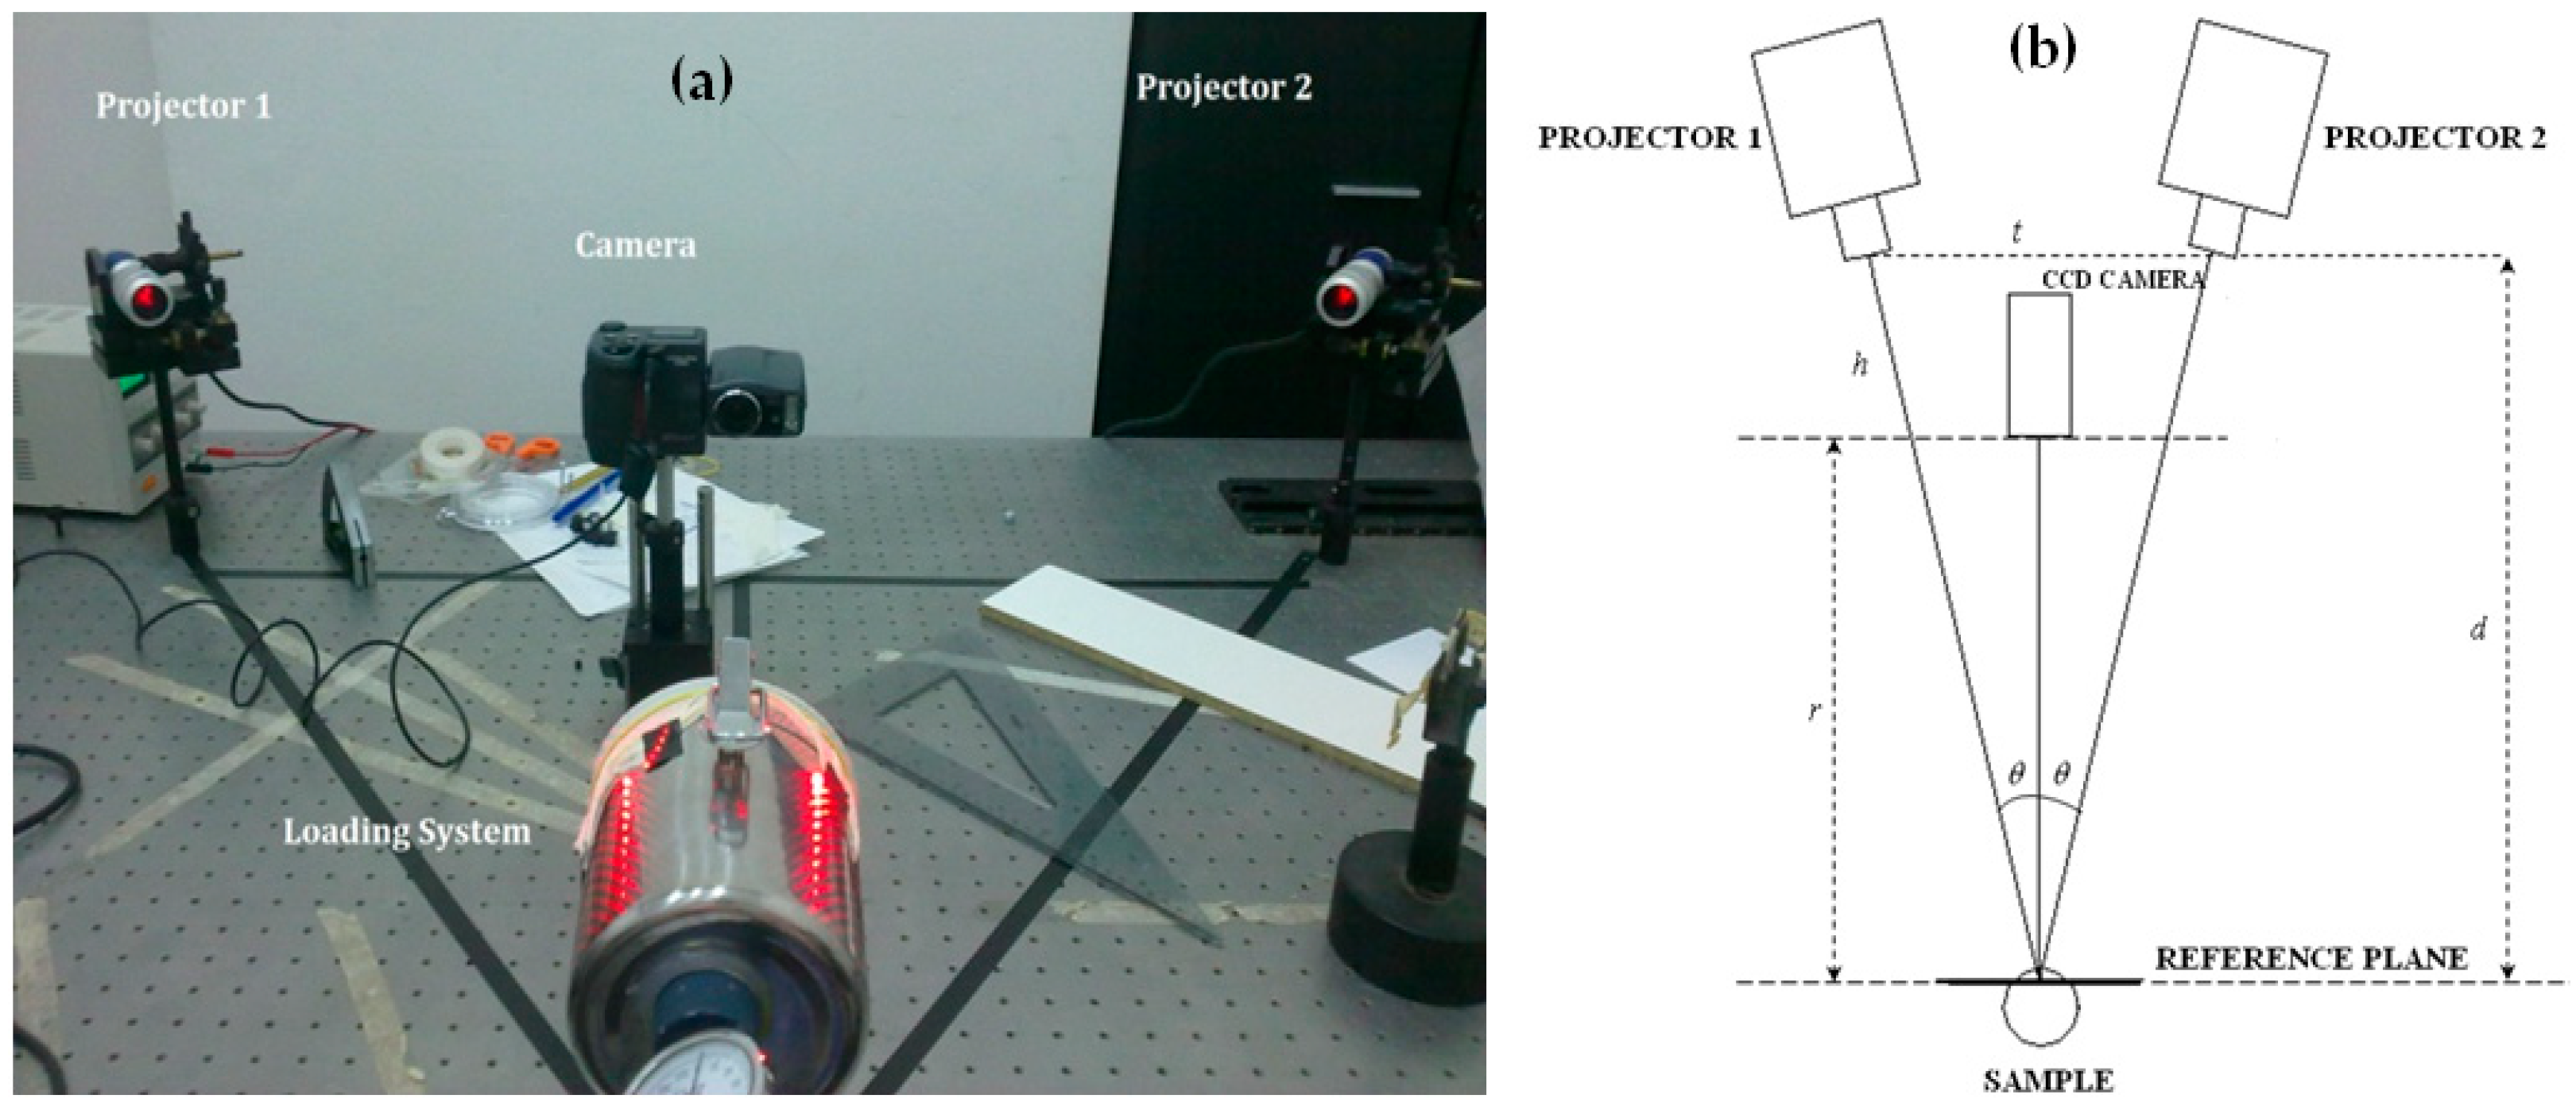
Figure 4a shows the one-shot projection moiré optical setup used here. The moiré setup is schematically represented in Figure 4b. The gratings were projected by standard LTPR3W/R led projectors (λ = 630 nm), symmetrically placed with respect to the direction of observation; each projector projected a glass slide containing a 254 μm pitch cross-grating (i.e., po = 100 lines/in), and the projection cone had an aperture of 18°. The two symmetrical projectors realize the condition of projection from infinity. The distance of the CCD camera from the analyzed object and the camera’s objective are selected so as also to have viewing from infinity. The distance between the baseline limited by the exit pupils of the two projectors and the reference plane was d = 675 mm, while baseline length was t = 930 mm; distance between camera and reference plane was r = 475 mm; illumination angle made by each projection direction and viewing direction was θ = 34.6° (see nomenclature in Figure 4b). The selected angle of illumination allowed fringe quality to be optimized.
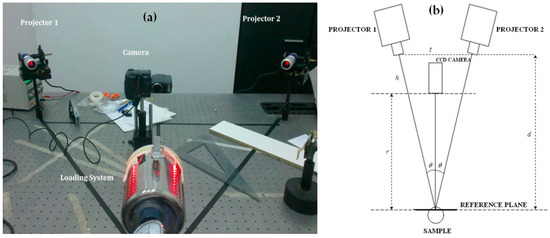
Figure 4.
Optical setup of the one-shot projection moiré technique used in the mechanical characterization process of the natural rubber membrane: (a) 3D assembly view; (b) Schematic.
Symmetry of projectors with respect to the optical axis of the camera was checked with the following method: We first place two small mirrors in correspondence with the centers of the membrane and camera inlet lens. The light beams coming from the two projectors are reflected from the mirror placed on the membrane towards the mirror placed on the camera inlet lens which in turn reflects back two spots towards the membrane mirror. When the four spots coincide, the projectors–camera system is lined up and the one-shot projection moiré optical setup is ready for use.
Magnification of optical setup used for membrane inflation experiments was 11.974, representing the ratio between the pitch of projected lines by each single projector and the corresponding nominal projected pitch po/cosθ. The sensitivity of the moiré setup to out-of-plane displacements Δsw was 2.678 mm, while sensitivity to in-plane displacements Δsu-v was 1.888 mm.
The natural rubber membrane was inflated by a pneumatic loading system, which progressively increased pressure from 1.07 to 2.33 kPa with the intermediate pressure loads of 1.33, 1.60 and 1.87 kPa. The specimen was clamped onto the pressurization chamber by an O-ring seal. The images relative to reference state (i.e., undeformed) and deformed configurations relative to each pressure level were recorded by a standard CCD camera (Nikon Coolpix 990) with a 2048 × 1536 pixel matrix. The camera objective was equipped with a Nikkor 8–24 mm optical zoom (3×) or a 4× digital zoom. The calibrated pixel size was 78.1 μm. A ruler was placed on the reference plane coinciding with the undeformed membrane, and numbers of pixels between pairs of adjacent dots werecounted. This operation was repeated over the whole field of view. The 78.1 μm pixel size was judged a precise calibration value because the standard deviation of calibrated pixel sizes computed over 10 different positions of the image was only 0.1 μm.
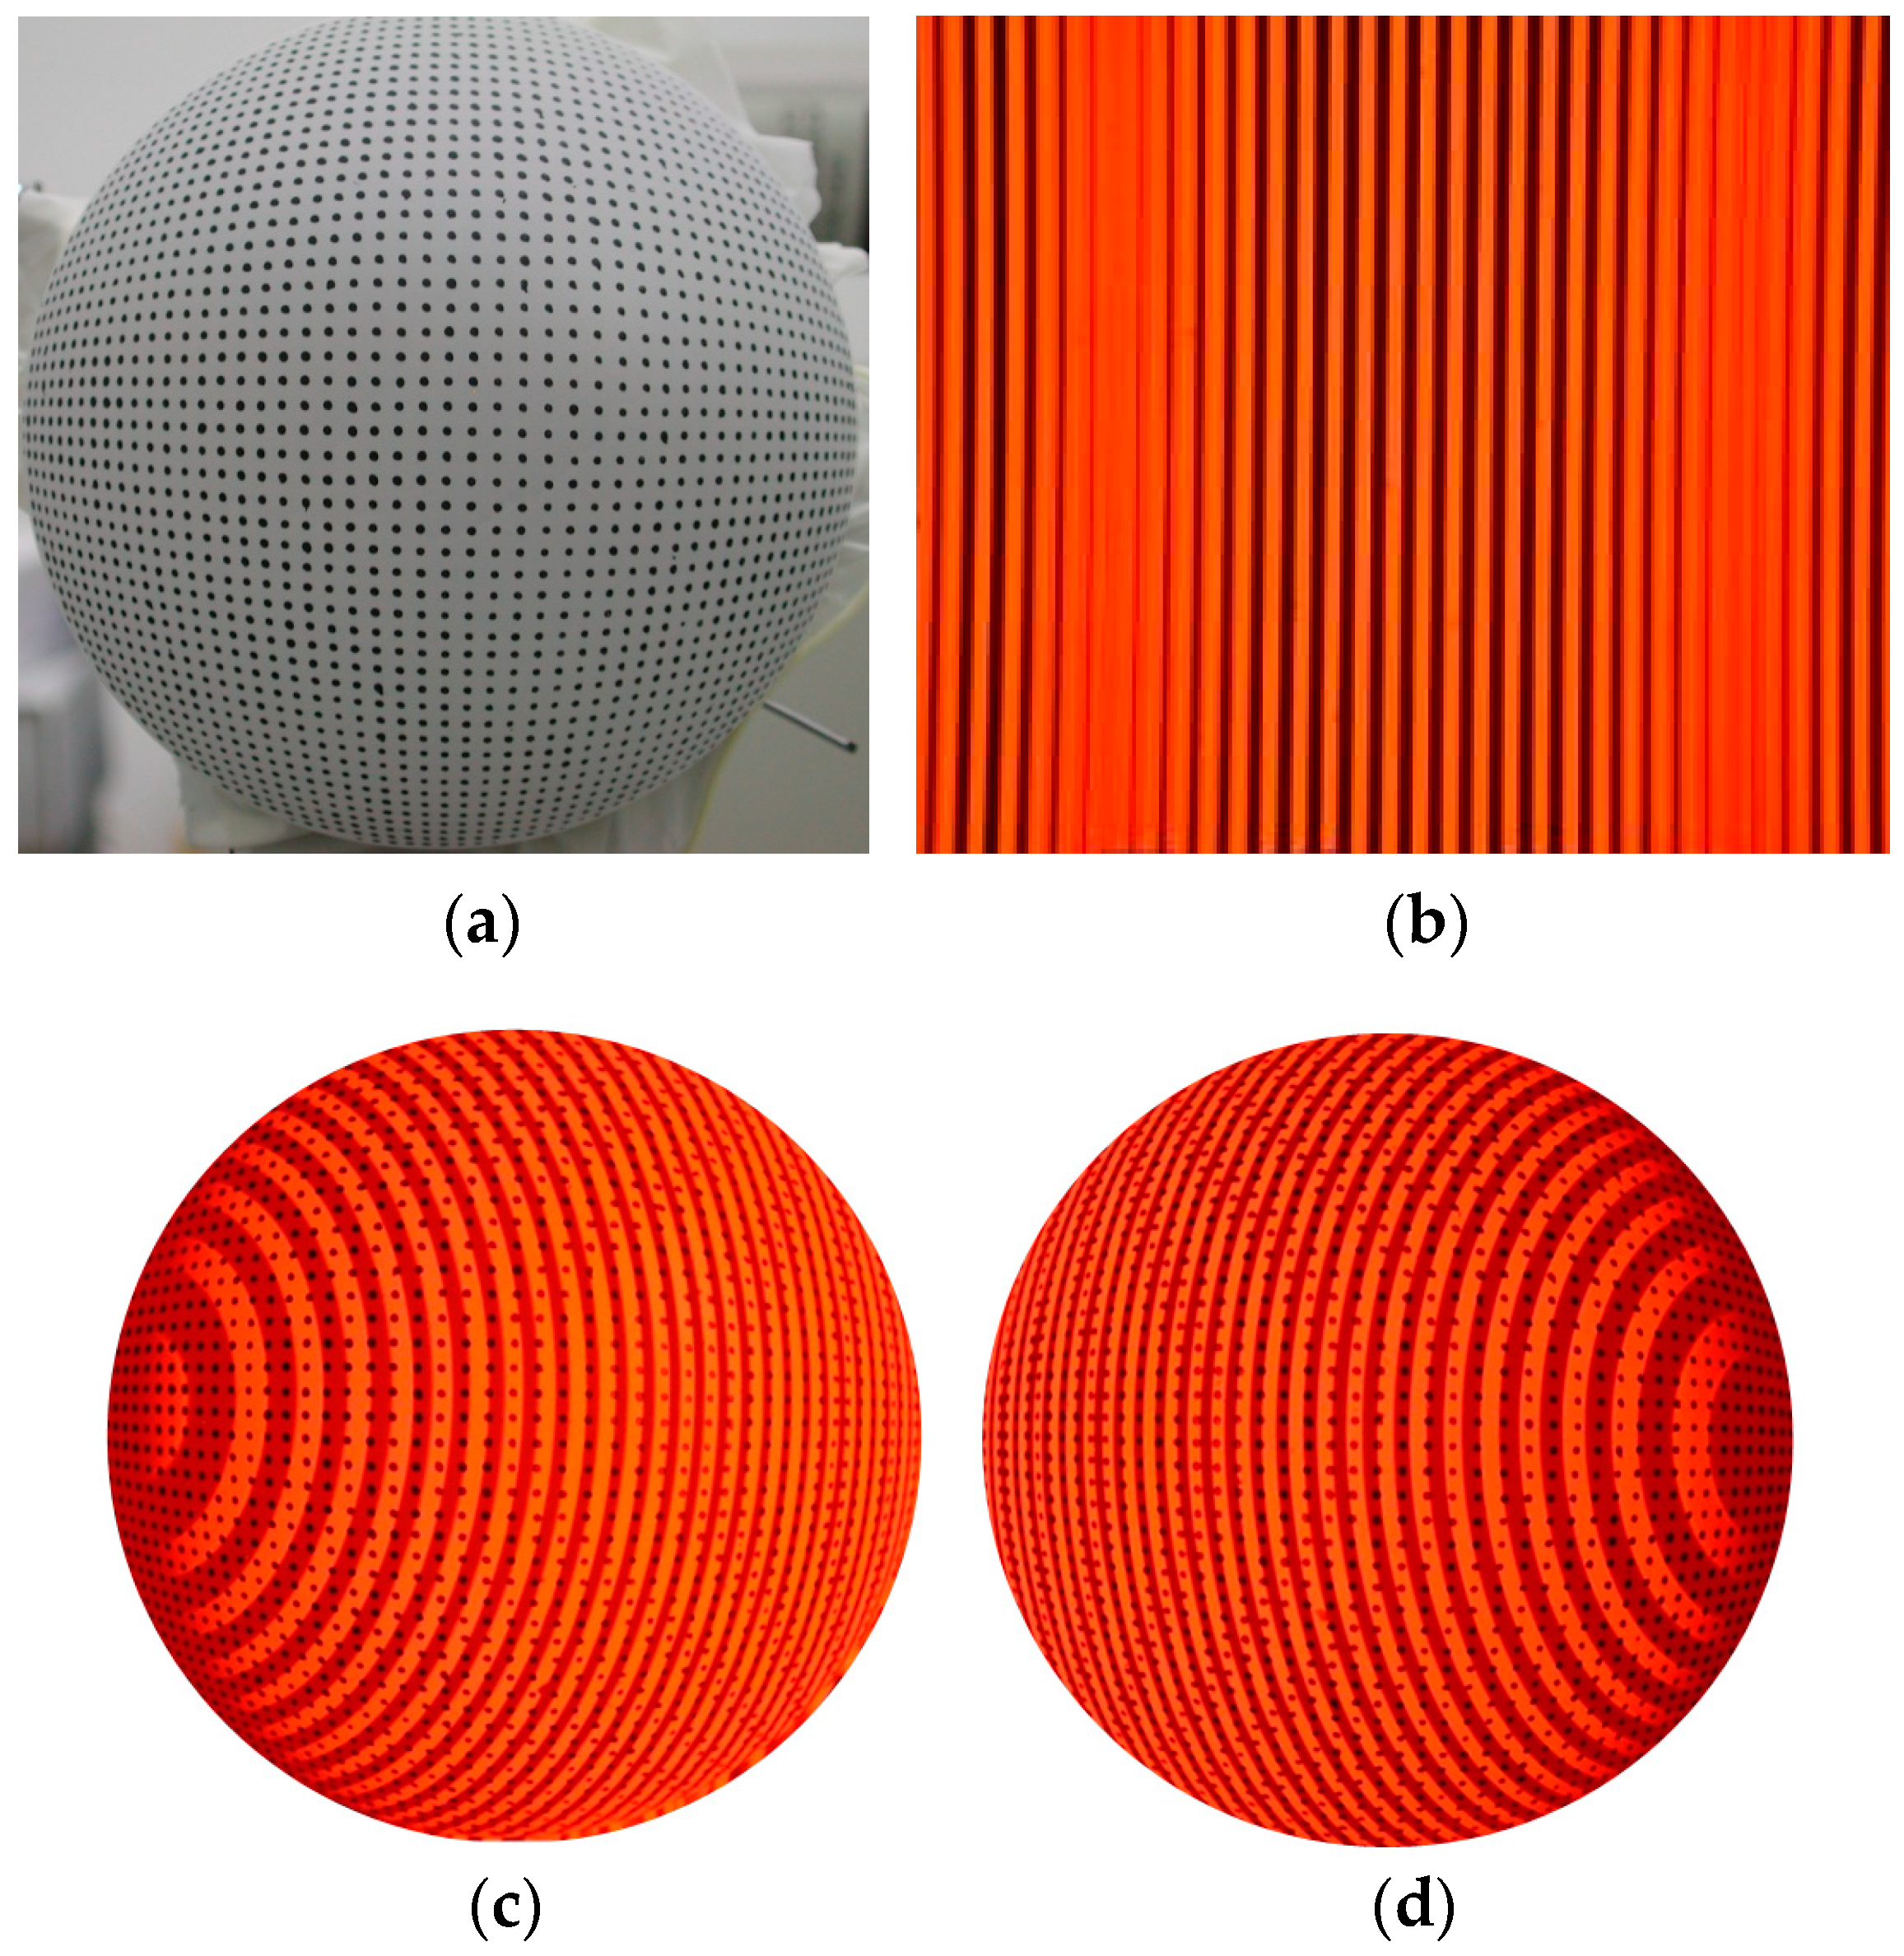
In order to have an independent measure of in-plane displacements, a variant of the one-projector IMPM setup of [34] (also recalled in Section 2.1) was developed. For that purpose, a reference pattern of dots with pitch 2 mm (practically the same in-plane sensitivity achieved by the projected cross-grating patterns) was also printed on the tested 100 mm diameter rubber membrane. The optical setup of Figure 4 was modified so as to reproduce the projection from infinity condition realized by the one-projector moiré setup of [34], where a grating of vertical lines was projected onto the specimen by a collimated light beam. Since the specimen analyzed in this study was 2.5 times larger than the one analyzed in [34] (i.e., 100 mm vs. 40 mm), the single projection optical setup could not be realized with the available equipment. Hence, projection from infinity was realized here by using symmetric double illumination and gratings with only vertical lines: the setup hence sensed the same parallax vector as in [34]. The layout of the two-projectors IMPM optical setup (including characteristic distances and illumination angles) and the pitch of the two gratings were obviously the same as those selected for the one-shot projection moiré. Figure 5 shows typical images recorded by this setup.
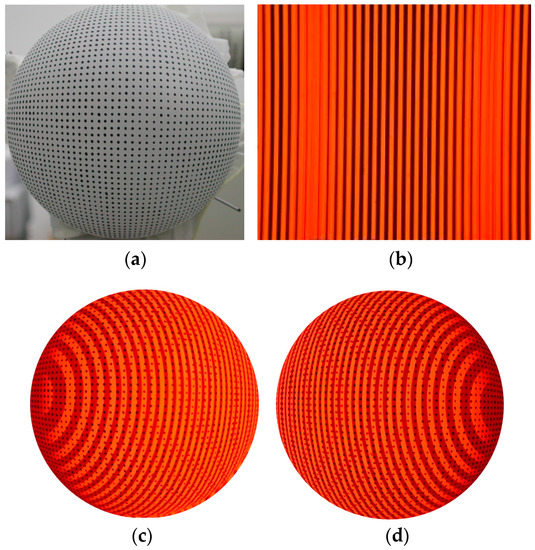
Figure 5.
Typical images recorded by the two-projectors,one-camera IMPM setup conceptually similar to the one-projector, one-camera IMPM setup of [34]: (a) spatial modulation of printed dot grating on inflated membrane; (b) central region of the multifrequency vertical lines pattern generated by the two projectors; (c) modulation of vertical lines projected on inflated membrane by the right projector; and (d) modulation of vertical lines projected on inflated membrane by the left projector.
The moiré data were processed as described in [34], and the corresponding displacement fields were taken as the target for evaluating the performance of the one-shot projection moiré setup utilized in this study. The images in Figure 5 recorded by the two-projectors IMPM setup for the inflated membrane refer to the following: the printed dot grating (Figure 5a); the projected gratings by left and right projectors (Figure 5c,d); and the central region of the projected line patterns (Figure 5b). In Figure 5b, the high-frequency lines correspond to projected vertical lines by the two projectors, while the low-frequency fringes are produced by the interfering wave fronts originating from the two projectors.
Since the one-shot projection moiré developed in this study utilized cross-gratings, it was projected onto the natural rubber membrane in a dot pattern similar to that printed on the specimen in the case of the two-projectors IMPM setup described above. The dot structure of the projected pattern onto the tested specimen originated from the combination of vertical and horizontal lines included in the two gratings. However, the present setup can inherently retrieve curvature information because it utilizes cross-gratings [31,35,36], while the two-projectors IMPM setup is insensitive to curvature changes in the Y-direction unless the deformed shape is fully axi-symmetric. Such a requirement may not be satisfied in the case of a variable thickness membrane like the one analyzed in this study.
Moiré fringes are obtained by mutually subtracting the recorded images of reference and modulated gratings. However, moiré patterns must be transformed into full-field continuous displacement maps by computing the phase difference Δϕ between unloaded and loaded configurations [31]. Displacements are hence determined for each selected pressure level as:
where subscripts u, v and w refer to the different displacement components and Δϕ/2π is the fractional fringe order for the corresponding unwrapped phase distribution Δϕ.
u,v = (Δϕu,v/2π)·Δsu,v
w = (Δϕw/2π)·Δsw
3. The Optimization Algorithm Used in the Identification Process
The displacement field measured with projection moiré was compared to its counterpart computed by an FE model simulating experiments. The error functional Ω thus defined was minimized in order to identify material/structural parameters. The optimization problem defined by Equation (1) was hence solved with the hybrid HS–JAYA metaheuristic algorithm combining the two well-established metaheuristic methods of harmony search optimization (HS) and JAYA. The new algorithm was formulated so as to minimize the computational cost entailed by the solution of the inverse problem (1). For that purpose, exploration and exploitation phases were properly mixed in the formulation of HS–JAYA and continuously alternated in the metaheuristic search process.
3.1. Background
Harmony search optimization is a population-based metaheuristic algorithm that mimics the search of a perfect harmony state made by jazz players. Three improvisation options can be selected by a skilled musician: (1) play any famous music (i.e., a series of pitches in HS) from his/her memory; (2) play something similar to known music (i.e., pitch adjusting in HS); and (3) compose new or random notes. Geem et al. [50,51] formalized these options into the formulation of an HS algorithm. NPOP randomly generated solutions are stored in the harmony memory [HM] matrix. New trial designs are extracted from [HM] or randomly selected based on harmony memory considering rate (HMCR) parameter values. Design variables may be modified based on pitch adjustment rate (PAR) parameter values; the bandwidth parameter (bw) defines the range of variation of a given variable in the pitch adjustment phase. Here, the basic HS formulation was adapted to the implicit formulation of the error functional Ω, and approximate line searches were performed in order to quickly approach the global optimum.
The JAYA method is another population-based metaheuristic algorithm developed by Rao [52]. It implements the simplest search strategy of metaheuristic optimization: trial solutions are always defined approaching the best design and moving away from the worst design of population. JAYA includes only two very standard control parameters: population size and limit number of iterations. Its straightforward formulation as well as its inherently efficient search strategy made JAYA become one of the most exploited and studied metaheuristic algorithms. JAYA’s formulation was modified in this study to reduce the computational cost of the identification process.
As mentioned before, JAYA’s implementation is very simple because there is only one equation to perturb design. Let Xj,k,it be the value of the jth material/structural property (j = 1, …, NDV) for the kth candidate solution included in the population (k = 1, …, NPOP) in the present itth iteration. The Xj,k,it value is perturbed as:
In Equation (13), denotes the perturbed material/structural property with respect to the current value; and are two random numbers extracted from the [0, 1] interval for the jth material/structural property; and and , respectively, denote the jth material/structural property values stored in the best and worst elements Xbest,it and Xworst,it of current population.
Term represents JAYA’s tendency to approach best design Xbest,it, while term portrays JAYA’s tendency to move away from worst design Xworst,it. Random factors r1 and r2 guarantee good exploration of search space. The absolute value enhances JAYA’s exploration capability [52].
The new trial design Xknew defined by Equation (13) is compared with the corresponding element Xkpre of population. If Xknew improves Xkpre, it replaces Xkpre in the updated population. The JAYA search stops when the limit number of iterations/analyses is reached.
3.2. Description of the HS–JAYA Algorithm
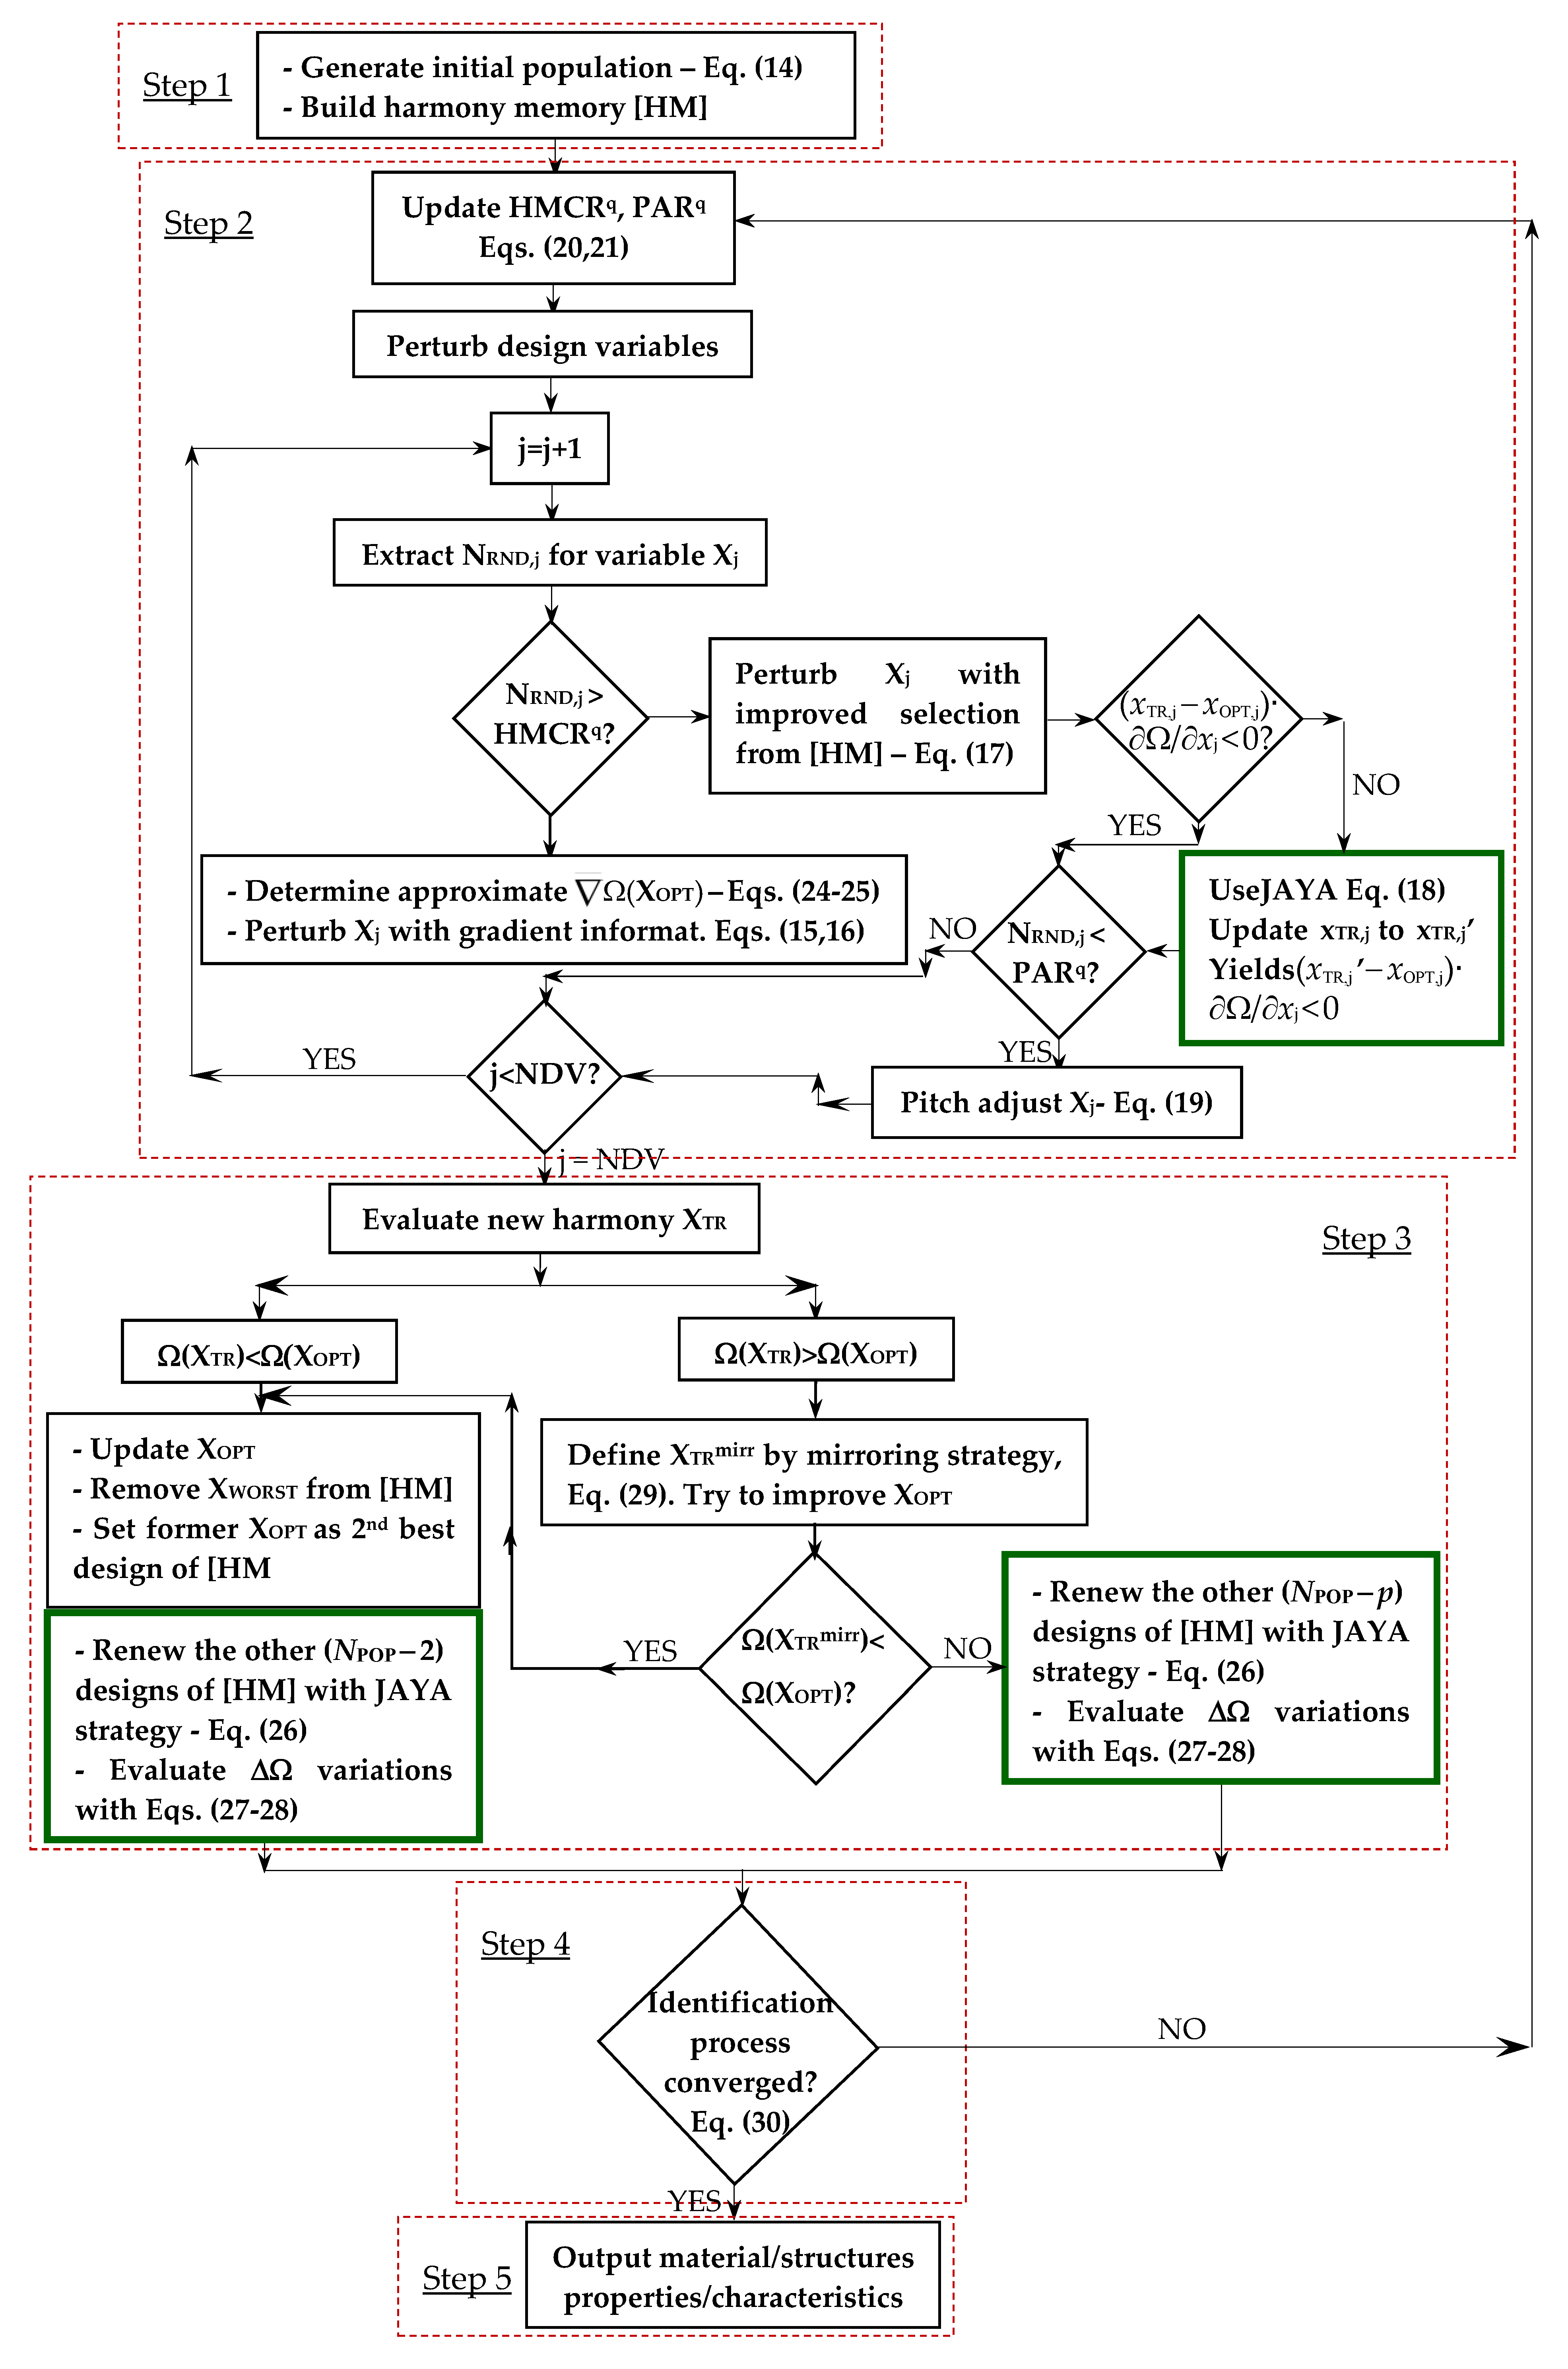
The hybrid HS–JAYA optimization algorithm used here for solving the inverse problem stated for the mechanical characterization of 100 mm diameter natural rubber membrane is now described in detail. The flowchart of HS–JAYA is shown in Figure 6. The steps of HS–JAYA are denoted by red boxes; green boxes highlight JAYA operators.
3.2.1. Step 1: Initialization of Optimization Algorithm and Formation of Initial Population
A population of NPOP candidate solutions for the inverse problem is randomly generated as follows:
where jk is a random number in the (0, 1) interval. The error functional is computed for each of the NPOP solutions stored in the initial population.
HMCR and PAR adaptively change in the optimization process, while bw is not necessary because new trial solutions have to lie on descent directions. Hence, the HS branch of HS–JAYA becomes inherently similar to enhanced JAYA formulations in the sense that it requires only population size to be specified by the user.
Different from most of the currently available HS and JAYA formulations, it is no longer necessary to define a limit number of iterations or function evaluations for HS–JAYA. In fact, HS–JAYA always forms trial designs trying to improve current best record and the rest of population by moving along descent directions. This is performed by simultaneously perturbing as many variables as possible as well as suboptimal designs.
3.2.2. Step 2: Generation of New Trial Solutions
Let XOPT = {xOPT,1, xOPT,2, …, xOPT,NDV} be the best element of population and Ω(XOPT) the gradient vector of the error functional Ω evaluated at XOPT. A random number NRND,j is extracted from the (0, 1) interval for each design variable. A recursive cycle is completed for each unknown material/structural property from 1 to NDV.
If NRND,j > HMCR, the new value xTR,j randomly defined for the jth material/structural property (j = 1, 2, …, NDV) currently perturbed is:
where ∂Ω/∂xj defines error functional sensitivity with respect to currently perturbed jth material/structural property, while μj = (∂Ω/∂xj)/||Ω(XOPT)|| defines normalized sensitivity. Sensitivities ∂Ω/∂xj are not explicitly available for mechanical characterization problems. The four relationships in Equation (15) generate trial points on descent directions where the error functional Ω is most likely to decrease.
Equation (15) is used more often if HMCR is small. The material/structural properties perturbations (xTR,j − xOPT,j) are weighted with corresponding sensitivities ∂Ω/∂xj and summed over to compute the ΔΩTR variation of error functional for the new harmony XTR. If ΔΩTR < 0, the STRT = (XTR − XOPT) perturbation vector defines a descent direction improving Ω. The following strategy retains or adjusts perturbations of each material/structural property (j = 1, 2, …, NDV):
The mirroring strategy expressed by the second inequality transforms any non-descent direction STR into its opposite descent direction –STR, which may improve the Ω functional.
If NRND,j < HMCR, for any PAR values, HS–JAYA defines the interval limited by and , adjacent to xOPT,j coordinate of XOPT, sorting values as < xOPT,j < . The jth material/structural property is updated as (j = 1, 2, …, NDV):
If (xTR,j − xOPT,j)·∂Ω/∂xj < 0, the xTR,j trial value of Equation (17) is checked for pitch adjustment. Otherwise, if (xTR,j − xOPT,j)·∂Ω/∂xj > 0, JAYA’s characteristic Equation (13) becomes:
In Equation (18), β1,j and β2,j are random numbers in the [0, 1] interval; ; . The JAYA-based strategy implemented here limits search in the [;] neighborhood of current best value xOPT,j for the jth material/structural property, thus exploring descent directions ( − xOPT,j) and −( − xOPT,j). HS–JAYA always searches good trial designs in the neighborhood of current best design. This elitist strategy is implemented in Equation (17) and further in Equation (18), defining descent directions for the JAYA operator.
Interestingly, HS–JAYA mixes exploration and exploitation to define the new trial design XTR. Such a combination is made at single variable level. For example, Equation (15) is an exploration scheme because perturbations of each design variable of XTR depend on the distance between XOPT and variable space boundaries. Conversely, Equations (16) through (18) are exploitation schemes because they perturb single optimization variables within a neighborhood of XOPT, either selecting a “mirror” direction of a non-descent direction (i.e., Equation (16)), or using an interval of adjacent values and to the currently optimum value xOPT,j of the jth perturbed variable (i.e., Equation (17)), or using descent directions defined by xOPT,j and values and close to and (i.e., Equation (18)).
If NRND,j < HMCR and NRND,j < PAR, xTR,j (or xTR,j′) is pitch-adjusted as:
where NGpitch,adj and NGtot are the numbers of pitch-adjusted solutions and generated trial solutions, respectively. The latter counter is reset to (NGpitch,adj + 1) if the new harmony has more pitch-adjusted variables than those perturbed with gradient information. The bandwidth parameter bw of classical HS hence becomes unnecessary. Equation (19) accounts for optimization history as it evaluates the ratio of pitch-adjusted trial solutions to the total number of trial solutions currently generated. In Equation (19), the “+” sign is used if ∂Ω/∂xj < 0 to maximize reduction of error functional ∂Ω/∂xj with respect to the jth material/structural property, while the “–” sign is used if ∂Ω/∂xj > 0.
HMCR and PAR are automatically adapted by HS–JAYA in each iteration as:
In Equation (20), q refers to current iteration; Ωaver,initq−1 and Ωaver,endq−1, respectively, are the average error functional values of solutions stored in [HM] at the beginning and the end of the previous iteration (rated successful if Ωaver,endq−1/Ωaver,initq−1 < 1); XOPT,init and XWORST,init, XOPT,end and XWORST,end, respectively, denote the best and worst solutions at the beginning and end of the previous iteration; NGgradient (defined as number of trial solutions generated using gradient information) is reset to (NGgradient + 1) if there are more than NDV/2 material/structural properties perturbed including gradient information via Equation (15) without applying the mirroring strategy in Equation (16).
Random values HMCRextractedq and PARextractedq are defined as:
In Equation (21), ξHMCR and ξPAR are random numbers in the (0, 1) interval; bounds 0.01 and 0.99 allow us to cover all combinations of HS parameters [53]. For q = 1, it holds that HMCRq = HMCRextractedq and PARq = PARextractedq.
HMCR and PAR decrease more sharply if error functional is significantly reduced. This is very likely to occur in the exploration phase of the optimization process when the definitions of new trial solutions rely on gradient information and the condition NRND,j > HMCR is easier to be satisfied. Such a scenario is consistent with small (NGpitch,adj/NGgradient) values. Pitch adjusting is less effective in the exploitation phase when population presents a small value of ||XOPT,end − XWORST,end||/||XOPT,init − XWORST,init||.
Derivatives of Error Functional Ω
Since definition of Ω is implicit, HS–JAYA uses approximate line search for evaluating derivatives, thus reducing the number of FE analyses entailed by the inverse problem (1). The variation ΔΩk = [Ω(Xk) − Ω(XOPT)] of error functional defined by moving from the best solution XOPT to the kth solution Xk of population is computed for all solutions together with corresponding distance ΔSk = ||Xk − XOPT||. HS–JAYA computes the approximate (i.e., “average”) gradient ΔΩk/ΔSk along any Sk = (Xk − XOPT) direction. Since candidate solutions must improve the Ω functional, the Sk vectors are turned into descent directions Sdesck = (XOPT − Xk); hence, Sdesck = −ΔSk. HS–JAYA then selects three descent directions: (i) best direction SBEST (opposite to (XWORST − XOPT)) yielding the largest variation of Ω between candidate solutions; (ii) steepest descent direction SFAST for which gradient ΔΩk/ΔSk is largest; and (iii) second best direction S2ndBEST (opposite to (X2ndWORST − XOPT)) yielding the second largest variation of Ω between candidate solutions.
Any descent direction defined for perturbing XOPT should lie in the region limited by SBEST, S2ndBEST and SFAST. Scale factors βBEST, β2ndBEST and βFAST, respectively, turn SBESTunit, S2ndBESTunit and SFASTunit into unit vectors. If ||SBEST|| < 1 or||S2ndBEST|| < 1 or||SFAST|| < 1, they are not modified. Three new trial solutions, XGR(1), XGR(2) and XGR(3), are defined to check whether unit directions are descent or not:
The unit vectors SBESTunit, S2ndBESTunit and SFASTunit are descent directions if:
In all likelihood, there will be between one and three unit descent directions in the neighborhood of XOPT. Derivatives of error functional are evaluated as (j = 1, 2, …, NDV):
In Equation (24), sensitivity corresponds to the minimum value amongst the three terms defined for SBESTunit, S2ndBESTunit and SFASTunit. This allows us to minimize the increment or maximize the reduction of Ω functional in the neighborhood of XOPT. The approximate gradient evaluation strategy of HS–JAYA limits computational cost of the identification process to a great extent.
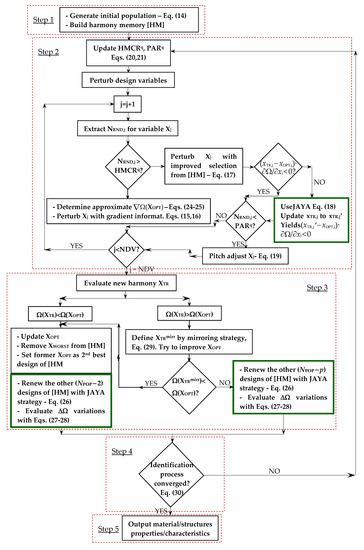
Figure 6.
Flow chart of the HS-JAYA algorithm developed in this study.
Figure 6.
Flow chart of the HS-JAYA algorithm developed in this study.
The approximate gradient evaluation strategy defined by Equations (22) through (24) substantially resembles that adopted in [27] for identification problems including at most 17 unknown parameters. Since the inverse problems solved in the present study included up to 324 optimization variables, the error functional Ω may be characterized by the presence of a significantly higher amount of nonlinearity. In view of this, gradient evaluation process changed as follows. HS–JAYA resorts directions SBESTunit, S2ndBESTunit and SFASTunit as (SBESTunit)′, (S2ndBESTunit)′ and (SFASTunit)′ according to the scheme of Equation (25):
Equation (25) relies on the following rationale. The unit directions SBESTunit, S2ndBESTunit and SFASTunit define a neighborhood of XOPT where approximate gradients of error functional are evaluated. If approximation is accurate, the sorting of these directions in terms of ΔΩ variations should not change over the whole neighborhood of XOPT. However, such a condition may not be satisfied when error functional Ω is highly nonlinear. In this case, trial solutions XGR(1), XGR(2) and XGR(3) rank differently from their corresponding directions SBESTunit, S2ndBESTunit and SFASTunit from which they originated via Equation (22). Therefore, SBESTunit, S2ndBESTunit and SFASTunit must be re-sorted consistently with the relative ranking of XGR(1), XGR(2) and XGR(3). The re-sorted directions (SBESTunit)′, (S2ndBESTunit)′ and (SFASTunit)′ are then given in input to Equation (24) to compute sensitivities of cost error functional.
Interestingly, the quality of gradient approximation improves as the optimization progresses and population concentrates about the current best record XOPT. In fact, distances ΔSk = ||Xk − XOPT|| become smaller and the ΔΩk/ΔSk definition tends to the real gradient of error functional Ω. This ability makes HS–JAYA’s exploitation phase inherently superior with respect to the classical local search schemes employed by many hybrid metaheuristic algorithms, which perturb high quality designs without guaranteeing that cost function can always improve.
3.2.3. Step 3: Evaluation of XTR Trial Design and Population Update
HS–JAYA evaluates the new trial solution XTR defined in step 2 according to two cases: (1) Ω(XTR) < ΩOPT; and (2) Ω(XTR) > ΩOPT. This approach is far more effective than only replacing the worst design Xworst of [HM] as it is conducted by classical HS.
Case 1: Ω(XTR) < WOPT
The new trial solution XTR is reset as XOPT. Xworst is removed from [HM]. The former optimum is downgraded as the second best solution X2ndBEST of population, while the second worst solution of the previous population becomes the worst design Xworst of the new population. The other (NPOP − 2) solutions of the population are updated by HS–JAYA as:
In Equation (26), r ∈ (NPOP − 2); ω1 and ω2 define two vectors of NDV random numbers in the [0, 1] interval: in particular, ω1,j and ω2,j are defined for the jth variable of processed harmony. Since the (XNPOP-2)r harmony has to be improved, HS–JAYA explores the descent direction (XOPT − (XNPOP-2)r) defined with respect to (XNPOP-2)r and attempts to move away from the worst design Xworst of [HM], which certainly would never improve (XNPOP2)r.
If Ω((XNPOP-2)r,new) < Ω((XNPOP-2)r), the new harmony (XNPOP-2)r,new should obviously replace the old harmony (XNPOP-2)r in [HM]. However, since evaluating the error functional Ω always entails a new structural analysis, HS–JAYA adopts an alternative strategy to limit the computational cost of metaheuristic optimization. The variations (i.e., increments) of error functional (ΔΩ(NPOP-2),r)appr and (ΔΩ(NPOP-2),r-new)appr that would occur if the solution is perturbed from XOPT to the harmony (XNPOP-2)r or (XNPOP-2)r,new may be estimated by two scalar products as:
The (ΔΩΩ(NPOP-2),r−new)apprand (ΔΩ(NPOP−2),r)appr terms in Equation (27) express the approximate variations of the error functional Ω that would be obtained if Ω is linearized. The real variation ΔΩ(NPOP−2),r of error functional for (XNPOP−2)r is known, as this candidate solution is stored in the current population: ΔΩ(NPOP−2),r = [Ω((XNPOP−2)r) − Ω(XOPT)]. The real variation ΔΩ(NPOP−2),r is obviously positive because (XNPOP−2)r is worse than XOPT. In all likelihood, the approximate variation (ΔΩ(NPOP−2),r)appr also may be positive.
If (XNPOP−2)r,new is better than (XNPOP−2)r, it holds that Ω((XNPOP−2)r,new) < Ω((XNPOP−2)r). By subtracting the current optimum value of Ω to both terms of this inequality, it holds that Ω((XNPOP−2)r,new) − Ω(XOPT) < Ω((XNPOP−2)r) − Ω(XOPT). Since the RHS of the inequality is equal to ΔΩ(NPOP−2),r, the previous expression can be written as Ω((XNPOP−2)r,new) − Ω(XOPT) < ΔΩ(NPOP−2),r. The [Ω((XNPOP−2)r,new) − Ω(XOPT)] variation is approximated by the (ΔΩ(NPOP−2),r−new)appr term defined in Equation (27). The inequality can finally be rewritten as (ΔΩ(NPOP−2),r−new)appr < ΔΩ(NPOP−2),r.
HS−JAYA adopts the following strategy to decide whether or not (XNPOP−2)r,new should replace (XNPOP−2)r in the updated population:
Using the threshold variation (Ω(NPOP−2),r)threshold defined in Equation (28) is a conservative way to minimize the variation ΔΩ(NPOP−2),r−new of the error functional. In fact, HS–JAYA is forced to include in the updated population only candidate solutions that effectively yield a low error functional penalty with respect to XOPT. In summary, the population is updated only if strictly necessary and the number of structural analyses per optimization cycle performed by HS–JAYA becomes significantly smaller than the NPOP analyses required by the vast majority of currently available HS and JAYA methods.
The population is reordered with respect to Ω values of the updated solutions and the next harmony is processed. HS–JAYA finally checks for convergence in step 4.
The population updating process performed by HS–JAYA may be classified as an exploration phase because it operates on (NPOP–2) candidate solutions distributed over the whole design space. The JAYA-based strategy stated by Equation (26) inherently realizes exploration, as defining any new candidate solutions (XNPOP−2)r,new involves the best and worst designs of the population. Equations (27) and (28) are somehow based on exploitation because they operate on local variations of error functional Ω with respect to ΩOPT. However, as optimization progresses, the population becomes more and more concentrated near the current best record XOPT, and even the JAYA-based Equation (26) actually generates designs in the neighborhood of XOPT turning towards the exploitation phase.
Case 2: Ω(XTR) > ΩOPT
A mirroring strategy is attempted by HS–JAYA to turn the non-descent direction (XTR − XOPT) into a descent one. Hence, the trial solution is defined as:
where ηMIRR is a random number in the (0, 1) interval. If Ω, is discharged and is compared to candidate solutions of [HM]. Conversely, if Ω, is discharged and is compared with the candidate solutions stored in [HM]. Although unlikely, might even improve XOPT. Should this occur, is set as the new best record XOPT of [HM].
Similar to case (1), HS–JAYA utilizes Equation (26) to update the (NPOP − p) harmonies ranking below XTR or . Each new harmony is then evaluated as explained for case (1). Convergence is checked in step 4.
3.2.4. Step 4: Convergence Check
Standard deviations on identified values of material/structural properties and error cost functional values of the candidate solutions stored in [HM] decrease as optimization progresses and HS–JAYA approaches the solution of the inverse problem. HS–JAYA normalizes standard deviations with respect to the average solution (component for jth variable is ) and the average cost functional . The termination criterion is:
where εCONV is the selected convergence limit—usually between 10−15 (below the double precision limit) and 10−4 (to save computation time). Equation (30) must be verified over the last three optimization iterations. Steps 2 through 4 are repeated until the HS–JAYA algorithm converges to the global optimum.
3.2.5. Step 5: Termination of Optimization Process
HS–JAYA terminates the optimization process. The identified material/structural properties and residual errors on displacement components are written in the results file.
3.3. Summary of HS–JAYA Algorithm and Discussion on Local Search Schemes in Metaheuristic Optimization
The main features of HS–JAYA may be summarized as follows. All stages of the proposed algorithm aim to reduce the FE analyses of the identification process. For that purpose, material/structural parameters to be identified are always perturbed by moving along descent directions that can minimize the error functional Ω stated in the inverse problem. Candidate solutions are directly generated in the HS phase by using gradient information or approximate line search (also including mirroring), and then corrected/refined by JA-based operators that push optimization search towards the best solution of the population or the best design within a local neighborhood of the currently analyzed trial solution. Gradient information is obtained at low computational cost by properly combining the directions of (i) the largest variation of Ω, (ii) the second largest variation of Ω, and (iii) the fastest reduction of Ω. The elitist mechanisms implemented in HS–JAYA allow the number of analyses per optimization cycle to be significantly reduced with respect to the typically required NPOP analyses by the most common implementations of HS and JAYA. Exploration and exploitation mechanisms are continuously alternated in HS–JAYA’s metaheuristic search process and integrated by the optimizer even at the single variable level when a new trial design has to be generated. Furthermore, HS–JAYA is a parameter-free algorithm as it requires only population size to be specified by the user. Typical parameters defined in HS, such as pitch adjusting rate, harmony memory considering rate and bandwidth, become unnecessary or they are adaptively changed in HS–JAYA based on the trend of optimization history. Finally, HS–JAYA has a robust convergence criterion that avoids premature termination of the optimization process and convergence to false optima.
The HS–JAYA formulation significantly enhances the LSSO–HHSJA algorithm [54] previously applied to sizing optimization of truss structures. However, while for LSSO–HHSJA, the cost function gradients were explicitly available and constant over the whole design space, HS–JAYA has to deal with an implicit cost function, the error functional Ω of the identification problem. Renewal of suboptimal designs of population (this task entails the use of JAYA operators) cannot be performed by simply evaluating a cost function defined explicitly as it occurred for LSSO–HHSJA because evaluating the error functional for a new trial design always entails finite element analysis.
An interesting issue is how the formulation of HS–JAYA relates to the local search schemes usually adopted in metaheuristic optimization. The concept of “global” and “local” search depends on the algorithm’s nature. Metaheuristic optimizers very often work with a population of candidate solutions, and global search means to explore the whole design space by considering a large number of candidate solutions or assigning large perturbations to optimization variables. However, for single-point algorithms such as simulated annealing, global search means simultaneous perturbation of all optimization variables while local search perturbs variables one by one.
A common approach in metaheuristic optimization is to use hybrid algorithms where a metaheuristic search engine globally explores the design space and identifies a set of designs later refined by local search. The local search process may employ gradient-based optimizers or specific operators taken from other metaheuristic algorithms. The former approach was utilized by Fesanghary et al. [55], who selected HS as main search engine and sequential quadratic programming (SQP) to perform local search in the neighborhood of the best designs included in the harmony memory. However, a drawback of this approach may be the computational cost of gradient-based local optimization, which should be less expensive than a metaheuristic search. In this regard, it should be noted that gradient-based algorithms require at least (NDV+1) analyses to evaluate sensitivities plus additional analyses to solve the approximate subproblem and minimize the cost function along the search direction found by solving the approximate subproblem. This cost soon becomes unaffordable if the number of optimization variables is comparable with population size.
The use of specific operators from other metaheuristic methods also is well-documented in the optimization literature. For example, Hwang et al. [56] used GA for global search and SA for local searches in the neighborhood of best individuals stored in the population. SA inherently has hill-climbing capability, which allows local minima to be bypassed. However, the cooling schedule of SA should be carefully chosen.
Memetic algorithms (MA) represent an important category of hybrid algorithms, which combine a metaheuristic technique with one or more problem-specific local searchers. For example, Bao et al. [57] used a particle swarm optimization algorithm (PSO) to explore the design space, and a pattern search (PS) to perform exploitation of the best designs identified by PSO; the algorithm was successfully applied to optimize parameters of support vector machine space. More recently, Abbasi-khazaei and Rezvani [58] developed a very efficient MA architecture for joint minimization of energy costs and scheduling in distributed computing; their MA formulation used GA for exploration, host-based hill-climbing and first-fit decreasing without placement for local search, properly selecting neighbors to limit computational effort.
HS–JAYA relies on a completely different rationale with respect to the aforementioned hybrid optimization schemes [55,56,57,58]. In fact, whilst those algorithms employed well-distinct methods for global search (exploitation) and local search (exploitation) and each method was utilized only for exploration or only for exploitation, the present algorithm dynamically mixes HS and JAYA operators regardless of being in the exploration or exploitation phases. Remarkably, exploration and exploitation can be mixed even in the formation of a new trial design. HS–JAYA always attempts to generate better trial designs than the current best record XOPT. For that purpose, HS–JAYA adopts only elitist strategies such as, for example, descent directions originating from XOPT, mirroring and elaboration of adjacent values to the optimum value of the currently perturbed variable. The basic JAYA equation is modified into several forms to permanently steer HS–JAYA’s search towards the global optimum based on the specific scenario encountered in the optimization history. Consequently, HS–JAYA requires just a few analyses for improving population, while hybrid metaheuristic algorithms with local search such as those applied in [55,56,57,58] may even fail to improve selected designs for the exploitation phase. Such an ability inherently allow HS–JAYA to significantly limit the total energy consumption related to computations.
4. Results and Discussion
4.1. Outline of Experimental Measurements
The experiments carried out in this study regarded the mechanical characterization of a natural rubber membrane (diameter 100 mm, nominal thickness 1 mm). The material of the tested specimen is nominally isotropic as reported in [34]. In that study, natural rubber was modeled as a homogeneous, isotropic, hyperelastic material following the two-parameter Mooney–Rivlin (MR) constitutive law [59,60,61,62]; the corresponding values of hyperelastic constants identified in [34] were a10 = 201.021 kPa and a01 = 13.201 kPa.
The diameter of the natural rubber specimen characterized in [34] was only 40 mm vs. 100 mm considered in this study. Furthermore, the thickness of the tested membrane was found here not to be constant over the whole specimen. Since this may introduce anisotropy in mechanical response, preliminary planar biaxial tests were carried out on circularly shaped natural rubber membranes of diameter 25, 50, 75, 100 and 125 mm. Loads were selected so as to have a stretch ratio of 1.3 in all experiments: hence, the material works in the constant slope segment of typical two-parameter MR stress–strain curve relative to natural elastomeric materials. Intrinsic moiré (IM) was used to measure deformations occurring in the planar biaxial tests. The degree of anisotropy in mechanical response deriving from thickness variations was also evaluated for each selected specimen diameter. This information was later utilized in the mechanical characterization of the 100 mm diameter circular membrane with the one-shot projection moiré model.
4.2. IM Measurements and Preliminary Mechanical Characterization (Anisotropic Response)
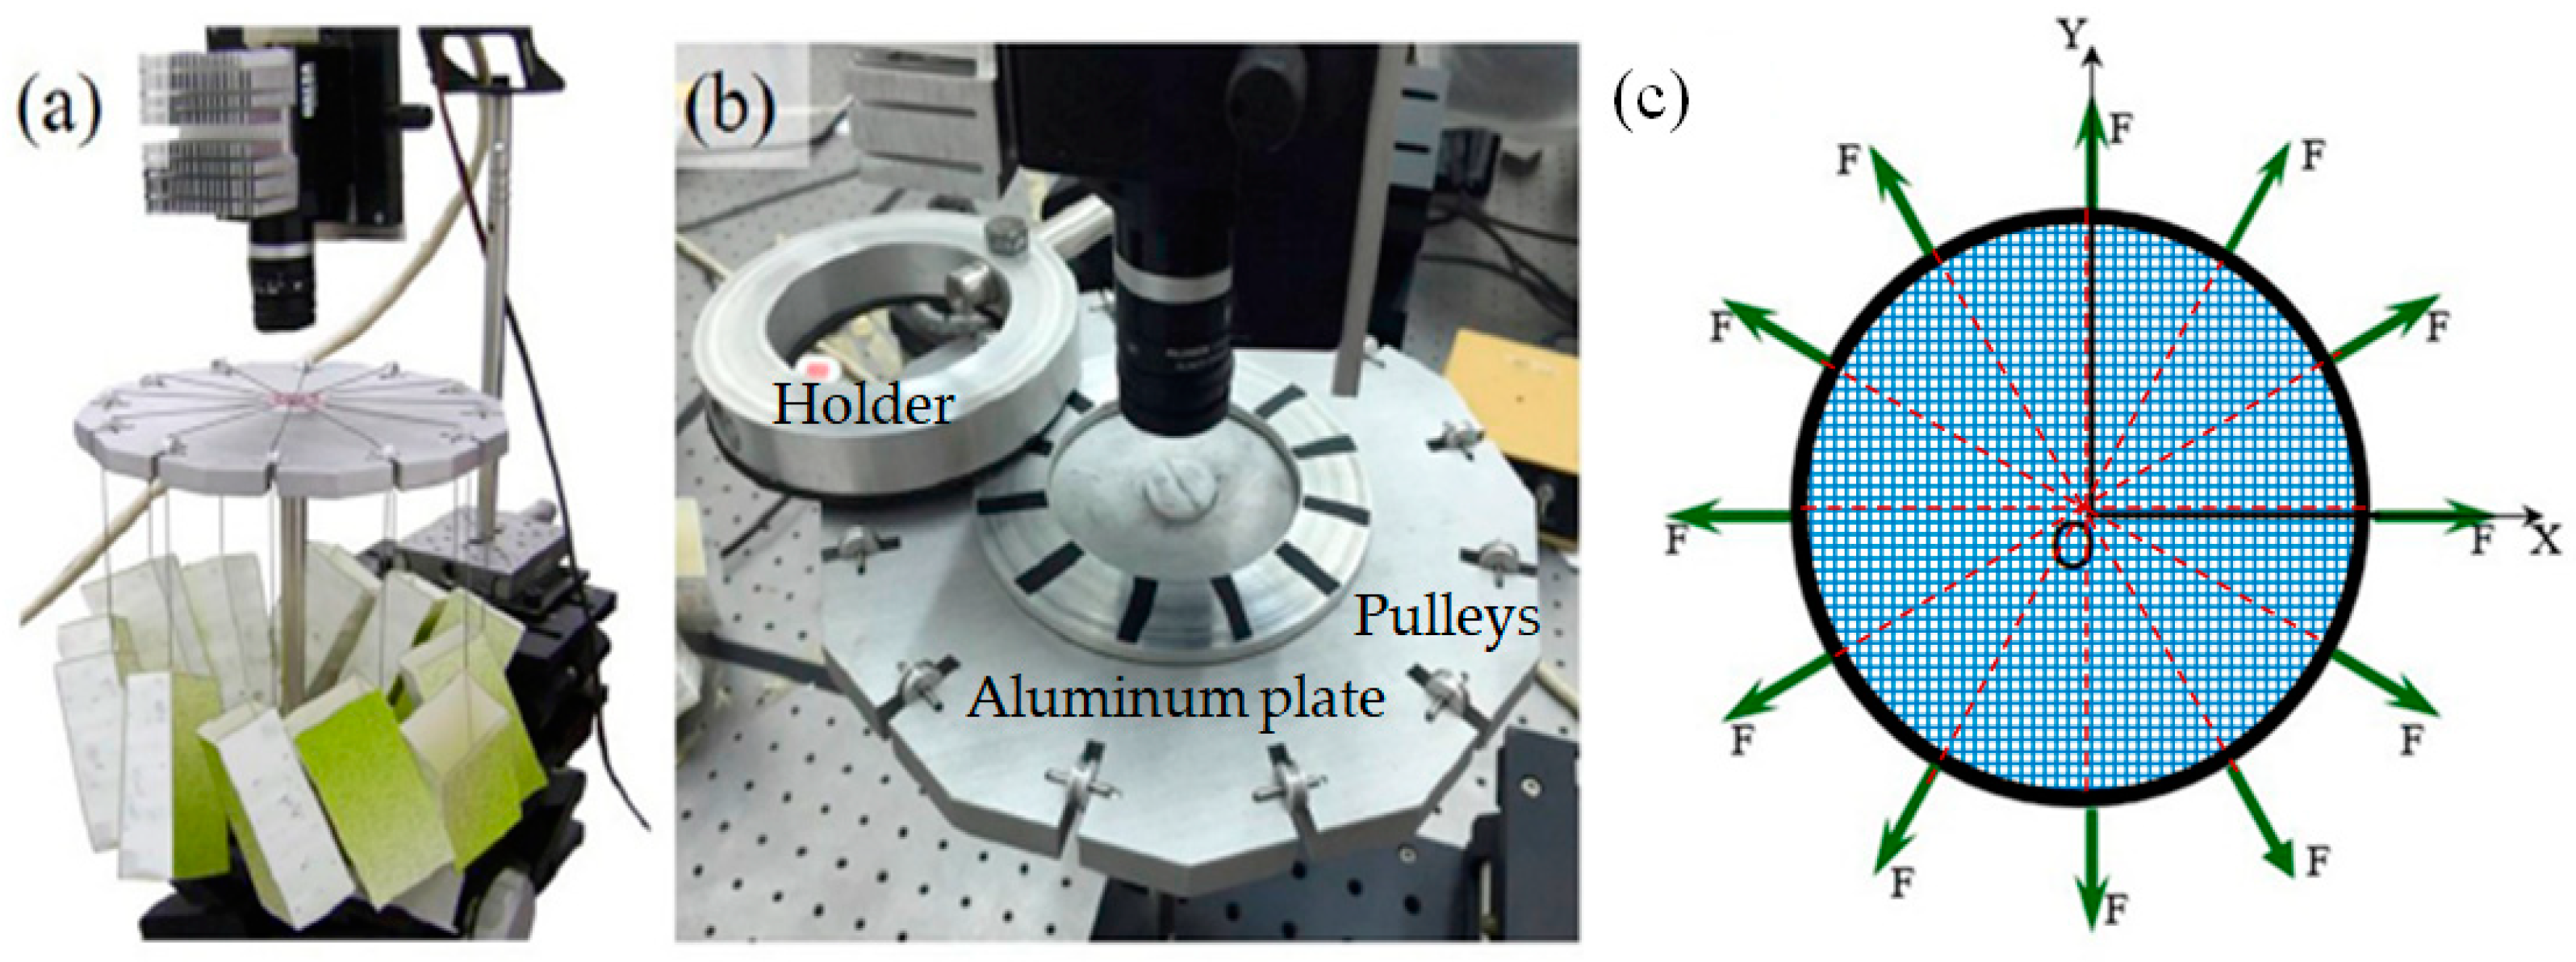
The same intrinsic moiré setup of Ref. [63] was used in this study for the preliminary planar biaxial tests. An assembly view of optical set is presented in Figure 7 together with the schematic diagram of the load distribution.
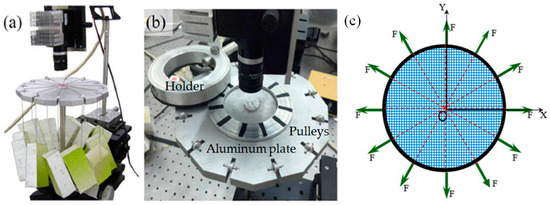
Figure 7.
Intrinsic moiré setup used for preliminary in-plane biaxial tests (similar to the setup used in [63]): (a) 3D assembly view; (b) details of loading apparatus; and (c) schematic representation of the load distribution showing the 12 loading directions that correspond to six diameters (etched lines).
Each specimen was placed in the center of a dodecagonal aluminum plate and circumferentially hooked by 12 nylon wires (Figure 7a–c). Each wire was connected to dead weights, which were progressively added to the wire so as to cover loading history selected for a given specimen within 10 load steps. The load was applied to sample by the 12 pulleys placed in the dodecagon side centers (Figure 7b). The toroidal holder prevented any micro-movements and rigid body motions of the sample, that might have developed in the loading phase.
The two-parameter Mooney–Rivlin hyperelastic law [59,60,61,62] is a classical phenomenological model. The strain energy density function W is:
where strain invariants of the Cauchy–Green strain tensor [C] are defined as = tr[C] and = {tr2[C] − tr2[C]2}.
The Young’s modulus in the X or Y direction is EMR = 4(1 + ν)(a10 + a01), while the shear modulus is μ = 2(a10 + a01). MR constants a10 and a01 are computed by minimizing the difference between the experimentally measured principal Cauchy stresses and theoretical values. A linear system is obtained:
where NTG is the number of experimental data and k refers to the generic experimental measure. The system (32) can be solved if the true stresses σTGk and stretch ratios λ1k at each load step are known. The nominal stress generated by the circumferential loads is σeng = F/πtd, where F is the sum of radial forces applied to the specimen, t is the nominal specimen thickness (i.e., 1 mm) and d is the specimen diameter between two opposite punching points. For kth measure, “true” Chauchy stress and stretch ratio are, respectively, determined as:
where the true strains εTGk are determined via intrinsic moiré for each load applied to the tested specimen. Here, load history was divided into 10 steps, and, hence, the k counter varied from 1 to 11.
σTGk = λ1k·σengk
In the IM experiments, a cross-grating of 0.5 mm pitch was printed onto each specimen following indications provided in [34,63]. Grating was modulated as the specimen deformed under the applied load. Moiré patterns were obtained by digitally subtracting images of modulated grating at the various load levels selected for each biaxial test (to increase stability, images were recorded 1–2 min after having removed toroidal holder) from the reference image recorded for the unloaded state. A Dalsa CCD camera (1600 × 1360 pixels, 2/3″) with a Fujinon HF9HA-1B objective, lined up and focused on the sample center, was utilized in the IM experiments.
All moiré patterns recorded in this study were analyzed with the Holo Moiré Strain Analyzer™ (HMSA) Version 2.0 software (General Stress Optics Inc., Chicago, IL, USA). HMSA includes FFT, filtering, carrier modulation, fringe extension, edge detection and masking operations, quadrature, phase unwrapping, phase differentiation, removal of discontinuities, etc. In-plane displacement maps were obtained from Equation (11), setting the sensitivity Δsu,v = 0.5 mm, equal to the grating pitch. Spatial frequencies encoded in moiré patterns of u- and v-displacements were extracted from Fourier space. Strains εx and εy were directly computed by HMSA by differentiating phase maps.
For the values of MR constants a10 = 201.021 kPa and a01 = 13.201 kPa determined in [34], assuming that the rubber membrane was homogeneous, isotropic and incompressible (i.e., ν = 0.5), the equivalent Young’s modulus was EMR = 4(1 + 0.5)(201.021 + 13.201) = 1285.332 kPa. However, as mentioned before, the thickness of the tested membrane was found to vary over the whole specimen. Local variation of thickness may be amplified by the inflation process, which tends to stretch the membrane and reduce thickness as t = to/λθθ [64], where t and to, respectively, are the current and initial membrane thicknesses, and λθθ is the circumferential stretch ratio. For this reason, membrane thickness was measured along the six diameters corresponding to the 12 loading directions selected in the planar biaxial tests (see Figure 7c). The measurement points were located at 0, ±1/8, ±1/4, ±3/8, ±1/2, ±5/8, ±3/4, ±7/8 and ±1 of the nominal membrane radius; the “±” notation indicates pairs of symmetric locations about the center of the membrane. Thickness variations were randomly distributed over the surface, and no preferential direction of variation could be identified. Overall, thickness variations became more significant as the membrane diameter increased, ranging from 2.9% (for the smallest membrane of 25 mm diameter) to 14.8% (for the largest membrane of 125 mm diameter) of the 1 mm nominal thickness.
The system (32) was solved for the five membranes with diameters from 25 to 125 mm considered in the preliminary biaxial tests. For each diameter, two different sets of MR constants were determined by fitting the stresses developed for the εx or the εy strains; the corresponding values of equivalent Young’s modulus were, respectively, denoted as EMR(x) and EMR(y). The degree of mechanical anisotropy of each membrane was, hence, defined as βanis = EMR(x)/EMR(y). Interestingly, for each membrane, βanis practically coincided with the average ratio of thickness values measured along orthogonal diameters. In particular, for the 100 mm diameter membrane mechanically characterized via inflation test, βanis resulted equal to 1.127. The MR constants determined by fitting stress–strain curves of biaxial tests were consistent with the values reported in [34]: a10 = 203.702 ± 4.361 kPa and a01 = 13.623 ± 0.287 kPa vs. a10 = 201.021 kPa and a01 = 13.201 kPa, respectively.
4.3. Detailed Mechanical Characterization of the 100 mm Diameter Membrane
4.3.1. Measured Displacement Fields
As mentioned in Section 2.3, the 100 mm diameter natural rubber membrane was inflated at 1.07, 1.33, 1.60, 1.87 and 2.13 kPa. The one-shot moiré model described in Section 2.2 was implemented in MATLAB. Equations (6) and (8)–(10) were used for determining the deformed shape of the inflated rubber membrane at each pressure level. The v-displacements (u-displacements) of the membrane horizontal (vertical) diameter were initially assumed to be equal to 0; initial values of displacements were initially corrected by including information on thickness distribution gathered experimentally. However, the deformed shape of the membrane was precisely reconstructed by the proposed moiré model regardless of any assumption made on the values of displacement components.
The maximum u-displacements recorded by the present moiré setup for the different pressure levels were 0.542, 0.641, 0.769, 0.915 and 1.140 mm while the maximum v-displacements were 0.567, 0.674, 0.803, 0.961 and 1.167 mm; the corresponding out-of-plane displacements ranged between 6.047 and 13.932 mm. Figure 8 shows the map of the u-, v- and w-displacements for the maximum inflation pressure of 2.13 kPa.
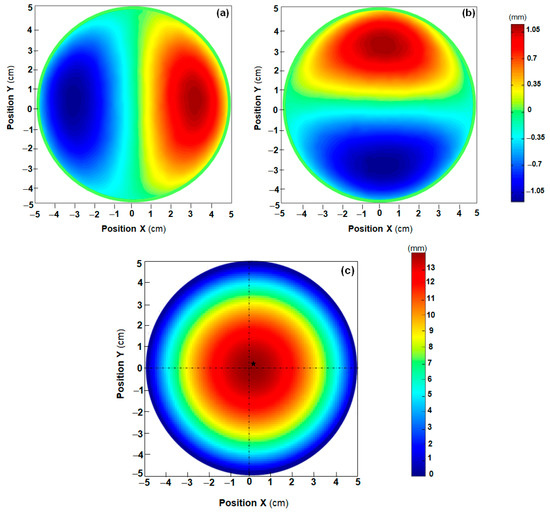
Figure 8.
Displacement maps obtained by the proposed one-shot projection moiré setup for the 100 mm diameter natural rubber membrane inflated at the maximum pressure of 2.13 kPa: (a) u-displacement; (b) v-displacement; and (c) w-displacement (with indication of nominal symmetry axes and position of maximum deformation point).
It can be seen that in-plane displacement patterns were symmetric enough with respect X- and Y-axes (see Figure 8a,b) although the actual thickness of the natural rubber membrane varied by about 14% along these directions. Figure 8c shows that contour maps of w-displacements are shaped as ellipses inclined with respect to horizontal (i.e., the X-axis) and vertical (i.e., the Y-axis) diameters of the membrane. The asymmetry of the out-of-plane displacement field of the inflated membrane is confirmed by the fact that the maximum w-deformation point (indicated by the star in Figure 8c) does not coincide with the center of the membrane (i.e., the intersection of x = 0 and y = 0 diameters).
As mentioned above, displacement components of the inflated membrane were also measured with the two-projectors, one-camera IMPM setup described in Section 2.3, a variant of the setup used in [34]. The in-plane displacements were determined referring to the 2 mm pitch dot grating printed on the specimen and then corrected including information on the slope of the deformed surface given by the modulation of projected vertical lines. Since the light source, layout, illumination angles and pitch of the gratings selected for the two-projectors, one-camera IMPM setup were the same as those used in the one-shot projection moiré measurements, the two optical setups obviously shared the same value of out-of-plane sensitivity.
Figure 9 compares the u- and v-displacement fields measured with the present one-shot projection moiré setup and the two-projectors, one-camera IMPM setup along two control paths corresponding to horizontal and vertical diameters of the inflated membrane (see insets of Figure 9). These diameters are parallel to the two sets of lines of the cross-gratings used by the one-shot proposed moiré setup. Furthermore, they are, respectively, orthogonal and parallel to the vertical lines projected by the IMPM setup. Although these specifications might seem obvious, it should be noted that the inflated membrane actually does not deform in an axially symmetric way because the thickness is not constant throughout the specimen. Thickness was measured along the 12 loading directions (corresponding to six diameters) selected in the preliminary in-plane testing (see Section 4.2). However, each pair of orthogonal diameters may present a different mechanical response from the expected nominal behavior based on the amount of thickness variation. Selecting diameters that correspond to grating-lines directions makes it easier to extract displacement information from the moiré pattern. In fact, moiré fringes imaged by the sensor actually are projections of spatial functions u, v and w onto the sensor image plane whose local reference system is centered in the entrance pupil of the camera and coincides just with the global XYZ reference system where displacement components are expressed. This makes coordinate transformations unnecessary.
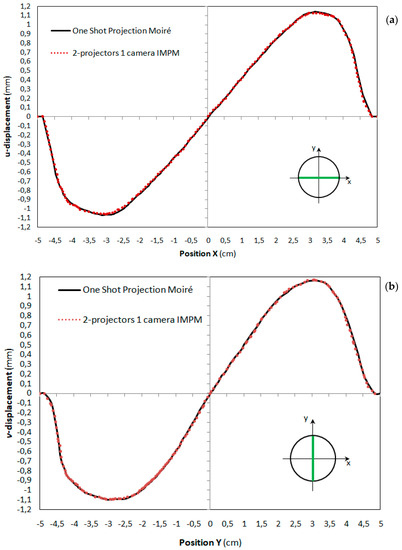
Figure 9.
Comparison of in-plane displacements obtained by the proposed one-shot projection moiré setup and the two-projectors, one-camera IMPM setup for the natural rubber membrane inflated at the maximum pressure of 2.13 kPa: (a) u-displacement; and (b) v-displacement.
Figure 9 shows that the two moiré setups obtained very similar results. The average difference between u-displacements determined with the present methodology and their counterpart obtained from IMPM was about 7.5% with a maximum value of about 12%. The most significant differences occurred near the constrained left side of the membrane (i.e., the part of the control path with x≤0), the center of the membrane and the regions experiencing the maximum deformation. A similar behavior was observed for v-displacements: an average difference of about 6.3% and a maximum difference of about 10% near the constrained bottom side of the membrane (i.e., the part of the control path with y ≤ 0), the membrane’s pole and the most deformed regions of the tested specimen.
As expected, the deformed shape taken by the inflated membrane was not perfectly symmetric with respect to the specimen’s center. In fact, along the horizontal diameter of the specimen, the u-displacement ranged from −1.069 mm at xm = −3.101 cm to 1.140 mm at xM = 3.171 cm. Furthermore, on the vertical diameter of the specimen, the v-displacement ranged from −1.099 mm at ym = −3.004 cm to 1.167 mm at yM = 3.086 cm. This effect was better captured by the one-shot projection moiré setup, which inherently accounts for the local curvature variations occurring for the deformed object. In fact, Figure 9 shows that the present moiré model correctly located u = 0 and v = 0 positions on corresponding horizontal and vertical control paths right at points with x > 0 and y > 0, consistently with the conditions xM > |xm| and yM > |ym| observed in the experiments.
The displacement curves plotted in Figure 9 appear somehow noisy, especially those relative to IMPM measurements. This may be due to the random variations in thickness occurring all over the membrane. In the processing of IMPM patterns, filter sizes were heuristically selected to try to predict the effect of thickness variations while the proposed one-shot projection moiré model inherently attempted to correct diametrical strains based on the observed thickness variations along all analyzed diameters.
Figure 10 compares the w-displacement distributions measured on horizontal and vertical diameters of the inflated specimen. Again, the results obtained by the two moiré approaches were rather similar. However, the two-projectors, one-camera IMPM setup underestimated the magnitude of out-of-plane deformations: w-displacement peak values measured by the two methods at the pole of the inflated membrane differed by about 2.3% while the difference on measured w-displacements rose to almost 5% near the constrained edge of the membrane. The lack of information on parallax in the Y-direction caused by the fact that only vertical lines were projected onto the inflated membrane did not allow IMPM to correctly differentiate phase distribution with respect to the y-coordinate when the surface’s slope and curvature components were determined.
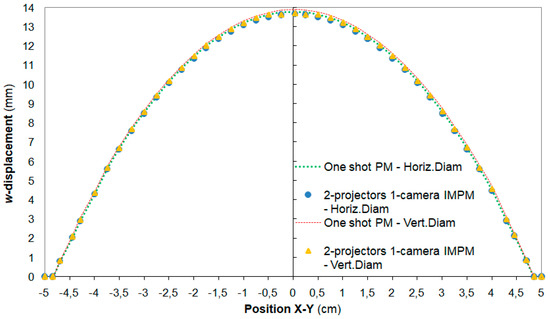
Figure 10.
Comparison of out-of-plane displacements obtained by the proposed one-shot projection moiré setup and the two-projectors, one-camera IMPM setup for the natural rubber membrane inflated at the maximum pressure of 2.13 kPa.
The out-of-plane displacement field was not symmetric about the pole of the inflated membrane. Both moiré methods correctly located the position (xw,max;yw,max) of the membrane point Pw,max with the maximum out-of-plane deformation. This point does not coincide with the center of the membrane: xw,max and yw,max coordinates are positive and almost equal to (xm + xM)/2 and (ym + yM)/2, respectively. This is consistent with the position indicated in Figure 8c for the maximum w-deformation point. Furthermore, the average difference between the w-displacements measured along the vertical and horizontal diameters of the specimen at each fixed distance from the pole of the membrane (this point corresponds to the origin of the reference system) is 2.795% (with a standard deviation of 0.181%) for the one-shot projection moiré technique and 1.355% (with a standard deviation of 0.0687%) for the two-projectors, one-camera IMPM technique. This confirms that the proposed one-shot projection moiré setup using cross-gratings can capture asymmetries in the membrane’s displacement field in a more effective way than a double illumination projection moiré projecting only vertical lines.
All displacement components increased slightly in magnitude passing from the left side (i.e., x < 0) to the right side (i.e., x > 0) of the horizontal diameter of the membrane and from the bottom side (i.e., y < 0) to the top side (i.e., y > 0) of the vertical diameter. Furthermore, measured displacements along the horizontal diameter control path were slightly smaller than their counterparts relative to vertical diameter. This is consistent with the in-plane tests results that indicated the membrane to be stiffer in the X-direction (see Section 4.2).
Interestingly, both the one-shot projection moiré proposed here and the two-projectors, one-camera IMPM obtained smoother distributions for out-of-plane displacements than for in-plane displacements. Such a behavior occurred for at least two reasons: (i) projection moiré techniques are inherently sensitive to w-displacements; and (ii) out-of-plane displacements undergone by the inflated membrane are much larger than the corresponding in-plane displacements.
4.3.2. Solution of the Inverse Problem: FE Analysis and Metaheuristic Optimization
The last step of the present study was to determine the hyperelastic constants and the stiffness distribution of the 100 mm diameter natural rubber membrane subjected to inflation. For this purpose, the inverse problem stated by Equation (1) was reformulated as:
If the membrane has homogeneous material properties and constant stiffness, the inverse problem (35) obviously includes only two variables, the MR constants a10 and a01. However, if mechanical properties and stiffness (strictly related to thickness) are not uniform, local values of MR parameters, and membrane thickness should be stored in the vectors and selected as design variables. In order to cover this general scenario, the membrane can be divided in the 108 sectors shown in the schematic of Figure 11, and the terns {a10,a01,t}s describing local properties of the generic sth sector may be included as design variables. Membrane subdivisions were strictly related to the locations where thickness was measured along the six diameters corresponding to the 12 loading directions of the preliminary in-plane equi-biaxal tests (i.e., 0, ±1/8, ±1/4, ±3/8, ±1/2, ±5/8, ±3/4, ±7/8 and ±1 of the radius, see Section 4.2). These locations correspond to the green dots sketched in Figure 11 (the loading directions of in-plane tests are schematized in the figure with etched lines): (i) the center of the membrane (i.e., the vertex common to the 12 inner triangular sectors of the membrane schematization, numbered from 1 to 12); (ii) the centers of 84 quadrilateral sectors located from ± 1/8 to ± 7/8 of the membrane radius (sectors numbered from 13 to 96); and (iii) 12 points on the external boundary of the membrane (sectors numbered from 97 to 108). The radial dimension of the 12 inner sectors and the 12 outer sectors is half of the radial dimension of the remaining 84 sectors. In summary, sectors are centered or symmetric about thickness measurement points.
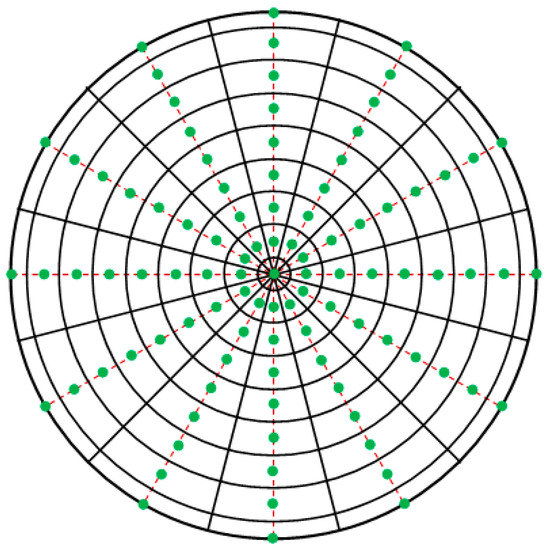
Figure 11.
Sectors defined in the solution of the inverse mechanical characterization problem for the 100 mm diameter natural rubber membrane.
Three variants of the inverse problem (35) were considered. The first variant corresponds to the most general formulation including a total of 324 (i.e., 108 × 3) design variables. The second variant is a simpler problem formulation with only 110 design variables: 2 unknown MR parameters and 108 unknown thickness values. The last variant of the inverse problem solved here assumes the measured thickness distribution and hence includes only two unknown MR parameters as design variables.
Additional constraints (e.g., positive definiteness of tangential material stiffness) ensured stability of nonlinear material. The lower bounds of hyperelastic constants were 100 kPa for a10 and 1 kPa for a10, while upper bounds were 1 MPa and 200 kPa, respectively. Thickness could vary between 0.9tto and 1.1tto (tto = 1 mm is the nominal thickness of the membrane), a slightly larger range than the one observed experimentally.
The measured total displacements of the inflated membrane = were compared with those computed by an FE model simulating the inflation test. Measured displacements and computed displacements were compared at NCNT control points, and the former quantities were the target of the optimization process because moiré data are gathered without knowing material/structural parameters a priori. Conversely, hyperelastic constants were given in input to the FE solver to compute displacements; moiré data and numerical results match only if true MR constants are given in input to FE model.
As mentioned in Section 4.1, the natural rubber membrane specimen characterized in this study has a diameter of 100 mm, 2.5 times larger than the 40 mm diameter analyzed in [34]. To account for the significantly lower stiffness of the present specimen and to deform the inflated membrane in the nonlinear regime without affecting its structural integrity, inflation pressure was reduced to 2.07 kPa from the 15.25 kPa of [34]. Interestingly, the maximum in-plane deformations measured in the present case (i.e., umax = 1.140 mm and vmax = 1.167 mm) practically coincided with the umax = vmax = 1.1 mm value (axi-symmetric deformation) reported in [34] for the 40 mm diameter membrane; maximum deformations occurred near (based on thickness variations as highlighted in Section 4.2) or precisely (in the case of axi-symmetric deformation) at ± 0.6R independent of diameter size. However, the maximum out-of-plane deformation of the 100 mm diameter membrane increased to 13.932 mm from the 8.850 mm value measured in [34], in spite of the fact that the inflation pressure was reduced by 7.5 times. The total displacement of the inflated membrane was driven by the out-of-plane component w, which became more and more predominant as bending stiffness decreased, such as occurred passing from the 40 mm to the 100 diameter membrane. However, including also the u- and v-displacements in the definition of the error functional Ω allowed us to test the robustness of the metaheuristic algorithm used for solving the inverse problem (35).
The ANSYS® 2022 R2 Student general purpose FE code developed by ANSYS Inc. (Canonsburg, PA, USA) was utilized in this study; the Student version was selected in order to prove implementation easiness of proposed framework. Figure 12a shows the FE model of natural rubber membrane used in the inverse problem (35). The mesh included 3072 4-node SHELL181 hyperelastic elements with 3137 nodes; convergence analysis was performed to obtain mesh-independent solutions. The pressure load acting on the membrane and the kinematic constraints on the membrane’s circular edge also are indicated in Figure 12b. The nonlinear FE analysis option was selected by switching on the NLGEOM command to account for the large deformations caused by inflation. ANSYS® adaptively increased the load up to the 2.13 kPa applied pressure with the automatic time-stepping option based on the convergence history of the FE solution.
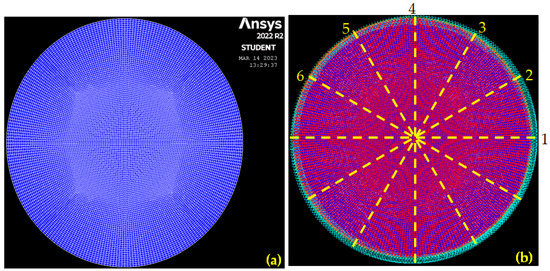
Figure 12.
FE model of the 100 mm diameter natural rubber membrane: (a) mesh; and (b) loads and kinematic constraints. The six control paths (corresponding to in-plane loading directions) including thickness measurement locations also are sketched in the figure.
The optimization problem (35) was solved with the HS–JAYA metaheuristic algorithm described in Section 3. The error functional was computed as Ω = Ω1.07kPa + Ω1.33kPa + Ω1.60kPa + Ω1.87kPa + Ω2.13kPa, summing over the values of Ω for each pressure level. Experimental data and numerical results were compared along the six control paths indicated in Figure 12b. These control paths coincided with the loading directions selected in the planar equi-biaxial tests. A total of NCNT = 769 control points were considered, sampling each control path in 128 points, i.e., an eight-times-higher sampling frequency than the one selected for thickness measurements. Since the chosen element size for the ANSYS® model was 10 times larger than the pixel size of the recorded images, it was easy to match nodes of the FE model with the image pixels of moiré patterns. The error functional Ω thus defined with Equation (35) was well posed, avoiding bias phenomena that may propagate errors in the minimization process of error functional even when target quantities are derived from synthetic patterns (see, for example, the very recent study [65] that analyzed performance of a FEMU approach operating on DIC strains).
Three population sizes, comprising, respectively, 20, 250 and 500 candidate designs, were selected for performing metaheuristic optimizations relative to the first two variants of the inverse problem described above: hence, the NPOP/NDV ratio ranged from0.0617 to 1.543 for the first problem variant with 324 design variables, and from 0.182 to 4.545 for the second problem variant with 110 design variables. For the third problem variant including only two design variables, population size was 5, 10 or 20: the NPOP/NDV ratio hence ranged from 2.5 to 10. This was conducted to verify the insensitivity of HS–JAYA convergence behavior to the size and composition of the initial population and, in summary, to confirm the parameter-free nature of the metaheuristic optimizer selected for this study.
The HS–JAYA optimization algorithm for solving the inverse problem (35) was implemented in the ANSYS® parametric language. The main code defined the problem constraints (including design variables bounds) and perturbed material/stiffness properties of the membrane following the steps of HS–JAYA formulation. Each time a new trial combination of hyperelastic constants and thicknesses was defined, the main code prompted ANSYS® to create the new FE model of the membrane and perform structural analysis. In post-processing, computed displacements were compared with target values to evaluate error functional Ω. The new trial design was accepted/updated/rejected based on its quality as described in Section 3. The optimization process was terminated when the error functional and design vector varied by less than 0.0001 in two subsequent iterations.
In order to account for the metaheuristic nature of HS–JAYA, each optimization run was repeated 20 times starting from various randomly generated populations. Equation (14) was used to generate initial populations covering the whole design space. However, the following cases were also considered in order to force HS–JAYA to start optimizations very far from target solution: (i) MR parameters and membrane thicknesses close to their upper bounds; (ii) MR parameters and membrane thicknesses close to their lower bounds; (iii) MR parameters close to their lower bounds and membrane thicknesses close to their upper bounds; and (iv) MR parameters close to their upper bounds and membrane thicknesses close to their lower bounds. The final solution given in output by HS–JAYA was averaged over those obtained in the independent runs. Interestingly, standard deviations of identified material properties and stiffness distribution over the different optimization runs always were less than 1.1% for all problem variants regardless of population size, thus confirming the robustness of the HS–JAYA algorithm selected in this study for solving the inverse problem (35).
All computations were performed on a Toshiba Satellite L50-B-24C portable computer with an Intel® CoreTM i7-5500 CPU and 8 GB of RAM memory in the Windows 10 environment. Evaluations of error functional for the inverse problem solution counted for more than 95% of the total computation time because of the nonlinearity of the structural analyses. One complete evaluation of error functional Ω for a trial solution required on average 14.5 s, a reasonable time considering that each value of Ω elaborated by HS–JAYA was obtained by summing over the five values Ω1.07kPa, Ω1.33kPa, Ω1.60kPa, Ω1.87kPa and Ω2.13kPa resulting from structural analyses relative to each pressure level. The construction of the FE model in ANSYS® including geometric modeling, meshing, definition of loading/boundary conditions and setting of solution/post-processing options took about 1.5 s of CPU time.
Before solving the three variants of the identification problem (35) considered here, the computational efficiency of the HS–JAYA algorithm was preliminarily evaluated by solving the most complicated test case of [27], the mechanical characterization of a bovine pericardium patch (BPP), modeled as a transversely isotropic hyperelastic material. The BPP identification problem included 17 unknowns: 16 hyperelastic constants (a1, a2, a3, b1, b2, b3 for matrix; c2, c3, c4, c5, c6, d2, d3, d4, d5 and d6 for fibers) and the fiber orientation angle θ. In order to draw general conclusions, HS–JAYA was compared with many other metaheuristic algorithms including variants of simulated annealing (SA), harmony search (HS) and big bang–big crunch (BBBC), JAYA with approximate line search (relying todifferent extents on error functional gradient information even obtained via finite differences) and elitist strategies. Those variants had in turn outperformed many other metaheuristic algorithms as it is documented in [27]. Standard GA and PSO implementations enhanced by a hill-climbing strategy were also tested in the BPP problem in order to have some comparison with MAs algorithms [57,58]. On average, HS–JAYA identified material properties of BPP (only 0.25% error on target values) within about only 1100 analyses vs. 1220–1370 analyses required by the other algorithms. GA and PSO enhanced by a hill-climbing strategy did not perform well: error on target material properties still was 0.5% after 1500 analyses. The worst solution of HS–JAYA always was better than the best solutions of all other algorithms in terms of lower errors on target material properties and displacements. Population size selected for HS–JAYA optimizations was only 20 vs. the 30 to 90 population sizes used in [27]. These results confirmed with no shadow of doubt the high efficiency of the proposed HS–JAYA algorithm and justified its use for solving the identification problem (35).
All optimizations carried out by HS–JAYA for problem variants 1 and 2 were always completed within (i) 1500 evaluations of the error functional Ω for the very large population NPOP = 500, (ii) 700 evaluations of Ω for the intermediate size population NPOP = 250, and (iii) 200 evaluations of Ω for the very small population NPOP = 20. HS–JAYA always completed the optimization runs entailed by problem variant 3 within 100 evaluations of Ω. HS–JAYA always found optimum solutions within 20 design iterations for all variants of the identification problem (35) regardless of population size. The present algorithm was also very robust: in fact, the ratio of standard deviation on number of analyses to the average number of analyses required by HS–JAYA in the independent optimization runs never exceeded 2%. Time complexity was not a relevant issue for HS–JAYA; evaluation of error cost functional Ω always took almost 80% of total computation time regardless of the number of optimization variables and population size.
HS–JAYA outperformed the above-mentioned algorithms of [27] and the GA/PSO algorithms with hill-climbing strategy also in the natural rubber membrane identification problem considered in this study. In order to have a rigorous comparison, all optimization runs performed for HS–JAYA were also performed for population-based algorithms (i.e., HS, BBBC, JAYA, hill-climbing-enhanced GA/PSO algorithms) starting from the same initial populations; in the case of SA (a single-point algorithm), three optimizations were performed for each initial population of HS–JAYA, taking as initial points for SA the XOPT or XWORST or Xaver designs that, respectively, correspond to the best, worst and average solutions stored in HS–JAYA’s population. Whilst HS–JAYA’s competitors practically converged to the same material properties and thickness distributions found by the present algorithm (the largest difference from material/thickness parameters identified by HS–JAYA was 3.9%; the largest residual error on experimentally measured displacement components was 6.3%) regardless of NDV and NPOP, their computational costs were significantly higher than for the present algorithm. In particular, JAYA required on average 15% more analyses than HS–JAYA to complete the optimization process; HS and BBBC required on average between 23% and 26% more analyses than HS–JAYA; and SA required on average 35% more analyses than HS–JAYA. Hill-climbing-enhanced GA/PSO algorithms required on average between 50 and 70% more analyses than HS–JAYA; such a behavior was, however, expected because these algorithms included a much lower amount of elitism than the present algorithm in the transition from exploration to exploitation phases.
The 100 analyses’ computational cost of HS–JAYA recorded for problem variant 3 was comparable with the 225 to 300 analyses computational costs reported in [66] for identification problems regarding the two-parameter Mooney–Rivlin model and the three-parameter Yeoh model. However, the number of error functional evaluations entailed by the optimization process does not seem to be a critical issue in the hyperelastic materials identification literature, and such information was not very often provided in technical papers [66,67,68,69,70,71,72,73,74,75,76,77,78,79,80,81,82,83,84,85,86]. Nevertheless, the selected implementations of some metaheuristic algorithms (e.g., particle swarm optimization used in [67], standard simulated annealing used in [83] and evolution strategies used in [85,86]) inherently entailed a huge number of finite element analyses (i.e., 10,000 for [67], about 10,000 for [83] and 30,000 to 170,000 for [85,86]) to solve the identification problem.
Table 1 summarizes the main results obtained in the identification problem (35) of the natural rubber membrane. The table presents the average minimum, average maximum and corresponding standard deviations of MR parameters and thickness values identified by HS–JAYA for the three problem variants solved with different population sizes.

Table 1.
Results of identification problem variants 1, 2 and 3 solved by HS–JAYA.
In problem variant 1, the values of MR constants identified by HS–JAYA ranged from 190 to 215 kPa for a10 and from 12.5 to 14 kPa for a01. Hence, the equivalent Young modulus EMR = 4(1 + ν)(a10 + a01) of the membrane ranged from 1215 kPa to 1375 kPa with a 13.2% variation, which is fully consistent with the degree of anisotropy of 1.127 found in the preliminary in-plane equi-biaxial test (see Section 4.2). The MR constants identified for problem variants 2 and 3 are very similar (on average, only 0.55% and 0.94% difference on a10 and a01, respectively) and practically correspond to the average of maximum and minimum values of hyperelastic constants identified by HS–JAYA for problem variant 1.
Figure 13 shows the average distribution (averaged over the 20 independent optimization runs performed for each population size) of the equivalent Young modulus EMR determined by HS–JAYA for the 100 mm diameter natural rubber membrane in problem variant 1. The figure also shows the directions (1) through (6) containing the control paths along which moiré data were compared with finite element simulations and specimen thickness was measured. Interestingly, the HS–JAYA results indicate that the equivalent Young modulus is not constant along any of the control directions and, above all, values of Young modus of each couple of orthogonal directions (i.e., (1)–(4), (2)–(5) and (3)–(6)) are in a different ratio. For example, it holds that EMR(1−)/EMR(4+) = 1.2, EMR(2−)/EMR(5−) = 1.05 and EMR(3+)/EMR(6−) = 0.92 where the “−” sign denotes the direction part with at least one negative coordinate x or y. This confirms the non-isotropic mechanical response of the tested specimen.
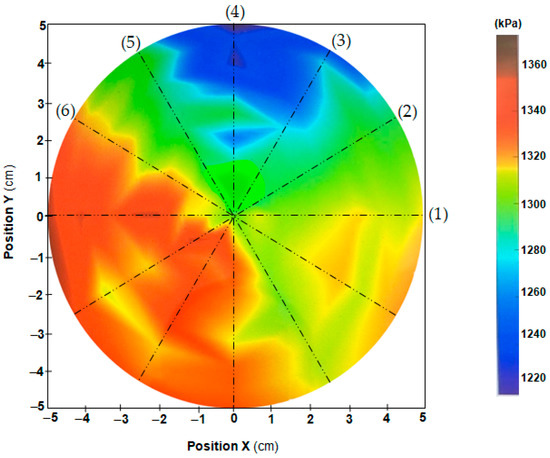
Figure 13.
Distribution of equivalent Young modulus EMR = 4(1 + ν)(a10 + a01) averaged over the independent optimization runs of problem variant 1.
Thickness distributions identified by HS–JAYA for variants 1 and 2 of the inverse problem (35) including the 108 local thickness values as optimization variables also were consistent with experimental measurements. Figure 14a shows the measured thickness distribution for the 100 mm diameter membrane. The measured maximum and minimum thickness values were, respectively, 1.073 mm and 0.930 m, while the standard deviation of the measured values with respect to the 1 mm nominal thickness was 0.0051 mm (i.e., about 0.55% of minimum thickness measured experimentally). Thickness distribution is consistent with observed displacements (Figure 8, Figure 9 and Figure 10): the membrane is stiffer in the x<0 and y<0 regions, which leads to larger deformations in the rest of the specimen. Further evidence of this can be gathered from the distribution of equivalent Young modulus EMR of Figure 13: elastic parameters are larger especially in the (x,y) < 0 region.
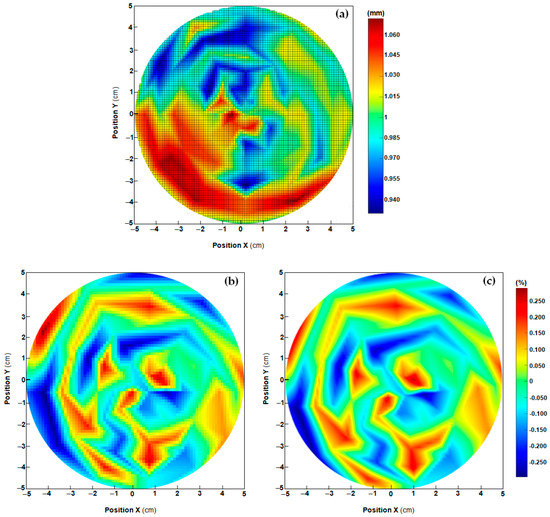
Figure 14.
(a) Thickness distribution measured for the 100 mm diameter membrane; (b) distribution of largest magnitude % error on identified thicknesses in problem variant 1 with respect to measured thickness values; and (c) distribution of largest magnitude % error on identified thicknesses in problem variant 2 with respect to measured thickness values.
Figure 14b and Figure 14c, respectively, show the percent errors on membrane thickness distributions identified by HS–JAYA in variants 1 and 2 of the inverse problem. For the tth generic membrane sector (see the schematic of Figure 11), percent error on identified thickness is defined as (tsidentified − tsmeasured)/tsmeasured. The largest magnitude errors (either positive or negative) are plotted in the figure. It can be seen from Figure 14 that errors on identified local thicknesses practically coincided for the two problem variants and always ranged between ±0.3%, almost three orders of magnitude less than measured values. Interestingly, the values of MR constants determined by HS–JAYA for problem variant 2 practically correspond to the average of the MR parameter distributions determined for problem variant 1. Hence, the HS–JAYA algorithm correctly identified the thickness variations over the whole membrane.
The statement made above was confirmed by the statistical analysis of HS–JAYA’s optimized solutions. Since 20 optimizations were performed for all problem variants starting from different initial populations, pairs of thickness distributions (each including the 108 thickness values identified by HS–JAYA) corresponding to the pth (p = 1, …, 20) optimization run carried out for variants 1 and 2 were compared in terms of mean and standard deviation. Interestingly, these two parameters always matched, indicating that all solutions obtained for variants 1 and 2 belong to the same population. The same result was obtained for all population sizes NPOP = 20, 250 or 500 worked out by HS–JAYA. Another statistical analysis investigated if any difference between thickness distributions could have been derived from the complexity of design space of problem variants 1 and 2 that, respectively, included 324 and 110 design variables. However, this scenario was excluded by running three Wilcoxon tests that found a very high correlation between all solutions within a level of confidence of 0.05. The Wilcoxon test gives a p-value stating whether a statistical difference is significant or not; the smaller the p-value is, the greater the difference between solutions will be. Here, the first Wilcoxon test compared two populations of 20 elements including the maximum (i.e., largest positive) errors on thickness recorded for problem variants 1 and 2. The second Wilcoxon test compared the two populations formed by minimum (i.e., largest negative) errors on thickness. The third Wilcoxon test compared two populations including median error values on thickness for problem variants 1 and 2. Remarkably, p-values always were much higher than 0.05, thus confirming that there is no statistical difference between solutions of problem variants 1 and 2. The same conclusion was reached for all population sizes NPOP = 20, 250 or 500 worked out by HS–JAYA.
Figure 15 shows the distribution of total displacements utot computed by ANSYS®: the plotted map is the average of the utot-displacement maps relative to the optimization runs performed for each combination of problem variant and population size.
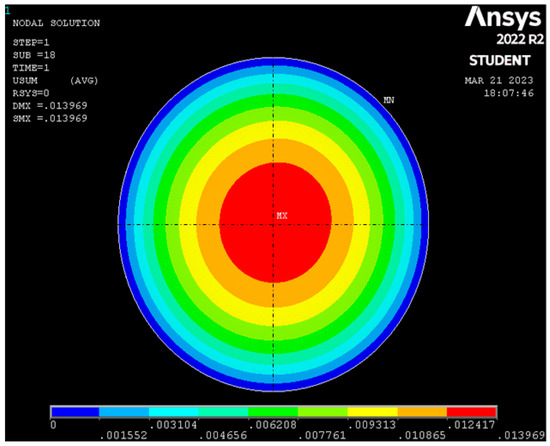
Figure 15.
Distribution of total displacements (utot) computed by ANSYS®: average for the different solutions of problem variants 1, 2 and 3.
As expected, the distribution shown in Figure 15 is very similar to the w-displacement (the dominating displacement) map measured experimentally (see Figure 8c). The point of maximum deformation does not coincide with the center of the membrane and lies in the x,y > 0 quadrant. Contours are not perfect circles but ellipses with the axes slightly rotated with respect to the X–Y reference system. The average magnitude of the largest total displacement computed by ANSYS® was 13.969 mm (see Figure 15), only 0.12% different from the experimentally measured value of 13.952 mm.
Figure 16 compares in detail displacements u, v and w measured by the one-shot projection moiré setup described in this study with those computed by ANSYS® in correspondence with the average optimized solutions for the three variants of the identification problem (35). In particular, Figure 16a refers to the u-displacements of the horizontal diameter of the membrane (i.e., control path 1 lying on the X-axis), while Figure 16b refers to the v-displacements of the vertical diameter of membrane (i.e., control path 4 lying on the Y-axis); furthermore, Figure 16c,d refer to w-displacements of control paths 1 and 4, respectively. Experimental data are represented by a double-sided line embedding the nine in-plane displacement distributions corresponding to the three problem variants solved with three different population sizes. Similar results were obtained for the other control paths sketched in Figure 12b and are not shown in this paper in order to save space.
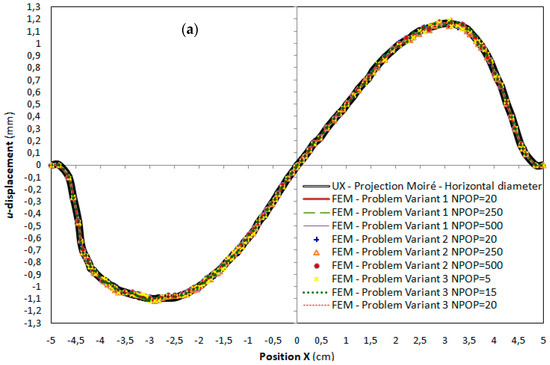
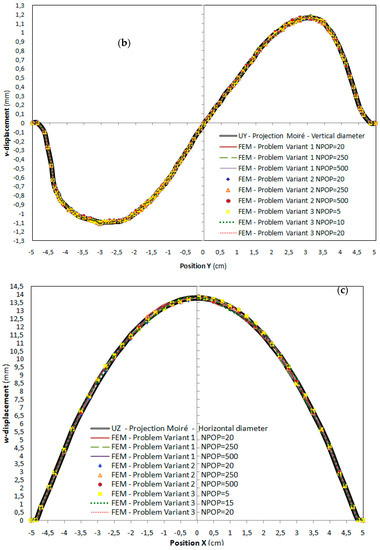
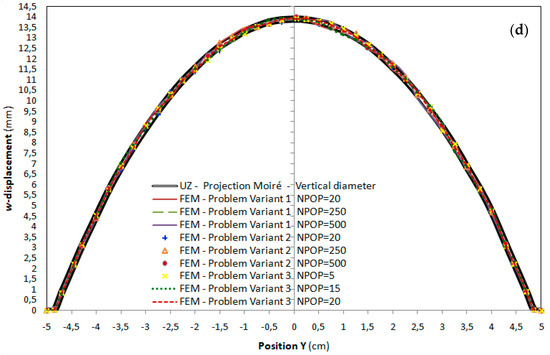
Figure 16.
Experimentally measured displacements vs. those computed by ANSYS® for the identified material/structural properties in the different variants of problem (35) solved in this study: (a) u-displacement (horizontal diameter, control path 1); (b) v-displacement (vertical diameter, control path 4); (c) w-displacement (horizontal diameter, control path 1); and (d) w-displacement (vertical diameter, control path 4).
The displacement distributions computed by ANSYS® present some oscillations as they were averaged over the 20 independent optimization runs performed for each combination of problem variant and population size. However, all trends of numerically reconstructed displacements practically show the same features. The highest residual errors on displacements were recorded for problem variant 3, which included only 2 MR constants as design variables: (i) for u-displacements, 1.883 ÷ 2% vs. only 1% of problem variant 1; (ii) for v-displacements, 1.806 ÷ 2.096% vs. only 1.060 ÷ 1.170% of problem variant 1; and (iii) for w-displacements, 2.436 ÷ 3.333% vs. only 1.25 ÷ 2% of problem variant 1. Overall, the largest error on total displacement never exceeded 2.5% for problem variant 1, 3.7% for problem variant 2 and 5.6% for problem variant 3. Maximum errors were distributed in a rather uniform way in the case of in-plane displacements. However, for out-of-plane displacements, maximum errors were localized either near the constrained membrane boundary or near the points where in-plane displacements reached their highest magnitude. This confirms the need for precisely matching the deformed position (x′,y′) of each pixel of the moiré pattern image with the out-of-plane displacement component w.
Interestingly, the maximum residual error on displacement components never went below 1% for all variants of the identification problem (35). In order to prove that this was due not to some weakness in the formulation of the HS–JAYA algorithm, the identification problem (35) was solved in silico by computing “synthetic” displacement fields for the average solution of each problem variant. Hence, the optimizer had to recover the numerically generated target displacement fields. Remarkably, HS–JAYA always converged to the target material/structural properties reproducing displacement fields within at most 0.023% residual error. The observed residual errors in the hybrid numerical–experimental identification process hence were fully consistent with the level of uncertainty normally entailed by FEMU-based characterization. Optically measured displacements represent a good target because PM accuracy may reach a very small fraction of the sensitivity of the experimental setup. Hence, results of the identification process documented in this study may be judged satisfactory.
Remarkably, HS–JAYA solved variants 1 and 2 of the identification problem including, respectively, 324 and 110 unknown material/structural parameters, a significantly larger number of unknowns than those usually reported in the literature for elastomers and rubberlike materials [66,67,68,69,70,71,72] (from two to six unknown material parameters or neural networks depending on three input characteristics), visco-hyperelastic materials [73,74,75] (from six to nine unknown material parameters including tangent modulus and softening index, Prony constants and relaxation times), biological tissues [76,77,78,79,80,81] (from five to sixteen unknowns accounting also for visco-elastic effects and stochastic variation of material properties), non-homogeneous hyperelastic structures [37,63,82,83,84] (from four to sixteen unknown material parameters for the global model, or two unknown material parameters for each local inverse problem at the element level) or anisotropic hyperelastic materials modeled with much more complicated constitutive equations [27,34,84,85,86] (from three to seventeen unknown material parameters). A very recent study by Borzeszkowski et al. [38] considered identification problems of nonlinear shells subject to various loading conditions (i.e., uniaxial tension, pure bending, sheet inflation and abdominal wall pressurization). Similar to the present study, thickness values were included as design variables in some test problems of [38]. However, target properties in [38] either were defined analytically or some level of noise was artificially added to the analytical fields. Target displacements and reaction force were hence computed by a finite element model and not measured experimentally. The number of design variables (including shear modulus of the neo-Hookean hyperelastic model and bending stiffness or shell-wall thickness) considered in the identification problems including artificial noise was at most 289, yet lower than the 324 variables considered in this study.
5. Conclusions and Future Work
This paper described a novel hybrid framework for mechanical characterization of soft hyperelastic membranes. The contribution of this study in terms of novelty was at least three-fold: (i) the characterization framework accounted for structural inhomogeneity and induced anisotropic response to symmetric loading; (ii) a novel one-shot projection moiré model able to recover the whole 3D displacement field of inflated membranes; and (iii) a fast, efficient, robust enhanced hybrid metaheuristic optimization algorithm for solving large-scale inverse problems.
The proposed framework combined biaxial tests (planar and inflation), one-shot projection moiré (with two symmetric projectors that project cross-gratings onto the inflated membrane), a mathematical model to extract 3D displacement information from moiré measurements and metaheuristic optimization. The deformation of the membrane was accurately measured by the moiré setup that exploited the connections between moiré and differential geometry. Metaheuristic optimization was performed with the HS–JAYA algorithm combining harmony search and JAYA methods. The HS–JAYA algorithm was inherently able to minimize the computational cost of the identification process as it always perturbed design moving along descent directions.
The characterization framework was successfully applied to a 100 mm diameter natural rubber membrane exhibiting non-isotropic mechanical response because thickness varied over the specimen. The two-parameter Mooney–Rivlin constitutive model was used for modeling the hyperelastic behavior of the tested membrane. Several variants of the identification problem including up to 324 unknown material properties (local values of MR constants) and local thickness values were solved by minimizing differences between measured total displacements and those computed by an FE model simulating the inflation test. The identified thickness distributions were highly correlated and fully consistent with the distribution measured experimentally. The values of hyperelastic constants determined by HS–JAYA combined very well into an equivalent Young’s modulus matching the level of anisotropy found from planar biaxial tests. The optimization process was very robust, and very little dispersion of solutions was seen.
Although the characterization framework was described in great detail in this article and provided satisfactory results, some aspects have to be further analyzed in future studies. First, the characterization of highly anisotropic hyperelastic materials should be considered. However, this issue should not be critical because the proposed projection moiré model does not rely on any assumption of the material’s constitutive behavior; complications derive for the most part from anisotropic hyperelasticity modeling that usually entails a huge number of material parameters. It should be noted that natural rubber follows an isotropic hyperelastic behavior as it is universally acknowledged in the technical literature. The present study obviously was not aimed at proving the contrary. The goal (fully accomplished) was instead to show how to account for any structural inhomogeneity (for example, thickness variations) that may lead to a globally non-isotropic mechanical response of the specimen/structure to be characterized.
The second aspect worthy of investigation is that the metaheuristic search engine may be further enhanced, considering the implications of the No-Free-Lunch theorem. For example, if material anisotropy is coupled to structural inhomogeneity, the number of design variables of the identification problem may exponentially increase and the number of search directions may become too large to be efficiently handled by a metaheuristic algorithm. However, HS–JAYA inherently employs elitist strategies in all steps of the search process, which enable the proposed algorithm to quickly converge to the optimum solution. Such an ability appears to be independent of problem size. Preliminary results obtained for a randomized version of the classical least square problem (the cost function of this problem is built by summing over the squares of differences between design variables and random numbers, thus resembling the definition of error functional Ω) including from 500 to 1000 design variables (i.e., from 1.5 to 3.1 times more than the 324 variables of problem variant 1) seem to confirm the above-mentioned assumption. However, an extensive campaign of numerical tests is currently being carried out to limit population size below 1/10 of the problem size for identification problems with hundreds of unknowns.
Last, other experimental arrangements may be considered besides the one-shot projection moiré optical setup proposed here: for example, the two projectors may be placed in the space so as to define two mutually orthogonal planes with the optical axis of the camera. Each projector may project a single system of lines (i.e., horizontal or vertical) and the two systems of projected lines may interact so as to generate a dot grating in correspondence with the specimen surface. The dot grating would still provide the curvature information necessary to recover the shape of the deformed specimen, but fringe processing may become easier.
Author Contributions
All authors contributed equally to all phases involved in the preparation of the article. All authors have read and agreed to the published version of the manuscript.
Funding
This research received no external funding.
Institutional Review Board Statement
Not applicable.
Informed Consent Statement
Not applicable.
Data Availability Statement
Data on experimental tests and numerical optimization available upon request.
Acknowledgments
Conflicts of Interest
The authors declare no conflict of interest.
References
- Kavanagh, K.T.; Clough, R.W. Finite element applications in the characterization of elastic solids. Int. J. Solids Struct. 1971, 7, 11–23. [Google Scholar] [CrossRef]
- Marwala, T. Finite-Element Model Updating Using Computational Intelligence Techniques: Applications to Structural Dynamics; Springer: New York, NY, USA, 2010. [Google Scholar]
- Bruno, L. Mechanical characterization of composite materials by optical techniques: A review. Opt. Lasers Eng. 2018, 104, 192–203. [Google Scholar] [CrossRef]
- Martins, J.M.P.; Andrade-Campos, A.; Thuillier, S. Comparison of inverse identification strategies for constitutive mechanical models using full-field measurements. Int. J. Mech. Sci. 2018, 145, 330–345. [Google Scholar] [CrossRef]
- Pierron, F.; Grediac, M. Towards Material Testing 2.0. A review of test design for identification of constitutive parameters from full-field measurements. Strain 2020, 57, e12370. [Google Scholar] [CrossRef]
- Pierron, F.; Grediac, M. The Virtual Fields Method. Extracting Constitutive Mechanical Parameters from Full-Field Deformation Measurements; Springer: New York, NY, USA, 2012. [Google Scholar]
- Maier, G.; Giannessi, F.; Nappi, A. Identification of yield limits by mathematical programming. Eng. Struct. 1982, 4, 86–98. [Google Scholar] [CrossRef]
- Bittanti, S.; Maier, G.; Nappi, A. Inverse problems in structural elasto-plasticity: A Kalman filter approach. In Plasticity Today; Sawczuk, A., Bianchi, G., Eds.; Elsevier: London, UK, 1983; pp. 311–329. [Google Scholar]
- Bolzon, G.; Maier, G.; Panico, M. Material model calibration by indentation, imprint mapping and inverse analysis. Int. J. Solids Struct. 2004, 41, 2957–2975. [Google Scholar] [CrossRef]
- Bolzon, G.; Buljak, V.; Maier, G.; Miller, B. Assessment of elastic–plastic material parameters comparatively by three procedures based on indentation test and inverse analysis. Inverse Probl. Sci. Eng. 2011, 19, 815–837. [Google Scholar] [CrossRef]
- Buljak, V.; Bocciarelli, M.; Maier, G. Mechanical characterization of anisotropic elasto-plastic materials by indentation curves only. Meccanica 2014, 49, 1587–1599. [Google Scholar] [CrossRef]
- Buljak, V.; Cocchetti, G.; Cornaggia, A.; Maier, G. Parameter identification in elastoplastic material models by Small Punch Tests and inverse analysis with model reduction. Meccanica 2018, 53, 3815–3829. [Google Scholar] [CrossRef]
- Fedele, R.; Maier, G.; Whelan, M. Stochastic calibration of local constitutive models through measurements at the macroscale in heterogeneous media. Comput. Methods Appl. Mech. Eng. 2006, 195, 4971–4990. [Google Scholar] [CrossRef]
- Bocciarelli, M.; Bolzon, G.; Maier, G. A constitutive model of metal–ceramic functionally graded material behavior: Formulation and parameter identification. Comput. Mater. Sci. 2008, 43, 16–26. [Google Scholar] [CrossRef]
- Bocciarelli, M.; Maier, G. Indentation and imprint mapping method for identification of residual stresses. Comput. Mater. Sci. 2007, 39, 381–392. [Google Scholar] [CrossRef]
- Fedele, R.; Filippini, M.; Maier, G. Constitutive model calibration for railway wheel steel through tension–torsion tests. Comput. Struct. 2005, 83, 1005–1020. [Google Scholar] [CrossRef]
- Maier, G.; Bocciarelli, M.; Bolzon, G.; Fedele, R. Inverse analyses in fracture mechanics. Int. J. Fract. 2006, 138, 47–73. [Google Scholar] [CrossRef]
- Maier, G.; Buljak, V.; Garbowski, T.; Cocchetti, G.; Novat, G. Mechanical characterization of materials and diagnosis of structures by inverse analyses: Some innovative procedures and applications. Int. J. Comput. Methods 2014, 11, 1343002. [Google Scholar] [CrossRef]
- Ageno, M.; Bolzon, G.; Maier, G. An inverse analysis procedure for the material parameter identification of elastic–plastic free-standing foils. Struct. Multidiscip. Optim. 2009, 38, 229–243. [Google Scholar] [CrossRef]
- Garbowski, T.; Maier, G.; Novati, G. On calibration of orthotropic elastic-plastic constitutive models for paper foils by biaxial tests and inverse analyses. Struct. Multidiscip. Optim. 2012, 46, 111–128. [Google Scholar] [CrossRef]
- Cocchetti, G.; Mahini, M.R.; Maier, G. Mechanical characterization of foils with compression in their planes. Mech. Adv. Mater. Struct. 2014, 21, 853–870. [Google Scholar] [CrossRef]
- Gajewski, T.; Garbowski, T. Calibration of concrete parameters based on digital image correlation and inverse analysis. Arch. Civ. Mech. Eng. 2014, 14, 170–180. [Google Scholar] [CrossRef]
- Chuda-Kowalska, M.; Gajewski, T.; Garbowski, T. Mechanical characterization of orthotropic elastic parameters of a foam by the mixed experimental-numerical analysis. J. Theor. Appl. Mech. 2015, 53, 383–394. [Google Scholar] [CrossRef]
- Buljak, V. Inverse Analyses with Model Reduction: Proper Orthogonal Decomposition in Structural Mechanics; Springer: Berlin/Heidelberg, Germany, 2012. [Google Scholar]
- Wolpert, D.H.; Macready, W.G. No Free Lunch Theorems for optimization. IEEE Trans. Evol. Comput. 1997, 1, 67–82. [Google Scholar] [CrossRef]
- Ho, Y.C.; Pepyne, D.L. Simple explanation of the No-Free-Lunch Theorem and its implications. J. Optim. Theory Appl. 2002, 115, 549–570. [Google Scholar] [CrossRef]
- Ficarella, E.; Lamberti, L.; Degertekin, S.O. Mechanical identification of materials and structures with optical methods and metaheuristic optimization. Materials 2019, 12, 2133. [Google Scholar] [CrossRef] [PubMed]
- Gallet, A.; Rigby, S.; Tallman, T.N.; Kong, X.; Hajirasouliha, A.; Liew, A.; Liu, D.; Chen, L.; Hauptmann, A.; Smyl, D. Structural engineering from an inverse problem perspective. Proc. R. Soc. A 2022, 478, 20210526. [Google Scholar] [CrossRef]
- Mansouri, M.R.; Darijani, H.; Baghani, M. On the correlation of FEM and experiments for hyperelastic elastomers. Exp. Mech. 2017, 57, 195–206. [Google Scholar] [CrossRef]
- Sciammarella, C.A. Overview of optical techniques that measure displacements. Murray Lecture. Exp. Mec. 2003, 43, 1–19. [Google Scholar] [CrossRef]
- Sciammarella, C.A.; Sciammarella, F.M. Experimental Mechanics of Solids; Wiley: Chichester, UK, 2012. [Google Scholar]
- Sciammarella, C.A. A review: Optical methods that measure displacement. In Advancement of Optical Methods & Digital Image Correlation in Experimental Mechanics, Proceedings of the 2018 Annual Conference on Experimental and Applied Mechanics; Lamberti, L., Furlong, C., Lin, M.T., Sciammarella, C.A., Reu, P.L., Sutton, M.A., Eds.; Springer: New York, NY, USA, 2019; Volume 3, Chapter 3; pp. 23–52. [Google Scholar]
- Cloud, G.L. Optical Methods of Engineering Analysis; Cambridge University Press: New York, NY, USA, 1998. [Google Scholar]
- Cosola, E.; Genovese, K.; Lamberti, L.; Pappalettere, C. A general framework for identification of hyper-elastic membranes with moiré techniques and multi-point simulated annealing. Int. J. Solids Struct. 2008, 45, 6074–6099. [Google Scholar] [CrossRef]
- Sciammarella, C.A.; Lamberti, L.; Boccaccio, A. General model for moiré contouring, part 1: Theory. Opt. Eng. 2008, 47, 033605. [Google Scholar] [CrossRef]
- Sciammarella, C.A.; Lamberti, L.; Boccaccio, A.; Cosola, E.; Posa, D. General model for moiré contouring, part 2: Applications. Opt. Eng. 2008, 47, 033606. [Google Scholar] [CrossRef]
- Elouneg, A.; Sutula, D.; Chambert, J.; Lejeune, A.; Bordas, S.P.A.; Jacquet, E. An open-source FEniCS-based framework for hyperelastic parameter estimation from noisy full-field data: Application to heterogeneous soft tissues. Comput. Struct. 2021, 255, 106620. [Google Scholar] [CrossRef]
- Borzeszkowski, B.; Lubowiecka, I.; Sauer, R.A. Nonlinear material identification of heterogeneous isogeometric Kirchhoff–Love shells. Comput. Methods Appl. Mech. Eng. 2022, 390, 114442. [Google Scholar] [CrossRef]
- Wineman, A.; Wilson, D.; Melvin, J.W. Material identification of soft tissue using membrane inflation. J. Biomech. 1979, 12, 841–850. [Google Scholar] [CrossRef] [PubMed]
- Sacks, M.S. Biaxial mechanical evaluation of planar biological materials. J. Elast. 2000, 61, 199–246. [Google Scholar] [CrossRef]
- Bersi, M.; Bellini, C.; Di Achille, P.; Humphrey, J.D.; Genovese, K.; Avril, S. Novel methodology for characterizing regional variations in material properties of murine aortas. J. Biomech. Eng. 2016, 138, 0710051–07100515. [Google Scholar] [CrossRef]
- Genovese, K. An omnidirectional DIC system for dynamic strain measurement on soft biological tissues and organs. Opt. Lasers Eng. 2019, 116, 6–18. [Google Scholar] [CrossRef]
- Wimmer, M.; Ertl, P.; Schneider, J.; Abraham, F. Equibiaxial tension testing of rubber on a universal tension-testing machine. In Constitutive Models for Rubber XI, 1st ed.; Huneau, B., Le Cam, J.B., Marco, Y., Verron, E., Eds.; CRC Press: London, UK, 2019; Chapter 7; pp. 1–7. [Google Scholar]
- Shabbir, S.; Satyanarayana, B.; Sreeramulu, K. Characterization of hyperelastic material by experimental tests and curve fitting. Mater. Today Proc. 2020, 24, 1670–1679. [Google Scholar] [CrossRef]
- Genovese, K.; Badel, P.; Cavinato, C.; Pierrat, B.; Bersi, M.R.; Avril, S.; Humphrey, J.D. Multi-view digital image correlation system for in vitro testing of arteries from mice to humans. Exp. Mech. 2021, 61, 1455–1472. [Google Scholar] [CrossRef]
- Pearce, D.; Nemcek, M.; Witzenburg, C. Combining unique planar biaxial testing with full-field thickness and displacement measurement for spatial characterization of soft tissues. Curr. Protoc. 2022, 2, e493. [Google Scholar] [CrossRef]
- Timoshenko, S.P.; Woinowsky-Kreiger, S. Theory of Plates and Shells; McGraw-Hill: New York, NY, USA, 1964. [Google Scholar]
- Niordson, F.I. Shell Theory; Elsevier: Amsterdam, The Netherlands, 2012. [Google Scholar]
- Mott, P.H.; Roland, C.M.; Hassan, S.E. Strains in an inflated rubber sheet. Rubber Chem. Technol. 2003, 76, 326–333. [Google Scholar] [CrossRef]
- Geem, Z.W.; Kim, J.H.; Loganathan, G. A new heuristic optimization algorithm: Harmony search. Simulation 2001, 76, 60–68. [Google Scholar] [CrossRef]
- Lee, K.S.; Geem, Z.W. A new meta-heuristic algorithm for continuous engineering optimization: Harmony search theory and practice. Comput. Methods Appl. Mech. Eng. 2005, 194, 3902–3933. [Google Scholar] [CrossRef]
- Rao, R.V. Jaya: A simple and new optimization algorithm for solving constrained and unconstrained optimization problems. Int. J. Ind. Eng. Comput. 2016, 7, 19–34. [Google Scholar]
- Carbas, S.; Saka, M.P. Optimum topology design of various geometrically nonlinear latticed domes using improved harmony search method. Struct. Multidiscip. Optim. 2012, 45, 377–399. [Google Scholar] [CrossRef]
- Degertekin, S.O.; Minooei, M.; Santoro, L.; Trentadue, B.; Lamberti, L. Large-scale truss-sizing optimization with enhanced hybrid HS algorithm. Appl. Sci. 2021, 11, 3270. [Google Scholar] [CrossRef]
- Fesanghary, M.; Mahdavi, M.; Minary-Jolandan, M.; Alizadeh, Y. Hybridizing harmony search algorithm with sequential quadratic programming for engineering optimization problems. Comput. Methods Appl. Mech. Eng. 2008, 197, 3080–3091. [Google Scholar] [CrossRef]
- Hwang, S.F.; He, R.S. Improving real-parameter genetic algorithm with simulated annealing for engineering problems. Adv. Eng. Softw. 2006, 37, 406–418. [Google Scholar] [CrossRef]
- Bao, Y.; Hu, Z.; Xiong, T. A PSO and pattern search based memetic algorithm for SVMs parameters optimization. Neurocomputing 2013, 117, 98–106. [Google Scholar] [CrossRef]
- Tahereh Abbasi-khazaei, T.; Rezvani, M.H. Energy-aware and carbon-efficient VM placement optimization in cloud datacenters using evolutionary computing methods. Soft Comput. 2022, 26, 9287–9322. [Google Scholar] [CrossRef]
- Mooney, M. A theory of large elastic deformation. J. Appl. Phys. 1940, 11, 582–592. [Google Scholar] [CrossRef]
- Rivlin, R.S. Large elastic deformations of isotropic materials. I. Fundamental concepts. Philos. Trans. R. Soc. Lond. A 1948, 240, 459–490. [Google Scholar]
- Rivlin, R.S. Large elastic deformations of isotropic materials. IV. Further developments of the general theory. Philos. Trans. R. Soc. Lond. A 1948, 241, 379–397. [Google Scholar]
- Ogden, R.W. Non-Linear Elastic Deformations; Dover: Mineola, NY, USA, 1997. [Google Scholar]
- Brunelli, R.; De Spirito, M.; Giancotti, A.; Palmieri, V.; Parasassi, T.; Di Mascio, D.; Flammini, G.; D’Ambrosio, V.; Monti, M.; Boccaccio, A.; et al. The biomechanics of the umbilical cord Wharton Jelly: Roles in hemodynamic proficiency and resistance to compression. J. Mech. Behav. Biomed. Mater. 2019, 100, 103377. [Google Scholar] [CrossRef] [PubMed]
- Javořik, J.; Dvořàk, Z. Equibiaxal test of elastomers. KGK Rubberpoint 2007, 608–610. [Google Scholar]
- Fayad, S.S.; Jones, E.M.C.; Seidl, D.T.; Reu, P.L.; Lambros, J. On the importance of direct-levelling for constitutive material model calibration using digital image correlation and finite element model updating. Exp. Mech. 2023, 63, 467–484. [Google Scholar] [CrossRef]
- Bastos, G.; Sales, L.; Di Cesare, N.; Tayeb, A.; Le Cam, J.B. Inverse-Pagerank-particle swarm optimisation for inverse identification of hyperelasticmodels: A feasibility study. J. Rubber Res. 2021, 24, 447–460. [Google Scholar] [CrossRef]
- Dya, T.; Blaise, B.B.; Betchewe, G.; Alidou, M. Implementation of particle swarm optimization algorithm in Matlab code for hyperelastic characterization. World J. Mech. 2021, 11, 146–163. [Google Scholar] [CrossRef]
- Kulcu, I.D. A hyperelastic constitutive model for rubber-like materials. Arch. Appl. Mech. 2020, 90, 615–622. [Google Scholar] [CrossRef]
- Bien-aimé, L.K.M.; Blaise, B.B.; Beda, T. Characterization of hyperelastic deformation behavior of rubber-like materials. SN Appl. Sci. 2020, 2, 648. [Google Scholar]
- Hou, J.; Lu, X.; Zhang, K.; Jing, Y.; Zhang, Z.; You, J.; Li, Q. Parameters identification of rubber-like hyperelastic material based on general regression neural network. Materials 2022, 15, 3776. [Google Scholar] [CrossRef]
- Yenigun, B.; Gkouti, E.; Barbaraci, G.; Czekanski, A. Identification of hyperelastic material parameters of elastomers by reverse engineering approach. Materials 2022, 15, 8810. [Google Scholar] [CrossRef]
- Yuan, Z.; Niu, M.-Q.; Ma, H.; Gao, T.; Zang, J.; Zhang, Y.; Chen, L.-Q. Predicting mechanical behaviors of rubber materials with artificial neural networks. Int. J. Mech. Sci. 2023, 249, 108265. [Google Scholar] [CrossRef]
- Tobajas, R.; Elduque, D.; Ibarz, E.; Javierre, C.; Canteli, A.F.; Gracia, L. Visco-hyperelastic model with damage for simulating cyclic thermoplastic elastomers behavior applied to an industrial component. Polymers 2018, 10, 668. [Google Scholar] [CrossRef]
- Tashiro, K.; Shobayashi, Y.; Ota, I.; Hotta, A. Finite element analysis of blood clots based on the nonlinear visco-hyperelastic model. Biophys. J. 2021, 120, 4547–4556. [Google Scholar] [CrossRef] [PubMed]
- Ficarella, E.; Minooei, M.; Santoro, L.; Toma, E.; Trentadue, B.; De Spirito, M.; Papi, M.; Pruncu, C.I.; Lamberti, L. Visco-hyperelastic characterization of the equine immature zona pellucida. Materials 2021, 14, 1223. [Google Scholar] [CrossRef] [PubMed]
- Mihai, L.A.; Chin, L.; Janmey, P.A.; Goriely, A. A comparison of hyperelastic constitutive models applicable to brain and fat tissues. J. R. Soc. Interface 2015, 12, 20150486. [Google Scholar] [CrossRef] [PubMed]
- Staber, B.; Guilleminot, J. Stochastic hyperelastic constitutive laws and identification procedure for soft biological tissues with intrinsic variability. J. Mech. Behav. Biomed. Mater. 2017, 65, 743–752. [Google Scholar] [CrossRef] [PubMed]
- Teferra, K.; Brewick, P.T. A Bayesian model calibration framework to evaluate brain tissue characterization experiments. Comput. Methods Appl. Mech. Eng. 2019, 357, 112604. [Google Scholar] [CrossRef]
- Estermann, S.J.; Pahr, D.H.; Reisinger, A. Hyperelastic and viscoelastic characterization of hepatic tissue under uniaxial tension in time and frequency domain. J. Mech. Behav. Biomed. Mater. 2020, 112, 104038. [Google Scholar] [CrossRef]
- Kenja, K.; Madireddy, S.; Vemaganti, K. Calibration of hyperelastic constitutive models: The role of boundary conditions, search algorithms, and experimental variability. Biomech. Model. Mechanobiol. 2020, 19, 1935–1952. [Google Scholar] [CrossRef]
- Dwivedi, K.K.; Lakhani, P.; Kumar, S.; Kumar, N. A hyperelastic model to capture the mechanical behaviour and histological aspects of the soft tissues. J. Mech. Behav. Biomed. Mater. 2022, 126, 105013. [Google Scholar] [CrossRef]
- Genovese, K.; Casaletto, L.; Humphrey, J.D.; Lu, J. Digital image correlation-based point-wise inverse characterization of heterogeneous material properties of gallbladder in vitro. Proc. R. Soc. A 2014, 470, 20140152. [Google Scholar] [CrossRef]
- Garcia, D.; Jones, M.E.; Zhu, Y.; Yu, H.Z. Mesoscale design of heterogeneous material systems in multi-material additive manufacturing. J. Mater. Res. 2018, 33, 58–67. [Google Scholar] [CrossRef]
- Deneweth, J.M.; Arruda, E.M.; McLean, S.G. Hyperelastic modeling of location-dependent human distal femoral cartilage mechanics. Int. J. Non Linear Mech. 2015, 68, 146–156. [Google Scholar] [CrossRef]
- Rivera, E.; Canales, C.; Pacheco, M.; García-Herrera, C.; Macías, D.; Celentano, D.J.; Herrera, E.A. Biomechanical characterization of the passive response of the thoracic aorta in chronic hypoxic newborn lambs using an evolutionary strategy. Sci. Rep. 2021, 11, 13875. [Google Scholar] [CrossRef]
- Canales, C.; García-Herrera, C.; Rivera, E.; Macías, D.; Celentano, D. Anisotropic hyperelastic material characterization: Stability criterion and inverse calibration with evolutionary strategies. Mathematics 2023, 11, 922. [Google Scholar] [CrossRef]
Disclaimer/Publisher’s Note: The statements, opinions and data contained in all publications are solely those of the individual author(s) and contributor(s) and not of MDPI and/or the editor(s). MDPI and/or the editor(s) disclaim responsibility for any injury to people or property resulting from any ideas, methods, instructions or products referred to in the content. |
© 2023 by the authors. Licensee MDPI, Basel, Switzerland. This article is an open access article distributed under the terms and conditions of the Creative Commons Attribution (CC BY) license (https://creativecommons.org/licenses/by/4.0/).

