Abstract
In the context of partial autonomy, where autonomous vehicles and humans share control of the vehicle, bringing out-of-the-loop drivers back into the loop is a significant challenge. While warning signal design guidelines are commonly used to provide alerts, few studies have examined each signal in depth with an emphasis on the autonomous environment. This study aims to fill this gap by investigating visual, auditory, and tactile stimuli and modifying their sub-attributes to explore variations related to age, gender, and other individual backgrounds. For this objective, the research examined the correlations between age, gender, and individual backgrounds with reaction times to TOR signals, investigating the effects of sub-attribute variations on participants’ responses and exploring the subjective evaluations of the signals. A driving simulator was utilized to create a realistic driving environment and measure participants’ reaction times in takeover request situations. Analysis of the data revealed correlations between age and reaction times for auditory and tactile signals, with interaction effects observed between age and sub-attribute intensity. Additionally, participants exhibited varying reaction time patterns in response to different sub-attribute intensities. By evaluating individual differences in perception based on modality characteristics, often overlooked in prior research, this study serves as a foundational contribution to future research in the field.
1. Introduction
In recent years, the interaction between autonomous driving and humans has been the subject of a great deal of research, with numerous studies conducted on the topic. The Society of Automotive Engineers (SAE) and the National Highway Traffic Safety Administration (NHTSA) have been continuously revising the interactions pertaining to the degree of automation in autonomous driving. Lee et al. emphasized the significance of safety, performance, and user satisfaction as critical criteria for ergonomic design and also suggested that the relative importance of various technologies may vary based on the stage of autonomous driving [1]. Safety is always the most essential factor, especially in the early stages of autonomous driving, because vehicle accidents directly affect human lives. However, as the use of autonomous vehicles as a service becomes more prevalent and fully autonomous driving becomes more ubiquitous, design satisfaction may also become a crucial factor.
Takeover request (TOR) is one of the most researched topics in autonomous driving, especially in stages 2 and 3 of the SAE standards, where the driver and the vehicle share driving responsibilities. Multiple subdomains of TOR research, including signaling time, modality, location, and error, are centered on system aspects, while mental models, situational awareness, and trust are centered on the human factor. On the basis of ergonomic research, the characteristics and effects of the three primary signaling modalities (visual, auditory, and tactile) have been extensively analyzed, and guidelines for selecting stimuli have been established.
In circumstances involving partial autonomy, the driver and vehicle must work together to complete the primary driving task. Different ages, levels of expertise, and personal histories result in distinct driving strategies and visual attention levels. In scenarios involving partially autonomous driving, it is crucial that the vehicle signal the human driver for a TOR and that the human driver recognize the signal promptly and accurately. To investigate whether an individual’s background affects signal perception, signaling guidelines in a traditional TOR scenario were reviewed, and an experiment was conducted to determine how individuals respond to and prefer various modalities. The research inquiries focused on determining the impact of gender, age, and other personal characteristics on responses to distinct signals. Specifically, one of the key research questions was whether reaction times and preferences change linearly or cascade as the detailed characteristics of each modality’s signal (e.g., pitch for auditory or amplitude for tactile) change.
In this study, existing signaling guidelines for traditional TOR scenarios were reviewed, and an experiment was conducted to examine individuals’ responses and preferences across different modalities. The focus was specifically placed on the influence of gender, age, and other personal characteristics on participants’ responses to distinct signals. By exploring the relationships between personal characteristics and TOR responses, the aim was to enhance the understanding of how these factors affect signal perception and provide guidance for the design of effective TOR systems. By addressing the research questions concerning the impact of personal characteristics on TOR responses and investigating the changes in reaction times and preferences with varying signal characteristics, valuable contributions were made to the existing knowledge in the field. These findings have the potential to inform the design and implementation of TOR systems in autonomous driving, leading to enhanced safety, performance, and user satisfaction.
2. Related Works
The study commenced with an examination of the characteristics of stimuli employed as TOR cues for each modality in prior research. This involved reviewing the existing literature on in-vehicle warning systems and analyzing the specific attributes of the stimuli. Furthermore, a review of the literature on individual differences in signal perception and driving was conducted, leading to the design and implementation of an experiment aimed at investigating potential variations in signal perception during TOR.
2.1. Warning Signal Design in Autonomous Vehicle
Warning signals can be implemented in a variety of ways within the context of autonomous vehicles in order to convey vital information to the driver or user. During manual driving, warning signals typically signify problems with vehicle systems or interactions with other vehicles or the surrounding environment. A collision warning may be activated, for instance, when the vehicle approaches the vehicle in front of it, when it deviates from its lane, or when a rear-view camera is used for parking. At Level 3 and higher, when the vehicle is partially capable of performing the entire driving task, alerts can be provided continuously to keep the driver notified of the driving situation. These alerts also prompt the driver to regain control when the system loses control of the vehicle. In a scenario of fully autonomous driving, where the vehicle handles the entire driving task and the human assumes the role of a service user, notifications can be used to indicate critical situations or to provide content-related alerts during service interactions. In-vehicle alerts are typically categorized as visual alerts displayed on instrument panels or screens, auditory alerts delivered via in-vehicle speaker devices, and tactile alerts conveyed via vibration pads affixed to the steering wheel or seat. Individuals may receive these notifications via a single stimulus or via a combination of multiple modalities, known as multimodal alerts.
Each modality of autonomous vehicle warning signals has its own advantages and disadvantages. Visual alerts can convey information through words or icons, displaying the alert’s content continuously [2]. Contrary to auditory and tactile alerts, visual alerts can manipulate salience through the use of hue, luminance, and size [1]. Auditory signals have the advantage of capturing immediate attention upon presentation. According to the multiple resource theory [3], auditory stimuli can be perceived with minimal interference to the manual driving task. Experimental research has shown that auditory stimuli elicit faster responses compared to visual stimuli, enabling quicker reactions to hazards [4]. Moreover, auditory alerts can provide better location information compared to tactile alerts [5,6]. In driving situations, visual and auditory tasks are frequently secondary tasks, making tactile sensations less susceptible to distracting drivers [7]. Unlike visual stimuli, tactile alerts can be physically stimulated, allowing for quicker attention switching [8]. According to previous studies, tactile stimuli are effective for forward collision warnings (FCWs) [9,10], and varying the intensity can convey meaningful degrees [11]. However, the dynamic characteristics of driving can influence the effectiveness of warnings. Perception can be difficult if a stimulus requires the use of the same sensory organs for distinct tasks. A visually prominent alert on the in-vehicle human–machine interface (HMI) may go unnoticed if the driver is focused on their phone or the road ahead. Similarly, it can be challenging to perceive an auditory alert while engaged in a phone conversation. When the road surface is unstable or when the vehicle’s vibrations are forceful, tactile alerts can be ignored. In addition, auditory alerts are dependent on time, so if one misses them, they must be repeated. If the working memory is engaged in a secondary task when a meaningful auditory signal, such as a word or sentence, is presented, the meaning of the auditory signal may not be comprehended due to limited cognitive resources [12]. Tactile notifications can provide stimulation, but it is more difficult to convey their meaning and orientation compared to auditory alerts [6]. Numerous studies have demonstrated the effectiveness of multimodal warnings in compensating for deficiencies and providing redundant information. Several studies have demonstrated that multimodal alerts decrease false positives [13,14]. However, it is essential to keep in mind that humans have a limited capacity to divide their attention between two sensory channels. When two signals are simultaneously presented to distinct sensory channels, one may be ignored [15]. While this is acceptable if all cues presented at the same time have the same meaning, people are more likely to remember only one if they convey distinct information. The ability to divide attention across multimodal displays declines with age [16]. Accordingly, extensive research has been conducted on the advantages and disadvantages of multimodality, based on the degree of autonomy and the presence of dual tasks.
Numerous guidelines for in-vehicle visual, auditory, and tactile stimuli have been devised based on existing signal guidelines from human factors research [17,18,19]. Researchers have performed quantitative analyses to investigate the effects of signals on the human perceptual system, providing both general guidelines (e.g., salience, discrimination) and specific values for their contexts [17,20]. Guidelines suggest that for visual display, the text should be at least 0.25 inches high [17]. Visual guidelines emphasize providing vital information in the driver’s central field of vision, utilizing colors that correspond to the severity of a hazard, and modulating luminance to match driving conditions [1,19]. Regarding auditory signals, various reports provide slightly divergent recommendations. Auditory tones should be approximately 15 to 30 dB above the masked threshold but should not exceed 115 to 120 dB in absolute amplitude [17,18]. The frequency range for sound should be between 100 and 4000 Hz, audible between 50 and 90 dB but not uncomfortable [17,18,19]. Ross et al. suggests signal durations between 100 and 500 ms [18]. A minimum of 80 dB in the 1–5 kHz frequency range has been suggested for audible warning signals [21]. In addition, it has been suggested that the duration of the warning should be shorter than the average response time expected. Another study found that a warning tone with a pulse rate greater than 6 Hz is perceived as more urgent than one with a pulse rate below 6 Hz [22]. Depending on the body part, tactile detection thresholds vary, with guidelines recommending that amplitudes be set at 15–20 dB above the detection threshold [23,24]. Amplitudes greater than 0.6–0.8 mm must be avoided, as they may induce a painful sensation. The frequency of the tactile signal should be between 150 and 300 Hz, and the burst duration should be between 50 and 200 ms, as prolonged vibrations can be irritating [24]. These guidelines serve as the foundation for vehicle–driver interaction research and as suggestions for in-vehicle information systems.
2.2. Takeover Request and Modality
In the context of manual driving, warning signals indicate the likelihood of a collision with another object, taking lateral and longitudinal coordinates into account. The specifics of the signals can substantially affect the reaction time of the driver. In a study conducted by Wogalter et al., the researchers manipulated factors such as signal loudness for auditory signals, signal amplitude for tactile signals, and signal size and luminance for visual signals in order to determine their effect on participants’ reaction times [20]. The study found a correlation between the frequency of tactile signals and the pitch of auditory signals and quicker reaction times [20]. Using this line of inquiry as a basis, Green et al. implemented a driving scenario involving participants and manipulated the warning signal characteristics to observe their responses [21]. Their findings have been extensively cited as a standard in subsequent research. Consequently, the majority of research on signaling for takeover requests in the context of partially autonomous driving has focused on comparing various modalities using predefined stimuli or investigating the effects of multimodality.
Research on the modality of the takeover request (TOR) can be broadly divided into three categories. First, research has investigated the effect of distinct modalities on human perception in TOR situations [25]. For example, professional drivers have shown that a combination of forward collision and lane change warnings is appropriate for commercial motor vehicles. However, they exhibited typically negative responses to the use of haptic presentation modalities for warnings [26]. The second area of study investigates individual differences in objective or subjective responses to TOR signaling. This can be accomplished via surveys and experiments. Younger adults responded to auditory and tactile stimuli in TOR situations faster than older adults, according to one study [27]. In some instances, however, older drivers demonstrated response times comparable to those of younger drivers [28]. In addition, research indicates that older drivers tend to focus more on the road and less on secondary tasks [29]. The third area of study focuses on cross-modality comparisons. Similar to the cross-modality comparisons conducted in manual driving [7,30], a number of studies [5,14,31,32] have investigated which modality is more effective at triggering driver responses during control transitions in partial autonomy. However, these studies occasionally produce contradictory results. Depending on variables such as secondary tasks or timing, some studies have found that tactile cues are more effective than auditory cues [31,32], while others have found the opposite [5,14].
Each study’s stimuli were generated by manipulating a number of variables, including pitch and loudness for auditory stimuli, amplitude and cycle for tactile stimuli, and luminance and size for visual stimuli. Such data are summarized in Table 1. An important question arises: Are differences in driver responses to stimuli across different modalities primarily influenced by the cognitive characteristics of individuals or by differences in stimulus characteristics? In the investigations of Mohebbi et al. and Murata et al., tactile cues were more effective than auditory cues [7,31]. However, according to studies of Geitner et al. and Gruden et al., auditory cues are superior to tactile cues [5,14]. Is this difference owing to the experiment’s context or purpose? Or, is it possible to achieve various outcomes by altering the stimuli within the same context? It is possible that a small modification, such as increasing the auditory stimulus loudness by 10 dB, could eliminate the observed difference. Therefore, it is essential to precisely define the detailed characteristics of the stimuli used in the experiment and compare the effectiveness of each modality. However, addressing this issue in a single study is difficult because manipulating the signal at multiple levels complicates the experimental design, especially when manipulating other driving-related variables and secondary tasks. In addition, previous research on manual driving and warning signals has revealed that individual background factors affect not only driving behavior but also the perception of stimuli.

Table 1.
Warning signals used in previous research.
This requires research examining how the responses of individuals change when stimulus details are changed. The current study focused on investigating how people’s responses change when the detailed characteristics of stimuli change, concentrating on the visual, auditory, and tactile senses, which have been primarily manipulated in previous research, and how they differ across modalities. In addition, the study aimed to assess whether there is an interaction between each modality and participants’ demographic information, such as age and gender.
2.3. Individual Differences in Driving
The influence of a personal background on driving task performance has been extensively studied, both in the context of manual driving and autonomous driving research. Age, gender, and experience are commonly investigated factors. These differences have been examined in various settings, ranging from laboratory-based signal detection studies to real-world driving tasks. As autonomous driving technology continues to evolve, considering the diverse characteristics of different individuals becomes increasingly important to create personalized vehicles. While it is not feasible to design warnings tailored to every individual difference or personal characteristic, it is feasible to include a representative sample of the target population when testing warnings [20].
A study by Ng and Chan examined individual differences in reaction time using a simple finger response task involving visual, auditory, and tactile stimuli [34]. The findings indicated that responses to tactile stimuli were generally faster than visual and auditory stimuli, while auditory responses were faster than visual responses. In terms of age differences, reaction times for both visual and auditory stimuli tended to be slower with increasing age. Furthermore, women exhibited faster reaction times compared to men [35]. It has been observed that women have a higher sensitivity to sound, perceiving even small changes in decibel levels [35]. Brain activity measurements have also shown that women exhibit higher activation in the right prefrontal cortex in response to noise compared to men [36]. Additionally, women tend to excel in discriminating rhythm and pitch changes compared to men [36]. These individual differences may similarly manifest in the signals provided by vehicles, and gender differences may also exist in the level of auditory cues.
The number of older drivers aged over 65 years is increasing. Older drivers often rate their driving ability very highly but often suffer from impairment of cognitive function such as perception, attention, and memory [27]. Also, older adults have a narrower visual field [37], find it more difficult to detect high-frequency sounds [22], and are less sensitive to tactile cues [38]. They are more likely to experience a decline in cognitive function that can affect their ability to safe operate a motor vehicle, and accident rates increase after age 65. In the study of Huang and Pitts, they used multiple visual, auditory, and tactile stimuli as TOR cues and found that younger adults had faster brake reaction times when using single visual and auditory stimuli compared to older adults [29]. However, tactile signal did not make a difference.
Previous research suggests that there are fundamental individual differences in how people respond to signals. Studies have explored individual differences in signal response during driving tasks, and guidelines for cues have provided a range of possibilities based on underlying cognition factors such as perception, cognition, and decision-making. However, these guidelines do not address the specific appropriateness of cues for each individual. In addition, studies focusing on TOR situations have typically examined combinations of modalities rather than different levels of stimuli, so it is unknown whether differences in response across modalities are due to cognitive differences or differences in stimulus details. Few studies have examined how manipulating sub-attribute of TOR signaling changes reaction times and whether there are interactions with personal background. Furthermore, these studies have been conducted in diverse simulation environments with different variables, such as secondary tasks, making it challenging to draw absolute comparisons unless different signals are compared within the same environment.
In this research, participants were presented with visual, auditory, and tactile signals with different combinations of sub-attributes in a TOR situation, and their responses were examined. The study aimed to determine whether there is a correlation between personal background and modality and whether there are some signals that people respond better or worse to according to age, gender, and driving style. Additionally, an analysis was conducted to assess how an individual’s responses vary with changes in sub-attributes of the signals. If participants’ responses are linearly faster as the strength of the signal increases, then the strength of the signal would be an important factor to address in studies measuring reaction times for TOR. The study also sought to investigate whether reaction times demonstrate a linear increase, a stepwise increase, or no significant difference beyond a certain level of signal strength. Furthermore, participants’ subjective perceptions of noticeability, comfort, and suitability for each signal were evaluated and compared to their behavioral responses. In summary, the study aims to address the following research questions:
Research Question 1. Are there correlations between reaction times to visual, auditory, and tactile signals and personal background (gender, age, driving experience, etc.)?
Research Question 2. Are there differences in reaction times to visual, auditory, and tactile signals and their sub-attributes based on personal background?
Research Question 3. What is the relationship between subjective judgment of the signal and reaction time?
3. Materials and Methods
3.1. Participants
Participants were recruited from people with a driver’s license between the ages of 20 and 70 who drive a passenger car. A total of 101 participants were recruited in this experiment. Of these, two participants dropped out during the experiment, leaving 51 male and 48 female participants, with a mean age of 48.05 (SD = 15.00). We collected information on participants’ driving experience, frequency of driving, number of accidents, driving safety, and driving speed. The demographics of the participants are presented in Table 2. This research was approved by the Stanford Institutional Review Board (No. 62510).
Table 2.
Frequency analysis of demographic information.
3.2. Apparatus
For the experiment, a driving simulation environment was set up, and participants were informed that they were driving a vehicle in a partially autonomous environment. For this purpose, INNO Simulation Company (Seoul, Republic of Korea) built an environment at the research center that shows the driving situation on a 180-degree screen, creates a real driver’s seat, and enables real-time simulation. The simulator was built to the size of a standard passenger car and set at a height similar to that of driving a car when the participant is seated and looking at the driving screen. Given that the aim of the experiment is to comprehend the driver’s reaction when the vehicle is providing signals, as opposed to the driver’s actual driving performance, a simulation video was not employed. Instead, a video recording of real driving scenes was utilized. As shown in Figure 1, the driver’s seat was equipped with a speedometer and an in-vehicle display (center fascia) on the driver’s right side. The speedometer was programmed to present visual stimuli, and the center fascia was designed for post-experiment surveys.
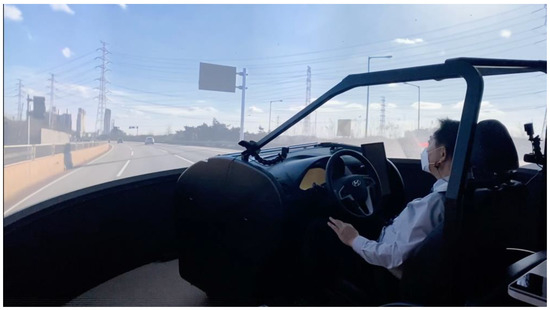
Figure 1.
Driving scene used in experiment.
3.3. Stimulus
Visual, auditory, and tactile stimuli were prepared for use as TOR signals. Previous research indicates that auditory stimuli are likely to modify using pitch and loudness, but visual and tactile stimuli vary widely in terms of the size of the physical interface provided, manipulation methods, and units. For the purpose of this study, visual stimuli were created with four different levels of brightness and size, and auditory stimuli were created with four different levels of pitch and loudness, the same as in previous studies. Tactile stimuli were created with four levels of amplitude and frequency. First, the value (V) of hue, saturation, value (HSV) was adjusted to manipulate the brightness of the visual stimuli. The V of the dashboard background was set to 0, and the circle stimuli were presented with V of 15, 95, 175, and 255 to manipulate brightness. The size of the circle stimuli was manipulated by varying the radius in pixels to 27, 57, 120, and 252, as shown in Figure 2. The pitch of the auditory stimuli was 500, 1000, 2000, and 4000 Hz and the loudness was 50, 60, 70, and 80 dB, within the guidelines of [19,21]. The noise level in the room where participants conducted the experiment was 50 dB. Each sublevel of each auditory stimulus was combined to create a total of 16 auditory stimuli, and all auditory stimuli used in the experiment are included in the Supplementary Materials. The tactile stimuli were created by creating a structure inside the driver’s seat that could be acoustically vibrated to present stimuli to the back and buttocks. The VM-6360 (Hong Kong, China), was utilized for measuring the magnitude of vibration. Vibration stimuli were generated with peak amplitudes of 1, 4, 8, and 12 v and frequencies of 25, 50, 200, and 400 Hz. Video clips of the driving environment were created by the experimenter over several days of driving and edited to fit the experiment.
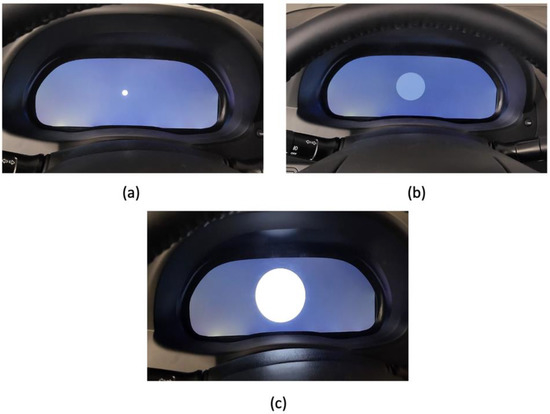
Figure 2.
Visual stimuli used in experiment: (a) lowest size (27 px) + highest brightness (V175); (b) second-highest size (120 px) + lowest brightness (V15); (c) highest size (252 px) + highest brightness (V175); V indicates value of HSV.
3.4. Procedure
The experiment was conducted in a laboratory containing a driving simulator. An experimenter provided participants with a comprehensive explanation of the entire experiment procedure. After granting their consent to participate, participants sat in the driver’s seat and made any necessary adjustments for comfort. The experimenter provided participants with detailed instructions regarding the driving simulator and took them on a practice drive to familiarize them with the procedure. During the course of the study, participants were informed that they were in a partially autonomous vehicle that was currently driving. The participants were instructed to experience driving without operating the steering wheel or pedals, and they were free to observe their surroundings.
Then, participants completed a total of three blocks of experiments during the experiment trial. Each block presented a different stimulus modality, and participants were randomly asked to respond two to three times per minute while viewing a driving video. Reaction time was quantified as the duration, measured in seconds, between the onset of the visual, auditory, or tactile stimulus and the participant’s response, which was indicated by pressing the pedal. In order to prevent participants from anticipating the timing of the stimuli, false alarm trials were included. Participants were given a break between each segment before moving on to the next.
After participants completed the three blocks of video-based trials, the driving video was removed, and they were presented with the stimuli in pairs. The participants were then asked to indicate which cues they found more comfortable, suitable, and easily noticeable in a situation involving partially autonomous driving. This procedure was repeated for each modality, yielding three blocks of pairwise comparisons. Two sub-attributes of the same modality were manipulated within each block. In the pitch manipulation condition, for instance, the loudness was maintained at 70 dB, and pitch comparisons were made between frequencies such as 500 Hz versus 1000 Hz and 500 Hz versus 2000 Hz. Each block consisted of pairwise comparisons of the same modality for a total of 12 comparisons. Overall, 36 comparison pairs were produced. Upon completion of all comparisons, participants were asked to complete a questionnaire in Appendix A regarding their individual background (e.g., gender, age, driving experience, frequency of accidents, driving stability, driving speed). The experiment was then concluded. The duration of the overall experiment was approximately one hour.
3.5. Analysis
An analysis was performed to investigate how responses to TOR varied depending on the level of sub-attributes within each modality and participants’ personal backgrounds. The dependent variable was the reaction time taken by participants to press the pedal after the cue was presented. Instances where participants did not respond to the cue for more than 5 s were categorized as “no response”. Initially, a correlation analysis was conducted to examine potential relationships between participants’ personal backgrounds and the sub-attributes within each modality. Subsequently, a repeated measures analysis of variance (RM ANOVA) was carried out to explore the interaction between participants’ personal backgrounds, the three modalities, and the sub-attributes. Participants’ personal backgrounds were treated as a between-participants variable, while the modality sub-attributes were considered within-participants variables. Therefore, a RM ANOVA was conducted with the sub-attributes as within-participant variables and each individual’s background as a between-participant variable, with reaction time as the dependent variable. Finally, comfortability, noticeability, and suitability ratings for the cues were analyzed using a paired comparison analysis [39]. This analysis allowed us to assess how the ratings varied based on participants’ personal backgrounds.
4. Results
4.1. Correlation Analysis
To examine the correlation of TOR reaction time with individual background and modality, Pearson correlation analysis was performed. The results are presented in Table 3. Age was positively correlated with auditory (r = 0.44) and tactile (r = 0.42) cues. As age increases, reaction times to auditory and tactile cues increase. However, for visual cues, there was no correlation with age. The visual cue was correlated with driving frequency (r = 0.21). This indicates that the higher the frequency of driving per week, the higher the reaction time to visual cues. Next, a Pearson correlation analysis was conducted with individual background by level of each modality’s sub-attribute (tactile: amplitude, frequency; auditory: pitch, loudness; visual: size, brightness). The results are presented in Appendix B.
Table 3.
The result of correlation analysis.
The personal background that correlated most strongly with the sub-attribute was age. For all the tactile and auditory sub-attributes, results indicated an increase in reaction time as age increased. Gender correlated with some of the sub-attributes for both tactile and auditory, particularly for auditory, where women had faster reaction times than men for stimuli at 70 and 80 dB. Women also had faster reaction times to stimuli at 4000 Hz than men. Driving frequency, number of accidents, and driving speed were also correlated with sub-attributes of visual stimuli. In particular, the number of accidents was correlated with the smallest and second smallest visual stimuli. In other words, the more accidents a driver had, the slower they responded to the smaller visual stimuli.
4.2. Interaction Effects between Individual Background and Modalities
To examine the interaction of personal background and modality, a RM ANOVA was conducted for modality and each signal’s sub-attributes. The overall mean reaction time per modality was calculated initially, disregarding the sub-attribute of each modality, in order to obtain the mean reaction time for visual, auditory, and tactile cues. Next, the interaction between each individual background and the three modalities on reaction time was analyzed. Age was recoded into three categories: 20–30 s, 40–50 s, and over 60. The interaction between each individual background and the three modalities with respect to reaction times was also examined. The interaction between age and modality was significant, F(4, 192) = 8.82, p < 0.001, ηp2 = 0.16, with little difference between ages for visual stimuli but significant increases in reaction time with age for auditory and tactile stimuli (Figure 3a). All other interactions effects between individual background and modality were not significant.
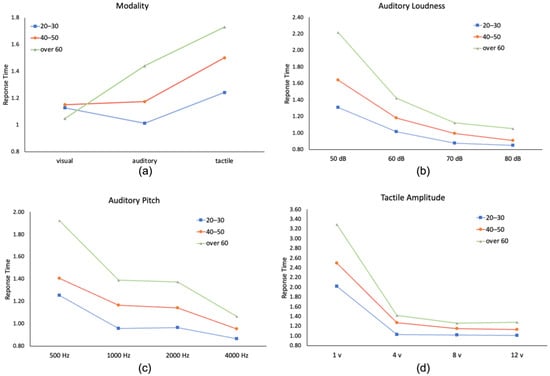
Figure 3.
Interaction effect of the experiment: (a) interaction effect between age and modality; (b) interaction effect between auditory loudness and age; (c) interaction effect between auditory pitch and age; (d) interaction effect between tactile amplitude and age.
Next, the interaction effects between the level of each modality sub-attribute and personal background were analyzed. Similar to previous analysis, significant interactions were observed between age and amplitude for tactile cues, F(6, 282) = 4.94, p < 0.001, ηp2 = 0.10; loudness for auditory cues, F(6, 282) = 10.70, p < 0.001, ηp2 = 0.19; and pitch for auditory cues, F(6, 282) = 4.63, p < 0.001, ηp2 = 0.09. Specifically, the age differences were most prominent at the lowest levels of tactile amplitude and auditory loudness and pitch (Figure 3b–d). There were no differences based on other individual backgrounds.
To investigate how participants’ reaction times changed as the strength of each signal’s sub-attributes varied, main effects of sub-attributes were analyzed. These analyses aimed to identify any trend lines or patterns in participants’ reaction times corresponding to changes in the strength of the sub-attributes within each signal. For all sub-attributes, the main effect of sub-attributes level was significant at the 0.05 level of significance. To determine whether this main effect was due to the lowest level of each stimulus sub-attribute, the lowest level was excluded, and a RM ANOVA was conducted on the remaining three levels and found that there was still a significant difference at the 0.05 level of significance. The result indicated that TOR reaction time decreased as each modality’s sub-attribute level increased (e.g., tactile amplitude increased, auditory pitch increased, visual size increased; Figure 4a–c).
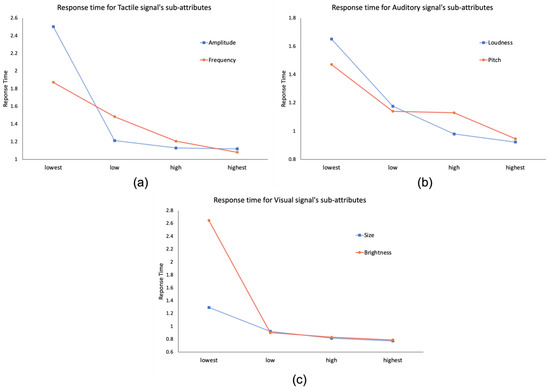
Figure 4.
Main effects of each signal’s sub-attributes on TOR response time: (a) main effects of tactile signal’s sub-attributes; (b) main effects of auditory signal’s sub-attributes; (c) main effects of visual signal’s sub-attributes; x-axis indicates intensity of signal.
To further examine the main effects identified in this study, post hoc tests using the Bonferroni method ware conducted. These tests enabled pairwise comparisons between different levels of the signal sub-attributes within each main effect, providing insights into specific differences in participants’ reaction times. The post hoc tests using the Bonferroni method revealed significant differences between all conditions (lowest to highest intensity) for both frequency in tactile signals and loudness in auditory signals. These differences were significant at the 0.001 level of significance. This indicates that participants’ reaction times showed continuous changes as the signal became louder or the vibration frequency increased. There was no significant difference in the amplitude of the tactile signal between 8 v and 12 v or pitch of the auditory signal between 1000 Hz and 2000 Hz. For visual signals, no significant differences were observed except for the comparison between the lowest intensity and other levels.
4.3. Subjective Preferences for Signals
For each modality, participants were asked to provide subjective ratings on the extent to which they perceived the modality as easily noticeable, comfortable, and appropriate to use as a TOR signal. This was accomplished by utilizing paired comparison analysis, where the frequency of the signal selected as the better of the comparison pair based on each person’s response was added together and converted to a percentage. Tables and graphs of all results are available in the Supplementary Materials. Regarding auditory signals, participants rated the 80 dB intensity level as easily noticeable. However, they perceived it as less comfortable and less appropriate to use as a signal compared to the 70 dB intensity level. In terms of pitch, participants rated the 4000 Hz as easy to perceive. However, they found it less comfortable and less appropriate to use as a TOR signal compared to the 1000 Hz and 2000 Hz signals. In the case of tactile signals, participants evaluated that higher amplitudes and frequencies were perceived as more noticeable, comfortable, and appropriate to use as TOR signals. Regarding visual stimuli, participants rated larger visual signal as better in terms of noticeability, comfort, and appropriateness to use. However, in terms of brightness, the brightest stimuli were rated as less comfortable and less appropriate to use as TOR cues. Additionally, in terms of individual difference, older people reported being less comfortable with smaller vibrations than other age groups (Figure 5b). A trend was observed indicating that as age increased, participants tended to rate higher pitches of auditory signals as more comfortable and more suitable as TOR signals (Figure 5a).
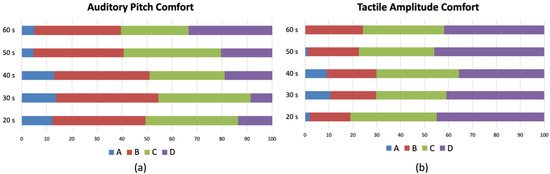
Figure 5.
The result of paired comparison analysis for age: (a) participants’ responses to how comfortable they were hearing each auditory cue based on their age, A = 500 Hz, B = 1000 Hz, C = 2000 Hz, D = 4000 Hz; (b) participants’ responses to how comfortable they were feeling each tactile cue based on their age, A = 1 v, B = 4 v, C = 8 v, D = 12 v; y-axis indicates ages.
5. Discussion
This study aimed to determine how changes in sub-attribute for each modality and personal background affect TOR responses in partially autonomous driving situations. For this purpose, correlation analysis, repeated measure ANOVA, and paired comparison analysis were conducted, and the results are summarized below according to research questions.
Research Question 1 focused on examining correlations between reaction times to visual, auditory, and tactile signals and participants’ personal backgrounds. The analysis revealed significant correlations between individual background factors and TOR signaling modalities and sub-attributes. Specifically, the faster response times of women to larger auditory stimuli and higher pitch can be attributed to gender differences in auditory perception and sensitivity. Previous research has shown that women tend to have higher sound sensitivity and better discrimination abilities for pitch changes compared to men [35]. These factors may contribute to their faster response times to certain auditory cues in this study.
Research Question 2 aimed to determine whether there were differences in reaction times to visual, auditory, and tactile signals and their sub-attributes based on participants’ personal backgrounds. In terms of visual stimuli, there were minimal age differences. However, for auditory and tactile signals, reaction times increased with age. Notably, the age differences were most pronounced when the amplitude of the tactile stimulus, as well as the loudness and pitch of the auditory stimuli, were at their lowest intensity levels. Regarding the observed increase in reaction times for both auditory and tactile modalities with age, this finding aligns with existing research on age-related changes in sensory perception and cognitive processing. It is well-established that aging is associated with a decline in sensory acuity and cognitive processing speed [22,38]. Therefore, the slower reaction times in older participants may be attributed to these age-related changes, affecting their ability to detect and respond to the TOR signals.
Furthermore, each sub-attribute exhibited a distinct pattern of faster response times as intensity increased. Specifically, a noteworthy observation was made regarding the continuous decrease in reaction times as auditory loudness increased. It was found that for every 10 dB increase in auditory loudness within the range of 50 to 80 dB, participants’ reaction times decreased consistently. Similarly, as the frequency of vibration increased from 25 to 50, 200, and 400 Hz, participants’ reaction times continued to decrease. Interestingly, there was no significant difference in reaction times between 1000 Hz and 2000 Hz for the pitch of the auditory signal. However, a decrease in reaction time was observed at 4000 Hz. Additionally, no significant difference was found in reaction times between 8 v and 12 v for the amplitude of the tactile signal.
These results carry significant implications for future TOR studies. While the criteria for selecting signal intensity in TOR studies may present some ambiguity, findings highlight the crucial role of signal intensity in influencing participants’ reaction times. It is important for researchers to carefully select an appropriate level of signal intensity, considering previous studies conducted in similar settings. Furthermore, while auditory signals are relatively well-characterized in terms of pitch and loudness, the same level of detailed characterization is lacking for visual and tactile signals. Consequently, researchers should strive to provide comprehensive descriptions of the signals used in their studies.
In Research Question 3, the objective was to explore the relationship between participants’ behavioral responses and their subjective evaluations of signals. Participants were asked to rate which signals they found more noticeable, comfortable, and appropriate to use. The results indicated that the ratings were influenced by the intensity levels of the signal’s sub-attributes. The lower the intensity of a signal’s sub-attributes, the more negative people rated it. However, for the pitch and loudness of auditory signals and the brightness of visual signals, people preferred the signal with the next-lowest intensity to the highest intensity. If the TOR situation is urgent and life-threatening, the stimulus that will elicit the fastest response should be used, regardless of how people evaluate it [1]. However, in a TOR situation, what is important is not only to alert people but also to achieve accurate situation awareness [40], so a stimulus that is more interactive than one that may cause irritation or narrowing of attention may be appropriate.
Subjective ratings also show that older adults are less comfortable with lower pitch stimuli and more comfortable with higher pitch stimuli than other age groups. This is likely related to the cognitive decline that occurs with increasing age [22,38]. However, older people had similar reaction times to visual signals in this experiment. Although the visual field narrows with age [37], the reaction time to signals is most effective with visual signals in this study. This may be because the design of the study did not allow for other secondary tasks or environmental factors that could have influenced the participants. However, the faster reaction times for visual stimuli compared to other auditory and tactile stimuli suggest that the effectiveness of visual stimuli should be considered when selecting TOR stimuli for older adults. The implication of this study is that the three types of modalities used for TOR were investigated by manipulating the detailed sub-attributes in greater depth. The results of this study, which examined how reaction time changes as the detailed attributes change and whether there is an interaction between the changes in detailed attributes and individual background, can be used as a reference for future TOR signals and are expected to serve as a bridge to further research on individual differences.
Despite the valuable insights gained from this study, there are several limitations: Firstly, this study employed arbitrary categories for signal sub-attributes instead of examining them on a continuum. This limited analysis to verifying precise trends in participants’ reaction times as the intensity of a specific signal’s sub-attributes. Future research could overcome this limitation by implementing a method that allows for a more elaborated exploration of reaction times across a continuum of signal levels.
Secondly, the study’s examination of personal backgrounds was limited in scope. The duration of the driving simulator experiment and signal evaluation made it hard to add a wider range of driving-related personal backgrounds. Future research should consider incorporating additional personal background variables, such as trust in technology and risk-taking propensity. Additionally, obtaining data on participants’ driving behavior directly through the driving simulator could provide further insights into how personal backgrounds relate to driving performance and TOR responses.
It is important for future studies to address these limitations to gain a more comprehensive understanding of the relationship between signal, individual differences, and TOR responses in partially autonomous driving situations. By incorporating a continuum of signal levels and considering a broader range of personal backgrounds, researchers can further enhance the validity and applicability of their findings.
The findings of the study have direct relevance to the design and implementation of takeover request (TOR) signals in autonomous vehicles. By investigating the effects of sub-attributes of TOR signaling modalities and individual background factors on reaction times and subjective evaluations, valuable insights have been gained that can inform the development of effective TOR systems. Firstly, the findings suggest that signal intensity, such as loudness in auditory signals and amplitude/frequency in tactile signals, significantly impact participants’ reaction times. This knowledge can guide the selection of appropriate signal intensities that effectively capture the attention of drivers and prompt timely responses. Autonomous vehicles can leverage this information to optimize the design of TOR signals by ensuring an appropriate level of intensity that balances effectiveness without causing discomfort or annoyance to drivers. Moreover, the observed correlations between individual background factors, such as gender and age, and participants’ responses to specific modalities highlight the importance of personalization in TOR systems. Autonomous vehicles could benefit from considering individual characteristics and preferences when delivering TOR signals. For instance, gender-specific signal characteristics or customizable settings could be implemented to cater to individual differences and enhance the user experience.
Additionally, the subjective evaluations provided by participants shed light on the comfort, noticeability, and suitability perceptions of the TOR signals. This information can guide the design of user-centered TOR systems in autonomous vehicles. By incorporating participants’ preferences and comfort levels, autonomous vehicles can create TOR signals that are not only effective in eliciting timely responses but also contribute to a positive driving experience and promote driver trust in autonomous technology. Furthermore, the study emphasizes the importance of understanding the interaction between stimulus characteristics, individual differences, and TOR responses. This knowledge can aid in the development of advanced algorithms and machine learning models that adapt TOR signals based on real-time assessments of drivers’ attention and responsiveness. Autonomous vehicles equipped with such adaptive TOR systems can effectively tailor the delivery of signals to individual drivers’ needs and optimize their performance in complex driving scenarios.
In conclusion, the study offers practical implications for the application of TOR signals in autonomous vehicles. By considering the findings of this research, autonomous vehicle manufacturers and designers can enhance the design, personalization, and adaptability of TOR systems, ultimately improving driver safety, comfort, and trust in autonomous technology. Further research and development in this area can continue to refine and optimize TOR systems, contributing to the successful integration of autonomous vehicles into transportation systems.
6. Conclusions
This study aimed to investigate the effects of sub-attributes of TOR signaling modalities and individual background factors on reaction times and subjective evaluations in TOR situations during partial autonomous driving. The findings shed light on the dynamics between stimulus characteristics, individual differences, and TOR responses, addressing the need for fundamental research in this area. Through a comprehensive examination of these fundamental aspects, valuable insights are provided that can inform the design and implementation of TOR systems. The relationships between signal sub-attributes, individual backgrounds, and reaction times were elucidated, contributing to the understanding of TOR perception.
Importantly, the study highlights the novelty of examining the specific effects of visual, auditory, and tactile signals on age-related variations in reaction times. Significant correlations were identified between age and reaction times for auditory and tactile signals, revealing age-related differences in TOR perception. This finding emphasizes the importance of considering age as a crucial factor when designing TOR systems to ensure effective and timely responses from drivers across different age groups.
The significance of this research lies in the foundation it provides for current and future studies in the field of in-vehicle signaling. By conducting rigorous basic research, the theoretical underpinnings of autonomous driving systems are strengthened, enhancing their effectiveness and advancing the understanding of the interactions between autonomous vehicles and humans. In conclusion, this study emphasizes the importance of conducting fundamental research to deepen knowledge and drive advancements in autonomous driving. By establishing a robust foundation of understanding, future research can build upon these findings and contribute to improved safety, performance, and user satisfaction in autonomous driving environments.
Supplementary Materials
The following supporting information can be downloaded at: https://www.mdpi.com/article/10.3390/app13148162/s1. Supplementary File S1: all auditory stimuli used in the experiment and AHP results.
Author Contributions
Conceptualization, O.L.; methodology, H.K. and O.L.; software, H.K.; validation, O.L.; formal analysis, H.K.; investigation, H.K.; resources, O.L.; data curation, H.K.; writing—original draft preparation, H.K. and O.L. All authors have read and agreed to the published version of the manuscript.
Funding
This research received no external funding.
Institutional Review Board Statement
The study was conducted in accordance with the Declaration of Helsinki, and approved by the Institutional Review Board of Stanford University (protocol code 62510, 15 November 2021).
Informed Consent Statement
Informed consent was obtained from all subjects involved in the study.
Data Availability Statement
The data presented in this study are available on request.
Conflicts of Interest
The authors declare no conflict of interest.
Appendix A
Table A1.
Questionnaire to obtain individual backgrounds.
Table A1.
Questionnaire to obtain individual backgrounds.
| Individual Background | Question | Scale |
|---|---|---|
| Age | What is your age? | Open-ended question |
| Gender | What is your gender? | Multiple choice questions |
| Experience | How long have you been driving? | Multiple choice questions |
| Frequency | How often do you drive per week? | Multiple choice questions |
| Number of Accidents | How many accidents have you had? | Open-ended question |
| Driving Style | Please rate your usual driving style. | 7-point Likert scale |
| Driving Speed | Please rate your usual driving speed. | 7-point Likert scale |
Appendix B
Table A2.
Correlation analysis between modality sub-attributes and individual backgrounds.
Table A2.
Correlation analysis between modality sub-attributes and individual backgrounds.
| Age | Gender | Exp | Freq | Accident | Driving Style | Driving Speed | ||
|---|---|---|---|---|---|---|---|---|
| Tactile | Amplitude 1 | 0.36 ** | −0.09 | 0.08 | 0.08 | −0.06 | 0.10 | 0.02 |
| Amplitude 4 | 0.41 ** | −0.21 * | 0.06 | 0.14 | −0.02 | 0.04 | 0.01 | |
| Amplitude 8 | 0.34 ** | −0.16 | 0.06 | 0.15 | 0.05 | 0.04 | −0.02 | |
| Amplitude 12 | 0.33 ** | −0.14 | 0.06 | 0.11 | 0.00 | 0.10 | −0.02 | |
| Frequency 25 | 0.32 ** | −0.12 | 0.16 | 0.13 | −0.07 | 0.10 | 0.06 | |
| Frequency 50 | 0.32 ** | −0.15 | 0.15 | 0.19 | 0.09 | 0.15 | 0.09 | |
| Frequency 200 | 0.44 ** | −0.21 * | 0.14 | 0.17 | 0.03 | 0.12 | 0.02 | |
| Frequency 400 | 0.39 ** | −0.17 | 0.01 | 0.08 | 0.03 | 0.01 | −0.10 | |
| Auditory | Loudness 50 | 0.46 ** | −0.08 | 0.08 | 0.10 | −0.03 | 0.11 | 0.03 |
| Loudness 60 | 0.45 ** | −0.16 | 0.12 | 0.13 | −0.01 | 0.12 | 0.11 | |
| Loudness 70 | 0.33 ** | −0.24 * | 0.07 | 0.13 | 0.07 | 0.10 | 0.09 | |
| Loudness 80 | 0.28 ** | −0.23 * | 0.07 | 0.20 | 0.10 | 0.18 | 0.09 | |
| Pitch 500 | 0.38 ** | −0.07 | 0.07 | 0.11 | 0.03 | 0.14 | 0.03 | |
| Pitch 1000 | 0.43 ** | −0.16 | 0.11 | 0.18 | 0.02 | 0.13 | 0.14 | |
| Pitch 2000 | 0.41 ** | −0.20 | 0.09 | 0.08 | −0.02 | 0.10 | 0.04 | |
| Pitch 4000 | 0.28 ** | −0.23 * | 0.09 | 0.17 | 0.07 | 0.13 | 0.09 | |
| Visual | Size 27 | −0.10 | −0.15 | 0.13 | 0.14 | 0.23 * | −0.07 | 0.17 |
| Size 57 | −0.19 | −0.06 | 0.09 | 0.17 | 0.30 ** | 0.11 | 0.16 | |
| Size 120 | 0.02 | −0.07 | 0.17 | 0.10 | 0.09 | 0.04 | 0.14 | |
| Size 252 | 0.06 | −0.10 | 0.23 * | 0.12 | 0.09 | 0.02 | 0.12 | |
| Brightness 15 | 0.02 | −0.13 | −0.02 | 0.14 | −0.14 | 0.03 | −0.02 | |
| Brightness 95 | 0.05 | 0.05 | 0.08 | 0.11 | −0.07 | −0.16 | 0.06 | |
| Brightness 175 | −0.10 | −0.12 | 0.02 | 0.01 | −0.06 | 0.00 | 0.16 | |
| Brightness 255 | 0.10 | −0.10 | 0.12 | 0.21 * | 0.21 * | 0.14 | 0.24 * |
* p < 0.05, ** p < 0.01.
References
- Lee, J.D.; Wickens, C.D.; Liu, Y.; Boyl, L.N. Designing for People: An Introduction to Human Factors Engineering, 3rd ed.; CreateSpace: Scotts Valley, CA, USA, 2017. [Google Scholar]
- Naujoks, F.; Purucker, C.; Wiedemann, K.; Neukum, A.; Wolter, S.; Steiger, R. Driving Performance at Lateral System Limits during Partially Automated Driving. Accid. Anal. Prev. 2017, 108, 147–162. [Google Scholar] [CrossRef]
- Wickens, C.D.; Liu, Y. Codes and Modalities in Multiple Resources: A Success and a Qualification. Hum. Factors J. Hum. Factors Ergon. Soc. 1988, 30, 599–616. [Google Scholar] [CrossRef]
- Baldwin, C.L.; May, J.F. Loudness Interacts with Semantics in Auditory Warnings to Impact Rear-End Collisions. Transp. Res. Part F Traffic Psychol. Behav. 2011, 14, 36–42. [Google Scholar] [CrossRef]
- Gruden, T.; Tomažič, S.; Sodnik, J.; Jakus, G. A User Study of Directional Tactile and Auditory User Interfaces for Take-over Requests in Conditionally Automated Vehicles. Accid. Anal. Prev. 2022, 174, 106766. [Google Scholar] [CrossRef]
- Petermeijer, S.; Bazilinskyy, P.; Bengler, K.; de Winter, J. Take-over Again: Investigating Multimodal and Directional TORs to Get the Driver Back into the Loop. Appl. Ergon. 2017, 62, 204–215. [Google Scholar] [CrossRef]
- Mohebbi, R.; Gray, R.; Tan, H.Z. Driver Reaction Time to Tactile and Auditory Rear-End Collision Warnings While Talking on a Cell Phone. Hum. Factors J. Hum. Factors Ergon. Soc. 2009, 51, 102–110. [Google Scholar] [CrossRef]
- de Rosario, H.; Louredo, M.; Díaz, I.; Soler, A.; Gil, J.J.; Solaz, J.S.; Jornet, J. Efficacy and Feeling of a Vibrotactile Frontal Collision Warning Implemented in a Haptic Pedal. Transp. Res. Part F Traffic Psychol. Behav. 2010, 13, 80–91. [Google Scholar] [CrossRef]
- Spence, C.; Ho, C. Tactile and Multisensory Spatial Warning Signals for Drivers. IEEE Trans. Haptics 2008, 1, 121–129. [Google Scholar] [CrossRef]
- Lylykangas, J.; Surakka, V.; Salminen, K.; Farooq, A.; Raisamo, R. Responses to Visual, Tactile and Visual–Tactile forward Collision Warnings While Gaze on and off the Road. Transp. Res. Part F Traffic Psychol. Behav. 2016, 40, 68–77. [Google Scholar] [CrossRef]
- Meng, F.; Spence, C. Tactile Warning Signals for In-Vehicle Systems. Accid. Anal. Prev. 2015, 75, 333–346. [Google Scholar] [CrossRef] [PubMed]
- McCarty, M.; Funkhouser, K.; Zadra, J.; Drews, F. Effects of Auditory Working Memory Tasks While Switching between Autonomous and Manual Driving. Proc. Hum. Factors Ergon. Soc. Annu. Meet. 2016, 60, 1741–1745. [Google Scholar] [CrossRef]
- Yun, H.; Yang, J.H. Multimodal Warning Design for Take-over Request in Conditionally Automated Driving. Eur. Transp. Res. Rev. 2020, 12, 34. [Google Scholar] [CrossRef]
- Geitner, C.; Biondi, F.; Skrypchuk, L.; Jennings, P.; Birrell, S. The Comparison of Auditory, Tactile, and Multimodal Warnings for the Effective Communication of Unexpected Events during an Automated Driving Scenario. Transp. Res. Part F Traffic Psychol. Behav. 2019, 65, 23–33. [Google Scholar] [CrossRef]
- Pitts, B.J.; Sarter, N. What You Don’t Notice Can Harm You: Age-Related Differences in Detecting Concurrent Visual, Auditory, and Tactile Cues. Hum. Factors J. Hum. Factors Ergon. Soc. 2018, 60, 445–464. [Google Scholar] [CrossRef] [PubMed]
- Rogers, W.A.; Bertus, E.L.; Gilbert, D.K. Dual-Task Assessment of Age Differences in Automatic Process Development. Psychol. Aging 1994, 9, 398–413. [Google Scholar] [CrossRef]
- Green, P.; Levison, W.; Paelke, G.; Serafin, C. Preliminary Human Factors Design Guidelines for Driver Information Systems; Technical Report No. UMTRI-93-21; University of Michigan: Ann Arbor, MI, USA, 1995. [Google Scholar]
- Ross, T.; Midtland, K.; Fuchs, M.; Pauzié, A.; Engert, A.; Duncan, B.; Vaughan, G.; Vernet, M.; Peters, H.; Burnett, G.; et al. HARDIE Design Guidelines Handbook: Human Factors Guidelines for Information Presentation by ATT Systems; DRIVE Project V2008 HARDIE, 20; European Communities: Berkshire, UK, 1996. [Google Scholar]
- Stevens, A.; Quimby, A.; Board, A.; Kersloot, T.; Burns, P. Design Guidelines for Safety of In-Vehicle Information Systems; Project Report No. PA3721/01; TRL: Wokingham, UK, 2002. [Google Scholar]
- Wogalter, M.S.; Conzola, V.C.; Smith-Jackson, T.L. Research-Based Guidelines for Warning Design and Evaluation. Appl. Ergon. 2002, 33, 219–230. [Google Scholar] [CrossRef]
- Green, P.; Sullivan, J.; Tsimhoni, O.; Oberholtzer, J.; Buonarosa, M.L.; Devonshire, J.; Baragar, E.; Sayer, J. Integrated Vehicle-Based Safety Systems (IVBSS): Human Factors And Driver-Vehicle Interface (DVI) Summary Report; Technical Report No. UMTRI-2007-43; University of Michigan: Ann Arbor, MI, USA, 2008. [Google Scholar]
- Zobel, G.P. Warning Tone Selection for a Reverse Parking Aid System. Proc. Hum. Factors Ergon. Soc. Annu. Meet. 1998, 42, 1242–1246. [Google Scholar] [CrossRef]
- Kaltenbrunner, M.; Murer, M.; Wolf, K.; Oakley, I.; Ballin, P. Tactile Design Principles. Proc. Fifteenth Int. Conf. Tangible Embed. Embodied Interact. 2021, 2021, 3443688. [Google Scholar] [CrossRef]
- Van Erp, J.B. Guidelines for the use of vibro-tactile displays in human computer interaction. In Proceedings of the Eurohaptics, Edinburgh, UK, 8–10 July 2002. [Google Scholar]
- Olaverri-Monreal, C.; Jizba, T. Human Factors in the Design of HumanMachine Interaction: An Overview Emphasizing V2X Communication. IEEE Trans. Intell. Veh. 2016, 1, 302–313. [Google Scholar] [CrossRef]
- Lerner, N.; Robinson, E.; Singer, J.; Jenness, J.; Huey, R.; Baldwin, C.; Fitch, G. Human Factors for Connected Vehicles: Effective Warning Interface Research Findings; Report No. DOT HS 812 068; National Highway Traffic Safety Administration: Washington, DC, USA, 2014. [Google Scholar]
- Huang, G.; Luster, M.; Karagol, I.; Park, J.W.; Pitts, B.J. Self-Perception of Driving Abilities in Older Age: A Systematic Review. Transp. Res. Part F Traffic Psychol. Behav. 2020, 74, 307–321. [Google Scholar] [CrossRef]
- Clark, H.; Feng, J. Age Differences in the Takeover of Vehicle Control and Engagement in Non-Driving-Related Activities in Simulated Driving with Conditional Automation. Accid. Anal. Prev. 2017, 106, 468–479. [Google Scholar] [CrossRef] [PubMed]
- Huang, G.; Pitts, B.J. Takeover Requests for Automated Driving: The Effects of Signal Direction, Lead Time, and Modality on Takeover Performance. Accid. Anal. Prev. 2022, 165, 106534. [Google Scholar] [CrossRef] [PubMed]
- Scott, J.J.; Gray, R. A Comparison of Tactile, Visual, and Auditory Warnings for Rear-End Collision Prevention in Simulated Driving. Hum. Factors J. Hum. Factors Ergon. Soc. 2008, 50, 264–275. [Google Scholar] [CrossRef]
- Murata, A.; Kuroda, T.; Karwowski, W. Effects of Auditory and Tactile Warning on Response to Visual Hazards under a Noisy Environment. Appl. Ergon. 2017, 60, 58–67. [Google Scholar] [CrossRef] [PubMed]
- Salminen, K.; Farooq, A.; Rantala, J.; Surakka, V.; Raisamo, R. Unimodal and Multimodal Signals to Support Control Transitions in Semiautonomous Vehicles. In Proceedings of the International Conference on Automotive User Interfaces and Interactive Vehicular Applications, Utrecht, The Netherlands, 22–25 September 2019; pp. 308–318. [Google Scholar] [CrossRef]
- Lundqvist, L.M.; Eriksson, L. Age, Cognitive Load, and Multimodal Effects on Driver Response to Directional Warning. Appl. Ergon. 2019, 76, 147–154. [Google Scholar] [CrossRef] [PubMed]
- Ng, A.W.; Chan, A.H. Finger response times to visual, auditory and tactile modality stimuli. In Proceedings of the International Multiconference of Engineers Computer Scientists, Hong Kong, China, 14–16 March 2012; Volume 2, pp. 1449–1454. [Google Scholar]
- McFadden, D. Masculinizing Effects on Otoacoustic Emissions and Auditory Evoked Potentials in Women Using Oral Contraceptives. Hear. Res. 2000, 142, 23–33. [Google Scholar] [CrossRef]
- Ruytjens, L.; Albers, F.; van Dijk, P.; Wit, H.; Willemsen, A. Activation in Primary Auditory Cortex during Silent Lipreading Is Determined by Sex. Audiol. Neurotol. 2007, 12, 371–377. [Google Scholar] [CrossRef]
- Stuart-Hamilton, I. The Psychology of Ageing: An Introduction; Jessica Kingsley Publishers: Philadelphia, PA, USA, 2012. [Google Scholar]
- Thornbury, J.M.; Mistretta, C.M. Tactile sensitivity as a function of age. J. Gerontol. 1981, 36, 34–39. [Google Scholar] [CrossRef]
- Cervone, H.F. Applied Digital Library Project Management. Oclc Syst. Serv. Int. Digit. Libr. Perspect. 2009, 25, 162–166. [Google Scholar] [CrossRef]
- Kyriakidis, M.; de Winter, J.C.F.; Stanton, N.; Bellet, T.; van Arem, B.; Brookhuis, K.; Martens, M.H.; Bengler, K.; Andersson, J.; Merat, N.; et al. A Human Factors Perspective on Automated Driving. Theor. Issues Ergon. Sci. 2017, 20, 223–249. [Google Scholar] [CrossRef]


Disclaimer/Publisher’s Note: The statements, opinions and data contained in all publications are solely those of the individual author(s) and contributor(s) and not of MDPI and/or the editor(s). MDPI and/or the editor(s) disclaim responsibility for any injury to people or property resulting from any ideas, methods, instructions or products referred to in the content. |
© 2023 by the authors. Licensee MDPI, Basel, Switzerland. This article is an open access article distributed under the terms and conditions of the Creative Commons Attribution (CC BY) license (https://creativecommons.org/licenses/by/4.0/).