Article

Sentiment Analysis of Online New Energy Vehicle Reviews

1
School of Electronics and Engineering, Heilongjiang University, Harbin 150081, China
2
School of Computer and Artificial Intelligence, Zhengzhou University of Economics and Business, Zhengzhou 451191, China
*
Author to whom correspondence should be addressed.
Appl. Sci. 2023, 13(14), 8176; https://doi.org/10.3390/app13148176
Submission received: 24 May 2023 / Revised: 15 June 2023 / Accepted: 10 July 2023 / Published: 13 July 2023

Abstract

:
Massive online reviews of new energy vehicles in China are deemed crucial by companies, as they offer valuable insights into user demands and perceptions. An effective analysis enables companies to swiftly adapt and enhance their products while upholding a positive public image. Nonetheless, the sentiment analysis of online car reviews can pose challenges due to factors such as incomplete context, abrupt information bursts, and specialized vocabulary. In this paper, an enhanced hybrid model is introduced, combining Enhanced Representation through kNowledge IntEgration (ERNIE) and a deep (Convolutional Neural Network) CNN, to tackle these challenges. The model utilizes fine-tuned ERNIE for feature extraction from preprocessed review datasets, generating word vectors that encompass comprehensive semantic information. The deep CNN component captures local features from the text, thereby capturing semantic nuances at multiple levels. To address sudden shifts in public sentiment, a channel attention mechanism is employed to amplify the significance of crucial information within the reviews, facilitating comment relationship classification and sentiment prediction. The experimental results demonstrate the efficacy of the proposed model, achieving an impressive accuracy rate of 97.39% on the test set and significantly outperforming other models.

1. Introduction

With increasing global environmental awareness and growing concerns about the scarcity of nonrenewable energy sources, the search for alternative clean energy solutions has become a significant issue across various industries [1]. As one of the primary modes of transportation, automobiles have raised concerns about emissions and resource consumption. To achieve the use of clean energy, the automotive industry needs a revolutionary change [2,3]. In this context, electric vehicles (EVs) have emerged as an environmentally friendly and efficient alternative, demonstrating significant advantages. By delving into the technological innovations in the field of electric vehicles, a deeper understanding of their crucial benefits in reducing pollution, improving transportation, enhancing energy efficiency, and promoting sustainable development can be gained [4].
First, refs. [5,6] focused on the application of electric vehicles in urban transportation and the potential for reducing traffic congestion, proposing a new perspective on improving urban traffic conditions. These studies, through methods such as traffic flow prediction and optimized operations, can improve traffic efficiency, reduce vehicle emissions, and improve urban air quality. Second, refs. [7,8] delved into the underlying control and key technology applications of hybrid energy systems for electric vehicles. The aim of these studies was to enhance the performance and efficiency of electric vehicles, further promoting the utilization of renewable energy and energy transition. Additionally, refs. [9,10] introduced the application of quantum algorithms and data augmentation techniques for traffic predictions and translation tasks in electric vehicles. These novel approaches effectively enhance energy utilization efficiency and the quality of travel experience. On another front, refs. [8,10] focused on the strategies for electric vehicles in the car-sharing market and the automatic parking system based on UWB (Ultra-Wideband) technology. These studies highlighted the potential of electric vehicles in the fields of shared mobility and intelligent transportation, driving urban sustainable development by providing convenient, economical, and environmentally friendly travel options. At the user level, refs. [11,12] analyzed user emotions and experiences, revealing the evolution of electric vehicles in mixed learning environments and emotion detection in user interactions. These studies strengthened people’s acceptance and recognition of electric vehicles, further driving their development and application. People’s understanding and acceptance of electric vehicles will continue to improve.
Before making a buying decision, consumers often rely on online reviews to understand how other customers evaluate EV performance, reliability, comfort, and other factors. However, sifting through a large volume of reviews can be challenging. This is where sentiment analysis comes into play, enabling consumers to quickly grasp the overall sentiment expressed by reviewers. By providing more comprehensive information and evaluations, sentiment analysis helps consumers gain a better understanding of the strengths and limitations of electric vehicles, facilitating more informed choices [3]. As a result, sentiment analysis plays a crucial role in the EV market, assisting consumers in making rational decisions and fostering the growth of the electric vehicle industry.
User-generated content in the form of online reviews holds immense value and typically includes both ratings and textual descriptions [13]. While ratings are relatively straightforward to interpret, textual descriptions offer a wealth of nuanced information. For example, when it comes to vehicle comfort, some consumers might give a top rating of 5 stars, but their textual description may reveal negative experiences. Thus, sentiment analysis plays a vital role in discerning consumers’ true opinions by leveraging natural language processing techniques [14]. Through sentiment analysis, deeper insights into the sentiment polarity embedded within textual descriptions can be gained, enabling more accurate evaluations of consumers’ perceptions of vehicle comfort.
With the widespread popularity of social media and mobile devices, people have become accustomed to sharing their views and opinions on social media platforms. User-generated content, such as online reviews, has emerged as a more authentic reflection of users’ thoughts compared to traditional survey methods, providing valuable insights [15]. Recent studies have demonstrated the use of sentiment analysis based on comments to determine evaluation criteria for electric vehicles, further emphasizing the significant potential of textual comments and sentiment analysis in the consumer goods domain [16]. Therefore, it is foreseeable that comments and sentiment analysis will continue to play a crucial role in providing consumers with more accurate and valuable information as social media and mobile devices continue to prevail.
Sentiment analysis methods serve as a vital tool in understanding consumer emotions and feedback within consumer goods reviews. Mohamed Gharzouli et al. developed a sentiment analysis system for hotel reviews that delivers precise evaluation reports on hotel service quality based on user-specified criteria [17]. D.U. Vidanagama et al. proposed a comprehensive method for detecting fake reviews, utilizing various features related to comments. By combining linguistic features, part-of-speech features, and sentiment analysis features, and employing rule-based classifiers for inference and enhancement, they achieved improved detection performance [18]. Gagandeep Kaur et al. introduced a hybrid approach to sentiment analysis, encompassing preprocessing, feature extraction, and sentiment classification. They employed NLP techniques to process comment data, constructing unique hybrid feature vectors. Deep learning classifiers were used for sentiment classification, and experiments conducted on multiple comment datasets yielded positive outcomes [19].
Despite the significant role of sentiment analysis methods in consumer goods reviews, challenges persist in the sentiment analyss of new energy vehicle reviews. Firstly, the context information in comments may be incomplete, leading to ambiguity in sentiment analysis results. Secondly, sudden events, such as the recent BMW Mini controversy, have generated a surge of comments and discussions regarding product quality, safety, and brand image. Additionally, the field of new energy vehicles encompasses numerous specialized terms that necessitate domain-specific knowledge for a better understanding of their meanings.
To address these challenges, this study presents the Emotion Detection for Electric Vehicle Comments method called EDC, which brings several innovative contributions:
  • A comprehensive dataset of comments specifically focused on new energy vehicles is curated. Accurate polarity labels for each comment are obtained through meticulous preprocessing steps, including data cleaning, tokenization, and sentiment category labeling.
  • Multiple layers of Convolutional Neural Networks are leveraged by our deep Convolutional Neural Network model to extract localized features from sentences. The vanishing gradient problem is mitigated by introducing residual connections, and diverse channel representations are effectively fused using channel attention to adeptly handle cases of ambiguous sentiment tendencies in comments. Furthermore, contextual information, especially in the face of abrupt and unexpected comments, is captured excellently by our model.
  • The novel hybrid sentiment analysis model is enhanced by combining the strengths of ERNIE and deep CNN. ERNIE, which is based on the Transformer deep learning architecture, demonstrates remarkable performance in pretraining Chinese language models. By integrating ERNIE’s capabilities into our model, advantages are gained when processing Chinese new energy vehicle comments, which are characterized by incomplete context, suddenness, and the presence of domain-specific terminology.
The challenges in sentiment analysis of new energy vehicle reviews are addressed through the aforementioned innovative contributions in our research. The method developed helps consumers gain a better understanding of the sentiment tendencies of reviewers and provides them with more comprehensive information and evaluations, enabling them to make more informed purchasing decisions. Through sentiment analysis, the overall sentiment of reviews can be quickly grasped, and the strengths and weaknesses of electric vehicles can be assessed more accurately by consumers. Furthermore, the research holds significant importance for the development of the new energy vehicle industry, as it provides more accurate and valuable information. Sentiment analysis assists consumers in making rational decisions, thereby driving the growth of the electric vehicle industry.

2. Related Works

2.1. Sentiment Analysis

Sentiment analysis plays a crucial role in understanding consumer opinions, satisfaction, and needs, which, in turn, can facilitate product optimization and service improvement [20,21,22]. Additionally, sentiment analysis helps businesses gain insights into market feedback, competitive trends, brand reputation, loyalty, and identifying strengths and areas for improvement [23]. Promptly addressing negative public sentiment allows businesses to safeguard their brand image and reputation.
Recent research indicates that deep learning methods, leveraging large datasets to learn feature representations automatically, outperform traditional machine learning techniques. Li Yong et al. introduced a novel complementary fusion model for the text classification of food comments, combining Bidirectional Encoder Representations from Transformers (BERT), Convolutional Neural Networks, Bidirectional Long Short-Term Memory (BILSTM), and attention mechanisms, leading to significant improvements in classification accuracy [24]. Xiangsen Zhang et al. proposed a sentiment classification model based on Sliced Bidirectional Gated Recurrent Unit (Bi-GRU), multi-head self-attention mechanisms, and BERT embeddings, addressing issues such as word vector ambiguity, the inability to train recurrent neural networks in parallel, and low classification accuracy. The experimental results demonstrated high classification accuracy on the Yelp 2015 dataset and Amazon dataset, along with faster training compared to other models, validating its effectiveness [25]. Yang et al. [26] introduced ServeNet, a deep neural network model that combines BI-LSTM and stacked CNN for automatic service classification, demonstrating a strong performance on the dataset. Traditional methods (e.g., CNN, RNN, and LSTMs) employ context-independent word embedding methods (e.g., Word2Vec and GloVe) for encoding web service data, which has limitations due to fixed embedding vector positions. In contrast, the BERT model, based on Transformer, utilizes attention mechanisms to extract contextual text features, offering advantages in service classification. Traditional methods overlook word context in the text, while BERT considers it, further enhancing its performance. Praphula Kumar Jain et al. [27] proposed an extended BERT-DCNN model for sentiment analysis on social media. This model utilizes pretrained BERT language models to generate word embeddings and enhances the capture of local text features through an extended DCNN (deep Convolutional Neural Network) layer and global average pooling layer. The model’s simple structure enables efficient parallel processing, holding promise in the field of sentiment analysis on social media data. However, accurately distinguishing different sentiment tendencies in comments on new energy vehicles remains challenging due to the complexity of specialized vocabulary, incomplete context information, and the high volume of comments generated within short periods. To address this issue, deep learning techniques are applied to construct more detailed semantic correlations, aiming to overcome these challenges.

2.2. BERT Model

Figure 1 illustrates the architecture of the BERT network [28,29], a deep neural network that utilizes Transformer encoders to generate word embeddings, which are vector representations of text. Initially, BERT was pretrained by Google on extensive corpora, including datasets like BooksCorpus and Wikipedia. Google has made several pretrained BERT models publicly available in their code repository. In this study, an enhanced version of BERT called ERNIE is employed, incorporating improvements such as pretraining on larger corpora and the enhanced integration of entities and knowledge bases. The BERT-based version consists of 12 Transformer layers, each with 768 hidden units, 12 self-attention heads, and a total of 110 million trainable parameters [30].
The BERT model uses the [CLS] token to indicate the classification model, although it can be omitted for non-classification tasks. The [CLS] token acts as a separator, denoting the start and end of each sentence. By employing multiple layers of Transformer encoders, the model integrates the three types of embeddings mentioned earlier as inputs. These embeddings are subsequently processed to generate output embedding vectors, representing either a single sentence or a pair of sentences.
However, BERT has limitations when dealing with specialized vocabulary in Chinese new energy vehicle comments, as it may not encompass all domain-specific terms, and its context-independent representations may not accurately capture the contextual dependencies of specialized vocabulary. Therefore, additional domain-specific optimizations and adjustments may be necessary when handling such specialized vocabulary.

2.3. CNN Model

Convolutional Neural Networks (CNNs) are a type of feedforward neural network widely employed in image processing. In recent years, CNNs have also shown progress in the field of natural language processing (NLP). The NLP process, depicted in Figure 2, shares similarities with image processing and primarily involves convolutional layers, pooling layers, and fully connected layers [31]. The input to CNN channels is a text vector obtained through an embedding layer.
However, a single convolutional kernel can only extract features of a specific category, which may result in inadequate feature extraction. On the other hand, employing too many convolutional kernels can lengthen the model’s training time. Experimental results have indicated that the optimal model performance is achieved when utilizing three parallel CNN channels. The pooling layer comprises average pooling and max pooling. Average pooling reduces the amplification of variance caused by the limited neighborhood size, while max pooling mitigates the bias in the mean estimation induced by errors in convolutional layer parameters. The combination of these pooling techniques facilitates improved feature extraction, reducing errors in text feature extraction.
Although TextCNN is a straightforward and effective model, it still possesses limitations in handling lengthy texts, modeling semantic relationships, and comprehending domain-specific terms and contextual dependencies in sentiment analyses of new energy vehicle reviews. To overcome these limitations, it may be beneficial to consider combining other models or adopting more intricate deep learning models to enhance the performance of sentiment analysis.

3. The Proposed Model EDC
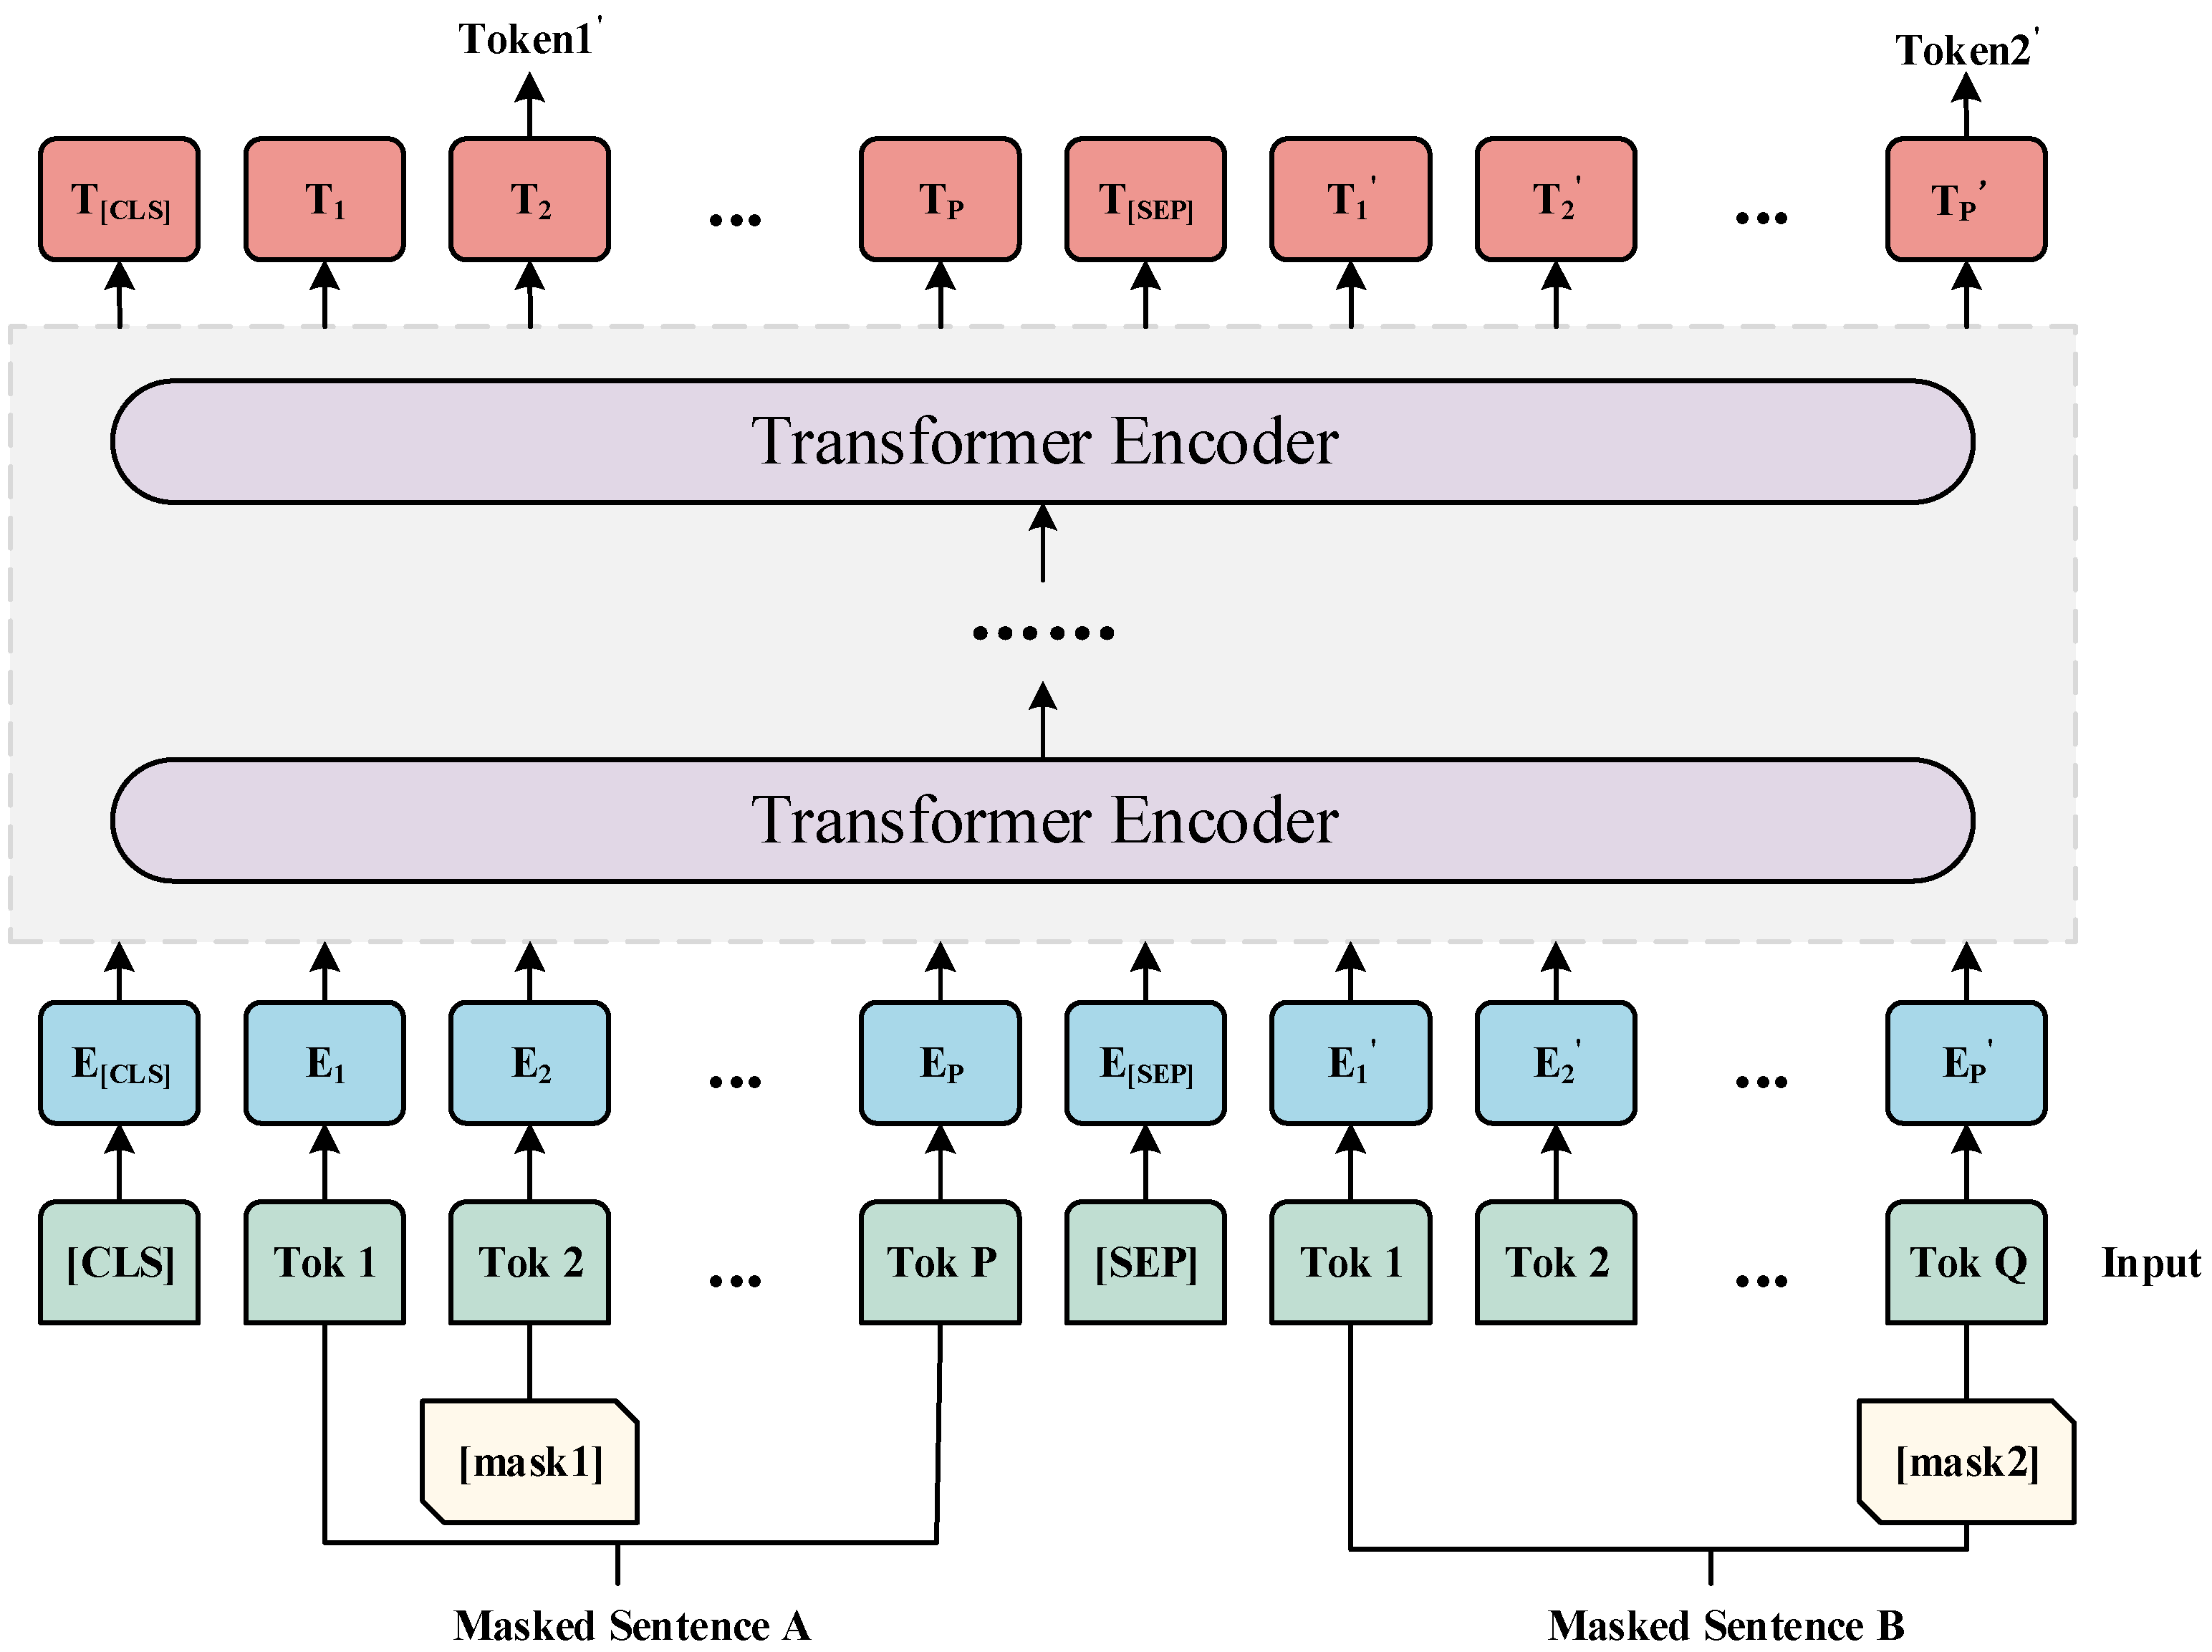
The EDC model combines ERNIE (Enhanced Representation through kNowledge IntEgration) and Convolutional Neural Networks (CNNs) to address challenges in analyzing new energy vehicle reviews. These challenges include incomplete contextual information, abrupt comments, and difficulty in identifying specialized vocabulary. To overcome the difficulty in recognizing specialized Chinese vocabulary, the model employs fine-tuned ERNIE. The issue of incomplete contextual information is tackled through a multi-layer CNN. Additionally, an attention mechanism is used to handle abrupt comments by assigning different weights to better distinguish sentiment.
The EDC model consists of three key components: the input layer, the feature extraction layer, and the output layer. The input layer preprocesses and vectorizes the data. After cleaning, the crawled data are fed into the ERNIE model, producing a sequence of word vectors. These word vectors serve as the input for the feature extraction layer, which consists of four parallel channels of convolutional and pooling layers. Max pooling is applied in the pooling layers. To enhance the model’s performance, a channel attention mechanism is introduced during the convolutional computation, assigning weights to different channels. This mechanism strengthens the contribution of relevant channel features while suppressing irrelevant ones, improving the model’s representation and performance. Finally, the extracted feature vectors are passed through the output layer for sentiment classification using softmax, completing the sentiment analysis process for new energy vehicle reviews.

3.1. ERNIE Model

Early text sentiment analysis methods encounter several issues when encoding information from sentiment comments about new energy vehicles:
  • Chinese words and phrases are semantically rich, often exhibiting polysemy and other challenges, which leads to inaccurate semantic representation in the encoded vectors.
  • Some automotive comments employ highly specialized vocabulary, making the text obscure and difficult to comprehend. The prevailing pretrained language model, BERT, has addressed problems related to the insufficient extraction of contextual semantics in traditional models. However, it still faces certain challenges in Chinese sentiment analyses of new energy vehicle comments, including unclear recognition of Chinese semantic concepts and limited Chinese representation capabilities.
ERNIE [32], an improved version of the BERT model, tackles these issues by introducing a significant amount of Chinese language corpus during pretraining and optimizing the masking mechanism. It incorporates two novel masking strategies: phrase-based masking and entity-based masking, which enhance its ability to capture long-term semantic dependencies and knowledge relationships. For instance, when given the input sentence “The design is good, I like it”, ERNIE treats the words “design” and “like” as individual units and applies a unified mask to them. This approach enables ERNIE to potentially learn more knowledge and longer semantic dependencies, resulting in better generalization of the model.
This article adopts the ERNIE (Enhanced Representation through kNowledge IntEgration) model as the corpus-encoding model. The overall structure of the ERNIE model is depicted in Figure 3. In the diagram, “Trm” represents the Transformer encoder, which leverages the self-attention mechanism [33,34] to quantitatively capture the interdependence among characters, effectively addressing contextual ambiguities. The vector representation [E1, E2, …, En] denotes the outcomes of embedding operations applied to the text within the ERNIE model. The embedding process comprises three essential components: (1) token embedding, which assigns vectors to individual characters in the token sequence and differentiates between sentences; (2) segment embedding, which distinguishes sentence boundaries in the character vector sequence and represents the sequence at the sentence level; and (3) position embedding, which signifies the position of each character in the vector sequence.
Initially, the Transformer converts each word in the sentence into an embedded representation, and subsequently, the ERNIE model utilizes attention mechanisms to capture the relationships among words. As depicted in Figure 4, the input representation X = (x1, x2, …, xn) passes through the self-attention layer, generating the output representation Y = (y1, y2, …, yn). Then, Y = (y1, y2, …, yn) undergoes processing in the feedforward neural network, resulting in the output representation ERNIE Z = (z1, z2, …, zn).
The Transformer encoder [35] comprises four essential components: word embedding and positional encoding, attention mechanism, layer normalization and residual connections, and feedforward neural network.
Word embedding and positional encoding are integral components of the Transformer encoder. These features encode positional information for each word in the text, enabling the Transformer to capture the relevance and temporal characteristics of individual words. This, in turn, contributes to improving the overall performance of the model.
X = E ( X ) P , X R b × l × d
In Equation (1), E is a matrix with rows representing the number of words. P represents the positional encoding vector, B corresponds to the number of text inputs in a batch, L represents the length of each text (seq_len), and D denotes the dimension of each word embedded into the matrix (embed_dim). By applying linear transformations according to Equations (2) and (3), we obtain a modified positional encoding P:
P ( p o s , 2 i ) = sin ( p o s / 1000 2 i / d m o d e l )
P ( p o s , 2 i + 1 ) = sin ( p o s / 1000 2 i + 1 / d m o d e l )
In the equations, “ p o s ” represents the position of a word in the text, and “i” denotes the corresponding vector dimension.
Attention mechanism: The attention mechanism allocates different weights to different input components based on their correlation with other parts of the input data. The attention mechanism can be mathematically represented using Equations (4) and (5), which illustrate how the weights are computed and applied. This approach enables the model to dynamically adjust its focus and selectively attend to the most relevant information, making it a widely adopted and effective technique in various fields, including natural language processing and computer vision.
Q = L i n e a r ( X ) = X w Q , K = L i n e a r ( X ) = X w K , V = L i n e a r ( X ) = X w V ,
In Equation (4) [36], the term “Linear” refers to a linear mapping operation that applies a linear transformation to the input text vector, denoted as X, using the associated weight parameters. More specifically, the weight parameters “WQ”, “WK”, and “WV” are utilized to linearly transform the query, key, and value, correspondingly. By performing these linear transformations, we obtain weighted representations of the query, key, and value, which are subsequently utilized to compute the attention weights.
X a t t e n t i o n = A t t e n t i o n ( Q , K , V ) = S o f t max ( Q K T d k ) V
In the given formula, Q represents the query vector, K represents the key vector, and V represents the value vector. d k represents the dimensions of the vectors. The formula involves calculating the dot product between the query vector and the key vector ( Q K T ), dividing the result by the square root of d k , applying the softmax function to obtain attention weights, and, finally, multiplying the attention weights with the value vector. This process generates a weighted representation that effectively captures the significance of different elements based on their relevance to the query.
Layer normalization and residual connections: Layer normalization and residual connections were proposed [37] to enhance the training process and performance of neural networks. Layer normalization, as depicted in Equation (6), normalizes the hidden layer to adhere to a standard normal distribution. This technique proves advantageous for handling variable-length sequence data and expediting model convergence during mini-batch training. On the other hand, residual connections, represented by Equations (9) and (10), tackle the issues of gradient vanishing and network degradation by introducing skip connections across layers. By incorporating residual connections, information can easily propagate between layers, facilitating more efficient training and improving network performance.
L a y e r N o r m ( x ) = a x i j u i σ i 2 + ε + β
In the equations, “ x i “ represents an element of the input feature vector, indicating that each element in the input feature vector is denoted by “ x i ”. “ u i ” represents the row-wise mean of the matrix computed in Equation (7), while “ σ i 2 ” represents the row-wise variance of the matrix calculated in Equation (8). The element-wise multiplication in the matrix is denoted by “⊙”, signifying that each element is multiplied individually. During model training, parameters α and β are used for additional computations, while “ε” is a small value added to the denominator to prevent division by zero.
μ i = 1 m i = 1 m x i j
σ i 2 = 1 m i = 1 m ( x i j μ i )
X = X e m b e d d i n g + A t t e n t i o n ( Q , K , V )
x = X + s u b L a y e r ( X )
The code snippet “ s u b L a y e r ( X ) ” represents the actual implementation of operations related to the sublayer.
Feedforward neural network. The feedforward neural network is an architecture consisting of multiple layers of interconnected neurons. Each layer processes the input from the previous layer through a sequence of linear transformations and nonlinear activation functions. To introduce nonlinearity into the model, the feedforward neural network adopts the rectified linear unit (ReLU) as its activation function. The output of the feedforward neural network can be calculated using the following formula:
X h i d d e n = Re L U ( L i n e a r ( X ) )
This article presents two improvements to the encoding structure of the ERNIE model in order to enhance its pretraining effectiveness and improve the encoding accuracy. Firstly, it increases the number of attention heads in each hidden layer of the ERNIE model from 12 to 16. This enhancement aims to enhance the precise encoding capability of text features, positional information, and weight information. Secondly, it raises the dropout rate (dropout value) in the hidden layers from 0.1 to 0.15, thereby improving the model’s generalization ability.

3.2. Deep CNN Model

CNN has significant advantages in sentiment analyses of text comments about new energy vehicles, especially when dealing with short texts and limited information. This is because CNN does not require maintaining state information in the feature sequence and can directly perform convolution operations on the text, resulting in more accurate feature representation. Additionally, in the domain of new energy vehicles, comments often involve a large number of specialized vocabularies, requiring domain-specific knowledge to understand the meanings of these terms. CNNs can leverage convolution operations to extract these key words from the text, further improving the accuracy of feature representation and enhancing the overall accuracy.
The proposed deep CNN module consists of a two-dimensional convolutional neural network (CNN), which includes convolutional layers (CONV), pooling layers (POOL), fully connected layers, and channel attention layers [38]. The convolutional layer analyzes the data by sliding windows and alters the data dimensions. The pooling layer is primarily used to select the optimal features, reducing the computation and improving the model’s generalization ability. The fully connected layer transforms the pooled two-dimensional features into one-dimensional feature vectors, and through iterative training, it performs classification from the input to output layers. The model also incorporates a channel attention mechanism, enabling the model to more flexibly model and adjust features, thereby enhancing the model’s expressive power and performance.
The deep CNN architecture transforms discrete text into continuous representations through alternating convolutional and downsampling layers, minimizing the data and computational requirements at each layer. Furthermore, the deep CNN utilizes four parallel convolutional layers and performs max pooling after each convolution to improve word-level embeddings and compress the sequence length. This approach enables the model to capture the relevance of comments and identify global semantic information in sentiment analyses of new energy vehicle comments. The design of the deep CNN structure is illustrated in Figure 5.
As the network deepens, its performance may degrade, resulting in lower training accuracy and the possibility of gradient vanishing. Research has shown that residual connections can effectively mitigate these issues.
In the deep CNN module, a residual network (ResNet) is employed to define the network structure within the _block method. The _block method constructs a deep Convolutional Neural Network by stacking multiple convolutional layers and incorporating residual connections. Specifically, the residual connection in the _block method is achieved by adding the input x to the output after the convolution operation. This residual connection enables more efficient gradient propagation, alleviating the problem of gradient vanishing in deep networks and enhancing the model’s training performance and representational capacity.
Furthermore, considering the incomplete contextual information and ambiguous sentiment tendencies often present in new energy vehicle reviews, which can lead to inaccurate analysis results, we introduce a text processing channel attention mechanism in the deep CNN module. The attention mechanism is generally viewed as a weight allocation mechanism that shows the available processing resources are biased towards the informative portions of the input data. In recent years, researchers have successfully applied attention mechanisms in various deep learning networks, achieving significant breakthroughs in domains such as image classification and natural language processing.
Specifically, in our model, the channel attention module takes the feature map x generated by the convolutional layers as the input, with the dimensions [batch_size, num_filters, seq_len, 1]. The module applies a series of steps to compute the channel attention weights, which are used to refine the feature representation. By incorporating the channel attention mechanism, the model can more effectively capture the important features in the input data and adjust the representation accordingly, thereby improving the model’s expressive power and performance.
(1)
Average Pooling and Max Pooling: Firstly, the extracted feature map matrix x is subjected to spatial dimension pooling using adaptive average pooling (avg_pool) and adaptive max pooling (max_pool). This compresses the feature map into the size of [batch_size, num_filters, 1, 1], resulting in an average value and a maximum value for each channel.
(2)
Fully Connected Layers: The two-dimensionally reduced one-dimensional vectors are separately passed through two fully connected layers, fc1 and fc2. fc1 reduces the input channel size to 1/16 of the original size and applies the ReLU activation function. fc2 restores the channel size to the original size. The outputs of fc1 and fc2 are then added together to obtain the outputs of the channel attention mechanism, avg_out and max_out. The avg_out and max_out are further added together to produce the final output of the channel attention mechanism, out.
(3)
Adding Contextual Information: The input feature map x is processed through two convolutional layers, conv1 and conv2, where conv1 has an output channel size of 1/2 of the input channels, and conv2 has the same output channel size as the input. The results of conv1 and conv2 are added to the input x to incorporate the contextual information.
(4)
Implementing Residual Connections: The output out of the channel attention mechanism is added to the input x to achieve residual connections.
(5)
Sequence Processing: The input feature map x is transformed from a feature map to a sequence. This is done by using the view and permute operations to flatten the height and width dimensions of the feature map into a one-dimensional sequence, with the batch size placed in the second dimension. The sequence feature x is then input into the BiGRU module (bigru), with an initial hidden state h0 set to a zero matrix. The BiGRU module processes the input sequence feature x and produces a new sequence feature x. The processed sequence feature x is then transformed back into the shape of the input feature map. This is achieved through dimension permutation and reshaping operations, resulting in a feature map with the same dimensions as the input x.
(6)
Residual Connections: The feature map x obtained after sequence processing is added to the previously obtained output of the residual connections to yield the final feature map output.
(7)
Output: The final feature map is passed through a global average pooling layer, which reduces the height and width dimensions to 1. The resulting feature map is then reshaped using the view operation into the shape of (batch_size, channels). This output is input into a fully connected layer, which maps the feature vector to the desired number of output classes. The softmax function is applied for classification purposes.
Here is the algorithm (Algorithm 1):
Algorithm 1: Algorithm EV Car review sentiment analysis channel attention
Input: Feature map processed by convolutional neural network (x)
Output: Feature map processed by channel attention mechanism (out)
1: avg_out = fully_connected_layer1(average_pooling(x))
2: max_out = fully_connected_layer1(max_pooling(x))
3: out = avg_out + max_out
4: context = convolutional_layer2(ReLU(convolutional_layer1(x)))
5: out += context
6: out = out + x
7: x = reshape(x)
8: h0 = initialize_hidden_state()
9: x, _ = BiGRU(x, h0)
10: x = reshape(x)
11: out = out + x
12: return sigmoid_activation(out)

3.3. EDC Model

The characteristics of sentiment analysis on text data for new energy vehicles include incomplete context, concise text length, and the presence of specialized vocabulary. To better capture the features of text regions, a region embedding layer can be utilized. This approach learns semantic information from different regions of automotive text, such as car model, price, brand, appearance, etc., thereby enhancing the accuracy of the sentiment analysis. To reduce the computational complexity, a fixed number of feature maps can be employed for downsampling. Given that text features often lack a clear hierarchical structure, this method satisfies the “semantic substitution” property, enabling the representation of high-dimensional semantics with lower dimensions, thus improving the model efficiency while preserving crucial semantic information.
For text sentiment analysis, equal-length convolution [39] can be employed to gather contextual information for each word. This technique compresses the contextual information of each word by considering its neighboring words, thereby enriching the semantic understanding of individual words. Additionally, a channel attention mechanism can be applied to the feature matrix generated by the convolutional layers. By utilizing channel attention, the network can automatically learn the importance of different channels, thereby enhancing the model’s ability to capture and model input data. Moreover, residual connections can address issues related to gradient vanishing and exploding, leading to improved training speed and accuracy. Residual connections allow gradients to bypass the impact of convolutional layer weights and flow directly through each block and the output layer without loss, resulting in better model training and improved accuracy in the sentiment analysis. The channel attention mechanism can be applied to the feature maps generated by the convolutional layers.
In this study, the dataset used is a sentiment dataset of new energy vehicle reviews, characterized by high noise, limited dimensional information, and unclear topics. The ERNIE pretrained model utilizes a large volume of Chinese data for unsupervised learning [40,41], thereby acquiring high-quality feature word vectors. Consequently, replacing the original word vectors with those generated by ERNIE can enhance the performance of the deep CNN model on the automotive review sentiment dataset, improve the model’s ability to capture text semantics, and mitigate collinearity issues associated with similar words.
The EDC model is a neural network used to identify and classify events in text data. To accomplish this task, the model utilizes the ERNIE algorithm, which generates unique word vectors for each word present in the input text. At the input layer, the EDC model feeds the input text through ERNIE to generate word vectors for each word in the text. These word vectors are then concatenated to form a matrix X, which serves as the input to the neural network.
X 1 : n = x 1 x 2 x n
The symbol ⊕ represents the operator used for concatenating word vectors. For a given sentence, Xi represents the word vector for the i-th word. If we have a sequence of word vectors from Xi to Xi+j, we can use the symbol Xi:i+j to denote this sequence. Therefore, Xi:i+j refers to the collection of word vectors that includes Xi, Xi+1, Xi+2, …, Xi+j.
The convolution process involves using a convolutional kernel W of size h to generate a feature Ci through the operation of equal-length convolution. The feature Ci is obtained by convolving the kernel W with the word vector sequence Xi:i+j, and it can be represented using the following formula:
C i = f ( W X i : i + h 1 + b )
To further process the features Ci generated from the convolution operation, a bias term b is added, and a nonlinear activation function f is applied. Specifically, the convolution process involves using a convolutional kernel W of size h to perform equal-length convolution, resulting in the feature Ci. After the convolution operation and nonlinear activation, a feature vector C = [C1, C2, …, CN] is obtained, which is then subjected to max pooling. The overall architecture of the EDC model proposed in this paper is illustrated in Figure 6.

3.4. Loss Function

In this study, a sentiment analysis is performed on the dataset of comments about new energy vehicles. It is observed that there are variations in the presence of sentiment-related words within the comment data. Moreover, the categories that represent positive and negative sentiment tendencies are not equally distributed across the dataset. This imbalance in class distribution can lead the model to prioritize easily classifiable samples during training, potentially neglecting the more challenging ones.
To address this issue, a Focal Loss function [42] is introduced to account for the varying difficulty levels of sample classification within the dataset. The standard categorical cross-entropy loss formula, as depicted in Equation (14), is refined and adapted to better handle the imbalanced nature of the dataset and to put more emphasis on difficult-to-classify samples.
C E ( p , y ) = log p , y = 1 log ( 1 p ) , y 1
The equation above represents the standard cross-entropy loss function, where CE denotes the cross-entropy, p represents the predicted probability, and y represents the label value. However, when dealing with imbalanced datasets, where one class has significantly more samples than the other, the standard cross-entropy loss function may be ineffective.
To address the issue of data imbalance in the cross-entropy loss function, a modified formula is proposed, as shown in Equations (15) and (16):
p t = p , y = 1 ( 1 p ) , y 1
F o c a l   L o s s = ( 1 p t ) γ log ( p t )
The experimental results presented in this study provide evidence that setting the adjustable parameter gamma (γ) to 2 yields the optimal performance for the Focal Loss function. By assigning greater weights to misclassified samples and lower weights to easily classified samples, this value effectively enables the model to concentrate on samples with ambiguous sentiment expressions and sentiment-related keywords within the automotive review dataset.
To accomplish this objective, the Focal Loss function is employed for the multi-class sentiment analysis. Equation (17) outlines the modified loss function, which is specifically tailored to meet the requirements of this task. By implementing this enhanced loss function, the model can effectively focus on samples featuring ambiguous sentiment expressions and sentiment-related keywords, thereby aiding in capturing subtle emotional nuances within the textual data.
F L = i = 0 n ( 1 p p ) γ p t × log ( p p )
Here, pp represents the predicted probability for class p, pt represents the corresponding label value, and gamma (γ) is the adjustable parameter that controls the degree of emphasis on difficult examples.

4. Experiment and Analysis

4.1. Experimental Environment

The model was trained in a Windows environment using the PyTorch framework. The training setup was equipped with an AMD Ryzen 7 5800 H processor, operating at a CPU frequency of 3.20 GHz. It had a memory capacity of 16.00 GB and was complemented by an RTX 3060 GPU. As shown in Table 1

4.2. Experimental Data

For this experiment, a total of 70,000 positive and negative comments were collected from multiple channels on automotive social media platforms. The data from news websites and e-commerce platforms were processed to create a clean and raw corpus. This involved removing annotations, mechanically compressing the texts, eliminating special characters, and stripping away semantic annotations.
The product review data in this study were manually annotated with sentiment categories, specifically positive and negative comments. To ensure the scientific rigor of the research, the experimental data were randomly split, with 80% used as the training set, 10% as the validation set, and the remaining 10% as the test set.
During the preprocessing of the service description text, several steps were taken. Firstly, a spell-checking process was applied to correct any spelling errors. Afterward, the dataset underwent stemming and lemmatization to identify and restore each word to its original form. Next, the text was converted to lowercase to obtain more accurate word vectors during training. In the case of English text, certain words such as “ah”, “the”, “of”, and punctuation marks are considered short and insignificant for text analysis. These stop words were removed using JIEBA segmentation. Finally, all service description texts were standardized to have the same length. A threshold was set, and if the text exceeded this length, it was truncated; if it was shorter, it was padded with zeros.
For this experiment, a maximum text length of 102 and an average text length of 34.12 were selected from the dataset. The results, as shown in Figure 7, demonstrated that using the average text length as the input length yielded better model performance. This was because the majority of comment data in the dataset consisted of short texts. Opting for a longer input length would necessitate filling the input with numerous zeros, resulting in reduced accuracy and increased processing time, ultimately impacting the model’s performance.

4.3. Evaluation Metrics

In this study, four evaluation metrics, namely Accuracy (Acc), Precision (Pre), Recall (Rec), and F1 score, are utilized to evaluate the performance of the model. Accuracy measures the ratio of correctly predicted samples to the total number of samples. It is a commonly used metric for overall performance, but it may not provide a complete understanding of the model’s ability to accurately classify samples across all categories. Precision (Pre) is a performance measure that quantifies the proportion of positively predicted samples that are correctly classified as positive in both the actual and predicted categories. This metric demonstrates the model’s ability to correctly identify positive samples while minimizing false-positive predictions. Recall (Rec) is another performance metric that gauges the ratio of positively classified samples to the total number of actual positive samples. The formulas for computing these metrics are presented in Equations (18)–(21) in the text. These evaluation metrics provide a comprehensive assessment of the model’s performance and can be utilized for comparing the performances of different models on the same dataset.
A c c = T P + T N T P + T N + F N + F P
P r e = T P T P + F P
R e c = T P T P + F N
F 1 = 2 × P r e × R e c P r e + R e c
In the equations [43], TP stands for true positives, which are the samples predicted as class A and are actually class A. FP represents false positives, which are the samples predicted as class A but are not actually class A. TN represents true negatives, which are the samples predicted as not class A and are actually not class A. FN stands for false negatives, which are the samples predicted as not class A but are actually class A.

4.4. Model Parameter Settings

The model-related parameters are shown in Table 2.

4.5. Baseline Model

Different word embedding methods can have varying impacts on text classification tasks. Word embedding is a technique that maps words in text to real-valued vectors, providing continuous and dense representations of discrete words as input features for text classification models. To evaluate the effectiveness of the model, representative models based on word2vec and BERT were chosen as baseline models for comparative experiments.
(a)
Word2vec-based Word Embedding Methods
FastText: FastText is a shallow neural network model used for text representation and classification. It aims to efficiently and rapidly process large-scale text data by leveraging word vectors.
TextCNN: TextCNN is a text classification model based on Convolutional Neural Networks. It utilizes convolutional operations to extract features from text data, enabling efficient text classification.
TextRCNN: TextRCNN combines the strengths of recurrent neural networks (RNNs) and Convolutional Neural Networks (CNNs) to capture contextual information and local features in text sequences, leading to efficient text classification.
TextRNN: TextRNN utilizes bidirectional LSTM networks to process information in both forward and backward directions, effectively incorporating contextual information from the text.
TextRNN_Att: After extracting features using recurrent neural networks, TextRNN_Att employs an attention mechanism to assign varying levels of importance to the extracted features. It then uses feature vectors with different attention weights for classification.
DPCNN: DPCNN is a text classification model based on Convolutional Neural Networks. It performs feature extraction on text through multiple layers of “pyramid convolution” operations, enabling efficient sentiment classification.
Transformer: The Transformer model is a deep neural network model based on the self-attention mechanism. It determines whether a given text expresses positive sentiment, negative sentiment, or neutral sentiment.
(b)
BERT-based Word Embedding Methods
BERT_CNN: The BERT_CNN model employs BERT as a feature extractor to capture contextual semantic representations of the text. These representations are then input into a CNN for local feature extraction and representation.
BERT_RNN: BERT is a pretrained language model based on self-supervised learning that effectively captures contextual information in text and generates contextual semantic representations. The BERT_RNN model combines the strengths of BERT’s contextual semantic representations with the sequence modeling capabilities of RNNs, resulting in enhanced performances for text processing tasks.
BERT_RCNN: BERT is a pretrained language model based on self-supervised learning, while RCNN is a text classification model based on Convolutional Neural Networks (CNNs) that extracts features from different positions in the text and employs fully connected layers for classification. By incorporating sliding windows and max pooling operations, RCNN captures local contextual information in the text.
BERT_DPCNN: This model combines the advantages of both BERT and DPCNN. By utilizing the contextual semantic representations generated by BERT within DPCNN, it obtains multi-level feature representations. This approach helps capture diverse levels of semantic information in the text, thereby boosting the model’s performance.

5. Experimental Results

In this section, we analyze and evaluate the performance of the models based on various metrics, including “Accuracy”, “Precision”, “Recall”, “F1 score”, and “Loss”. We conduct experiments using automotive reviews and utilize the confusion matrix to provide a comprehensive assessment of the model’s performance.

5.1. Loss Experimental Results

In order to assess the convergence of the proposed model during training, we conducted experiments using a dataset of sentiment reviews specifically collected for new energy vehicles. The model underwent multiple iterations across different epochs, and the corresponding Loss values were recorded. A comparative analysis of the Loss experiment was performed between our model and the word2vec-based and BERT-based word embedding models.
From Figure 8, it is evident that the Loss values obtained by different models across different epochs are visually represented using a radar chart. In the word2vec-based models, the Loss values exhibit some fluctuations in various epochs, particularly for TextCNN and TextRCNN. This suggests that these models are more sensitive during the initial stages of training but gradually stabilize in the subsequent epochs. In comparison, when compared to the BERT-based models, the EDC model consistently maintains relatively low Loss values throughout the entire training process, with minimal fluctuations. Notably, our EDC model, which incorporates the improved Focal Loss function, demonstrates significantly lower Loss values compared to other models that utilize standard cross-entropy loss. This clearly indicates the superior performance of our EDC model.

5.2. Comparison of Accuracy Experimental Results

In sentiment analysis tasks, accuracy (Acc) plays a vital role as a performance metric, playing a key role in evaluating the effectiveness and usability of sentiment analysis models. Acc helps assess the model’s ability to accurately predict sentiment polarity, thereby providing valuable insights into its performance. Higher Acc values indicate that the model can precisely classify sentiment in review texts, demonstrating a better understanding of the text’s emotional nuances. Figure 9 presents a comparative analysis of the accuracy results between the EDC model and the word2vec-based and BERT pretrained models, allowing for a comprehensive assessment of their accuracy performances.
Based on the accuracy plot shown in Figure 9, the following conclusions can be drawn:
When comparing the accuracy of the EDC model with models using word2vec as the pretraining method, it is evident that the TextCNN, DPCNN, and EDC models outperform the other models in terms of accuracy. These models exhibit higher and more stable accuracy growth. Notably, the EDC model demonstrates exceptional stability at the final data points, consistently maintaining a high accuracy level. This suggests that these models are adept at capturing the semantics and features of the text, resulting in improved accuracy. On the other hand, the TextRNN and Transformer models show relatively average performances. Their accuracy growth is more gradual, indicating the need for further optimization and additional training data to fully unlock their potential. This implies that these models may benefit from more extensive learning and adjustments to enhance the accuracy in text classification tasks. As for the TextRCNN and TextRNN_Att models, they fall in the middle, displaying moderate performances. Their accuracy performances are relatively average compared to the other models. However, the TextRNN_Att model incorporates an attention mechanism, which may offer advantages in handling long text sequences. The attention mechanism allows the model to focus on key words and contextual information, thereby enhancing the classification performance. Nevertheless, it still falls short of surpassing the EDC model’s performance.
When compared to models using BERT as the pretraining method, the EDC model consistently demonstrates superior accuracy across different training epochs. In the initial epoch (Epoch 1), the EDC model achieves a higher accuracy (97.19%) than the other four BERT-based models (BERT_CNN, BERT_RNN, BERT_RCNN, and BERT_DPCNN). As the training epochs progress, the accuracy of all models gradually improves and tends to converge. However, the EDC model consistently maintains a relatively high and stable accuracy (over 97%) in subsequent epochs, highlighting its competitive advantage in terms of accuracy.
In conclusion, based on the accuracy results, the EDC model exhibits exceptional performance, particularly in terms of stability and competitiveness, when compared to models using word2vec and BERT as the pretraining methods.

5.3. Precision Experimental Results Comparison

The objective of sentiment analysis is to identify the sentiment polarity expressed in text, which is typically categorized into positive, negative, and neutral classes. Sentiment analysis has extensive applications in various natural language processing tasks. Precision measures the accuracy of the model in predicting positive sentiment, specifically the ratio of correctly predicted positive sentiment samples to all samples predicted as positive sentiment.
Figure 10 illustrates a comparative analysis of the precision experimental results between the EDC model and models employing the word2vec and BERT pretraining methods.
Based on the precision results depicted in the graph, the EDC model demonstrates superior performance compared to the models using word2vec as the pretraining method. During the initial epoch (Epoch 1), the EDC model achieves a precision of 97.19%, slightly outperforming the other models. As the epochs progress, the EDC model exhibits a consistent improvement in precision and maintains a high level of precision (exceeding 97%) in subsequent epochs, showcasing a stable performance. The DPCNN model closely trails the EDC model in terms of precision, gradually enhancing its precision in later epochs, albeit peaking at 94.3%. On the other hand, the TextCNN, TextRCNN, TextRNN_Att, and Transformer models demonstrate commendable precision, but their highest precision values hover around 90%, placing them slightly behind the EDC model.
In comparison to models utilizing BERT as the pretraining method, the BERT_CNN, BERT_RNN, BERT_RCNN, and BERT_DPCNN models achieve precision levels of approximately 94% across different epochs, displaying substantial fluctuations. The BERT_RNN model exhibits a relatively stable performance and approaches the EDC model’s performance in later epochs, albeit slightly lower. Notably, the EDC model attains a precision of 97.19% in the first epoch, surpassing the initial precision of the other models. Moreover, the precision of the EDC model remains consistently high (around 97%) with minimal fluctuation, whereas the precision of other models exhibits larger fluctuations without a stable trend. Consequently, based on the precision analysis, the EDC model holds a distinct advantage compared to other models.

5.4. Recall Experimental Results Comparison

Recall is a crucial performance metric for evaluating sentiment classification models. A high recall value indicates the model’s ability to minimize false negatives and effectively capture positive sentiment instances, thereby enhancing the accuracy and reliability of the sentiment analysis. Evaluating the recall also helps gauge the model’s capability to recognize different sentiment classes, particularly in scenarios with imbalanced data distribution.
Figure 11 depicts a comparative analysis of the EDC model against models utilizing the word2vec and BERT pretraining methods in terms of recall.
Upon analyzing the recall rate graph, it is evident that the EDC model surpasses other models trained with word2vec in terms of the recall rate. Throughout all epochs, the EDC model consistently maintains a recall rate above 97%, reaching a peak of 97.42%. In contrast, other models like FastText, TextCNN, and TextRNN exhibit varying recall rates. For instance, the FastText model starts with a recall rate of 81.31% in Epoch 1 and improves to 89.93% by Epoch 8. The TextCNN model starts at 87.73% in Epoch 1 and increases to 93.59% by Epoch 8. Similarly, the TextRNN model begins at 52.93% in Epoch 1 and improves to 91.51% by Epoch 8. These models demonstrate significant enhancements in recall rates as training progresses.
When compared to models based on BERT, the EDC model showcases the superior performance in terms of the recall rate. Other models (BERT_CNN, BERT_RNN, BERT_RCNN, and BERT_DPCNN) exhibit relatively lower recall rates, peaking at around 94.86%. This indicates that the EDC model outshines other models when it comes to capturing a higher proportion of relevant sentiment instances in the automotive comment dataset. The EDC model exhibits robust feature extraction and representation capabilities when dealing with textual data, leading to remarkable performances in retrieval and identification tasks.

5.5. Comparison of F1 Score Experimental Results

The F1 score is a comprehensive metric that plays a vital role in evaluating the performance and effectiveness of a model in binary classification tasks. It combines precision and recall, providing a balanced measure of the model’s ability to correctly predict positive and negative instances. Precision measures the proportion of correctly predicted positive samples among all the samples predicted as positive, while recall measures the proportion of correctly predicted positive samples among all the true-positive samples. The F1 score calculates the weighted average of precision and recall, offering a holistic evaluation of the model’s performance.
Figure 12 illustrates a comparative analysis of F1 scores between the EDC model and models based on the word2vec and BERT pretraining methods.
Upon analyzing the graph of F1 scores, it is evident that the EDC model outperforms the other models based on word2vec. The EDC model consistently achieves the highest F1 scores across all epochs, with a peak value of 97.08, significantly surpassing the performances of the other models. In comparison to the other models, the EDC model demonstrates the superior performance in text classification tasks. It consistently outperforms models such as FastText, TextCNN, TextRCNN, TextRNN, TextRNN_Att, Transformer, and DPCNN in all epochs, particularly excelling in higher epochs.
When compared to models based on BERT pretraining, the EDC model exhibits the superior performance in terms of the F1 score. Throughout the training process, the EDC model consistently maintains a stable and outstanding performance, with the F1 scores consistently at a high level. While models such as BERT_CNN, BERT_RNN, BERT_RCNN, and BERT_DPCNN show some fluctuations in their performances across different epochs, occasionally approaching the performance of the EDC model, the EDC model overall demonstrates greater stability and proximity to the optimal level. Notably, the BERT_DPCNN model shows a significant performance improvement between Epoch 3 and Epoch 8, while the other BERT-based models exhibit relatively stable performances across different epochs. This indicates that the EDC model exhibits good adaptability in text classification tasks and maintains excellent performance throughout the entire training process.

5.6. Comprehensive Comparison of Experimental Evaluation Metrics

To further validate the efficacy of our model in sentiment classification tasks, we compare the accuracy (Acc), precision (Pre), recall (Rec), and F1 score of various emotions exhibited by the baseline models with our enhanced EDC model. The comparative results are presented in Table 3.
According to the table, the EDC model achieves an accuracy of 97.39%. In terms of precision, it demonstrates values of 0.9728 and 0.9749 for the NEG and POS categories, respectively. The recall rates for NEG and POS are 0.9753 and 0.9724, respectively. The corresponding F1 scores are 0.9740 and 0.9737. Comparing these results with the other baseline models, our proposed EDC model consistently outperforms them in all the evaluation metrics. This indicates that our model excels in accurately identifying sample labels and maintains a high recognition ability, especially for positive samples. The experimental findings highlight the superior classification performance and generalization ability of our model.
Additionally, Figure 13 and Figure 14 present the accuracy (acc) and loss rates (loss) of the EDC model on the training and validation sets. The model achieves an impressive accuracy of 98.82% on the training set and 97.45% on the validation set. As training progresses, the loss values steadily decrease, reaching 0.02661 for the training set and 0.08762 for the validation set. These values significantly outperform the other baseline models, indicating the effectiveness and efficiency of our proposed model. Overall, our model surpasses other models across various evaluation metrics, showcasing its ability to capture essential data features and enhance the effectiveness of automotive reviews.
Table 4 provides an overview of the confusion matrix for the EDC model, showcasing the quantities of true positives, true negatives, false positives, and false negatives. Specifically, the model achieved accurate classification for 3384 out of 3480 negative emotions and 3433 out of 3450 positive emotions, demonstrating its high precision in identifying positive and negative sentiments within the dataset.

6. Conclusions

In this study, an algorithm for sentiment analysis is proposed, utilizing a combination of the ERNIE and deep CNN models. The approach involves extracting sentiment word-level feature vectors from new energy vehicle reviews using the enhanced ERNIE model. Subsequently, a deep CNN network is employed to hierarchically extract features from these vectors. The deep CNN architecture utilizes alternating convolutional layers and downsampling layers to transform discrete text into continuous representations, thereby minimizing the data and computational requirements at each layer. To enhance word-level embeddings and compress the sequence length, parallel convolutional layers are introduced, and max pooling is applied after each convolution. Channel attention mechanisms are also incorporated to allocate processing resources to informative parts of the input data, enabling the model to capture the relevance of comments and identify global semantic information in the sentiment analysis. To address class imbalance, the Focal Loss function is utilized, which downweighs easily classifiable samples, allowing the model to focus more on feature word samples with ambiguous sentiment expressions and the sentiments of automotive review features. The performance of the improved model in the sentiment analysis for electric vehicles is evaluated through experiments conducted on a curated dataset comprising a large number of new energy vehicle reviews. The dataset is partitioned into training, validation, and testing sets, with the training set used for model parameter training, the validation set for hyperparameter selection and model optimization, and the testing set for evaluating the model’s performance.
The experimental results demonstrate that the improved model achieves outstanding performance in the sentiment analysis for electric vehicles, as evidenced by key metrics such as accuracy, precision, and the F1 score. High accuracy is observed on the testing set, indicating the model’s capacity to accurately predict the sentiment orientation expressed in electric vehicle reviews. Exceptional precision is demonstrated, with the accurate identification of positive, negative, and neutral sentiments in electric vehicle reviews. The F1 score, which combines precision and recall, further highlights the model’s strong performance in identifying sentiment orientation. Overall, the experimental findings support the conclusion that the improved algorithm represents a significant advancement in sentiment analysis for electric vehicles. It exhibits enhanced capabilities in accurately analyzing and predicting sentiment orientation in new energy vehicle reviews, showcasing commendable performances in sentiment analysis tasks. These findings provide compelling evidence of the effectiveness and potential of the algorithm in real-world applications.
While significant progress has been made in this research, there are still opportunities for improvement. Future work will explore advanced model fusion methods at a deeper level and simplify model parameters to reduce complexity. The applicability of the approach in different domains will be investigated to validate its generalization performance on diverse datasets, including multilingual datasets. Additionally, techniques for identifying and eliminating fraudulent reviews will be researched to enhance data quality. The goal is to improve the accuracy of the model by exploring additional sentiment categories and incorporating relevant concepts, expanding the scope of the research on the applicability of sentiment analysis models.

Author Contributions

Conceptualization, M.W. and H.Y.; data curation, M.W. and X.S.; formal analysis, M.W., H.Y., X.S. and Z.W.; methodology, M.W.; project administration, H.M.; resources, M.W. and H.M.; software, M.W.; supervision, H.M.; validation, M.W., H.Y., X.S. and Z.W.; visualization, M.W.; writing—original draft, M.W.; and writing—review and editing, H.M. and M.W. All authors have read and agreed to the published version of the manuscript.

Funding

This work was supported by the Natural Science Foundation of Heilongjiang Province, China (Grant No. YQ2020F012), and National Defense Project, although involved in secret (Grant No. 514010*****).

Institutional Review Board Statement

Not applicable.

Informed Consent Statement

Not applicable.

Data Availability Statement

Data available on request due to restrictions such as privacy or ethical reasons. The data presented in this study are available on request from the corresponding author. The data are not publicly available due to the support provided by a defense project and its sensitive nature.

Conflicts of Interest

The authors declare no conflict of interest.

References

  1. Andreopoulou, Z.; Koliouska, C.; Galariotis, E.; Zopounidis, C. Renewable energy sources: Using PROMETHEE II for ranking websites to support market opportunities. Technol. Forecast. Soc. Chang. 2018, 131, 31–37. [Google Scholar] [CrossRef]
  2. Mopidevi, S.; Narasipuram, R.P.; Aemalla, S.R.; Rajan, H. E-mobility: Impacts and analysis of future transportation electrification market in economic, renewable energy and infrastructure perspective. Int. J. Powertrains 2022, 11, 264–284. [Google Scholar] [CrossRef]
  3. Chen, Y.-J.; Chen, Y.M. Online Information-based Product Evolution Course Mining and Prediction. Int. J. Inf. Technol. Decis. Mak. 2023, 1–29. [Google Scholar] [CrossRef]
  4. Narasipuram, R.P.; Mopidevi, S. A technological overview & design considerations for developing electric vehicle charging stations. J. Energy Storage 2021, 43, 103225. [Google Scholar]
  5. Zhang, X.; Wen, S.; Yan, L.; Feng, J.; Xia, Y. A Hybrid-Convolution Spatial–Temporal Recurrent Network for Traffic Flow Prediction. Comput. J. 2022, bxac171. [Google Scholar] [CrossRef]
  6. Zhang, S.; Zhou, Z.; Luo, R.; Zhao, R.; Xiao, Y.; Xu, Y. A low-carbon, fixed-tour scheduling problem with time windows in a time-dependent traffic environment. Int. J. Prod. Res. 2022, 1–20. [Google Scholar] [CrossRef]
  7. Zhang, X.; Wang, Y.; Yuan, X.; Shen, Y.; Lu, Z.; Wang, Z. Adaptive Dynamic Surface Control with Disturbance Observers for Battery/Supercapacitor-based Hybrid Energy Sources in Electric Vehicles. IEEE Trans. Transp. Electrif. 2022. [Google Scholar] [CrossRef]
  8. Chen, Y. Research on collaborative innovation of key common technologies in new energy vehicle industry based on digital twin technology. Energy Rep. 2022, 8, 15399–15407. [Google Scholar] [CrossRef]
  9. Qu, Z.; Liu, X.; Zheng, M. Temporal-Spatial Quantum Graph Convolutional Neural Network Based on Schrödinger Approach for Traffic Congestion Prediction. IEEE Trans. Intell. Transp. Syst. 2022. [Google Scholar] [CrossRef]
  10. Jiang, S.; Zhao, C.; Zhu, Y.; Wang, C.; Du, Y. A Practical and Economical Ultra-wideband Base Station Placement Approach for Indoor Autonomous Driving Systems. J. Adv. Transp. 2022, 2022, 3815306. [Google Scholar] [CrossRef]
  11. Huang, C.; Han, Z.; Li, M.; Wang, X.; Zhao, W. Sentiment evolution with interaction levels in blended learning environments: Using learning analytics and epistemic network analysis. Australas. J. Educ. Technol. 2021, 37, 81–95. [Google Scholar] [CrossRef]
  12. Liu, X.; He, J.; Liu, M.; Yin, Z.; Yin, L.; Zheng, W. A Scenario-Generic Neural Machine Translation Data Augmentation Method. Electronics 2023, 12, 2320. [Google Scholar] [CrossRef]
  13. Khan, F.M.; Khan, S.A.; Shamim, K.; Gupta, Y.; Sherwani, S.I. Analysing customers’ reviews and ratings for online food deliveries: A text mining approach. Int. J. Consum. Stud. 2022, 47, 953–976. [Google Scholar] [CrossRef]
  14. Aljuaid, H.; Iftikhar, R.; Ahmad, S.; Asif, M.; Afzal, M.T. Important citation identification using sentiment analysis of in-text citations. Telemat. Inform. 2021, 56, 101492. [Google Scholar] [CrossRef]
  15. Verma, S. Sentiment analysis of public services for smart society: Literature review and future research directions. Gov. Inf. Q. 2022, 39, 101708. [Google Scholar] [CrossRef]
  16. Ranjbar, M.; Effati, S. Symmetric and right-hand-side hesitant fuzzy linear programming. IEEE Trans. Fuzzy Syst. 2019, 28, 215–227. [Google Scholar] [CrossRef]
  17. Gharzouli, M.; Hamama, A.K.; Khattabi, Z. Topic-based sentiment analysis of hotel reviews. Curr. Issues Tour. 2022, 25, 1368–1375. [Google Scholar] [CrossRef]
  18. Vidanagama, D.; Silva, A.; Karunananda, A. Ontology based sentiment analysis for fake review detection. Expert Syst. Appl. 2022, 206, 117869. [Google Scholar] [CrossRef]
  19. Kaur, G.; Sharma, A. A deep learning-based model using hybrid feature extraction approach for consumer sentiment analysis. J. Big Data 2023, 10, 5. [Google Scholar] [CrossRef]
  20. Çalı, S.; Balaman, Ş.Y. Improved decisions for marketing, supply and purchasing: Mining big data through an integration of sentiment analysis and intuitionistic fuzzy multi criteria assessment. Comput. Ind. Eng. 2019, 129, 315–332. [Google Scholar] [CrossRef]
  21. Iqbal, A.; Amin, R.; Iqbal, J.; Alroobaea, R.; Binmahfoudh, A.; Hussain, M. Sentiment Analysis of Consumer Reviews Using Deep Learning. Sustainability 2022, 14, 10844. [Google Scholar] [CrossRef]
  22. Xiao, Y.; Li, C.; Thürer, M.; Liu, Y.; Qu, T. User preference mining based on fine-grained sentiment analysis. J. Retail. Consum. Serv. 2022, 68, 103013. [Google Scholar] [CrossRef]
  23. Hsu, T.-H.; Chen, C.-H.; Liao, W.-C. A Fuzzy MCDM Analytic Model for Building Customers’ Brand Attachment Preference in Car Firms. Int. J. Fuzzy Syst. 2021, 23, 2270–2282. [Google Scholar] [CrossRef]
  24. Yong, L.; Xiaojun, Y.; Yi, L.; Ruijun, L.; Qingyu, J. A new emotion analysis fusion and complementary model based on online food reviews. Comput. Electr. Eng. 2022, 98, 107679. [Google Scholar] [CrossRef]
  25. Zhang, X.; Wu, Z.; Liu, K.; Zhao, Z.; Wang, J.; Wu, C. Text Sentiment Classification Based on BERT Embedding and Sliced Multi-Head Self-Attention Bi-GRU. Sensors 2023, 23, 1481. [Google Scholar] [CrossRef]
  26. Yang, Y.; Ke, W.; Wang, W.; Zhao, Y. Deep learning for web services classification. In Proceedings of the 2019 IEEE International Conference on Web Services (ICWS), Milan, Italy, 8–13 July 2019; pp. 440–442. [Google Scholar]
  27. Jain, P.K.; Quamer, W.; Saravanan, V.; Pamula, R. Employing BERT-DCNN with sentic knowledge base for social media sentiment analysis. J. Ambient. Intell. Humaniz. Comput. 2022, 14, 10417–10429. [Google Scholar] [CrossRef]
  28. Cui, Y.; Che, W.; Liu, T.; Qin, B.; Yang, Z. Pre-training with whole word masking for chinese bert. IEEE/ACM Trans. Audio Speech Lang. Process. 2021, 29, 3504–3514. [Google Scholar] [CrossRef]
  29. Yates, A.; Nogueira, R.; Lin, J. Pretrained transformers for text ranking: BERT and beyond. In Proceedings of the 14th ACM International Conference on Web Search and Data Mining, Online, 8–12 March 2021; pp. 1154–1156. [Google Scholar]
  30. Kim, K.; Park, S. AOBERT: All-modalities-in-One BERT for multimodal sentiment analysis. Inf. Fusion 2023, 92, 37–45. [Google Scholar] [CrossRef]
  31. Yang, X.; Li, Y.; Li, Q.; Liu, D.; Li, T. Temporal-spatial three-way granular computing for dynamic text sentiment classification. Inf. Sci. 2022, 596, 551–566. [Google Scholar] [CrossRef]
  32. Li, Z.; Ren, J. Fine-tuning ERNIE for chest abnormal imaging signs extraction. J. Biomed. Inform. 2020, 108, 103492. [Google Scholar] [CrossRef]
  33. Cheng, K.; Yue, Y.; Song, Z. Sentiment Classification Based on Part-of-Speech and Self-Attention Mechanism. IEEE Access 2020, 8, 16387–16396. [Google Scholar] [CrossRef]
  34. Li, Q.; Yao, N.; Zhao, J.; Zhang, Y. Self attention mechanism of bidirectional information enhancement. Appl. Intell. 2021, 52, 2530–2538. [Google Scholar] [CrossRef]
  35. Bae, J.; Lee, C. Korean Semantic Role Labeling with Bidirectional Encoder Representations from Transformers and Simple Semantic Information. Appl. Sci. 2022, 12, 5995. [Google Scholar] [CrossRef]
  36. Hao, S.; Zhang, P.; Liu, S.; Wang, Y. Sentiment recognition and analysis method of official document text based on BERT–SVM model. Neural Comput. Appl. 2023, 1–12. [Google Scholar] [CrossRef]
  37. Kawaguchi, K.; Bengio, Y. Depth with nonlinearity creates no bad local minima in ResNets. Neural Netw. 2019, 118, 167–174. [Google Scholar] [CrossRef]
  38. Qian, K.; Tian, L. A topic-based multi-channel attention model under hybrid mode for image caption. Neural Comput. Appl. 2021, 34, 2207–2216. [Google Scholar] [CrossRef]
  39. Lu, Y.; Yuan, M.; Liu, J.; Chen, M. Research on semantic representation and citation recommendation of scientific papers with multiple semantics fusion. Scientometrics 2023, 128, 1367–1393. [Google Scholar] [CrossRef]
  40. Loewenstein, Y.; Raviv, O.; Ahissar, M. Dissecting the roles of supervised and unsupervised learning in perceptual discrimination judgments. J. Neurosci. 2021, 41, 757–765. [Google Scholar] [CrossRef]
  41. Sakai, Y.; Itoh, Y.; Jung, P.; Kokeyama, K.; Kozakai, C.; Nakahira, K.T.; Oshino, S.; Shikano, Y.; Takahashi, H.; Uchiyama, T.; et al. Training Process of Unsupervised Learning Architecture for Gravity Spy Dataset. Ann. Phys. 2022, 2200140. [Google Scholar] [CrossRef]
  42. He, K.; Gkioxari, G.; Dollár, P.; Girshick, R. Mask r-cnn. In Proceedings of the IEEE International Conference on Computer Vision, Venice, Italy, 22–29 October 2017; pp. 2961–2969. [Google Scholar]
  43. Liu, N.; Zhao, J. A BERT-Based Aspect-Level Sentiment Analysis Algorithm for Cross-Domain Text. Comput. Intell. Neurosci. 2022, 2022, 8726621. [Google Scholar] [CrossRef]
Figure 1. BERT model input structure.
Applsci 13 08176 g001
Figure 2. Schematic diagram of the TextCNN model structure.
Applsci 13 08176 g002
Figure 3. Schematic diagram of the ERNIE model structure.
Applsci 13 08176 g003
Figure 4. Transformer encoder structure.
Applsci 13 08176 g004
Figure 5. Schematic diagram of deep CNN architecture.
Applsci 13 08176 g005
Figure 6. Overall architecture of the EDC model.
Applsci 13 08176 g006
Figure 7. Dataset analysis graph.
Applsci 13 08176 g007
Figure 8. Comparison of loss values between EDC and different models. (a) Comparison with word2vec word embedding model. (b) Comparison with BERT word embedding model.
Applsci 13 08176 g008
Figure 9. Comparison of accuracy (Acc) values between EDC and different models. (a) Comparison with word2vec word embedding model. (b) Comparison with BERT word embedding model.
Applsci 13 08176 g009
Figure 10. Comparison of precision (Pre) values between EDC and different models. (a) Comparison with word2vec word embedding model. (b) Comparison with BERT word embedding model.
Applsci 13 08176 g010
Figure 11. Comparison of recall (Recall) values between EDC and different models. (a) Comparison with word2vec word embedding model. (b) Comparison with BERT word embedding model.
Applsci 13 08176 g011
Figure 12. Comparison of F1 scores between EDC and different models. (a) Comparison with word2vec word embedding model. (b) Comparison with BERT word embedding model.
Applsci 13 08176 g012
Figure 13. Accuracy (acc) on the validation and training sets.
Applsci 13 08176 g013
Figure 14. Loss rate (loss) on the validation and training sets.
Applsci 13 08176 g014
Table 1. Required environment for model software and hardware.
ProjectsConfiguration
Operating PlatformsCUDA 11.2/CUDNN8.1
Operating SystemWindows 10
Memory16 GB
Python VersionsPython 3.7.0
PyTorch VersionsPyTorch 1.9.1
Table 2. Model-related parameter settings.
Parameter NameParameter Vaule
Maximum sentence length128
Batch size64
Transformer layers12
Transformer number of hidden neurons768
Learning rate0.00001
Maximum number of iterations100
Optimization methodsAdam
Table 3. Comparison of Acc, Pre, Recall, and F1 scores for different emotion polarities among the models.
AlgorithmsAccuracyPrecisionPrecisionRecallRecallF1 ScoreF1 Score
NEGPOSNEGPOSNEGPOS
FastText86.63%0.86750.86510.86650.86610.86700.8656
TextCNN91.60%0.90880.92360.92590.90600.91730.9147
TextRCNN89.70%0.89590.89810.89970.89430.89780.8962
TextRNN84.77%0.88220.81850.80450.89140.84160.8534
TextRNN_Att89.19%0.88300.90130.90480.87870.89380.8899
Transformer87.79%0.89840.85910.85370.90230.87550.8802
DPCNN93.57%0.93140.94020.94150.92990.93640.9350
BERT_CNN94.27%0.93920.94640.94740.93790.94330.9421
BERT_RNN94.36%0.94000.94720.94830.93880.94410.9430
BERT_RCNN94.63%0.94080.95200.95310.93940.94690.9456
BERT_DPCNN94.49%0.93990.95000.95110.93850.94550.9442
EDC97.39%0.97280.97490.97530.97240.97400.9737
Table 4. Comparison of confusion matrices for different models.
AlgorithmsTPFPTNFN
FastText30504663014470
TextCNN32593273153261
TextRCNN31673683112353
TextRNN30293593121301
TextRNN_Att31854223058335
Transformer30053403140515
DPCNN33142443236206
BERT_CNN33352163264185
BERT_RNN33382133267182
BERT_RCNN33542183261166
BERT_DPCNN33482143266172
EDC343396338487
Disclaimer/Publisher’s Note: The statements, opinions and data contained in all publications are solely those of the individual author(s) and contributor(s) and not of MDPI and/or the editor(s). MDPI and/or the editor(s) disclaim responsibility for any injury to people or property resulting from any ideas, methods, instructions or products referred to in the content.

