Article

Effect of Superhydrophobic Nano-SiO2 on the Hydraulic Conductivity of Expansive Soil and Analysis of Its Mechanism

1
State Key Laboratory of Geomechanics and Geotechnical Engineering, Institute of Rock and Soil Mechanics, Chinese Academy of Sciences, Wuhan 430071, China
2
University of Chinese Academy of Sciences, Beijing 100049, China
*
Author to whom correspondence should be addressed.
Appl. Sci. 2023, 13(14), 8198; https://doi.org/10.3390/app13148198
Submission received: 11 June 2023 / Revised: 7 July 2023 / Accepted: 12 July 2023 / Published: 14 July 2023

Abstract

:
The present work determined the influence of superhydrophobic nano-SiO2 on the hydraulic conductivity and pore size distribution of expansive soil, and analysed the mechanism of modification between superhydrophobic nano-SiO2 and expansive soil from a microscopic view. Superhydrophobic nano-SiO2 was added to expansive soil as a modifier. Our samples were of two types, i.e., unmodified (without nano-SiO2) and modified (with 0.2%, 0.4%, 0.6%, 0.8%, and 1.0% nano-SiO2 by weight of the parent soil). The hydraulic conductivity decreased with increasing nano-SiO2 content. Fourier transform mid-infrared test revealed that some silanols in soil and nano-SiO2 were dehydrated and condensed to form siloxanes. We inferred that nano-SiO2 can attach onto the surface of soil particles to form a hydrophobic membrane, which reduced the soil expansion and the change in pore size distribution. And microscopic tests showed that the pore volume and hydrophilicity of the soil samples decreased with increasing SiO2 content. According to the Young–Laplace equation, the minimum permeable pore radius was calculated in the hydraulic-conductivity test. With increasing nano-SiO2 content, the volume of permeable pore decreased. It had an excellent linear relationship with the hydraulic conductivity and permeable pore volume of samples containing different nano-SiO2 contents. Therefore, superhydrophobic nano-SiO2 could effectively reduce hydraulic conductivity by changing the pore size distribution of expansive soil.

1. Introduction

Expansive soils can cause deformation and failure of civil engineering structure and geological environment engineering, such as pavements and slopes [1,2]. Hydraulic conductivity, as one of the most essential engineering characteristics of expansive soil, is closely correlated with the strength and deformation of expansive soil and significantly influences engineering construction [3]. Expansive soil slopes and subgrades often fail repeatedly under rainfall-infiltration conditions. Modifying and replacing expansive soil is often considered an economic solution to this problem [4]. Researchers believe that the replacement soil has to be of low hydraulic conductivity to prevent a bathtub effect and inhibit the moistening of the underlying expansive soil [5]. Thus, the modified materials and the hydraulic conductivity of expansive soil are essential for geotechnical engineering.
At present, lime is commonly used as an expansive soil modified material. Lime is a strong alkaline material. And if its added amount is high, it will destroy the acid–base balance of the soil and cause soil hardening. Several studies have shown that the addition of nanomaterials to soil can reduce hydraulic conductivity [6,7,8,9]. Kananizadeh [6] found that the hydraulic conductivity of raw clay was reduced by adding 4% nanoclay. Ng and Coo [7] studied that 2% Al2O3 and nano-CuO can decrease the hydraulic conductivity of clay by 30% and 45%, respectively. Taha and Taha [8] showed that nanomaterials (nano-copper and nano-alumina) can reduce the hydraulic conductivity of compacted soil–bentonite mixture with different plasticity indexes. Gallagher and Lin [9] found that silica nanomaterials can increase soil cohesion/adhesiveness and reduce soil hydraulic conductivity. The modifier used in the current research was superhydrophobic nano-SiO2. As an inorganic micro-/nanofiller, nano-SiO2 has excellent mechanical properties and is an important raw material for preparing large-scale industrial applications of superhydrophobic materials. Given its hydrophobic properties, it is gradually being used to treat expansive soils. Nano-SiO2 is an environmentally friendly material, which is consistent with the main component in soil. Micro-addition does not change the PH value of the soil, and does not cause soil hardening. However, using superhydrophobic nano-SiO2 as a soil modifier is not common. Few studies have been conducted on using hydrophobic silica to modify expansive soil. The mechanism of superhydrophobic nano-SiO2 changing the hydraulic conductivity of expansive soil remains unknown.
According to the relevant literature, the hydraulic conductivity of clays depends, in part, on their mineralogy, cation valence, and cation exchange capacity, as well as their structure through clay layer orientation at the atomic scale and through particle and pore distribution at the aggregate scale [10].
For clayey soils, pore size distribution (PSD) is the main characterisation of soil physical form and structure and is associated with the hydraulic conductivity of soil [11,12]. The microstructure characteristics of soil are the basis for theoretical research and provide reasonable explanations for many macroscopic phenomena [13]. However, given the special properties of expansive soil, such as shrinkage and swelling, research on the hydraulic conductivity of expansive soil is more complicated than those on other clays. Moreover, analysing expansive soil from a microscopic point of view is difficult. The common test methods to obtain soil PSD include mercury injection porosimetry (MIP) and nuclear magnetic resonance (NMR) analyses. The principle of the MIP method is to press mercury into the pores and measure the volume of mercury entering under different pressures to calculate pore radius. Although this method is theoretically feasible, pressing mercury into extremely fine pores and blind ends is difficult, and certain test errors are inevitable. NMR is applied in the microstructure detection of porous media because of its rapidity, efficiency, and non-destructiveness [14].
Previous tests show that after adding superhydrophobic nano-SiO2, the shrinkage and expansion rate of expansive soil decrease, and the UCS of expansive soil increases. Moreover, superhydrophobic nano-SiO2 can inhibit the cracking of expansive soil during shrinkage [15]. Expansive soil modified by superhydrophobic nano-SiO2 may be used as replacement soil to inhibit soil cracking, reduce the permeability of shallow soil, and improve the mechanical properties and stability of expansive soil slope.
The present study aimed to investigate the effect of different contents of superhydrophobic nano-SiO2 on the hydraulic conductivity and PSD of expansive soil, as well as analyse the mechanism of superhydrophobic nano-SiO2 and expansive soil minerals that changes the hydraulic conductivity of expansive soil from a microscopic view. The influence of superhydrophobic nano-SiO2 on the hydraulic conductivity of expansive soil was obtained via hydraulic-conductivity tests. The pore distribution of samples after the hydraulic-conductivity test was calculated using the T 2 spectrums obtained from the NMR test. Then, the effect of superhydrophobic nano-SiO2 on the PSD of expansive soil was further analysed. Fourier transform mid-infrared (FTIR) spectroscopy was used to determine whether the soil reacted after adding superhydrophobic nano-SiO2. The hydrophilic change of the soil sample after adding superhydrophobic nano-SiO2 was obtained via the contact-angle test. Thermogravimetric analysis (TGA) provided the thermal properties of the soil samples and the mass loss of the sample was calculated with respect to the increase in temperature. The effect of the pore distribution on the hydraulic conductivity of the expansive soil was also analysed through the test results and the Young–Laplace equation. This work could be a basis of the application of nanomodified expansive soil in civil-engineering structures and geoenvironmental projects.

2. Materials and Methods

2.1. Materials

Soil was collected from Nanyang City, Henan Province, China. Figure 1 shows the grain compositions of soil. The contents of montmorillonite, quartz, and albite in soil were 23.61%, 60%, and 16.39%, respectively. The properties of soil are presented in Table 1 [16,17,18].
Superhydrophobic nano-SiO2 (Tansail Company, Nanjing, China) as a modifier was an insoluble material. The retail price of superhydrophobic nano-SiO2 is about USD 2 per kilogram. The physical and chemical properties of hydrophobic nano-SiO2 are presented in Table 2 and Table 3, respectively. The contact angle of superhydrophobic nano-SiO2 was larger than 150° [19].

2.2. Sample Preparation

In this study, the researchers utilized three types of samples: unmodified (without nano-SiO2), hydrophilic nano-SiO2-modified, and hydrophobic nano-SiO2-modified soils. The soil samples were further divided into 6 groups consisting of unmodified soil, and 5 groups comprising modified soil with hydrophobic nano-SiO2 (the content was 0.2%, 0.4%, 0.6%, 0.8%, and 1.0%, respectively) [15]. Soil specimens were mixed with the optimum water content of 18% and compacted to a dry density of 1.78 g/cm3.

2.3. Test Methods

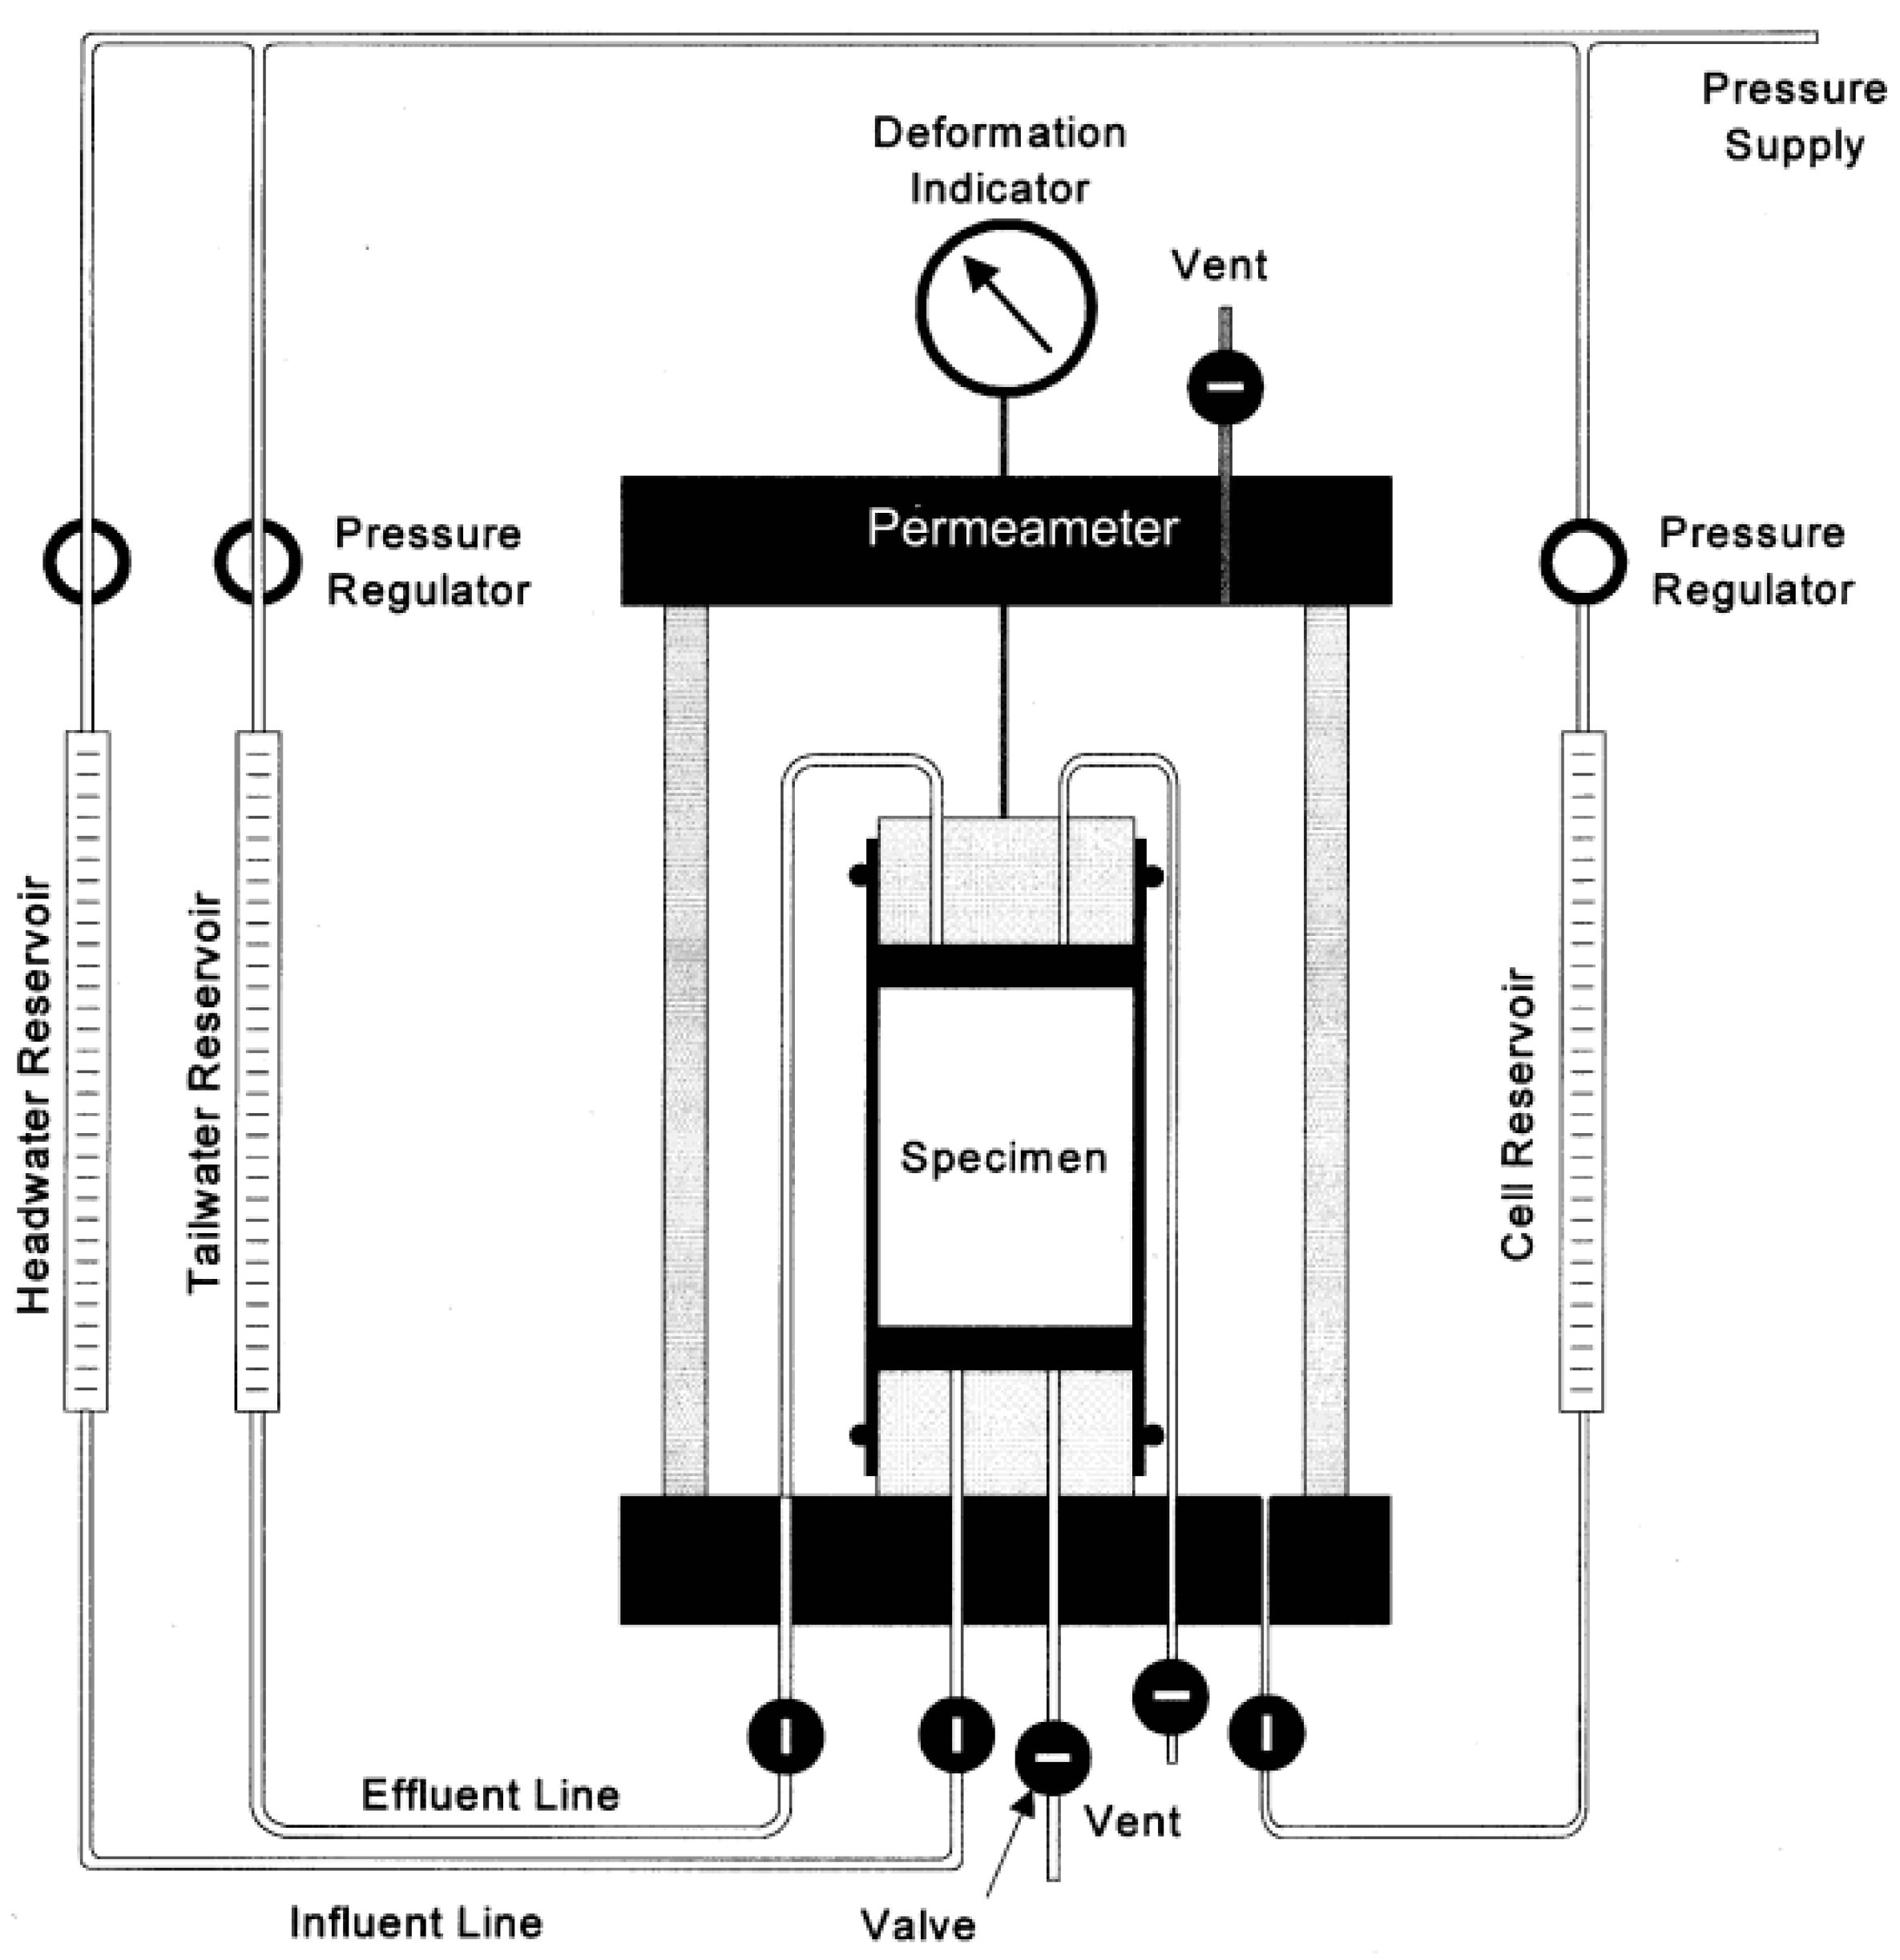
2.3.1. Hydraulic-Conductivity Test

Hydraulic-conductivity test was conducted using a standard flexible wall permeameter [20]. The flexible wall permeameter system is shown in Figure 2. The maximum hydraulic pressure that can be applied in the falling head test is 20 kPa. When the hydraulic pressure is 20 kPa, the hydraulic conductivity of the modified soil is small, and it is difficult to measure the hydraulic conductivity using the falling head test. The flexible wall hydraulic conductivity test can set higher hydraulic pressure. In addition, the flexible wall hydraulic conductivity test can be applied to confine pressure to reduce the error of water penetration between the soil sample and the side wall. A confining pressure of 100 kPa was applied after the backpressure saturation stage. The flexible wall permeability hydraulic conductivity test specifies that the confining pressure should be greater than the hydraulic pressure. According to the previous test, the unconfined compressive strength of the soil sample is greater than 200 kPa [15]. The confining pressure of 100 kPa will not cause damage to the structure of the soil sample. Three sets of parallel samples for each test were prepared to reduce errors. After the test value with large error is excluded, the average value of the test results of other samples is taken as the test result of this group.

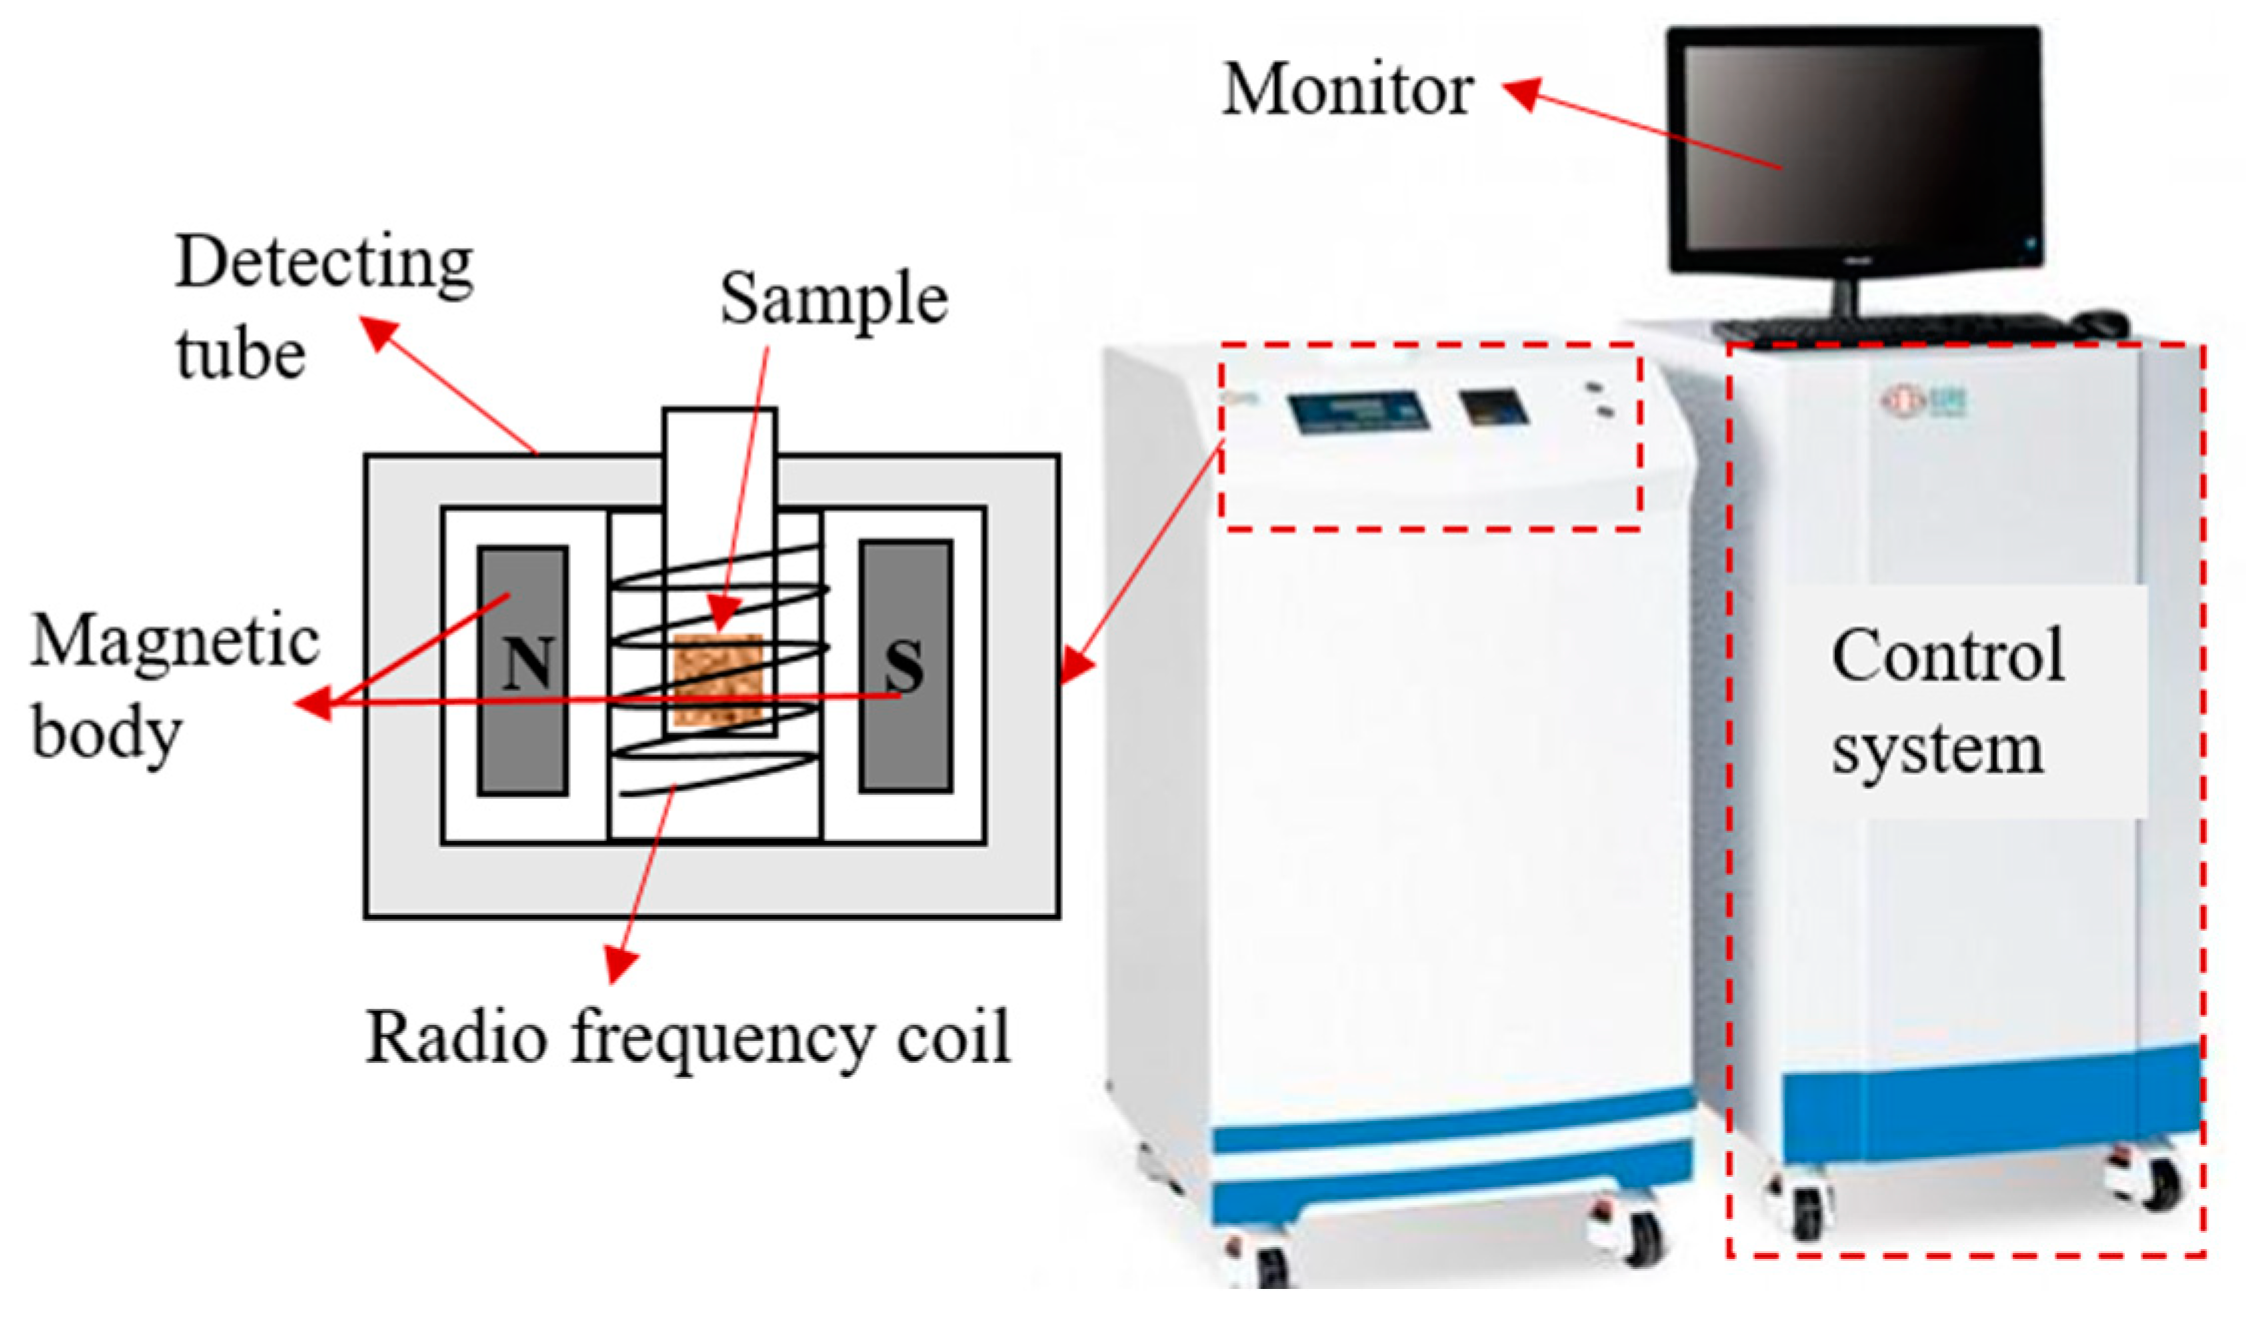
2.3.2. Nuclear Magnetic Resonance (NMR)

The photo of NMR equipment is shown in Figure 3. When the porous medium was saturated, the NMR T 2 spectrum could reflect its pore structure. Each peak represented the water signal within a certain range of pore size. The peak area represented the water content and the pore size in this range, as confirmed by many studies and practical applications [21]. The total transverse relaxation time in the porous media can be expressed by
1 T 2 = 1 T 2 B + 1 T 2 S + 1 T 2 D
where T 2 is the total relaxation time of the water in pores ascertained via the Carr–Purcell–Meiboom–Gill sequence, T 2 B is the bulk fluid relaxation time, T 2 S is the surface relaxation time, and T 2 D is the diffusion relaxation time in a magnetic-field gradient. We assumed that the condition for the fast-diffusion regime was fulfilled and T 2 D can be neglected [22,23]. Given that the soil sample had been washed with distilled water, T 2 B was negligible; thus, in Equation (1), T 2 is dominated by T 2 S , i.e.,
1 T 2 1 T 2 S
Theoretical analysis [24] has shown that T 2 surface can be represented by
1 T 2 1 T 2 S = ρ 2 S V p o r e = F s ρ 2 r
where ρ 2 is the surface relaxation coefficient, S V p o r e is the ratio of the surface area S to the pore volume V , and r ( μ m ) is the pore radius. F s is a shape factor, which assumes a value of 1, 2, and 3 for planar, cylindrical, and spherical pores, respectively [25]. According Gao et al. [26], pores in soils can be considered spherical.
1 T 2 = ρ 2 3 r
The Schlumberger–Doll research equation was adopted to calculate the surface relaxation coefficient ( ρ 2 ), as expressed in Equation (5) [27].
ρ 2 = K S ϕ 4 T 2 L M 2 1 / 2
where K S ( μ m 2 ) is the soil permeability, ϕ is the soil porosity, and T 2 LM ( m s ) is the weighted geometric mean value of the T 2 spectrum. Thus, the radius of the spherical pore r ( μ m ) in thawed soils can be calculated as expressed in Equation (6).
r = 3 ρ 2 T 2
Then, the pore volume V i with a certain radius is given as [28]
V i = A i Σ A i m w ρ w = A i Σ A i m s m d ρ w
where A i is the amplitude of the corresponding signal in a T 2 spectrum; m w is the mass of pore water in the tested sample; ρ w is the density of water, which is 1.0 g / cm 3 approximately; m s is the total mass of saturated soil sample; and m d is the mass of thoroughly dried soil sample after a dry-out treatment in an air oven.

2.3.3. Fourier Transform Mid-Infrared (FTIR) Spectroscopy

FTIR was used to analyse the differences in functional group types, strength, area, and other parameters of soil samples through the peak-splitting fitting technique. FTIR analyses of the unmodified soil and the mixture of soil and superhydrophobic nano-SiO2 were performed via heating. Each soil sample was ground to powder before spectral analysis [29].

2.3.4. Contact Angle Measurement

The hydrophilicity of the expansive soil changed with the addition of superhydrophobic nano-SiO2. The most direct method of evaluating the hydrophilicity of soil was to measure the contact angle. Firstly, soil samples of less than 200 meshes were screened and dried for 8 h. The mixture of soil sample powder and alcohol was sprayed on the aluminium plate through a duster and the alcohol volatilised to form a granular layer. The sample was then placed on a contact-angle tester (DCAT21, Dataphysics, Stuttgart, Germany) with deionised water as the wetting solution. Each soil sample was measured in three groups and the average value was taken as the determination value.

2.3.5. Thermogravimetric Analysis

A thermal analyser (STA7200, Hitachi, Tokyo, Japan) was used for all thermal analyses. This instrument provided simultaneous TGA curves and useful information about the thermal properties of the soil samples. Using TGA, the mass loss of the sample was calculated with respect to the increase in temperature.

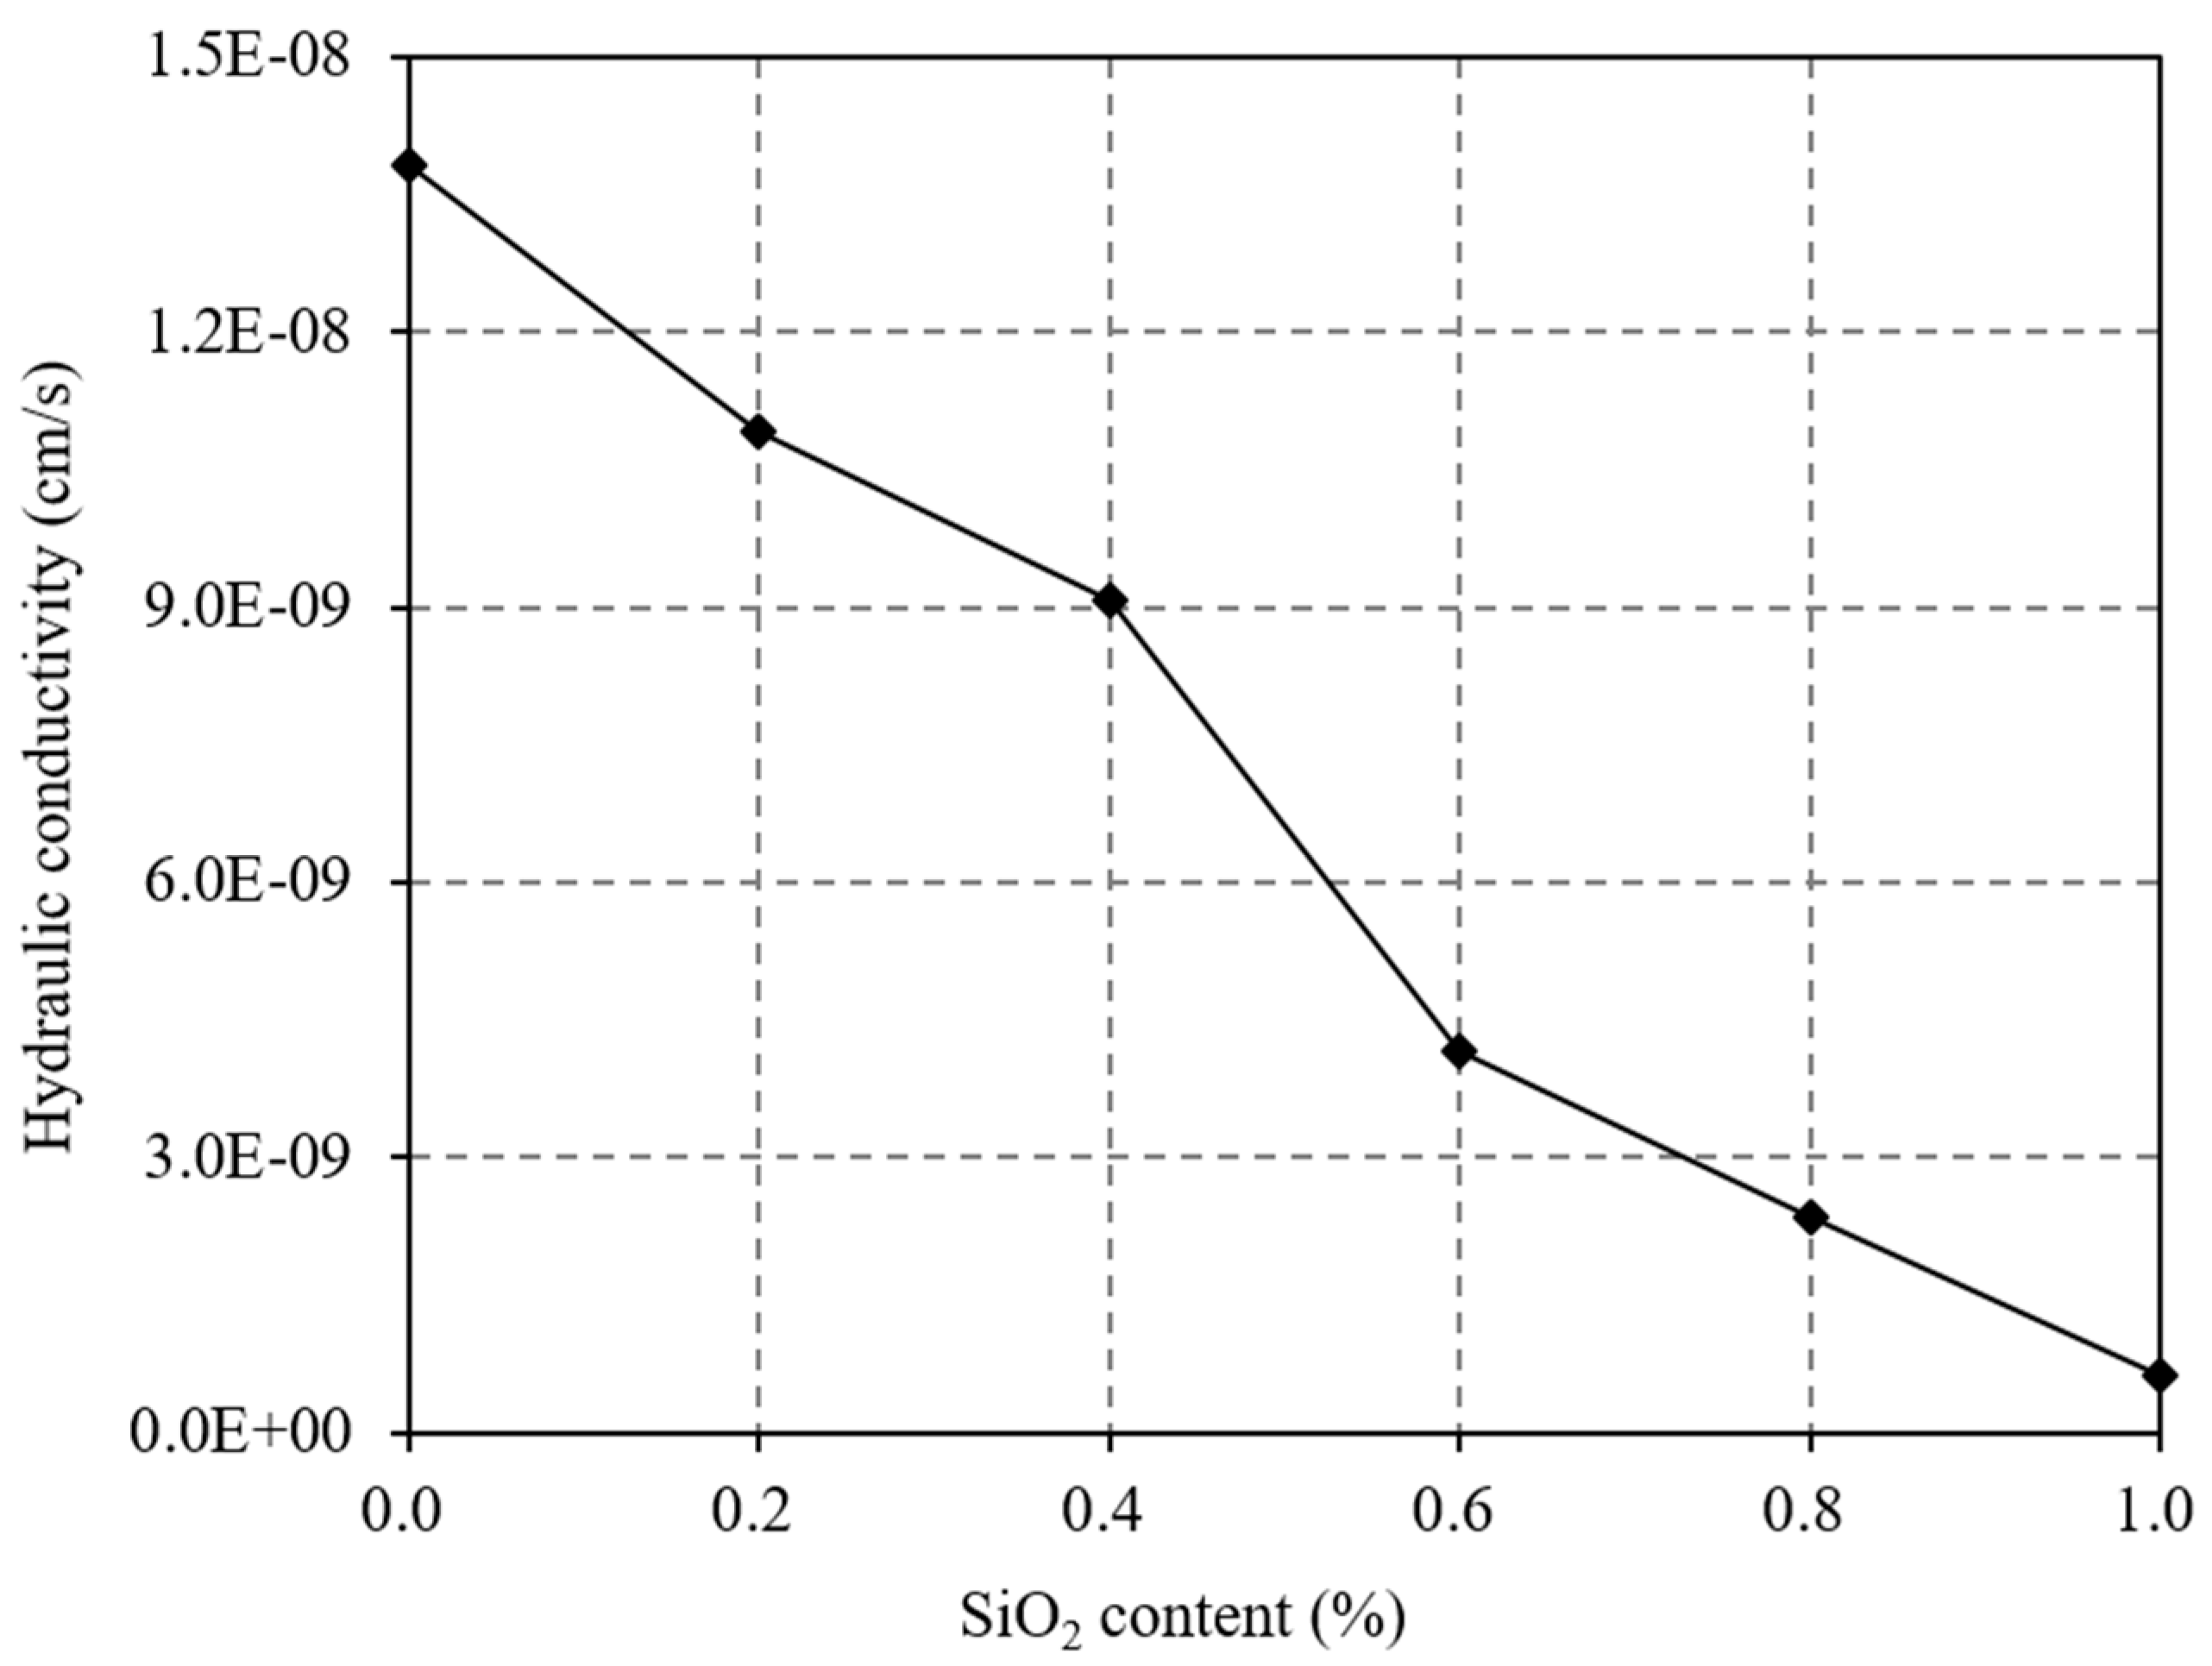
3. Hydraulic Conductivity of Soil Samples with Various SiO2 Contents

In the hydraulic test, the hydraulic pressure was 50 kPa. Figure 4 shows the measured variations in the hydraulic conductivity of expansive soil with different superhydrophobic nano-SiO2 contents. When the hydraulic pressure was 50 kPa, the hydraulic conductivity of soil samples with superhydrophobic nano-SiO2 contents of 0%, 0.2%, 0.4%, 0.6%, 0.8%, and 1.0% was 1.38 × 10⁻⁸, 1.09 × 10⁻⁸, 9.07 × 10⁻⁹, 4.17 × 10⁻⁹, 2.34 × 10⁻⁹, and 6.25 × 10⁻¹⁰ cm/s, respectively. Test results showed that the hydraulic conductivity of soil samples decreased with increased superhydrophobic nano-SiO2 content.

4. Test Results and Mechanism Analysis

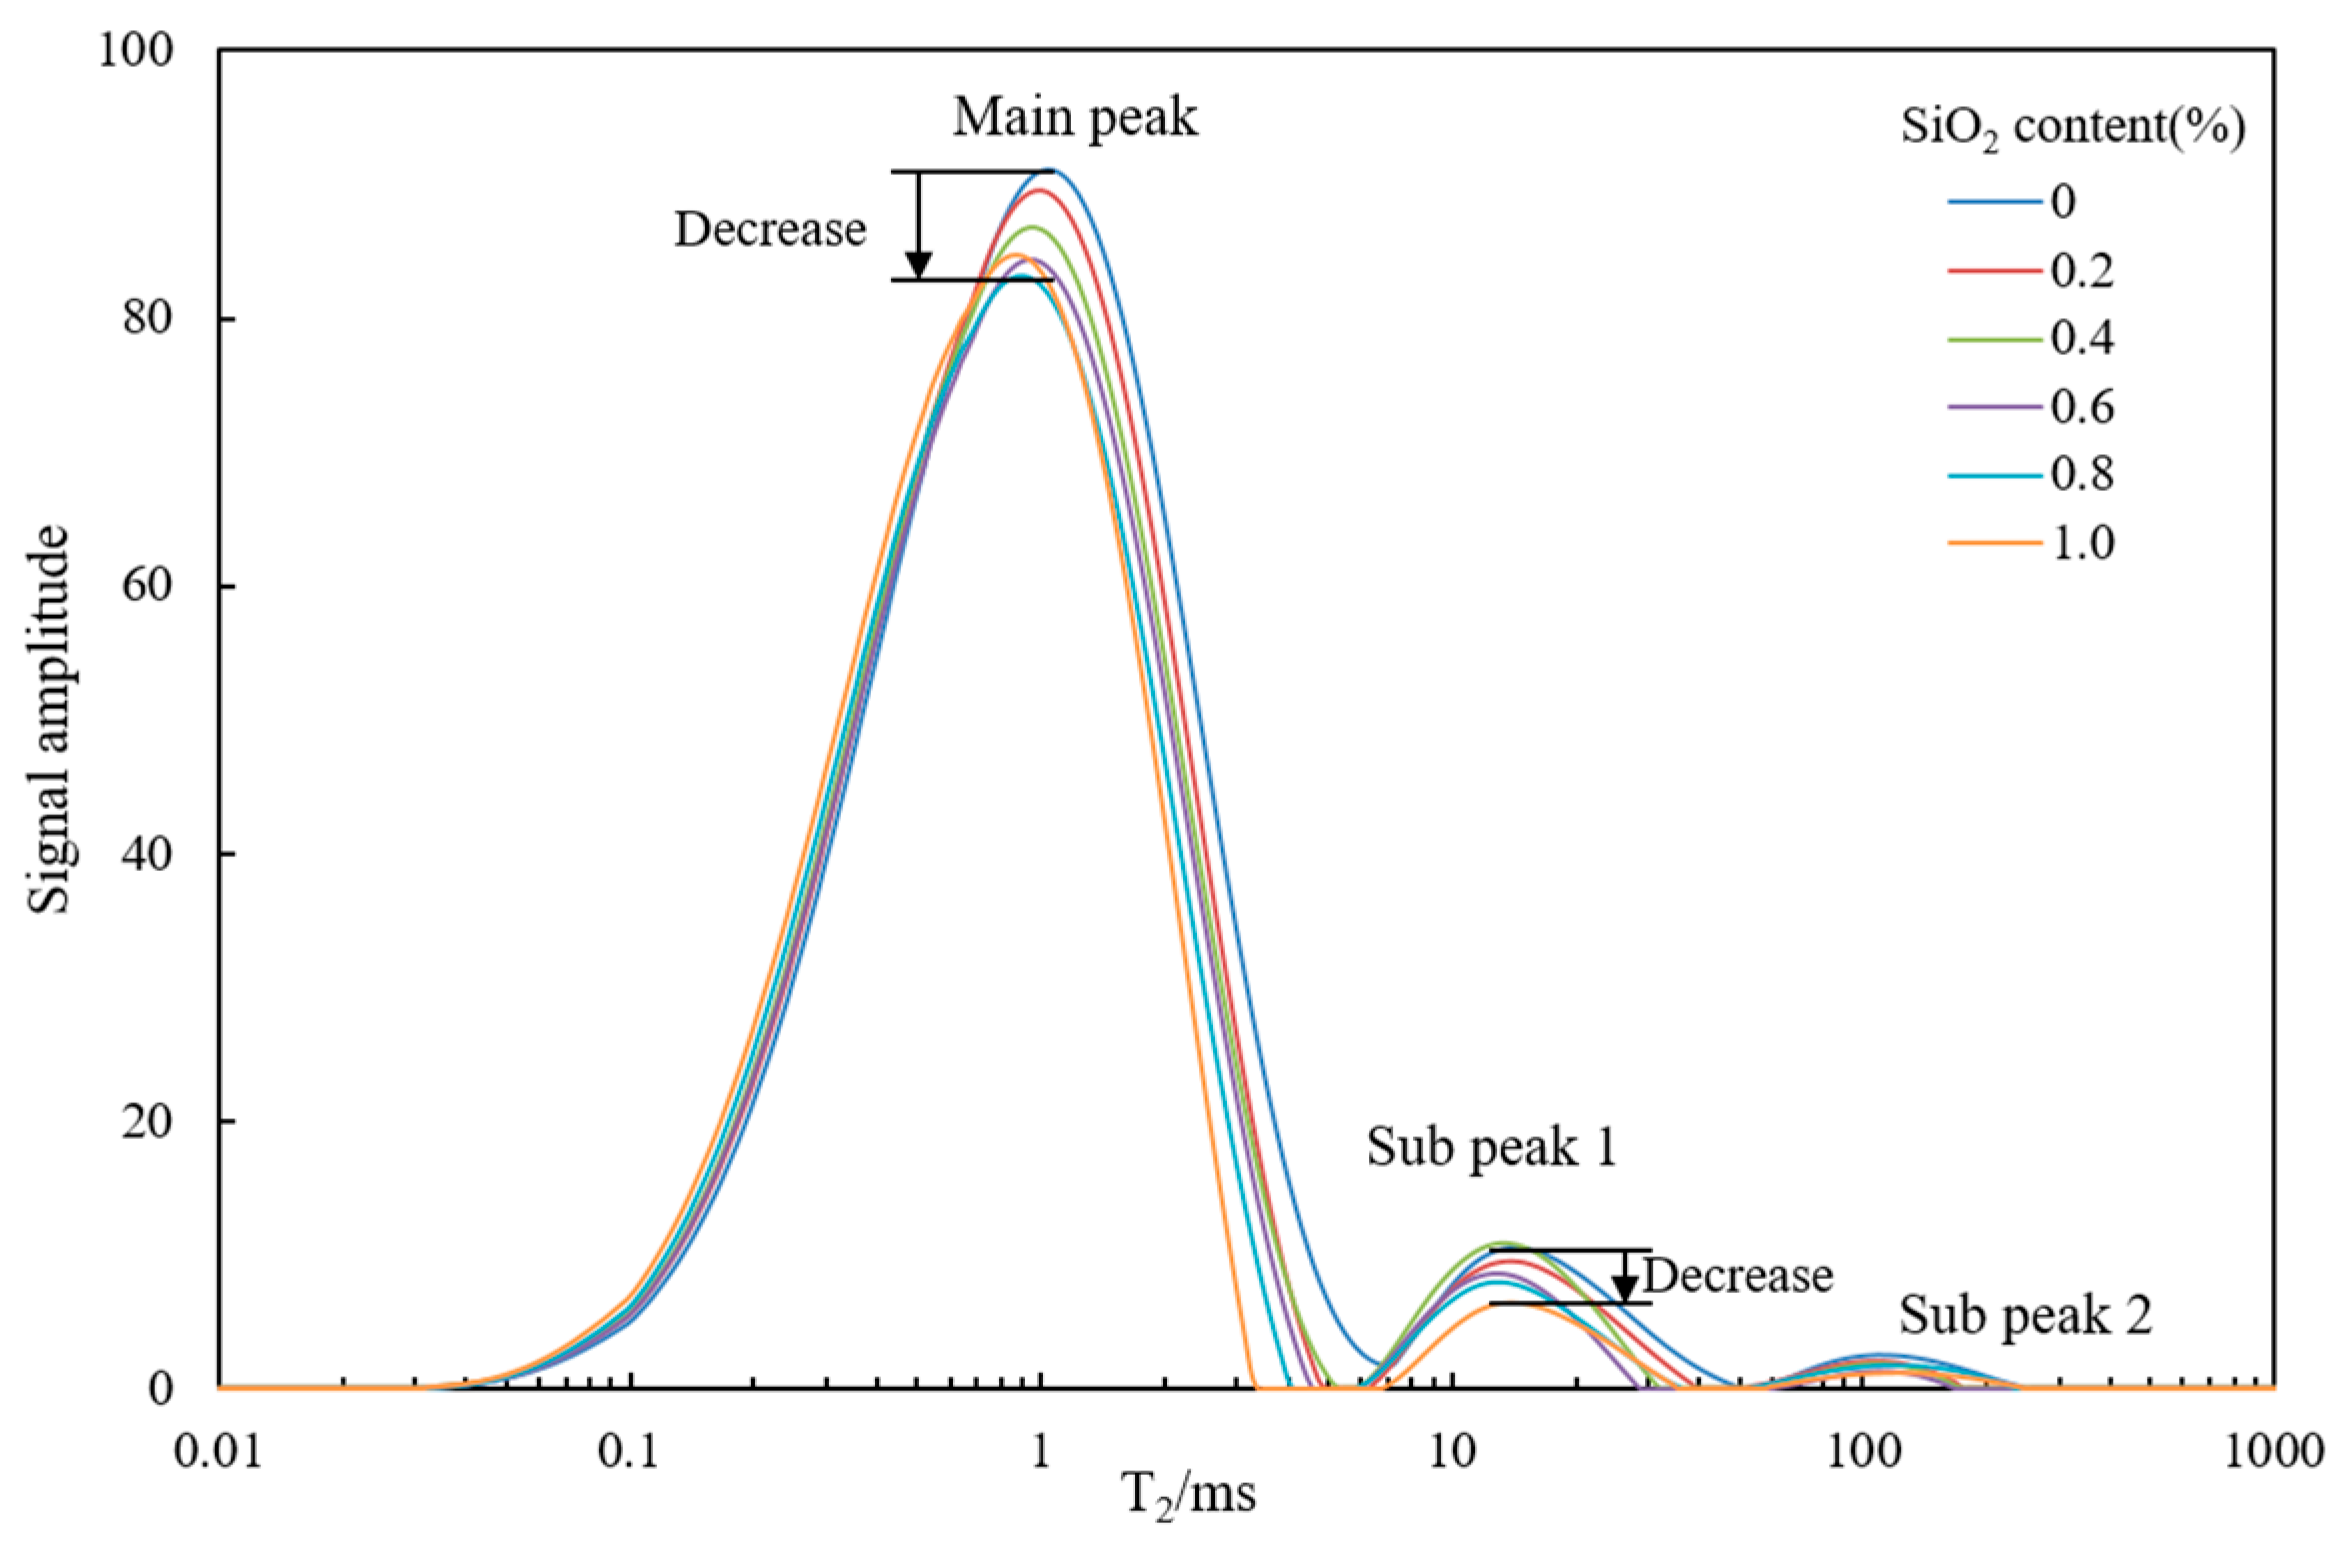
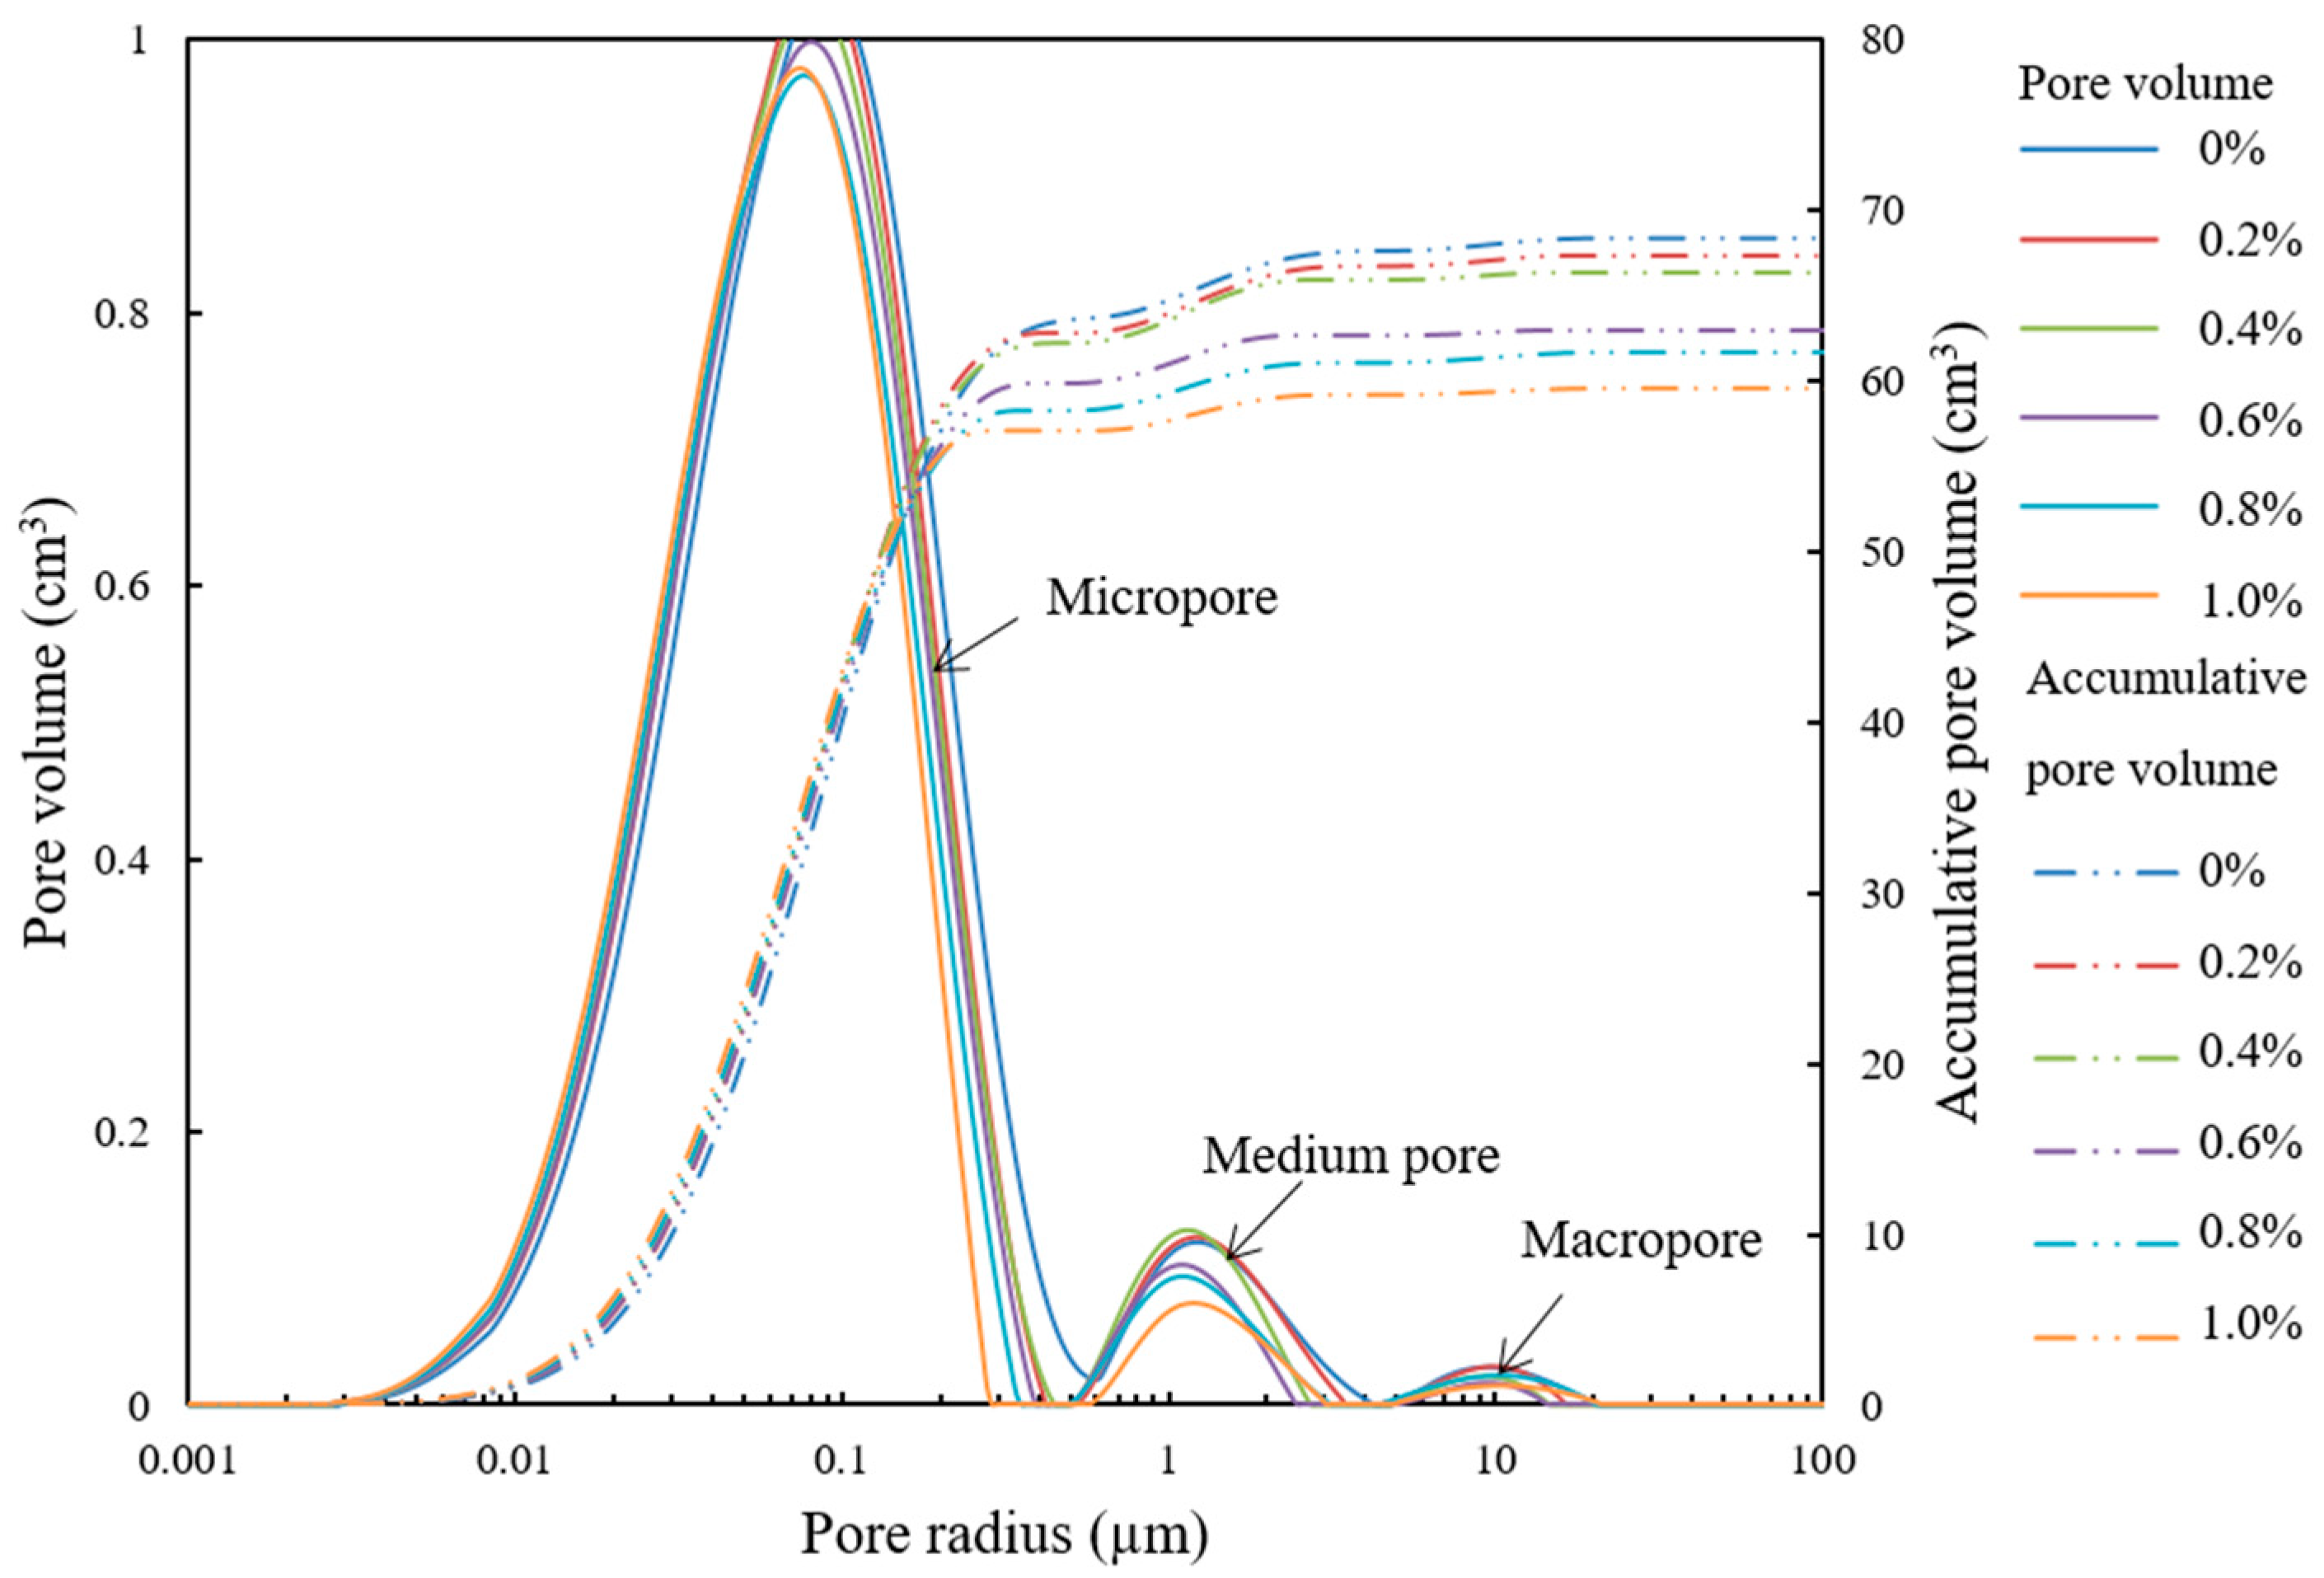
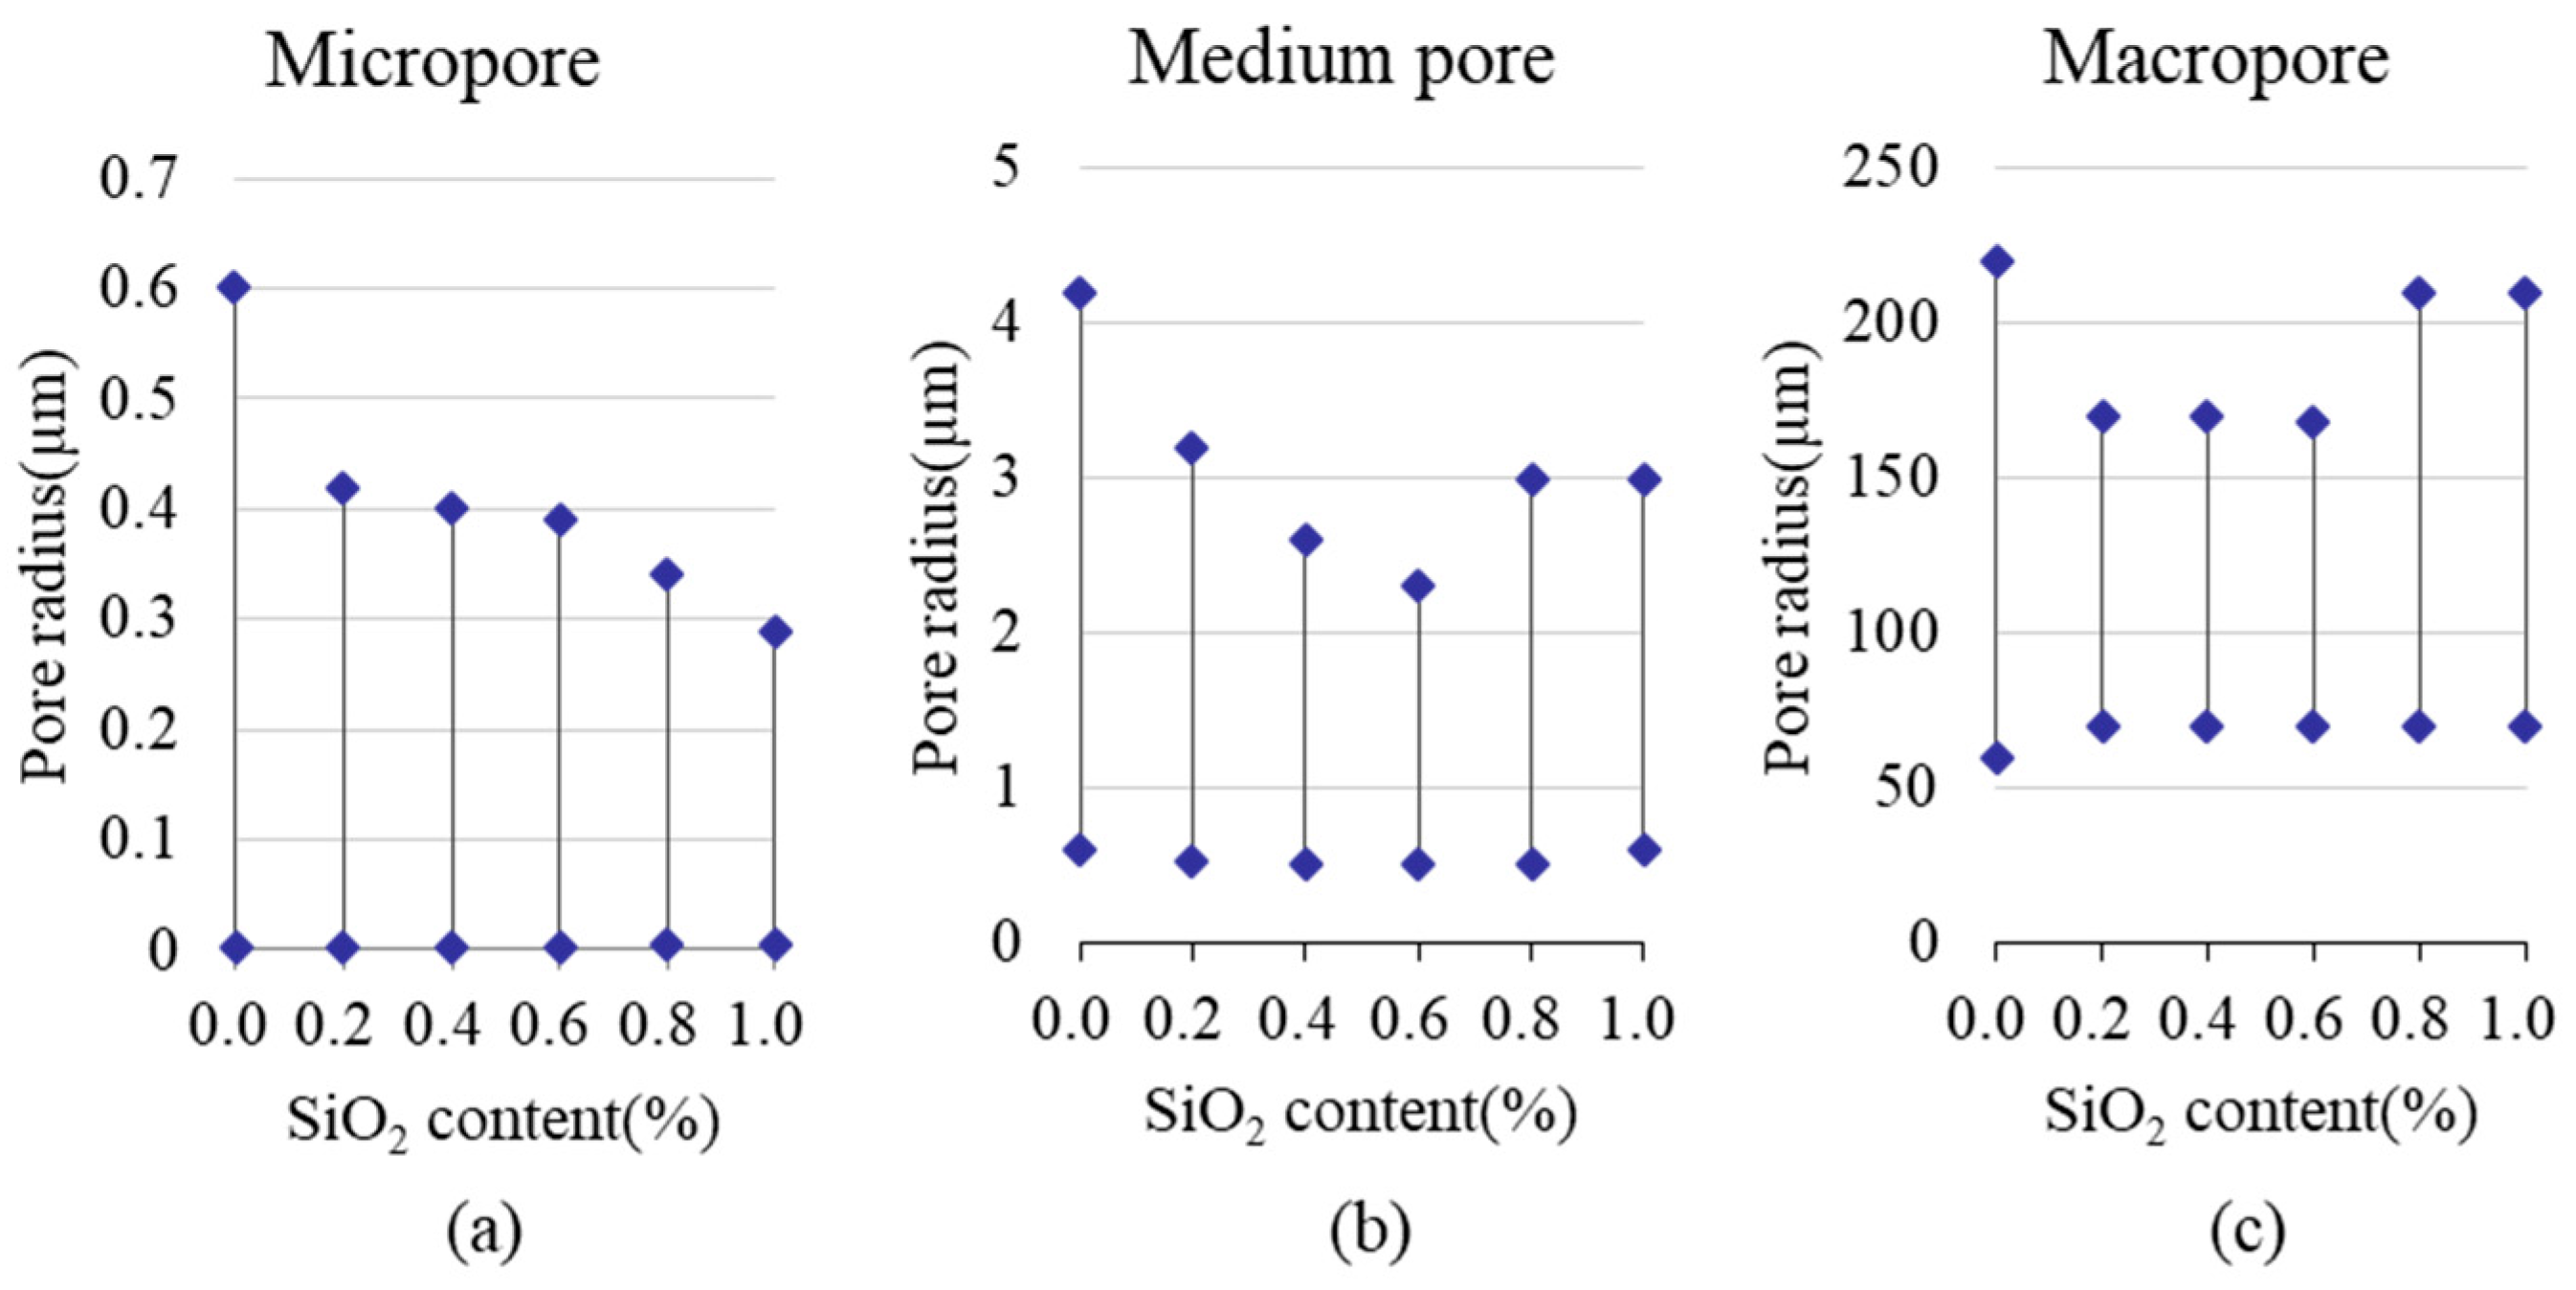
4.1. Effect of Nano-SiO2 on the PSD of Soil Samples

The measurements of T 2 distributions for different SiO2 contents are depicted in Figure 5. As shown in Figure 5, each T 2 spectrum curve had three peaks, defined from left to right as main peak, subpeak 1, and subpeak 2, corresponding with adsorbed water, capillary water, and free water, respectively. With increasing SiO2 content, the relaxation time of the main peak gradually decreased. The main peak was significantly higher than the subpeak 1 and subpeak 2 in each T 2 spectrum curve. With increased SiO2 content, the maximum value of the main and subpeak 1 noticeably increased. The area under the T 2 distribution curve represented the amount of water content in the soil sample, indicating the proportion of pores at a given radius. With increasing SiO2 content, the main peak moved to the left and the span of the main peak gradually decreased. This phenomenon indicated that the thickness of adsorbed water decreased with increased SiO2 content.
The pores in saturated soil were filled with water, thus, the T 2 distribution curve of saturated soil can reflect the pore distribution. Based on Equation (5), the coefficient ρ 2 of the soil sample was calculated. According to Equations (6) and (7), the PSD and pore-volume distributions of samples with different SiO2 contents were calculated through T 2 spectrum curves obtained from the NMR test.
The pore-volume distribution curves are plotted in Figure 6. For analysis, pores corresponding with the main peak, subpeak 1, and subpeak 2 were defined as micropore, medium pore, and macropore. As shown in Figure 6, the pore radius of the micropore was primarily distributed from 0.003 μ m to 0.6 μ m , whereas the pore radius of the medium pore was distributed from 0.6 μ m to 4 μ m . With increasing nano-SiO2 content, the range of pore radius of micropore gradually decreased from 0.003–0.6 μ m to 0.003–0.2 μ m , and the range of pore radius of medium pore gradually decreased from 0.6–5 μ m to 0.6–2.2 μ m , as shown in Figure 7.
The total pore volume of the sample with different SiO2 contents was 68.5, 67.4, 66.3, 63, 61.7, and 59.6 cm3, respectively. The volume difference of different samples is caused by the different expansion amount during saturation. Moreover, the volume of the main peaks and subpeak 1 decreased with increased SiO2 contents. The pore volume of the samples significantly varied under different SiO2 contents. Table 3 shows a clearer comparison of the PSD of samples under different SiO2 contents.

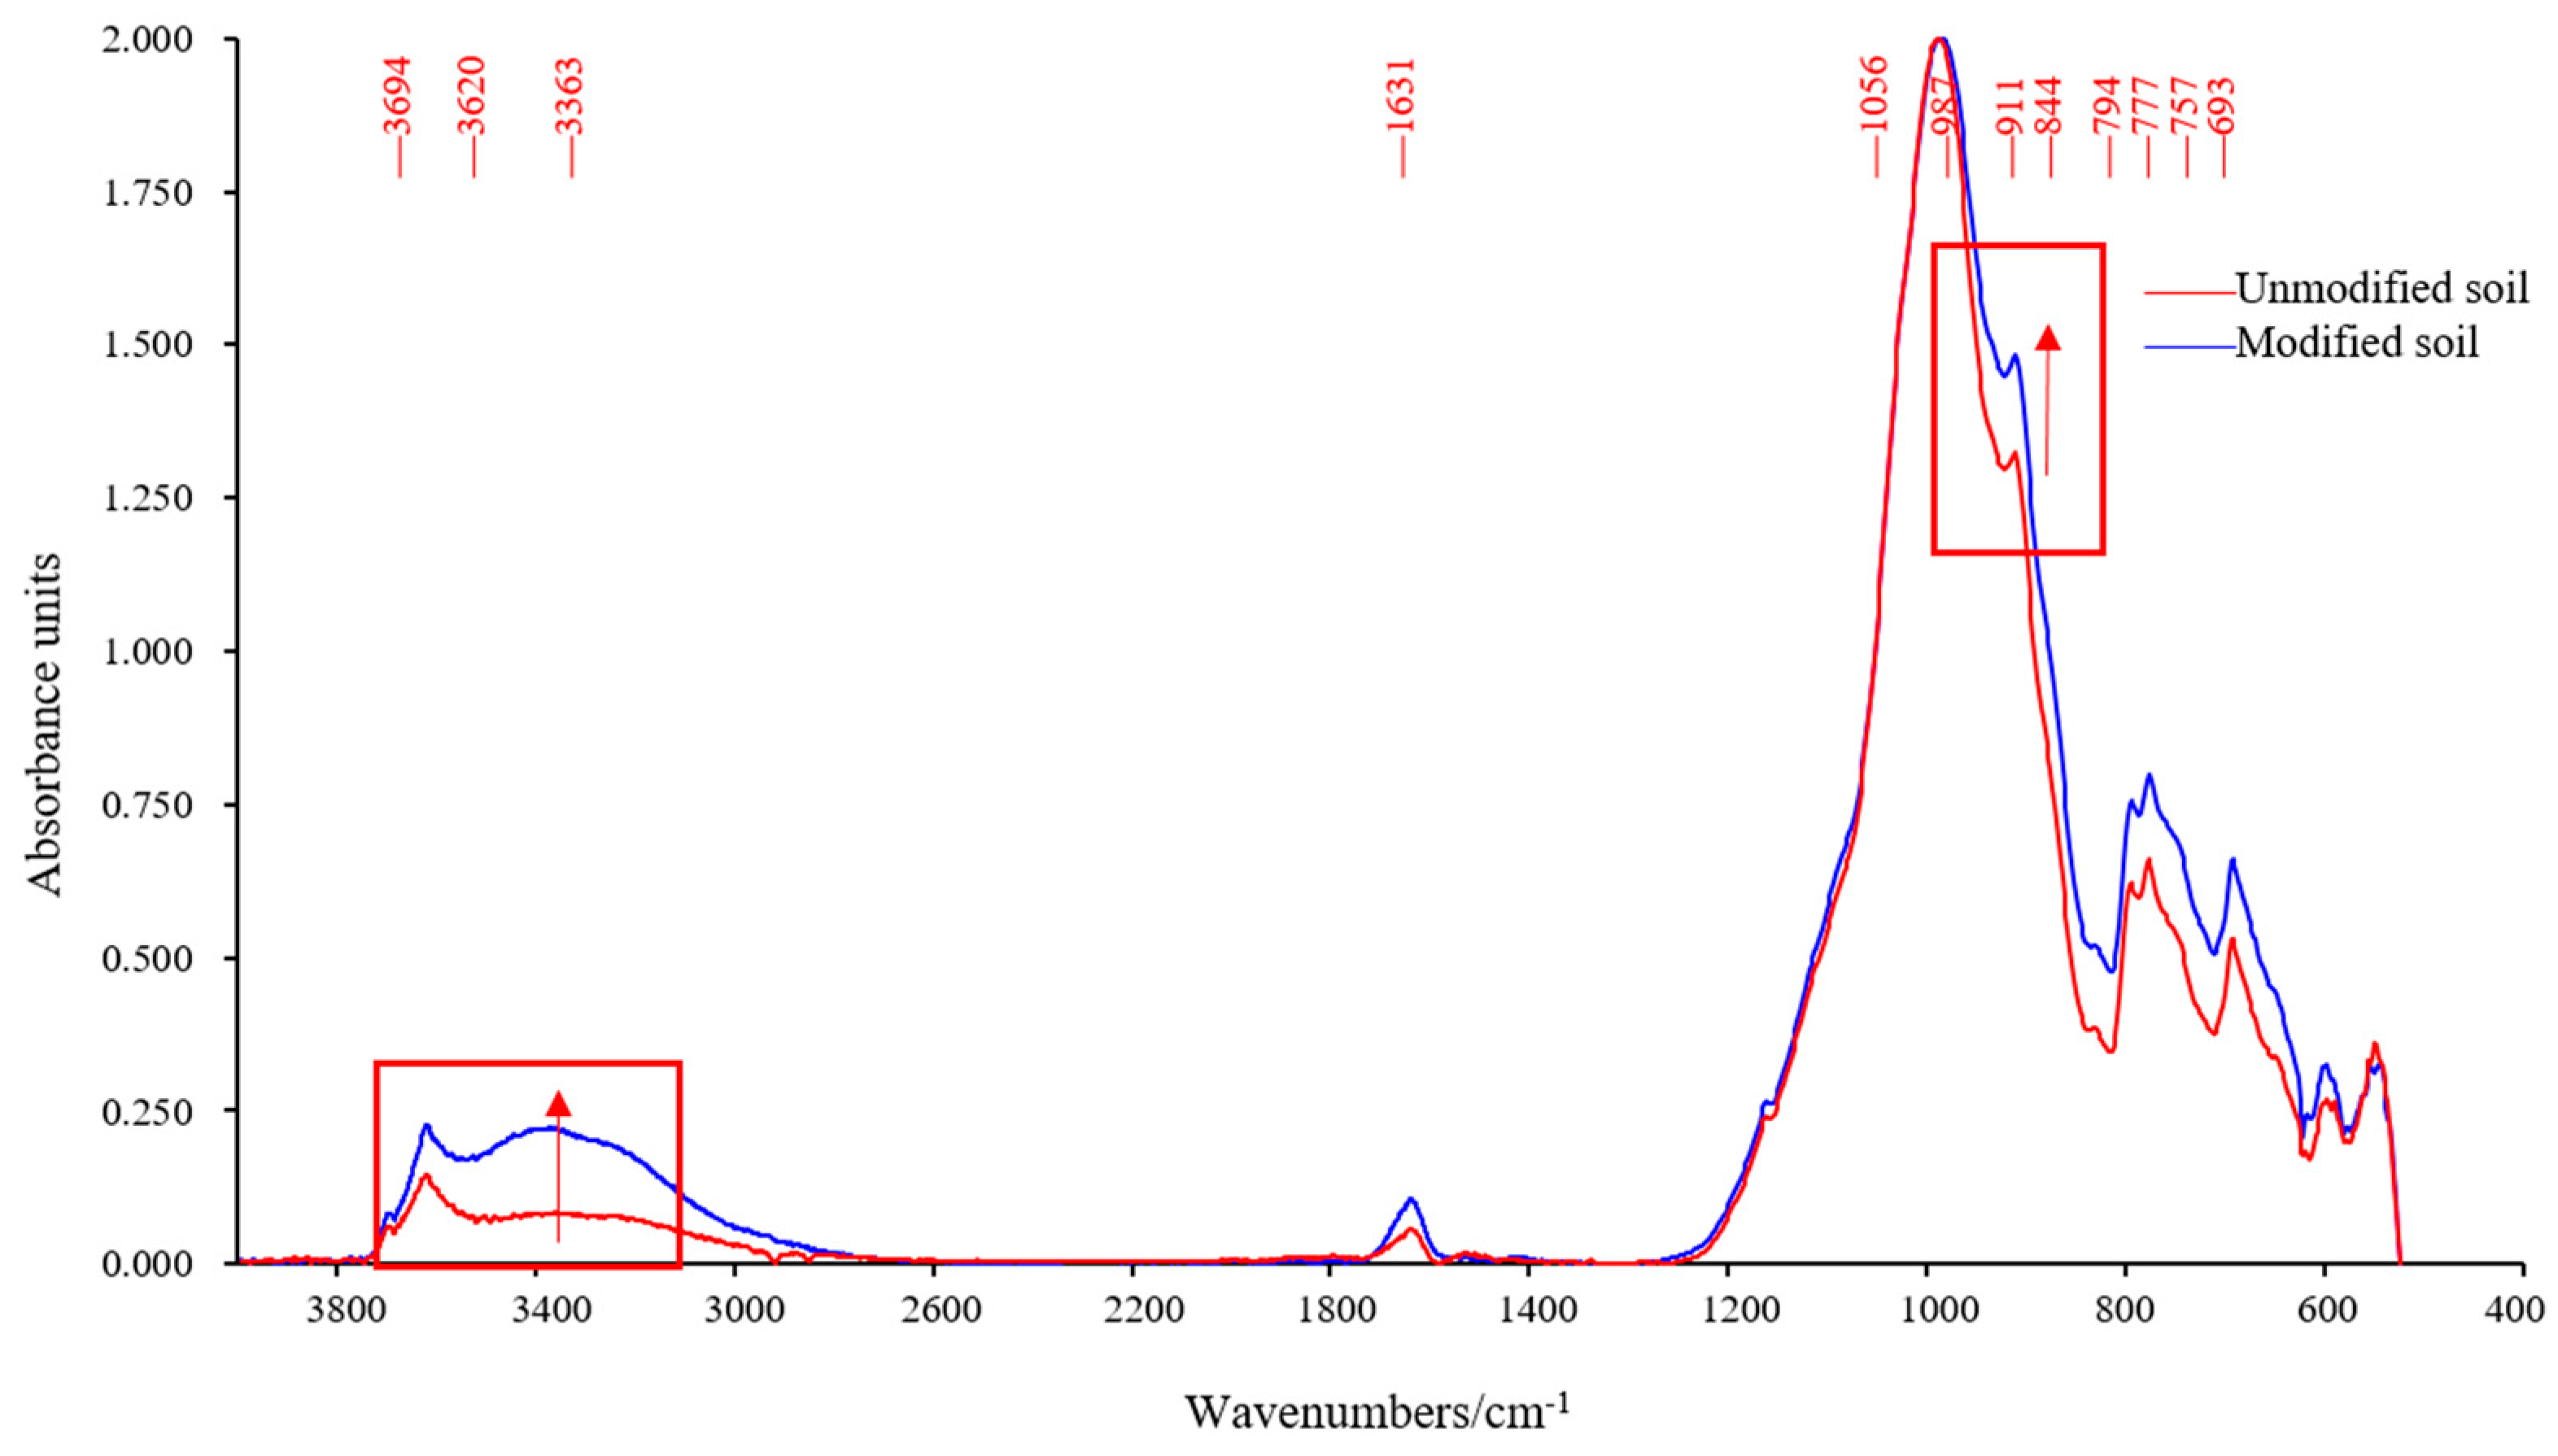
4.2. Effect of Nano-SiO2 on the FTIR Spectra of Soil Samples

Figure 8 shows the FTIR spectra of the two samples. The peaks at 3620 and 3694 cm−1 were associated with OH vibrations in crystal water or terminal hydroxyl group [30]. The peaks at 3363 cm−1 were associated with OH vibrations in free water. The band with peaks at 987 and 911 cm−1 were due to the antisymmetric stretching vibrations of Si–O–Si bonds [16]. The peaks at 794 and 777 cm−1 were related to the symmetric stretching vibrations of Si–O–Si bonds, typical of quartz and silica [31]. As shown in Figure 8, the hydroxy terminal at 3620 cm−1 was primarily consumed during the dehydration process of Si–O–Si. The consumption degree of the terminal OH in Si–OH can be analysed by calculating the peak strength ratio (I3620/I3363) between 3620 cm−1 and free water at 3363 cm−1. I3620/I3363 was 1.77 in the unmodified soil sample and 1.02 in the modified soil sample. After adding nano-SiO2, the relative content of I3620/I3363 decreased significantly, indicating that the terminal hydroxyl in the soil was consumed owing to its participation in the reaction. By calculating the relative intensity of the absorption peaks, we can determine the degree of different absorption peaks involved in the reaction. The absorption peak at 911 cm−1 corresponded with the newly generated Si–O–Si. The degree of newly generated Si–O–Si can be reflected by calculating the I911/I987 of the peak strength of Si–O–Si at 911 and 987 cm−1. I911/I987 was 0.66 in the unmodified soil sample and 0.74 in the modified soil sample. The relative strength of I911/I987 increased, indicating that Si–O–Si was newly formed after adding nano-SiO2.
Expansive soil contains a large amount of quartz. Infrared spectra showed a layer of free silanol group (Si–OH) on the fracture surface of quartz particles [15]. Nano-SiO2 was considered to be an inorganic compound, containing a certain amount of surface silanols (Si–OH). In the modified soil, superhydrophobic nano-SiO2 was uniformly dispersed and attached onto the surface of the soil particles. Silanols were easily dehydrated and condensed to form siloxanes. The reaction equation is shown in Equation (8).
Si OH + Si OH   Si O Si
A simplified diagram of the reaction between soil and silica is shown in Figure 9. The figure shows the reaction between the silanols in silica and the silanols in soil.

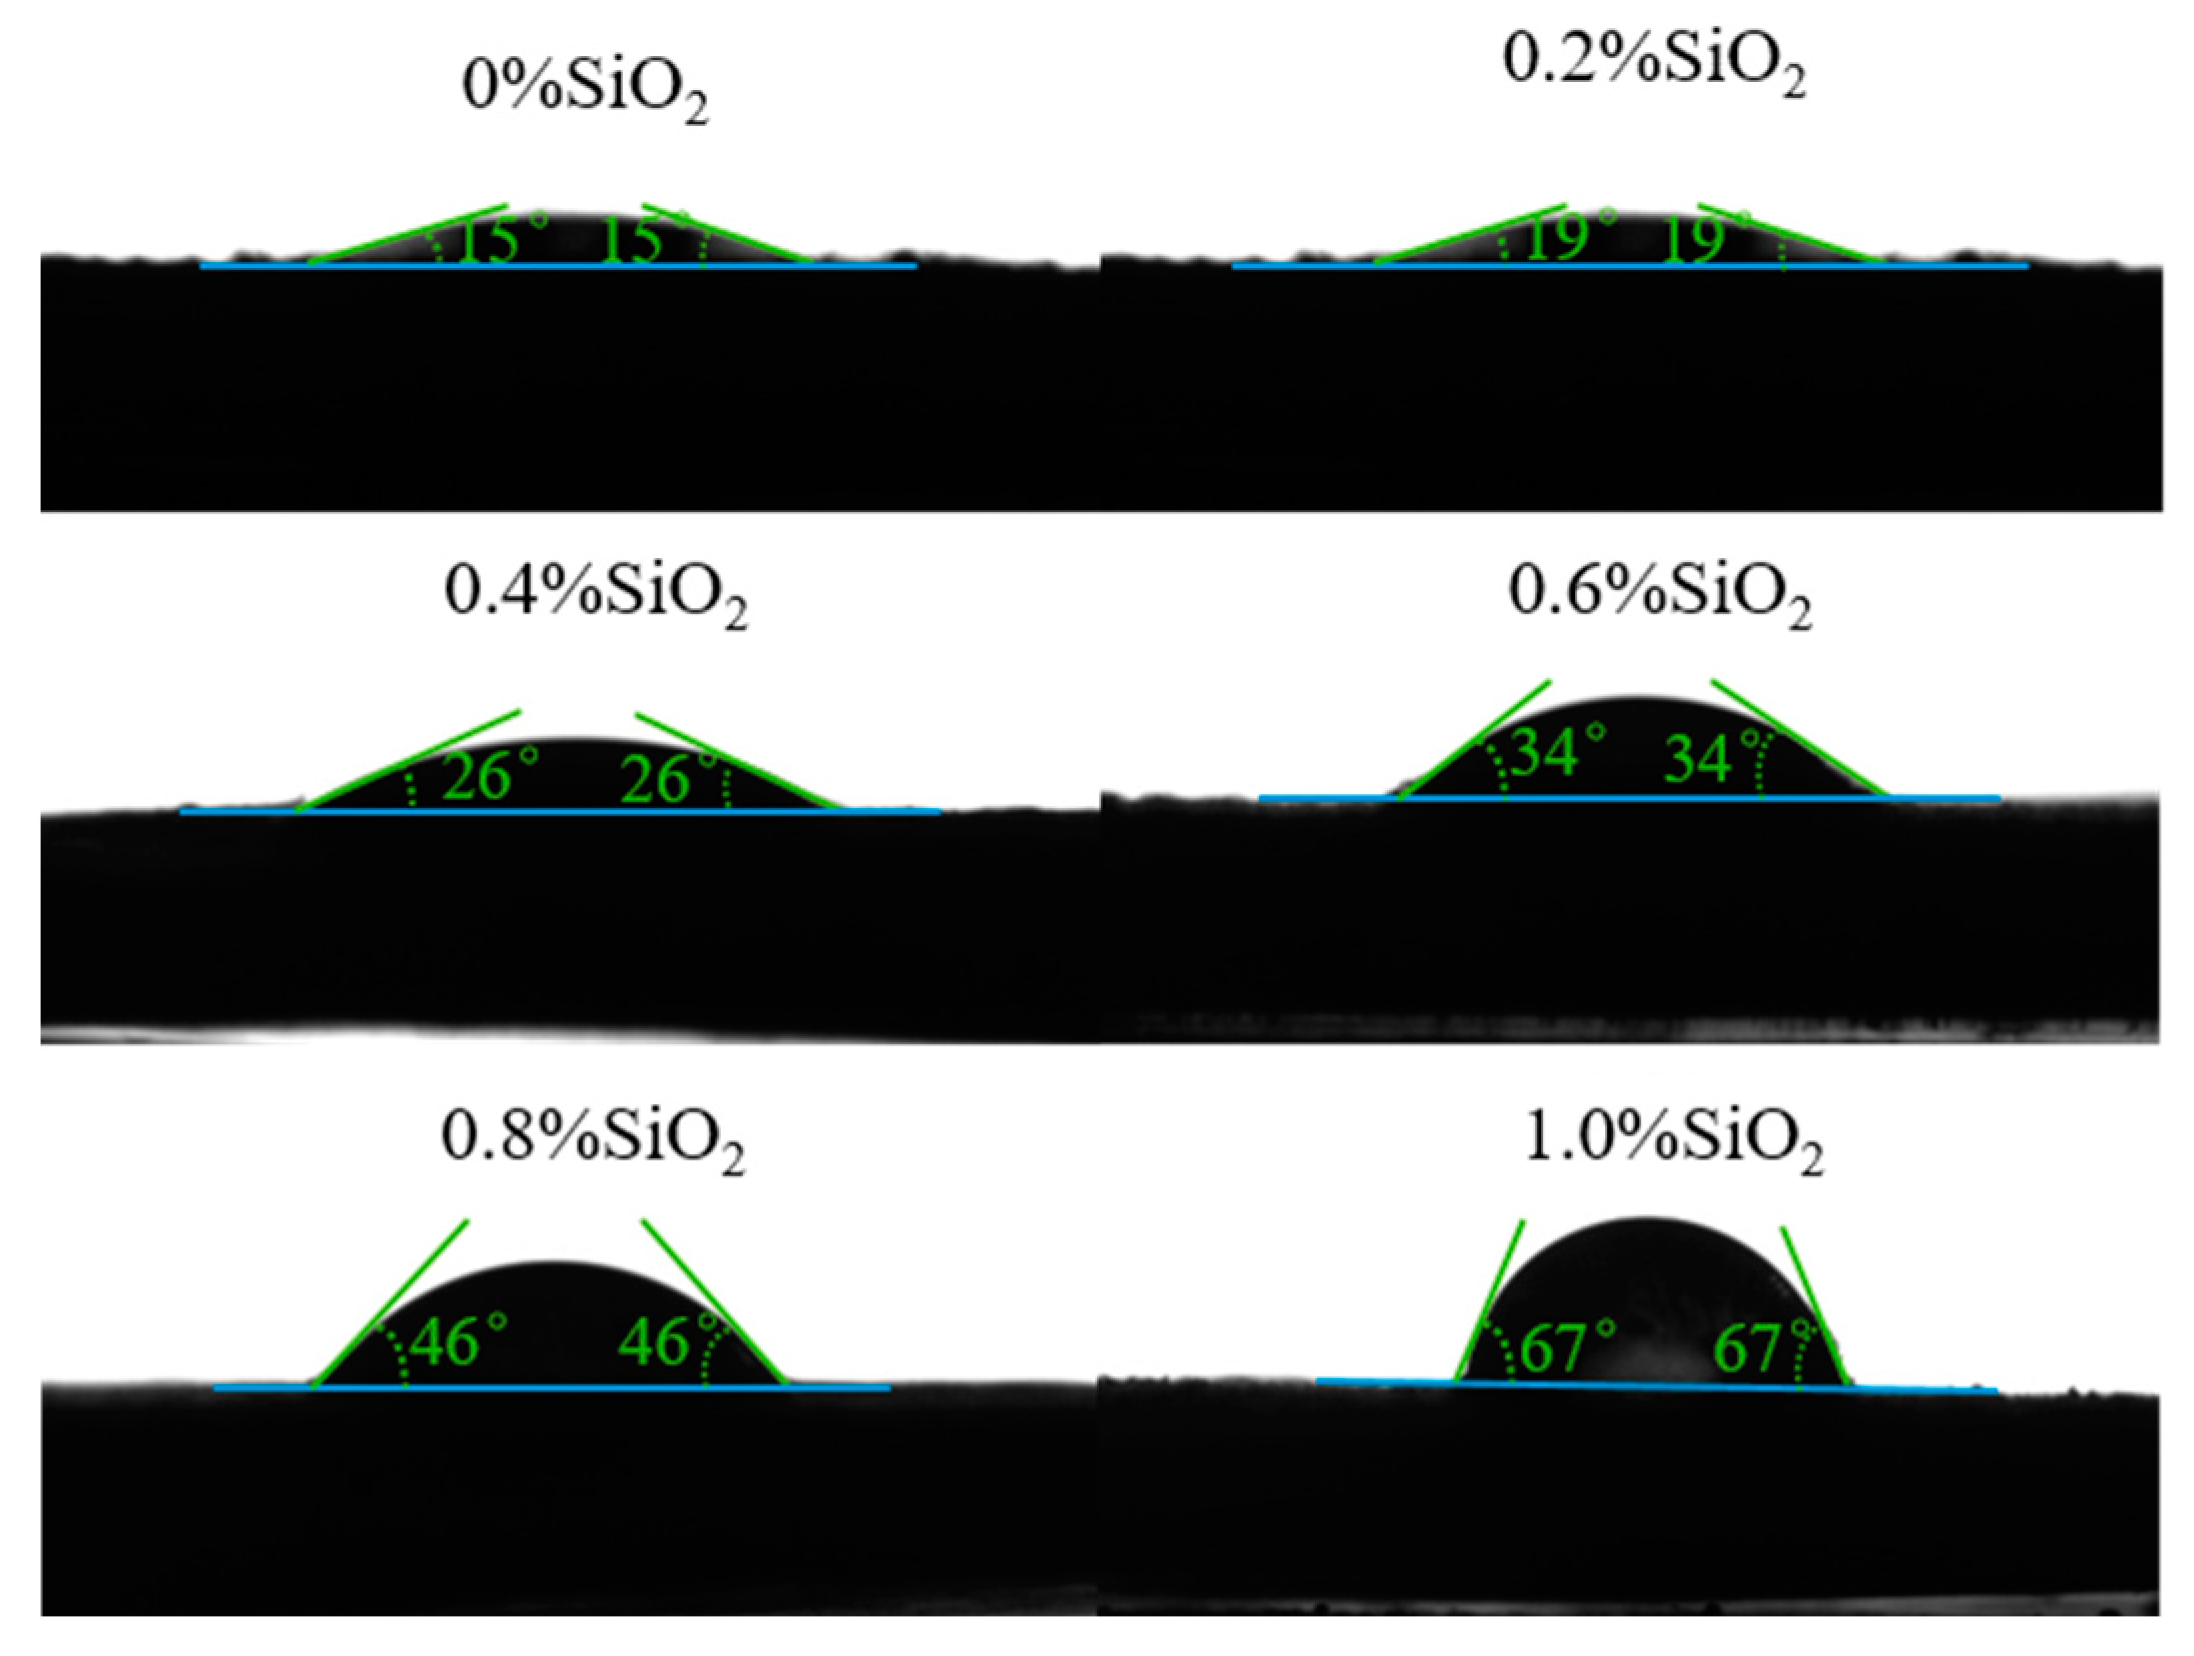
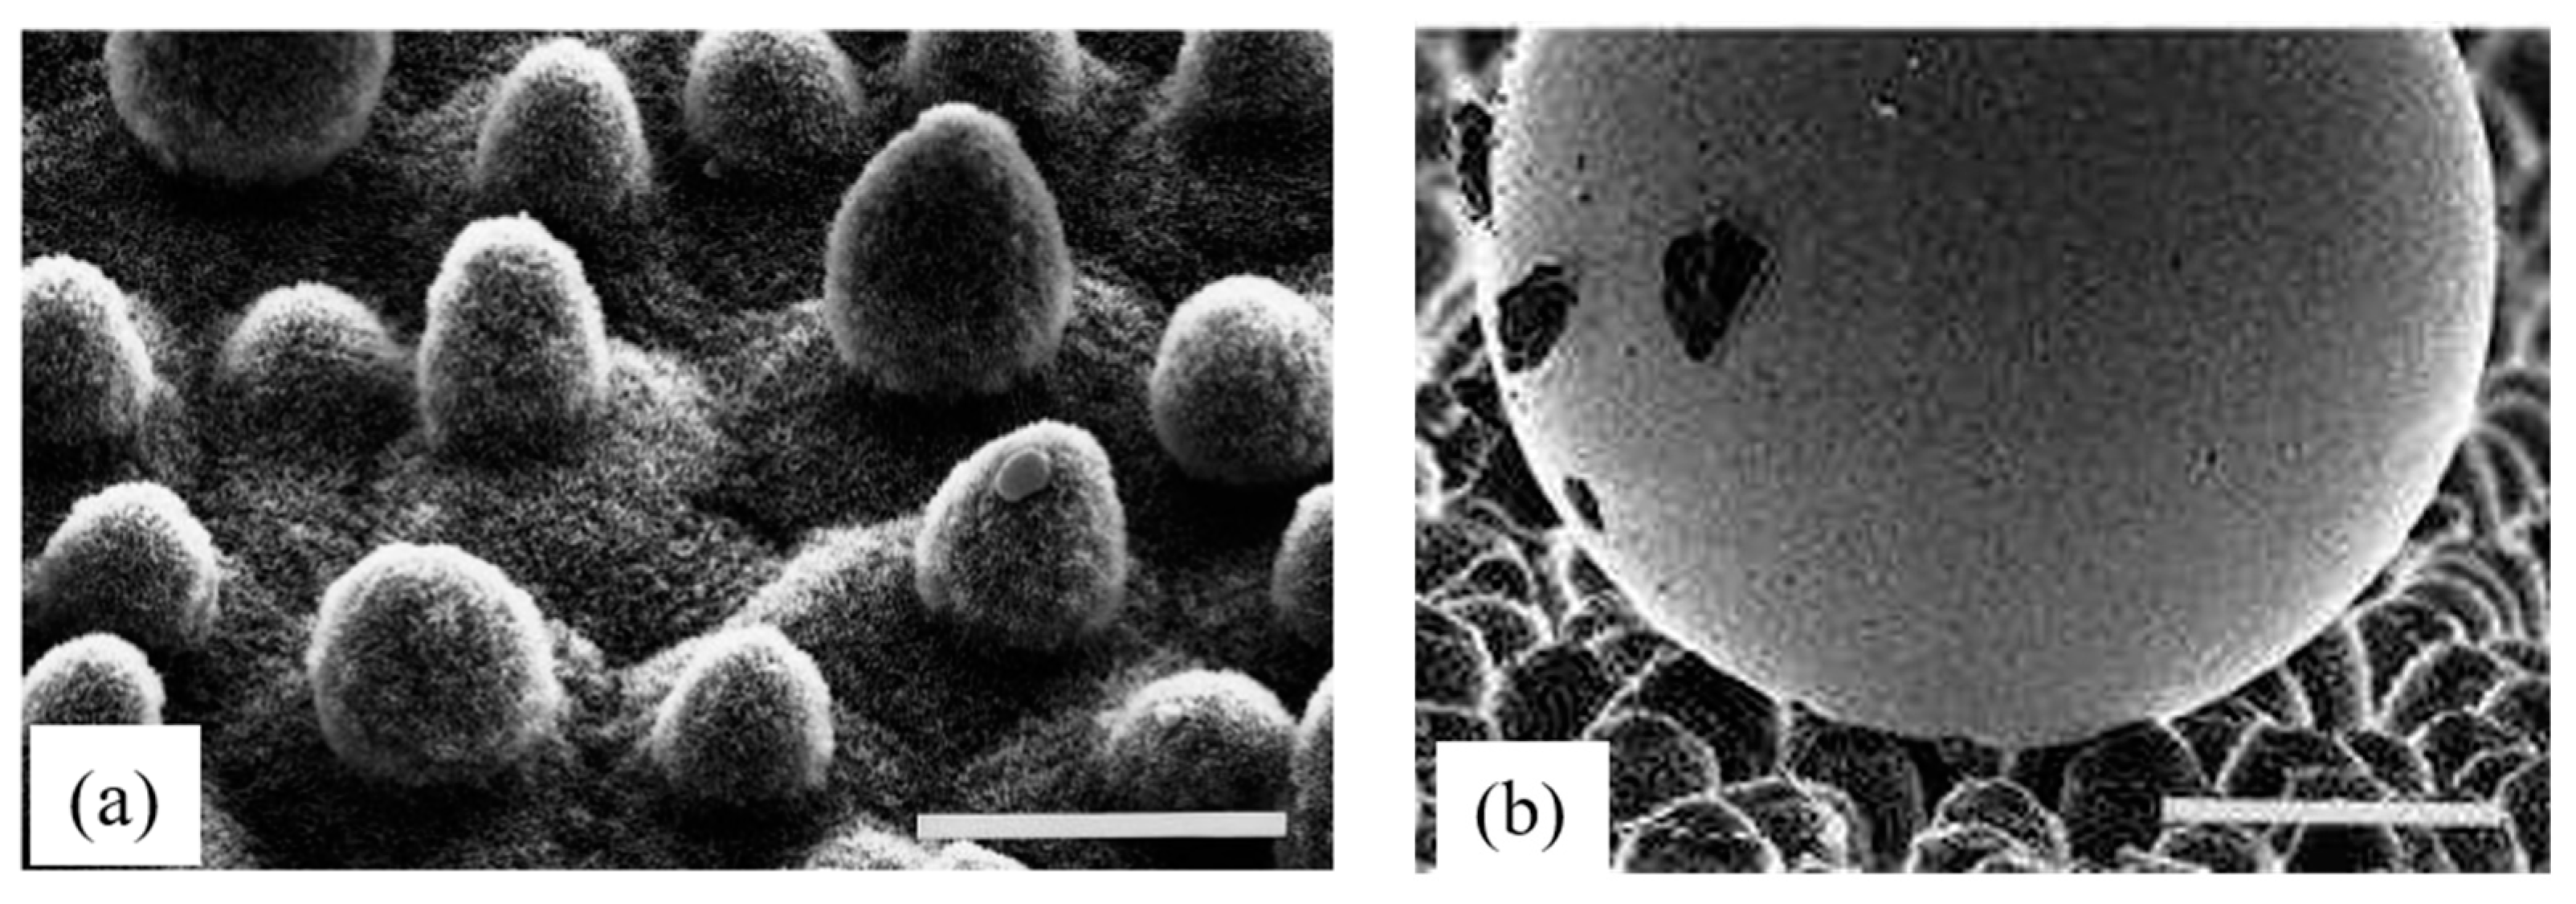
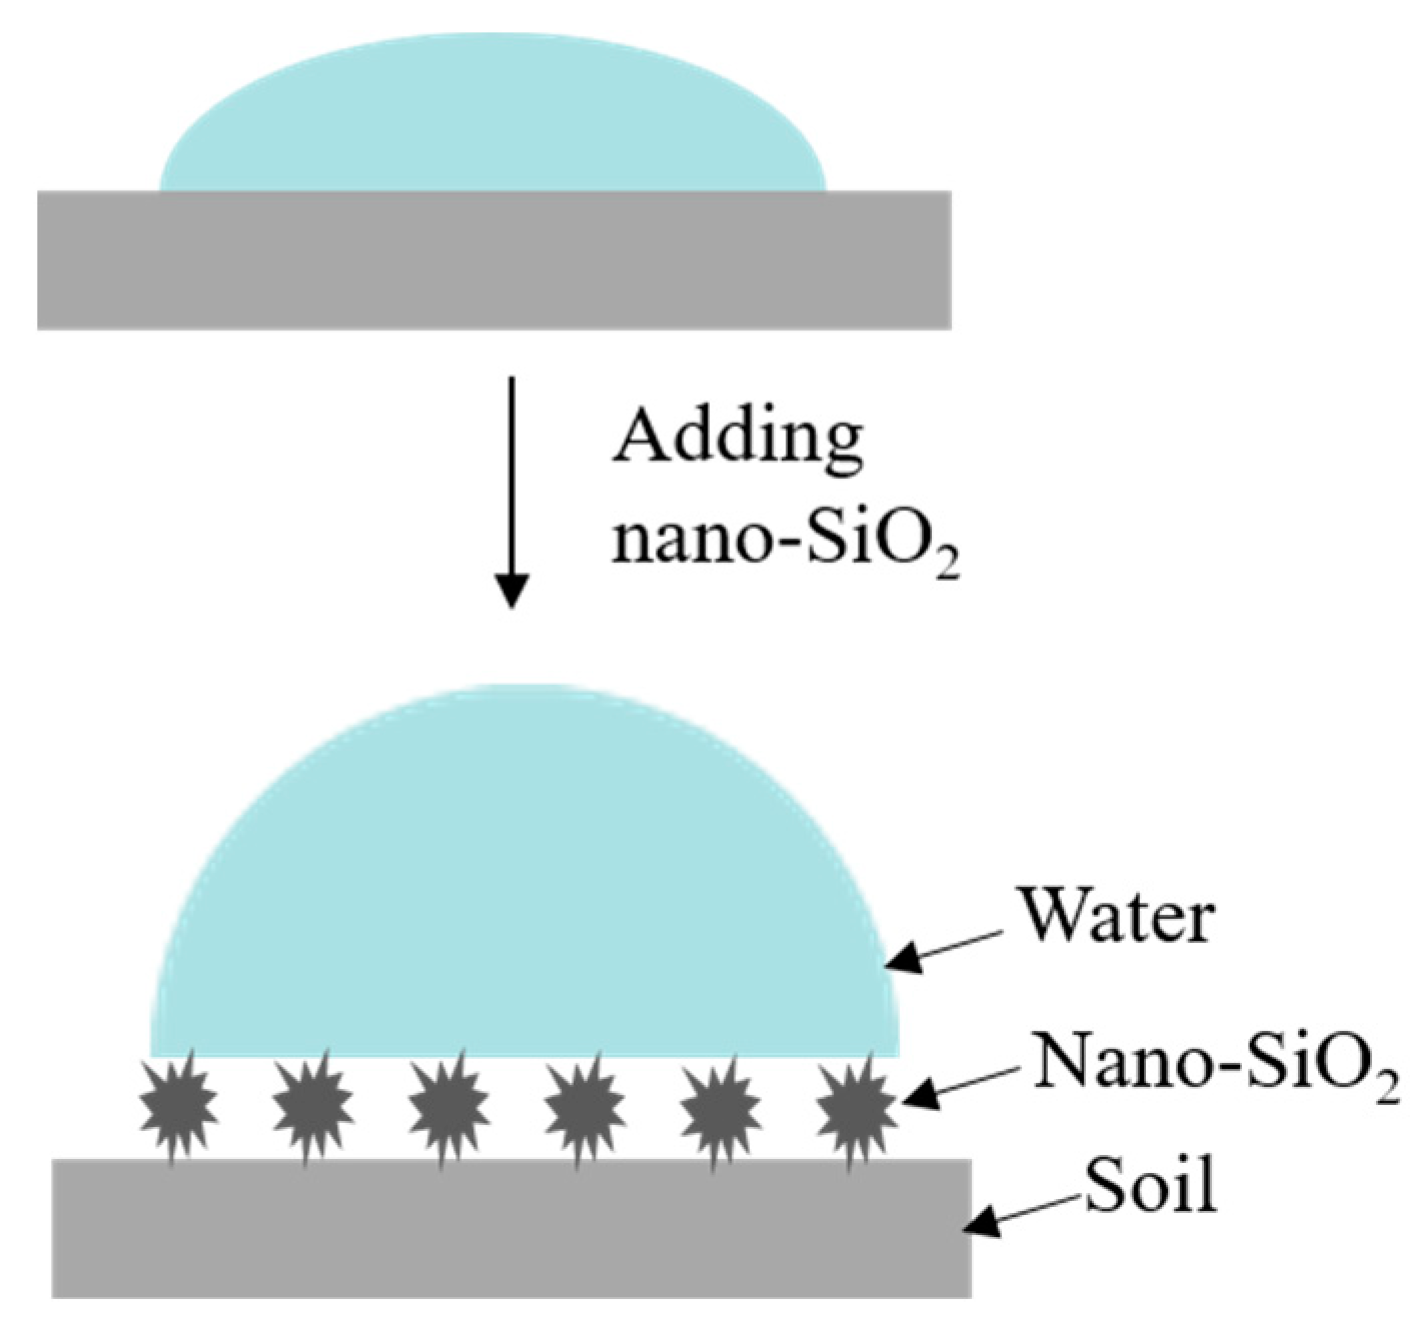
4.3. Effect of Nano-SiO2 on the Hydrophobicity of Soil Samples

Figure 10 shows the contact angle of samples with different superhydrophobic nano-SiO2 contents. With increased nano-SiO2 content, the contact angle of samples increased from 15 to 67 . After adding superhydrophobic nano-SiO2, the hydrophilicity of expansive soil was reduced. The microstructure of superhydrophobic nano-SiO2 was spherical and it had a flocculent and reticulate quasi-granular structure. Using scanning electron microscopy (SEM), the German scientist Barthlott [32] observed the upper surface of the lotus leaf and found that its superhydrophobicity is due to the micron mastoid structure and waxy shape on the surface (Figure 11). We speculated that nano-SiO2 formed a mastoid structure on the soil surface, similar to the surface of lotus leaves. Consequently, the modified soil surface had molecular-level hydrophobicity and became water repellent. To some extent, it can explain the gradual increase in the contact angle of soil samples with increasing nano-SiO2 content. The hydrophobic surface model of the modified soil is shown in Figure 12.

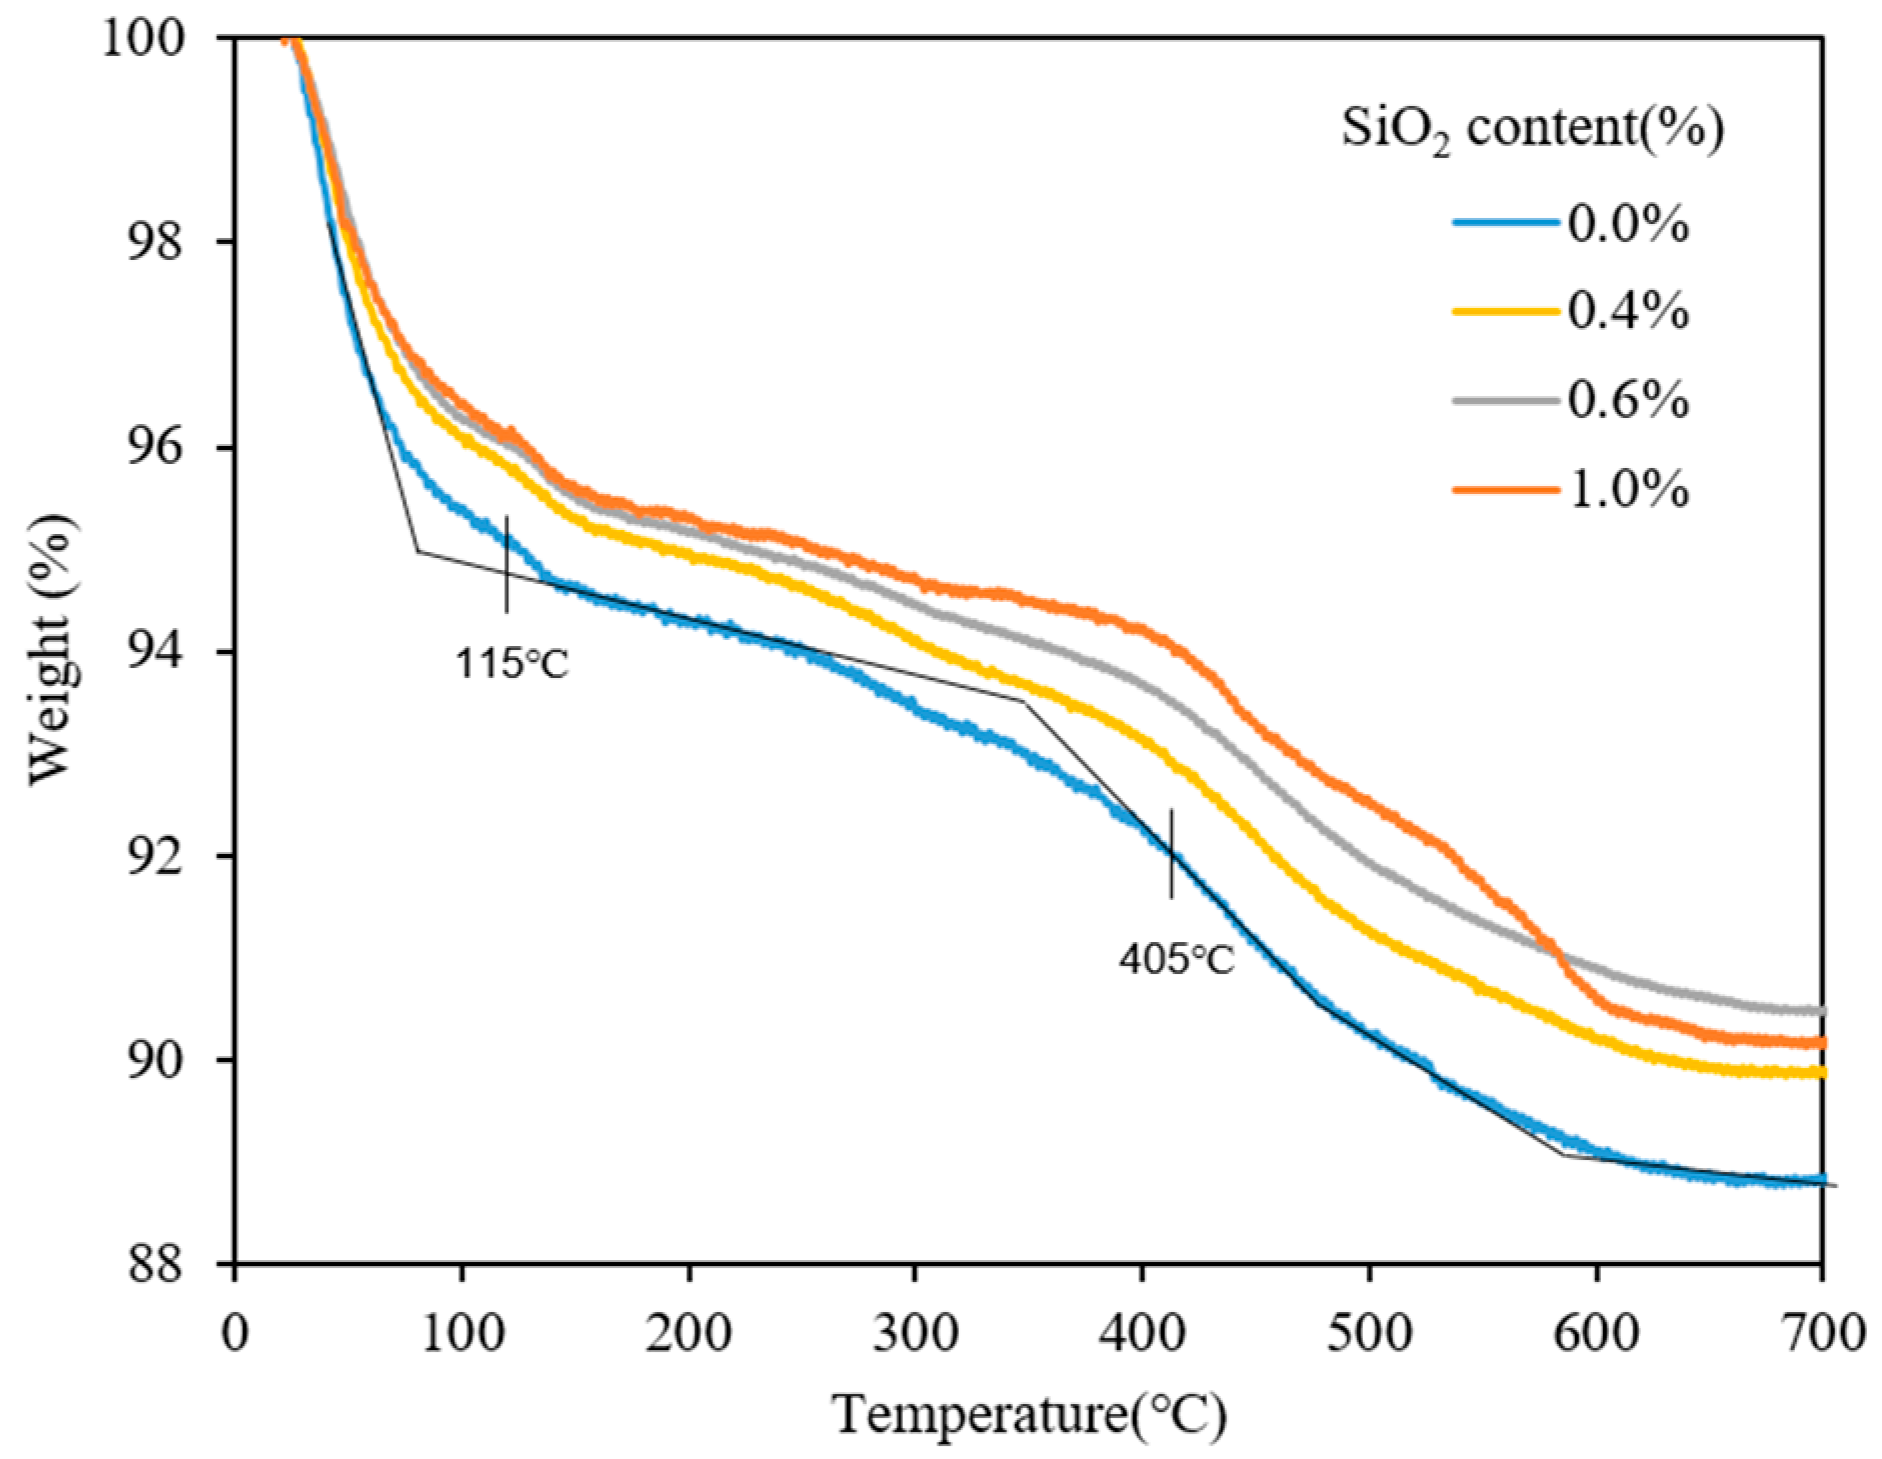
4.4. Effect of Nano-SiO2 on the TGA Curves of Soil Samples

The normalised TGA curves are shown in Figure 13. Figure 13 depicts the comparison of modified and unmodified samples. The trends of the four curves were the same, and they can be divided into three stages: between 30 °C and 115 °C, where the interlayer water and adsorbed water was removed; between 115 °C and 405 °C, where the bound water was removed; and between 405 °C and 700 °C, where the constitution water was removed. The water which influenced the hydraulic conductivity of the sample all escaped when the temperature reached 100–110 °C. The main hydrophilic clay mineral of soil samples is montmorillonite. Compared with unmodified soil, modified soil had a higher solid residual rate. The mass loss for the interlayer water and adsorbed water in montmorillonite of samples (with 0.0%, 0.4%, 0.6%, and 1.0% SiO2 content) were 4.75%, 4.01%, 3.87%, and 3.73%, respectively. The content of interlayer water and adsorbed water in montmorillonite decreased after adding superhydrophobic nano-SiO2.

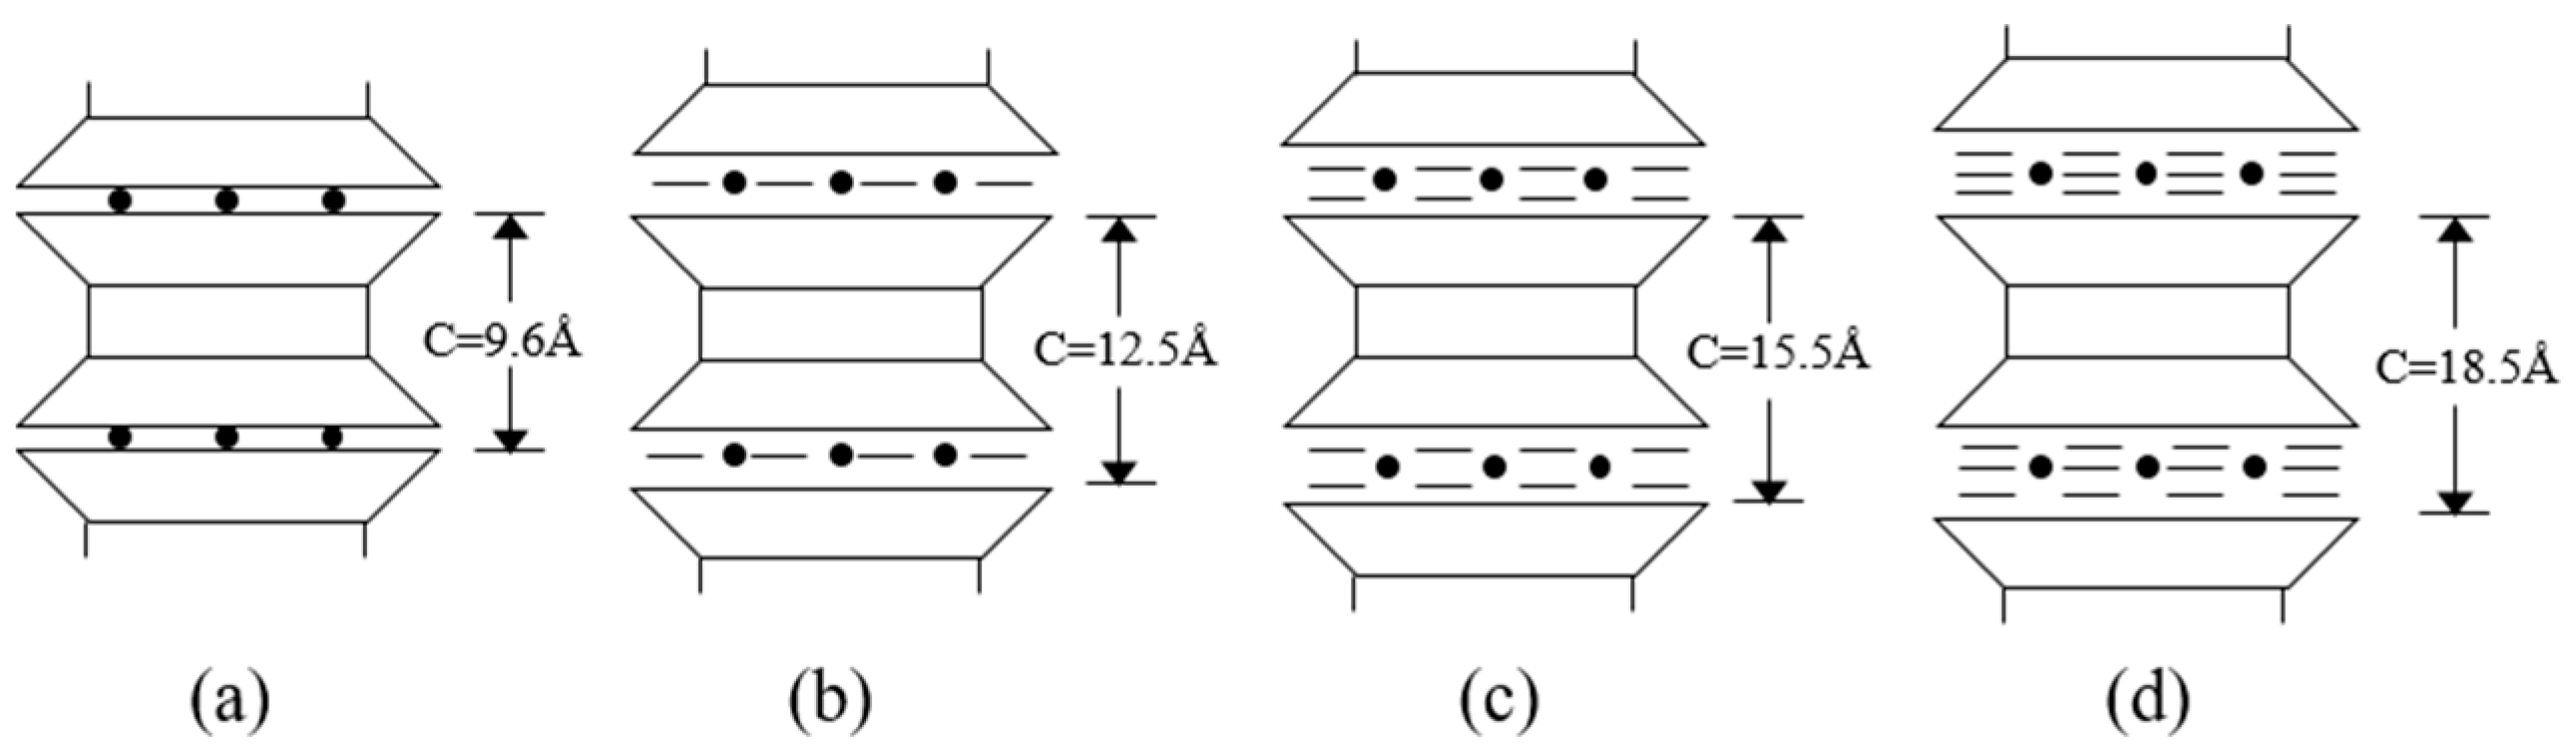
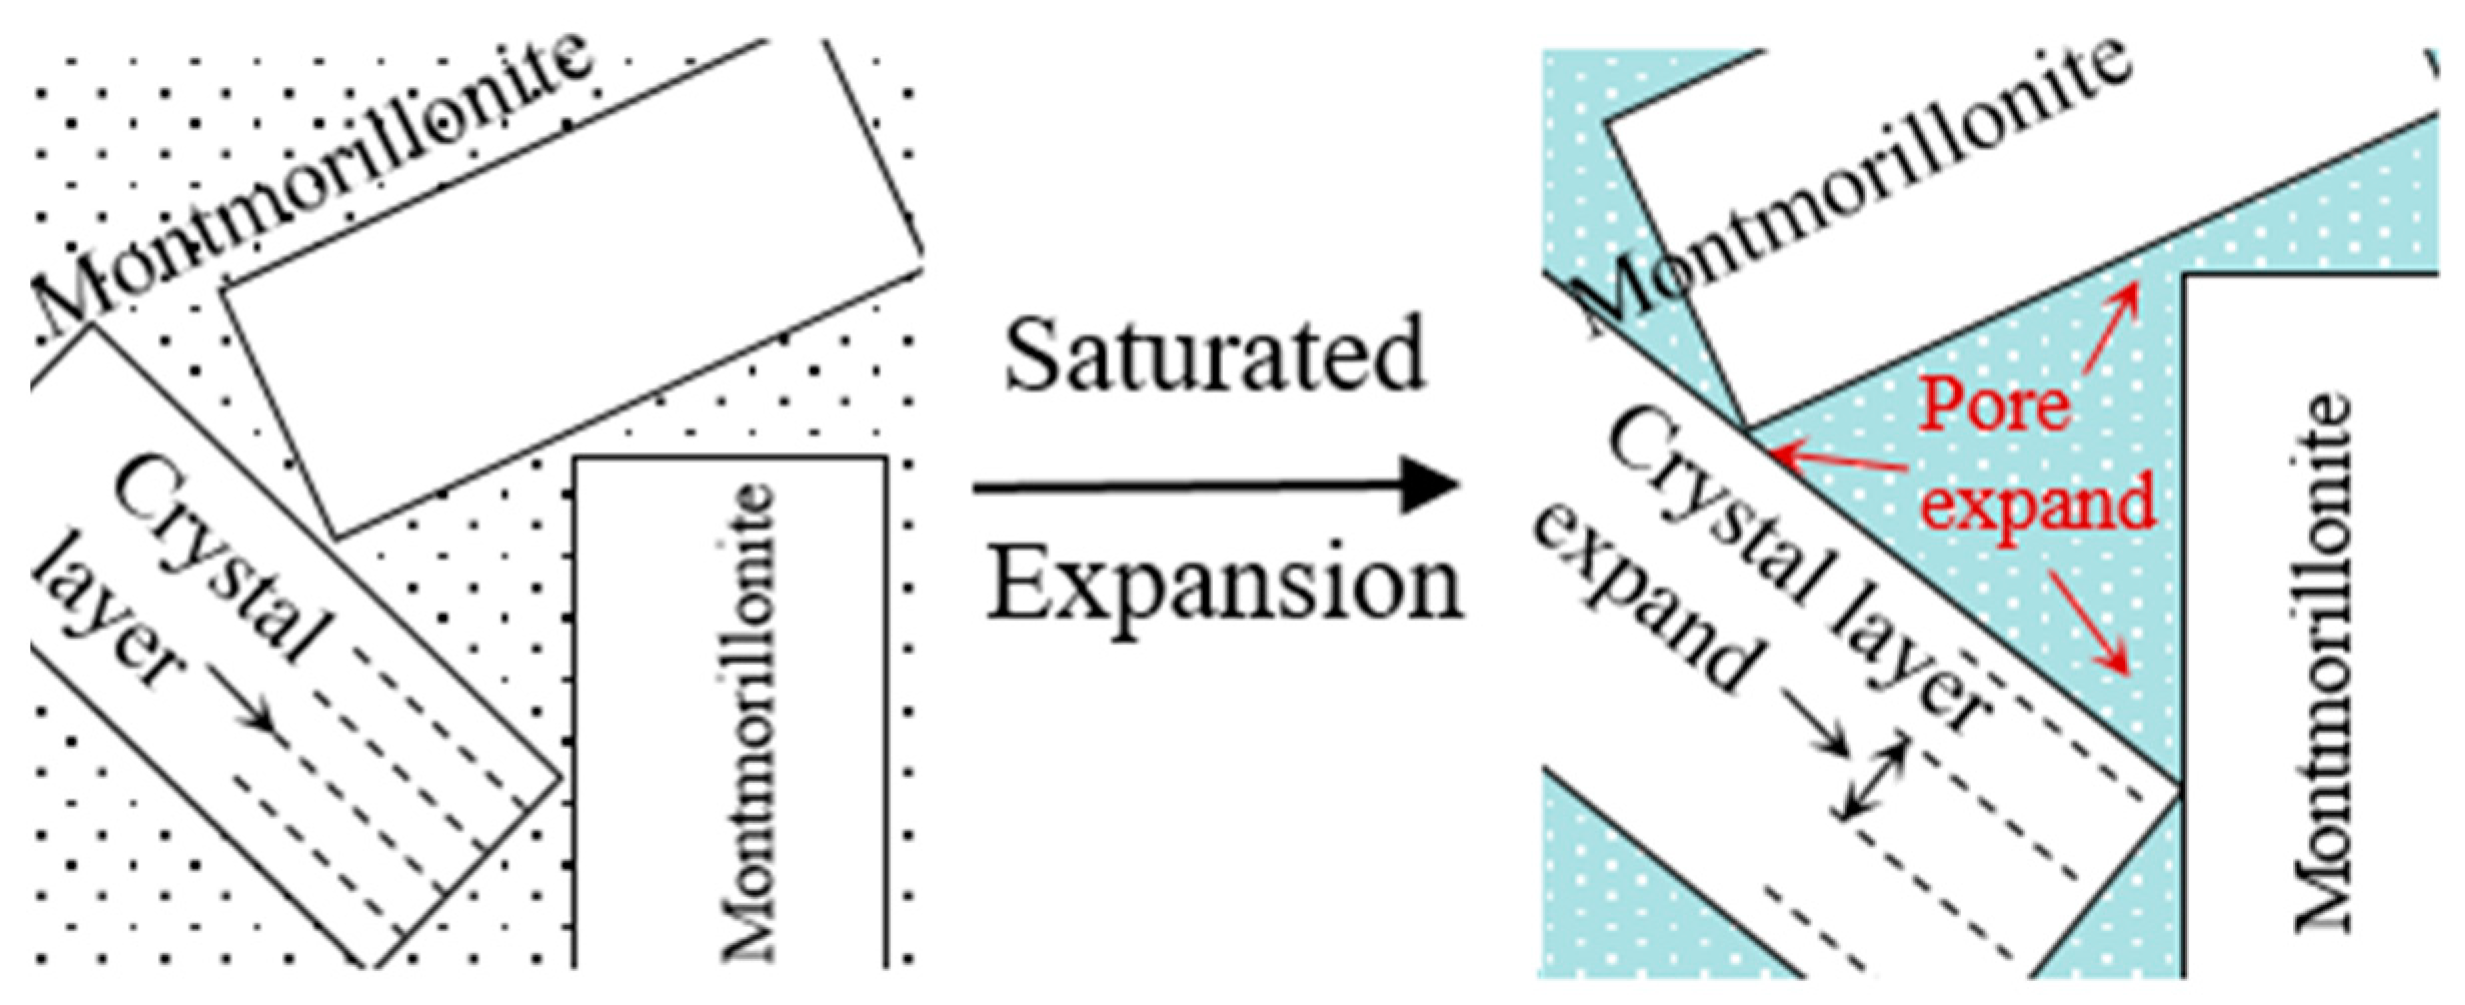
4.5. Mechanism of Superhydrophobic Nano-SiO2 on the PSD of Soil Samples

Montmorillonite is a 2:1-type mineral, and the C-axis of its unit crystal cell was variable owing to the different number of water layers between unit crystal layers, as shown in Figure 14. Generally, the number of the intercrystalline water layers is one, two, or three. The saturated soil samples had three stable water layers and the C-axis or crystal plane spacing was 18.5 Å, as shown in Figure 14d. Montmorillonite lost part of its water owing to evaporation in the atmosphere. When the atmospheric relative humidity was more than 50%, the number of water molecular layers was stable at two, as shown in Figure 14c. When the atmospheric relative humidity was low, such as less than 50%, calcareous montmorillonite still had two water layers. Conversely, for sodic montmorillonite, only one water layer may be maintained, as shown in Figure 14b. When the montmorillonite was baked at 105 °C for 24 h, the water layer can be completely lost between the crystal layers; it shrank to about 9.6 Å, as shown in Figure 14a. Except for the water layer, some cations balanced the positive charge of the crystal layer [33].
In the hydraulic-conductivity test, water was filled between the soil particles. The volume of expansive soil expanded after absorbing water and appeared to have structure loosening, as shown in Figure 15. The loose structure of expansive soil resulted in increased pore size, which primarily affected the amount of capillary water and free water. To some extent, the hydrophobic surface hindered water absorption from soil. Compared with unmodified soil, the surface of modified soil was more hydrophobic. Results of TGA revealed that after adding nano-SiO2, the content of interlayer water and adsorbed water decreased (Figure 13). Combined with the analysis of PSD obtained via NMR, after saturation, the expansion of montmorillonite crystal in the modified soil was smaller than that in the unmodified soil. Consequently, the crystal plane spacing of modified soil was smaller and the pore radius of micropores and medium pores was smaller, indicating that the volume change of samples was smaller.

5. Correlation between Hydraulic Conductivity and PSD of Modified Soil Samples

In soil, owing to the surface tension of water, the water in pores generated capillary negative pressure. The Young–Laplace equation can describe this negative pressure:
Δ p = ϒ 1 r 1 + 1 r 2
where Δ p is the capillary pressure (Pa), ϒ is the surface tension of water (N/m), and r 1 and r 2 are the radii of curvature of pore bodies 1 and 2 (cm), respectively.
Pores in soils can be considered as spherical pores [21], r 1 = r 2 = r ; thus, Equation (9) can also be written as follows:
Δ p = 2 ϒ r
When the hydraulic pressure ( P ) exceeded the capillary pressure, water may overcome the pressure of capillary water and permeate, hence hydraulic pressure ( P ) can be expressed as follows:
P = Δ p = 2 ϒ r
According to Equation (11), pores with a smaller radius had bigger capillary pressure, requiring larger hydraulic pressure for water to overcome the pressure of capillary water. Combined with the analysis of PSD obtained via NMR, this finding was probably due to the smaller pore radius of modified expansive soil than that of unmodified expansive soil (Figure 6), resulting in a higher average capillary negative pressure of the internal pores of modified expansive soil than that of unmodified expansive soil, and the internal pores were less permeable to water, so the hydraulic conductivity was smaller.
In the saturated soil in the test, we supposed that the pores in saturated soil had only one state, namely permeable or impermeable. Under a certain water-head pressure, the capillary force of some pores cannot hinder the flow of water because of the large radius, so the state of these pores was defined as permeable, whereas the state of the remaining smaller pores was defined as impermeable. When the water-head pressure cannot overcome the pressure of the capillary water of the pore, the pore was defined as a water-proof state. In the hydraulic-conductivity test, ϒ is 7.2   ×   10 3 N / m and P is 50 kPa. According to Equation (11), r was calculated as 0.288   μ m . To better analyse the results, pores with a radius greater than the permeable pore radius were defined as permeable pores, whereas the remaining pores were defined as impermeable.
The permeable pore volume of soil samples with different SiO2 contents is shown in Figure 16. When the hydraulic pressure was 50 kPa, the permeable pore volume of samples with different SiO2 contents (0%, 0.2%, 0.4%, 0.6%, 0.8%, and 1.0%) was 6.92, 5.38, 5.02, 3.68, 3.26, and 2.5 cm3, respectively. With increasing SiO2 content, the volume of the permeable pore in different samples gradually decreased. As shown in Figure 17, the relation between permeable pore volume and hydraulic conductivity was studied via linear regression analysis, and the coefficients of determination (R2) of the fitting curve was 0.98. This finding meant that permeable pore volume and hydraulic conductivity had a good linear relationship.

6. Conclusions

This study investigated the influence of superhydrophobic nano-SiO2 on hydraulic conductivity and PSD of expansive soil and then analysed the mechanism of modification between superhydrophobic nano-SiO2 and expansive soil from a microscopic view. Based on the investigation, the following conclusions can be summarised:
(1)
The hydraulic conductivity of soil samples decreased with increasing superhydrophobic nano-SiO2 content.
(2)
The PSD of expansive soil was changed by adding superhydrophobic nano-SiO2. After the hydraulic-conductivity test, the pore radius of micropore, medium pore, and macropore of modified soil was smaller than that of unmodified soil. This finding indicated that the pore volume of soil samples decreased with increasing nano-SiO2 content in the range of 0.0–1.0%.
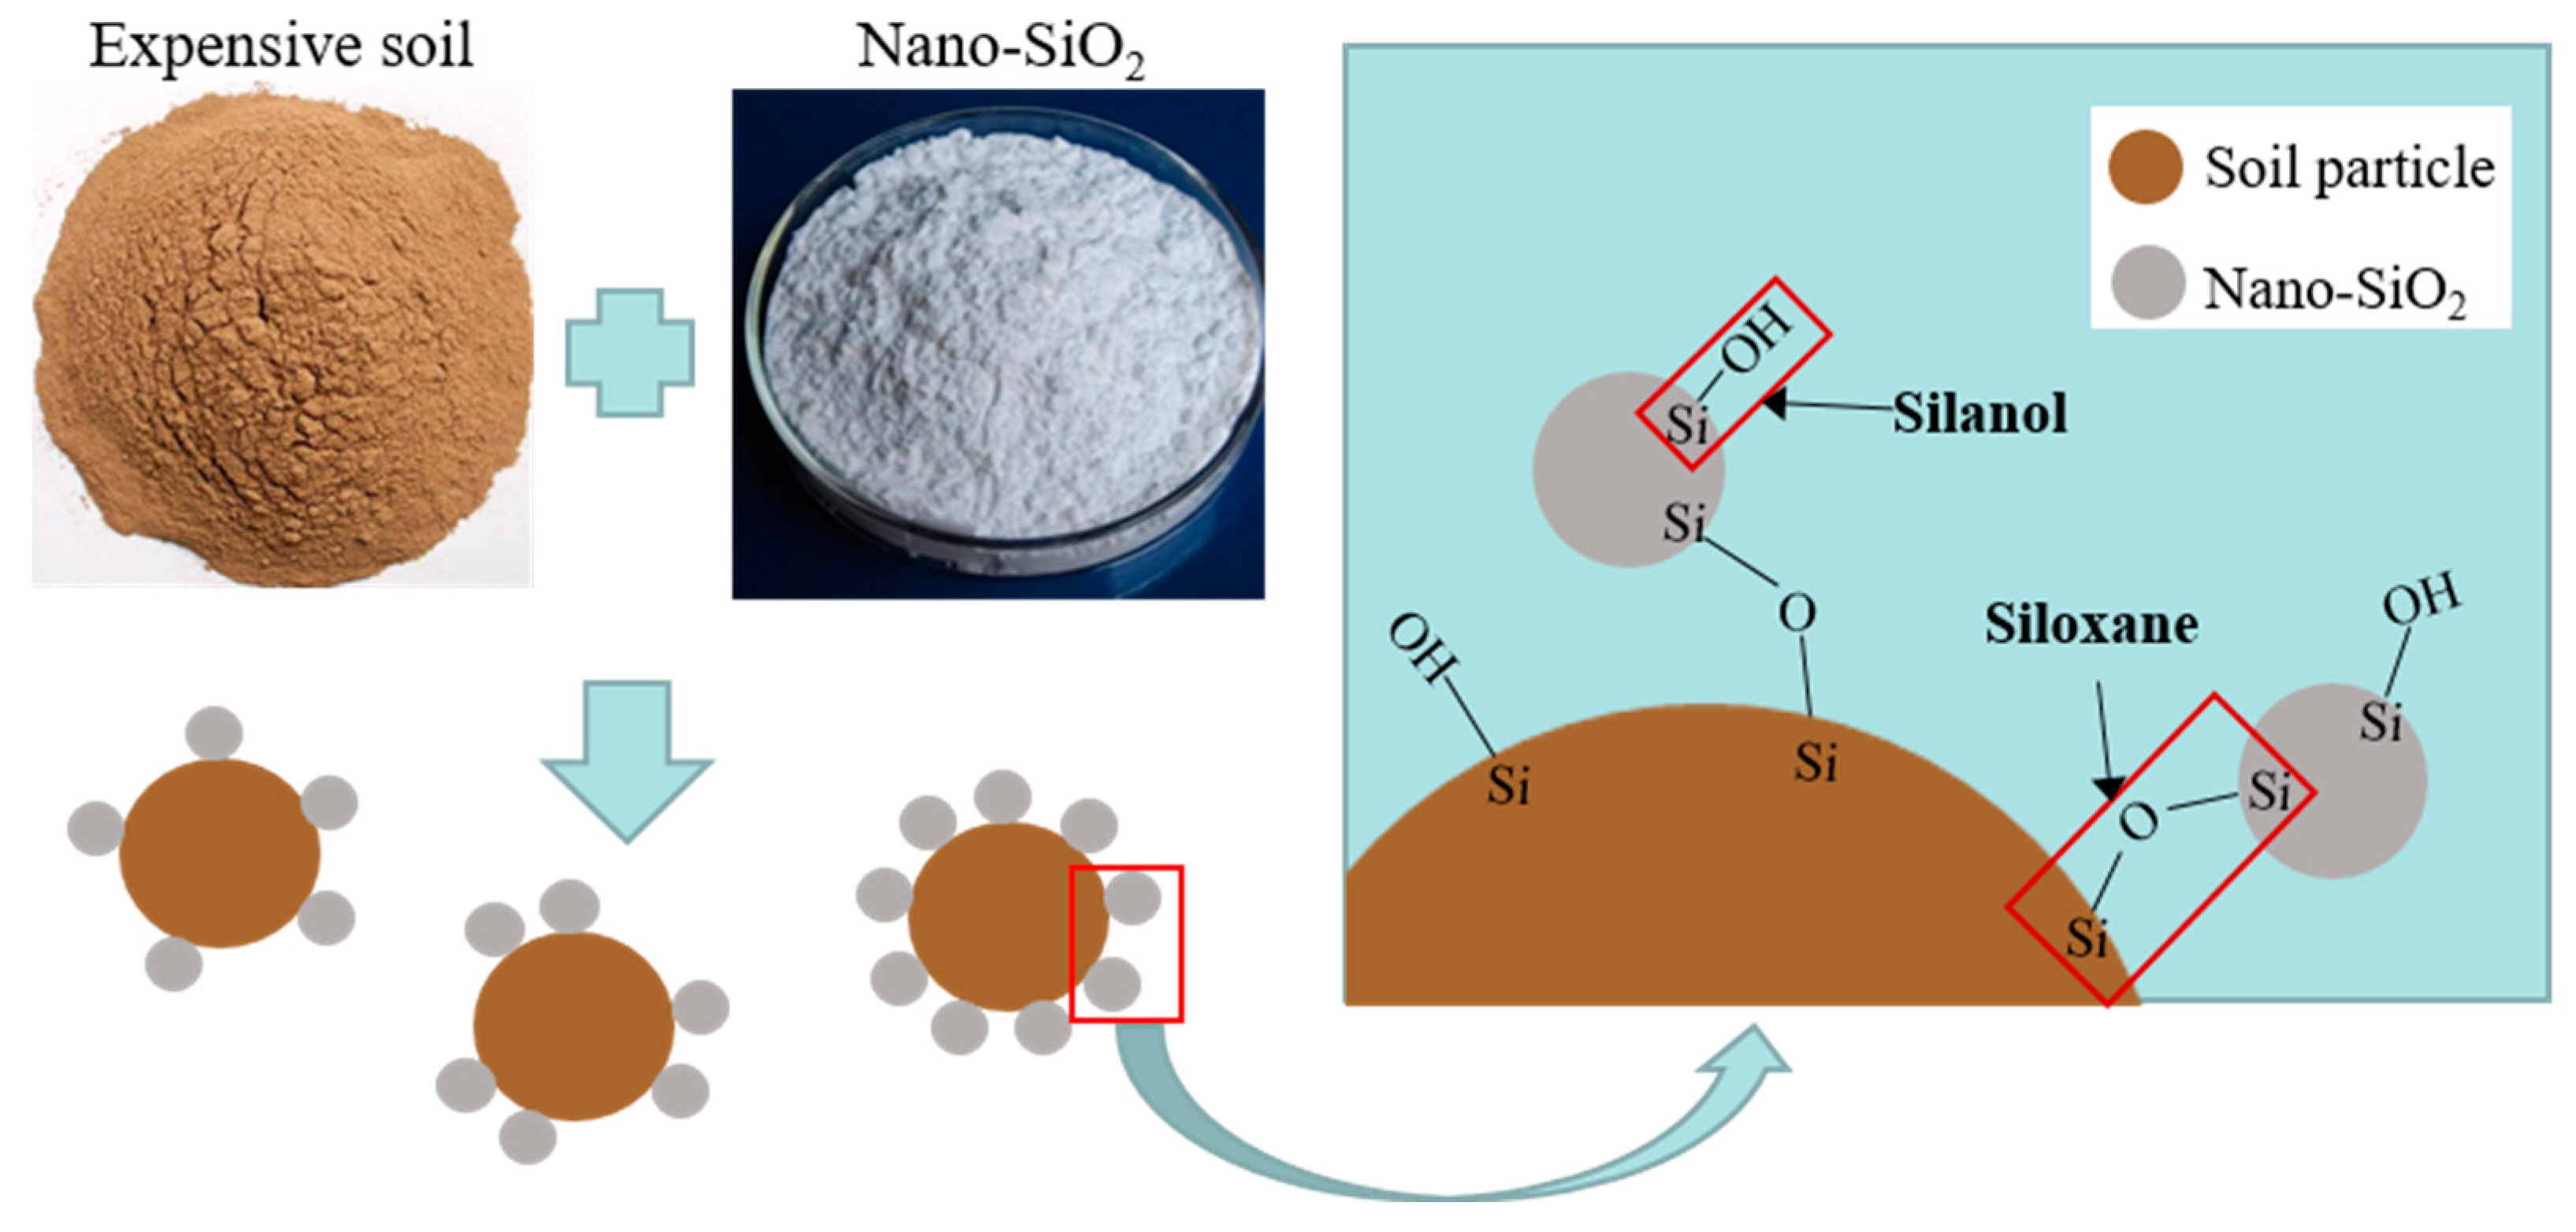
(3)
FTIR results indicated that the silanol on the nano-SiO2 surface reacted with the silanol on the surface of quartz to form new siloxane (=Si–O–Si=) after adding nano-SiO2, causing the nano-SiO2 to adhere onto the surface of the soil particles and thus reducing the hydrophilicity of expansive soil. After adding superhydrophobic nano-SiO2, the contact angle of samples increased from 15° to 67°. And TGA results revealed that the content of interlayer water and adsorbed water in montmorillonite decreased after adding superhydrophobic nano-SiO2.
(4)
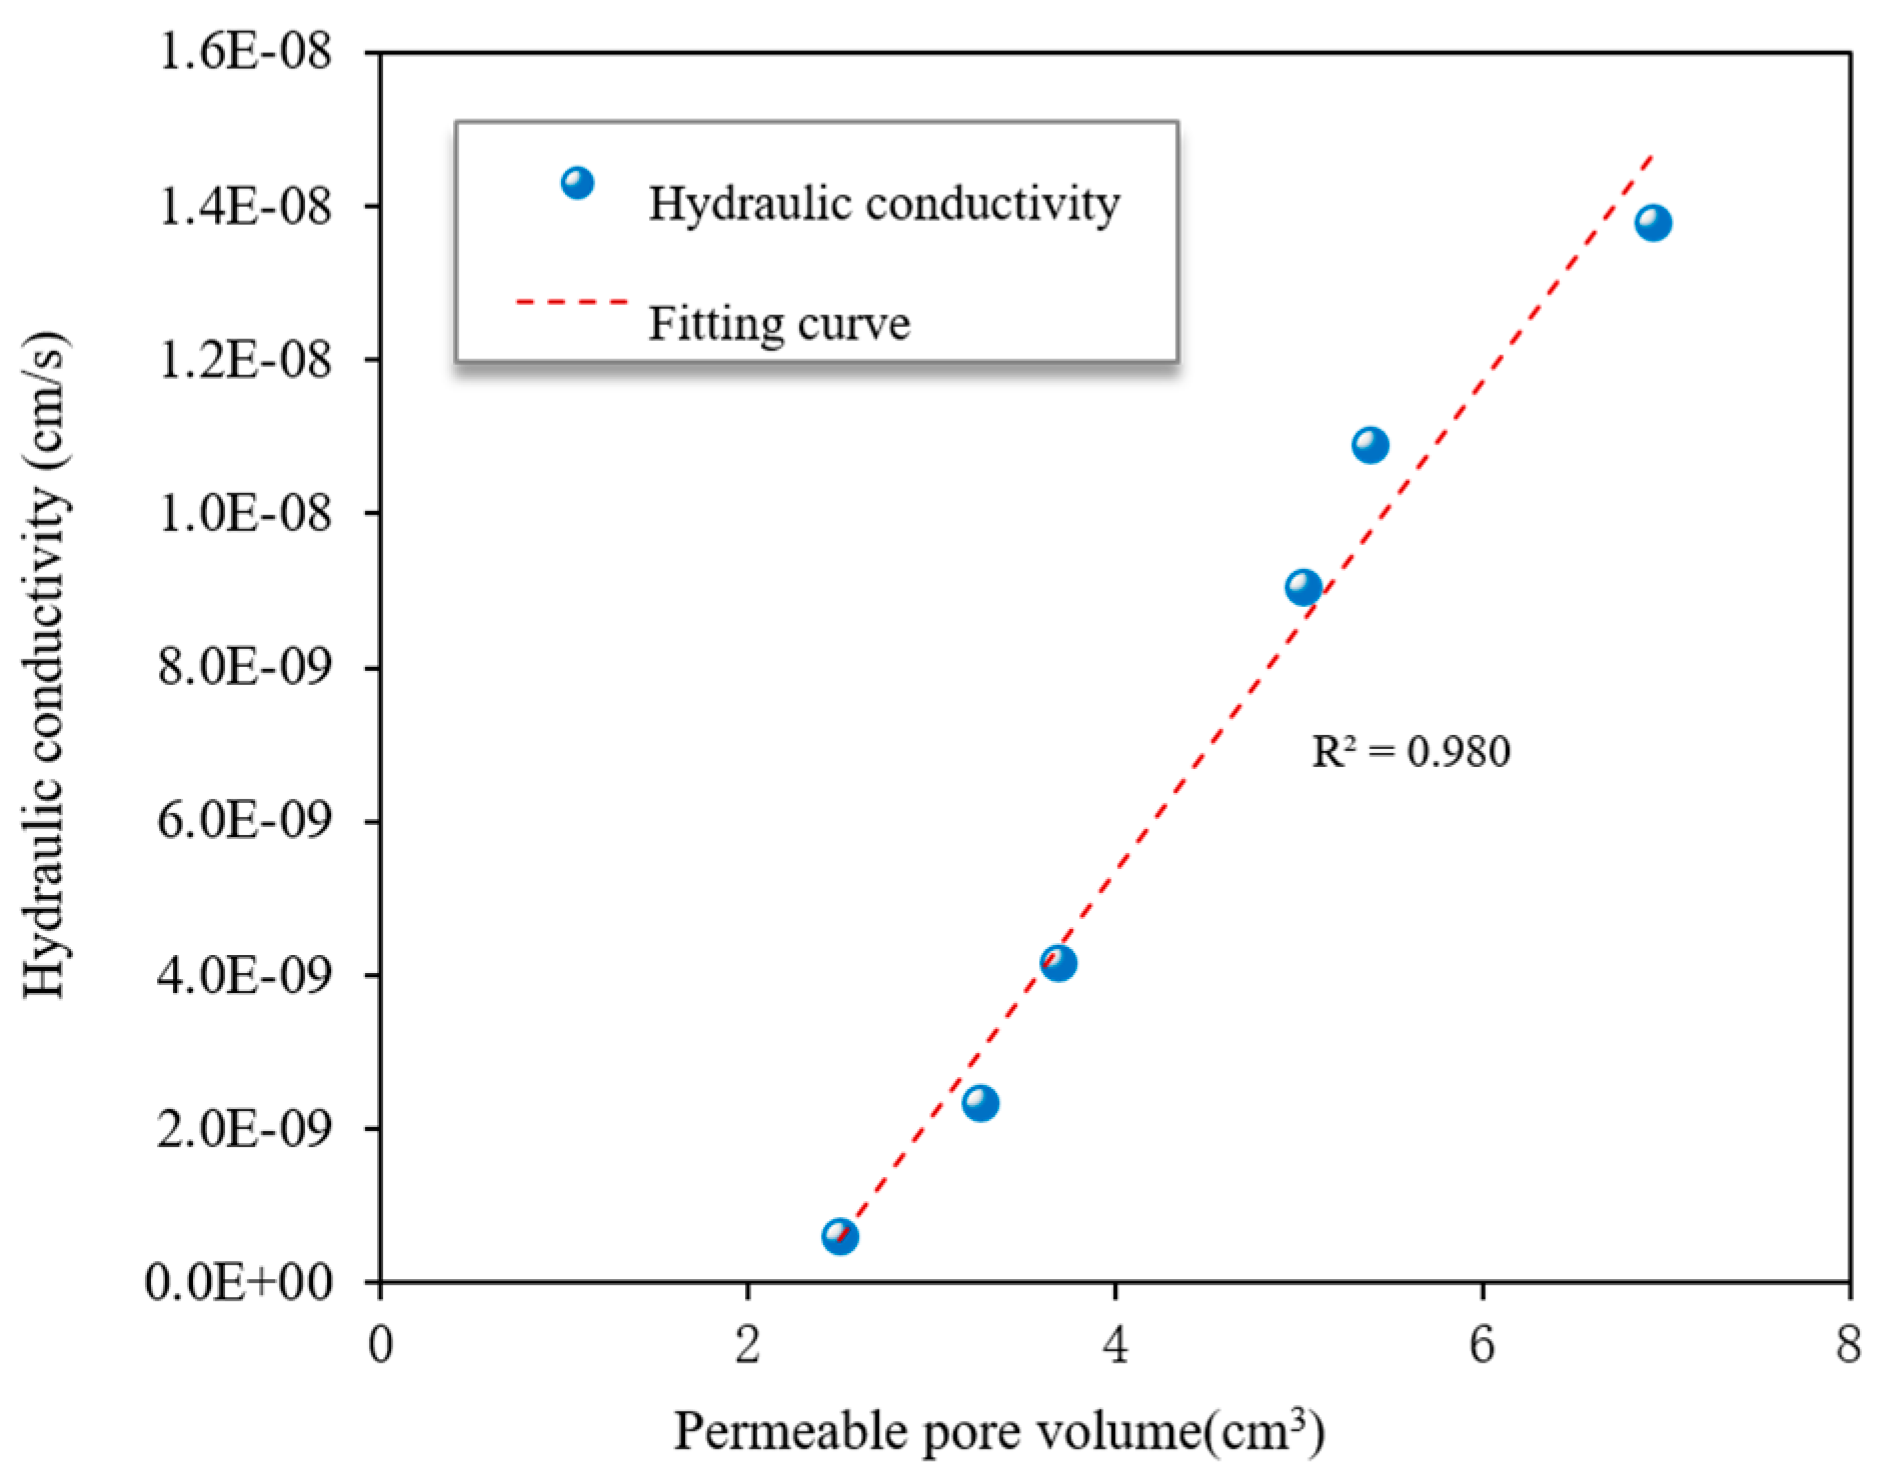
Based on the above test results, it can be stated that superhydrophobic nano-SiO2 could reduce the hydraulic conductivity by changing the PSD of expansive soil. It had an excellent linear relationship with the hydraulic conductivity and permeable pore volume of samples containing different nano-SiO2 contents.

Author Contributions

The paper was written by X.L. under the guidance of L.K. The formal analysis and pre-literature research were carried out by X.L. and W.B. The laboratory tests were carried out by X.L. All authors have read and agreed to the published version of the manuscript.

Funding

This research was funded by the financial support of the National Key R&D Program of China (Grant No. 2019YFC1509901) and the National Natural Science Foundation of China (Grant No. 41772339).

Data Availability Statement

All data generated or analysed during this study are included in this published article.

Acknowledgments

The authors appreciate to anonymous reviewers whose constructive comments were helpful for the improvement of this paper.

Conflicts of Interest

The authors declare no conflict of interest.

List of Symbols

F s shape factor
k ( cm / s )hydraulic conductivity
K S ( μ m 2 )permeability
r ( μ m )radius of pores
r 1 ( m )radius of curvature
r 2 ( m )radius of curvature
S ( μ m 2 )surface area
T 2 ( ms )relaxation time
T 2 B ( ms )bulk fluid relaxation time
T 2 D ( ms )diffusion relaxation time
T 2 LM ( ms )geometric mean value of T 2 spectrum
T 2 S ( ms )surface relaxation time
V ( μ m 3 )pore volume
ρ 2 ( μ m / ms )relaxation coefficient
ρ w ( g / cm 3 )density of water
ϕ (%)porosity
P ( Pa )hydraulic pressure
Δ p ( Pa )capillary pressure
ϒ ( N / m )surface tension of water

References

  1. Wang, M.; Kong, L.; Zhao, C.; Zang, M. Dynamic characteristics of lime-treated expansive soil under cyclic loading. J. Rock Mech. Geotech. Eng. 2012, 4, 352–359. [Google Scholar] [CrossRef]
  2. Kong, L.-W.; Zeng, Z.-X.; Bai, W.; Wang, M. Engineering geological properties of weathered swelling mudstones and their effects on the landslides occurrence in the Yanji section of the Jilin-Hunchun high-speed railway. Bull. Eng. Geol. Environ. 2018, 77, 1491–1503. [Google Scholar] [CrossRef]
  3. Cheng, Y.; Xu, Y.; Wang, L.; Wang, L. Stability of expansive soil slopes reinforced with anchor cables based on rotational-translational mechanisms. Comput. Geotech. 2022, 146, 104747. [Google Scholar] [CrossRef]
  4. Khan, M.S.; Hossain, S.; Ahmed, A.; Faysal, M. Investigation of a shallow slope failure on expansive clay in Texas. Eng. Geol. 2017, 219, 118–129. [Google Scholar] [CrossRef]
  5. Houston, S.L.; Bharadwaj, A.; Welfert, B.; Houston, W.N.; Walsh, K.D. Unsaturated Soil Mechanics Principles to Remove and Replace Mitigation for Expansive Clays. J. Geotech. Geoenviron. Eng. 2016, 142, 04015102. [Google Scholar] [CrossRef]
  6. Kananizadeh, N.; Ebadi, T.; Khoshniat, S.A.; Mousavirizi, S.E. The Positive Effects of Nanoclay on the Hydraulic Conductivity of Compacted Kahrizak Clay Permeated With Landfill Leachate. Clean Soil Air Water 2011, 39, 605–611. [Google Scholar] [CrossRef]
  7. Ng, C.W.W.; Coo, J.L. Hydraulic conductivity of clay mixed with nanomaterials. Can. Geotech. J. 2015, 52, 808–811. [Google Scholar] [CrossRef]
  8. Taha, O.M.E.; Taha, M.R. Soil-water characteristic curves and hydraulic conductivity of nanomaterial-soil-bentonite mixtures. Arab. J. Geosci. 2015, 9, 12. [Google Scholar] [CrossRef]
  9. Gallagher, P.; Lin, Y. Column Testing to Determine Colloidal Silica Transport Mechanisms. In Innovations in Grouting and Soil Improvement, Proceedings of the Geo-Frontiers 2005, Austin, TX, USA, 24–26 January 2005; ASCE: Reston, VA, USA, 2005; pp. 1–10. [Google Scholar] [CrossRef]
  10. Benzel, W.M.; Graf, D.L. Studies of smectite membrane behavior: Importance of layer thickness and fabric in experiments at 20 °C. Geochim. Cosmochim. Acta 1984, 48, 1769–1778. [Google Scholar] [CrossRef]
  11. Neithalath, N.; Sumanasooriya, M.S.; Deo, O. Characterizing pore volume, sizes, and connectivity in pervious concretes for permeability prediction. Mater. Charact. 2010, 61, 802–813. [Google Scholar] [CrossRef]
  12. An, R.; Kong, L.; Li, C. Pore Distribution Characteristics of Thawed Residual Soils in Artificial Frozen-Wall Using NMRI and MIP Measurements. Appl. Sci. 2020, 10, 544. [Google Scholar] [CrossRef] [Green Version]
  13. Sedighi, M.; Thomas, H.R. Micro porosity evolution in compacted swelling clays—A chemical approach. Appl. Clay Sci. 2014, 101, 608–618. [Google Scholar] [CrossRef]
  14. Kong, L.; Sayem, H.M.; Tian, H. Influence of drying–wetting cycles on soil-water characteristic curve of undisturbed granite residual soils and microstructure mechanism by nuclear magnetic resonance (NMR) spin-spin relaxation time (T2) relaxometry. Can. Geotech. J. 2018, 55, 208–216. [Google Scholar] [CrossRef] [Green Version]
  15. Luo, X.; Kong, L.-W.; Bai, W.; Jian, T. Effect of Superhydrophobic Nano-SiO2 on the Geotechnical Characteristics of Expansive Soil. J. Test. Eval. 2022, 50, 2932–2947. [Google Scholar] [CrossRef]
  16. Goydaragh, M.G.; Taghizadeh-Mehrjardi, R.; Jafarzadeh, A.A.; Triantafilis, J.; Lado, M. Using environmental variables and Fourier Transform Infrared Spectroscopy to predict soil organic carbon. CATENA 2021, 202, 105280. [Google Scholar] [CrossRef]
  17. Yuan, Z.; Teodoriu, C.; Schubert, J. Low cycle cement fatigue experimental study and the effect on HPHT well integrity. J. Pet. Sci. Eng. 2013, 105, 84–90. [Google Scholar] [CrossRef]
  18. ASTM D698-12e2; Standard Test Methods for Laboratory Compaction Characteristics of Soil Using Standard Effort (12 400 ft-lbf/ft3 (600 kN-m/m3)). ASTM International: West Conshohocken, PA, USA, 2012. [CrossRef]
  19. Wang, Y.; Yang, Q.; Liu, C.; Liu, H.; Lin, C.; Xiao, P.; Gong, L. Research progress of nonmetallic superhydrophobic nanocoating technology. Mater. Rev. 2020, 34, 66–71. [Google Scholar]
  20. Xi, Y.; Li, J.; Tao, Q.; Guo, B.; Liu, G. Experimental and numerical investigations of accumulated plastic deformation in cement sheath during multistage fracturing in shale gas wells. J. Pet. Sci. Eng. 2020, 187, 106790. [Google Scholar] [CrossRef]
  21. Xiao, L.; Mao, Z.-Q.; Zou, C.-C.; Jin, Y.; Zhu, J.-C. A new methodology of constructing pseudo capillary pressure (Pc) curves from nuclear magnetic resonance (NMR) logs. J. Pet. Sci. Eng. 2016, 147, 154–167. [Google Scholar] [CrossRef]
  22. Leij, F.J.; Ghezzehei, T.A.; Or, D. Analytical Models for Soil Pore-Size Distribution after Tillage. Soil Sci. Soc. Am. J. 2002, 66, 1104–1114. [Google Scholar] [CrossRef] [Green Version]
  23. Stingaciu, L.R.; Weihermüller, L.; Haber-Pohlmeier, S.; Stapf, S.; Vereecken, H.; Pohlmeier, A. Determination of pore size distribution and hydraulic properties using nuclear magnetic resonance relaxometry: A comparative study of laboratory methods. Water Resour. Res. 2010, 46, W11510. [Google Scholar] [CrossRef] [Green Version]
  24. Dunn, K.J.; Bergman, D.J.; Latorraca, G.A. (Eds.) Chapter 5 NMR logging applications. In Handbook of Geophysical Exploration: Seismic Exploration; Pergamon: Oxford, UK, 2002; Volume 32, pp. 129–164. [Google Scholar]
  25. Tian, H.; Wei, C.; Wei, H.; Yan, R.; Chen, P. An NMR-Based Analysis of Soil–Water Characteristics. Appl. Magn. Reson. 2014, 45, 49–61. [Google Scholar] [CrossRef]
  26. Gao, Q.-F.; Zhao, D.; Zeng, L.; Dong, H. A Pore Size Distribution-based Microscopic Model for Evaluating the Permeability of Clay. KSCE J. Civ. Eng. 2019, 23, 5002–5011. [Google Scholar] [CrossRef]
  27. Daigle, H.; Dugan, B. Extending NMR data for permeability estimation in fine-grained sediments. Mar. Pet. Geol. 2009, 26, 1419–1427. [Google Scholar] [CrossRef]
  28. Xiong, H.; Yuan, K.; Wen, M.; Yu, A.; Xu, J. Influence of pore structure on the moisture transport property of external thermal insulation composite system as studied by NMR. Constr. Build. Mater. 2019, 228, 116815. [Google Scholar] [CrossRef]
  29. Ghebleh Goydaragh, M.; Taghizadeh-Mehrjardi, R.; Golchin, A.; Asghar Jafarzadeh, A.; Lado, M. Predicting weathering indices in soils using FTIR spectra and random forest models. CATENA 2021, 204, 105437. [Google Scholar] [CrossRef]
  30. Madejová, J. FTIR techniques in clay mineral studies. Vib. Spectrosc. 2003, 31, 1–10. [Google Scholar] [CrossRef]
  31. Müller, C.M.; Pejcic, B.; Esteban, L.; Piane, C.D.; Raven, M.; Mizaikoff, B. Infrared Attenuated Total Reflectance Spectroscopy: An Innovative Strategy for Analyzing Mineral Components in Energy Relevant Systems. Sci. Rep. 2014, 4, 6764. [Google Scholar] [CrossRef] [Green Version]
  32. Barthlott, W.; Neinhuis, C. Purity of the sacred lotus, or escape from contamination in biological surfaces. Planta 1997, 202, 1–8. [Google Scholar] [CrossRef]
  33. Tan, R.; Kong, L. Engineering Properties of Special Rock and Soil; Science Press: Beijing, China, 2006. [Google Scholar]
Figure 1. Grading curve of expansive soil used in this study.
Applsci 13 08198 g001
Figure 2. Flexible wall permeameter system.
Applsci 13 08198 g002
Figure 3. The photo of nuclear magnetic resonance equipment.
Applsci 13 08198 g003
Figure 4. Relationship between hydraulic conductivity and different superhydrophobic nano-SiO2 contents.
Applsci 13 08198 g004
Figure 5. The T 2 spectrum curves of samples with different SiO2 contents after hydraulic conductivity test.
Applsci 13 08198 g005
Figure 6. The pore volume distributions of soil samples with different SiO2 contents after hydraulic conductivity test.
Applsci 13 08198 g006
Figure 7. (a) The micropore radius of soil samples with different SiO2 contents after hydraulic conductivity test, (b) the medium pore radius of soil samples with different SiO2 contents after hydraulic conductivity test, (c) the macrpore radius of soil samples with different SiO2 contents after hydraulic conductivity test.
Applsci 13 08198 g007
Figure 8. FTIR spectra of samples.
Applsci 13 08198 g008
Figure 9. The schematic diagram of the reaction between soil and superhydrophobic nano-SiO2.
Applsci 13 08198 g009
Figure 10. The contact angles of samples with different superhydrophobic nano-SiO2 contents.
Applsci 13 08198 g010
Figure 11. (a) Micro-topography of the upper surface of the lotus leaf. Bar = 20 μ m ; (b) mercury droplet on the adaxial leaf surface of Colocasia esculenta, demonstrating the lotus effect. Contaminating particles adhere to the surface of the droplet and are removed from the leaf when the droplet rolls off. Bar = 50 μ m [32].
Applsci 13 08198 g011
Figure 12. Hydrophobic surface model of modified soil.
Applsci 13 08198 g012
Figure 13. TGA curves of soil samples.
Applsci 13 08198 g013
Figure 14. Schematic diagram of water molecules in crystal layer of montmorillonite [33].
Applsci 13 08198 g014
Figure 15. The pore size distribution of sample before and after saturated.
Applsci 13 08198 g015
Figure 16. The permeable pore volume of soil samples with different SiO2 contents.
Applsci 13 08198 g016
Figure 17. The relationship between permeable pore volume and hydraulic conductivity.
Applsci 13 08198 g017
Table 1. Properties of expansive soil used in this study.
PropertiesValue
Specific gravity2.64
Sand (2 mm ≥ d > 0.075 mm) (%)2.0
Silt (0.075 mm ≥ d > 0.005 mm) (%)43.0
Clay (d ≤ 0.005 mm) (%)55.0
Free swelling ratio (%)52.0
Liquid limit (%)48.3
Plastic limit (%)22.8
Optimum water content (%)18.0
Maximum dry density (g/cm3)1.78
Table 2. Physical properties of superhydrophobic nano-SiO2.
PropertiesValue
Nano typeHydrophobic nano-SiO2
SiO2 purity (%)99
Average particle size (nm)20
Specific surface area (m2/g)180
PH5.5–6.5
ColourWhite
Contact angle (°)151.9
Table 3. Pore size distributions of samples.
SiO2 Content (%)Total Pore Volume (cm3) Pore   Radius   ( μ m )
r < 0.010.01 ≤ r < 0.10.1 ≤ r < 11 ≤ r
Volume (cm3)
068.50.9739.6025.172.73
0.267.41.1141.7522.273.38
0.466.31.1541.7220.642.79
0.663.01.1340.7019.201.97
0.861.71.2541.1016.742.47
1.059.61.3841.9814.331.91
Disclaimer/Publisher’s Note: The statements, opinions and data contained in all publications are solely those of the individual author(s) and contributor(s) and not of MDPI and/or the editor(s). MDPI and/or the editor(s) disclaim responsibility for any injury to people or property resulting from any ideas, methods, instructions or products referred to in the content.

