

Shear Transfer Resistance with Different Interface Conditions: Evaluation of Design Provisions and Proposed Equation


Abstract
:1. Introduction
2. Background and Design Provisions of Interface Shear
- ACI 318-19 [16]
- PCI Design Handbook, seventh edition [17]
- AASHTO LRFD (2020) [18]
- CSA-S6-06 [19]
- Eurocode 2 (EN 1992-1-1:2004) [20]
- Fib model code 2010 [21]
3. Database
4. Evaluation of Design Provisions
5. Effect of Key Parameters
6. Proposal of the Design Equation
7. Evaluation of the Proposed Equation
8. Conclusions
- (1)
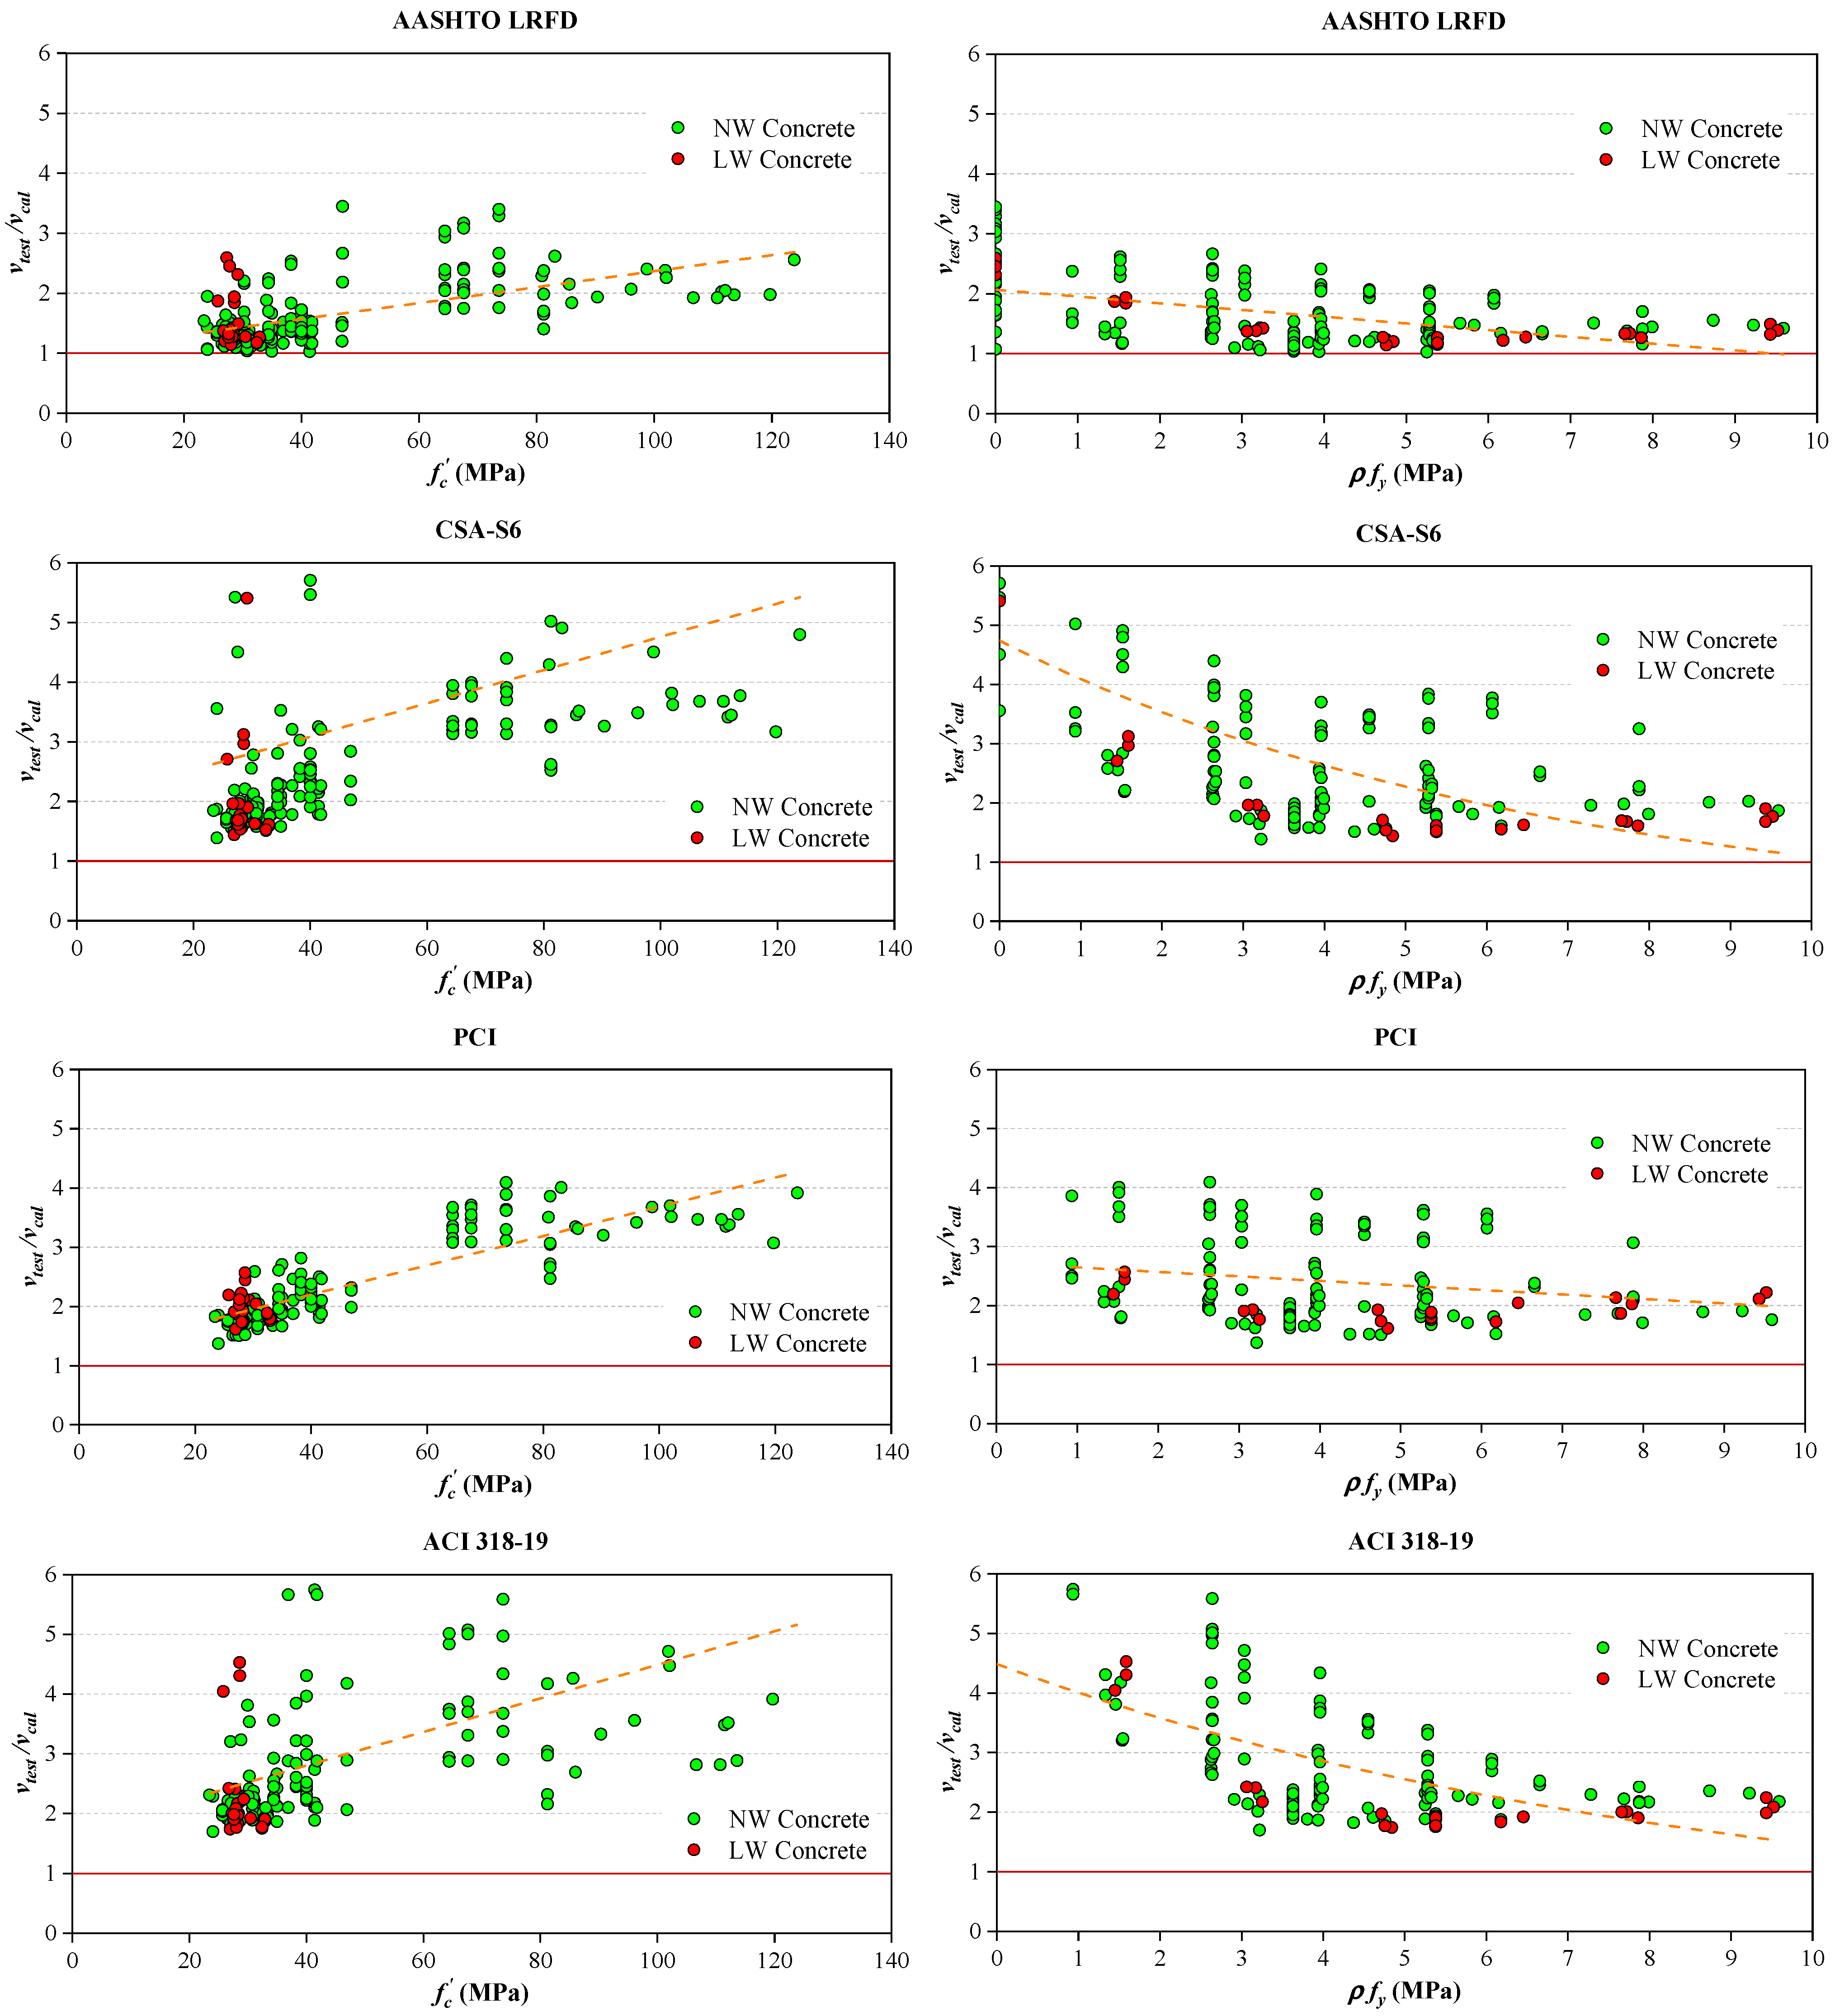
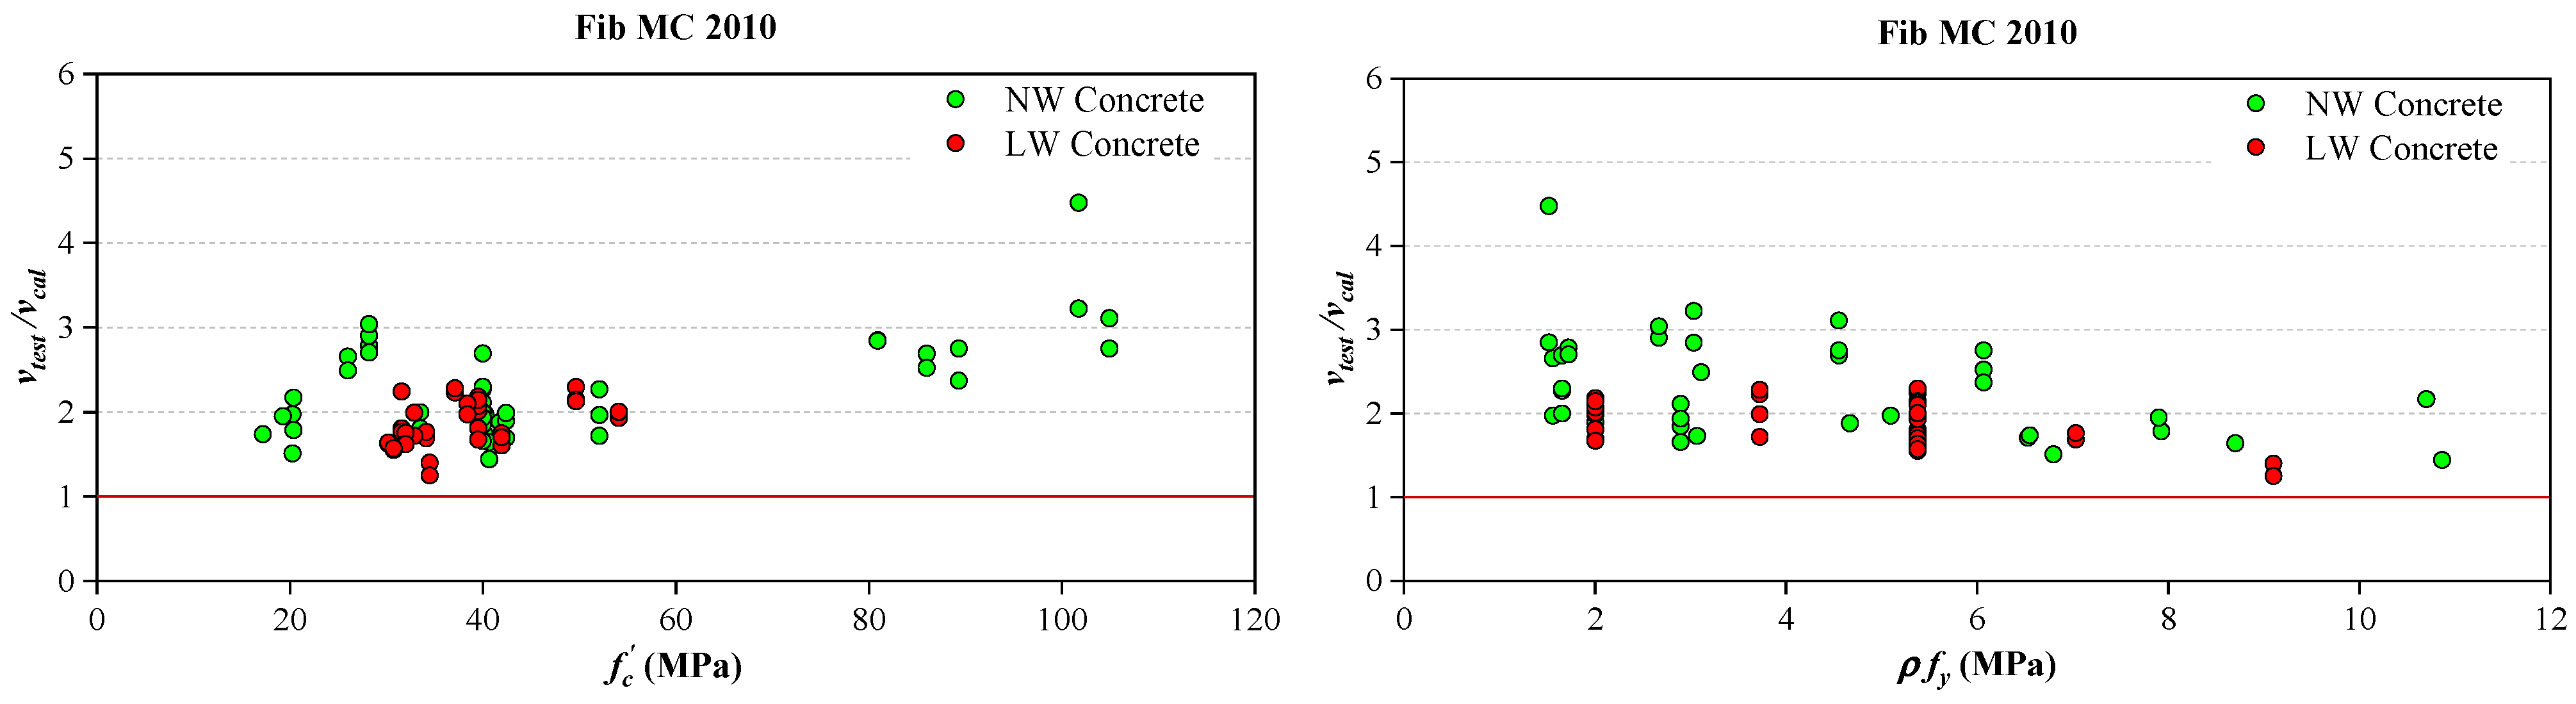
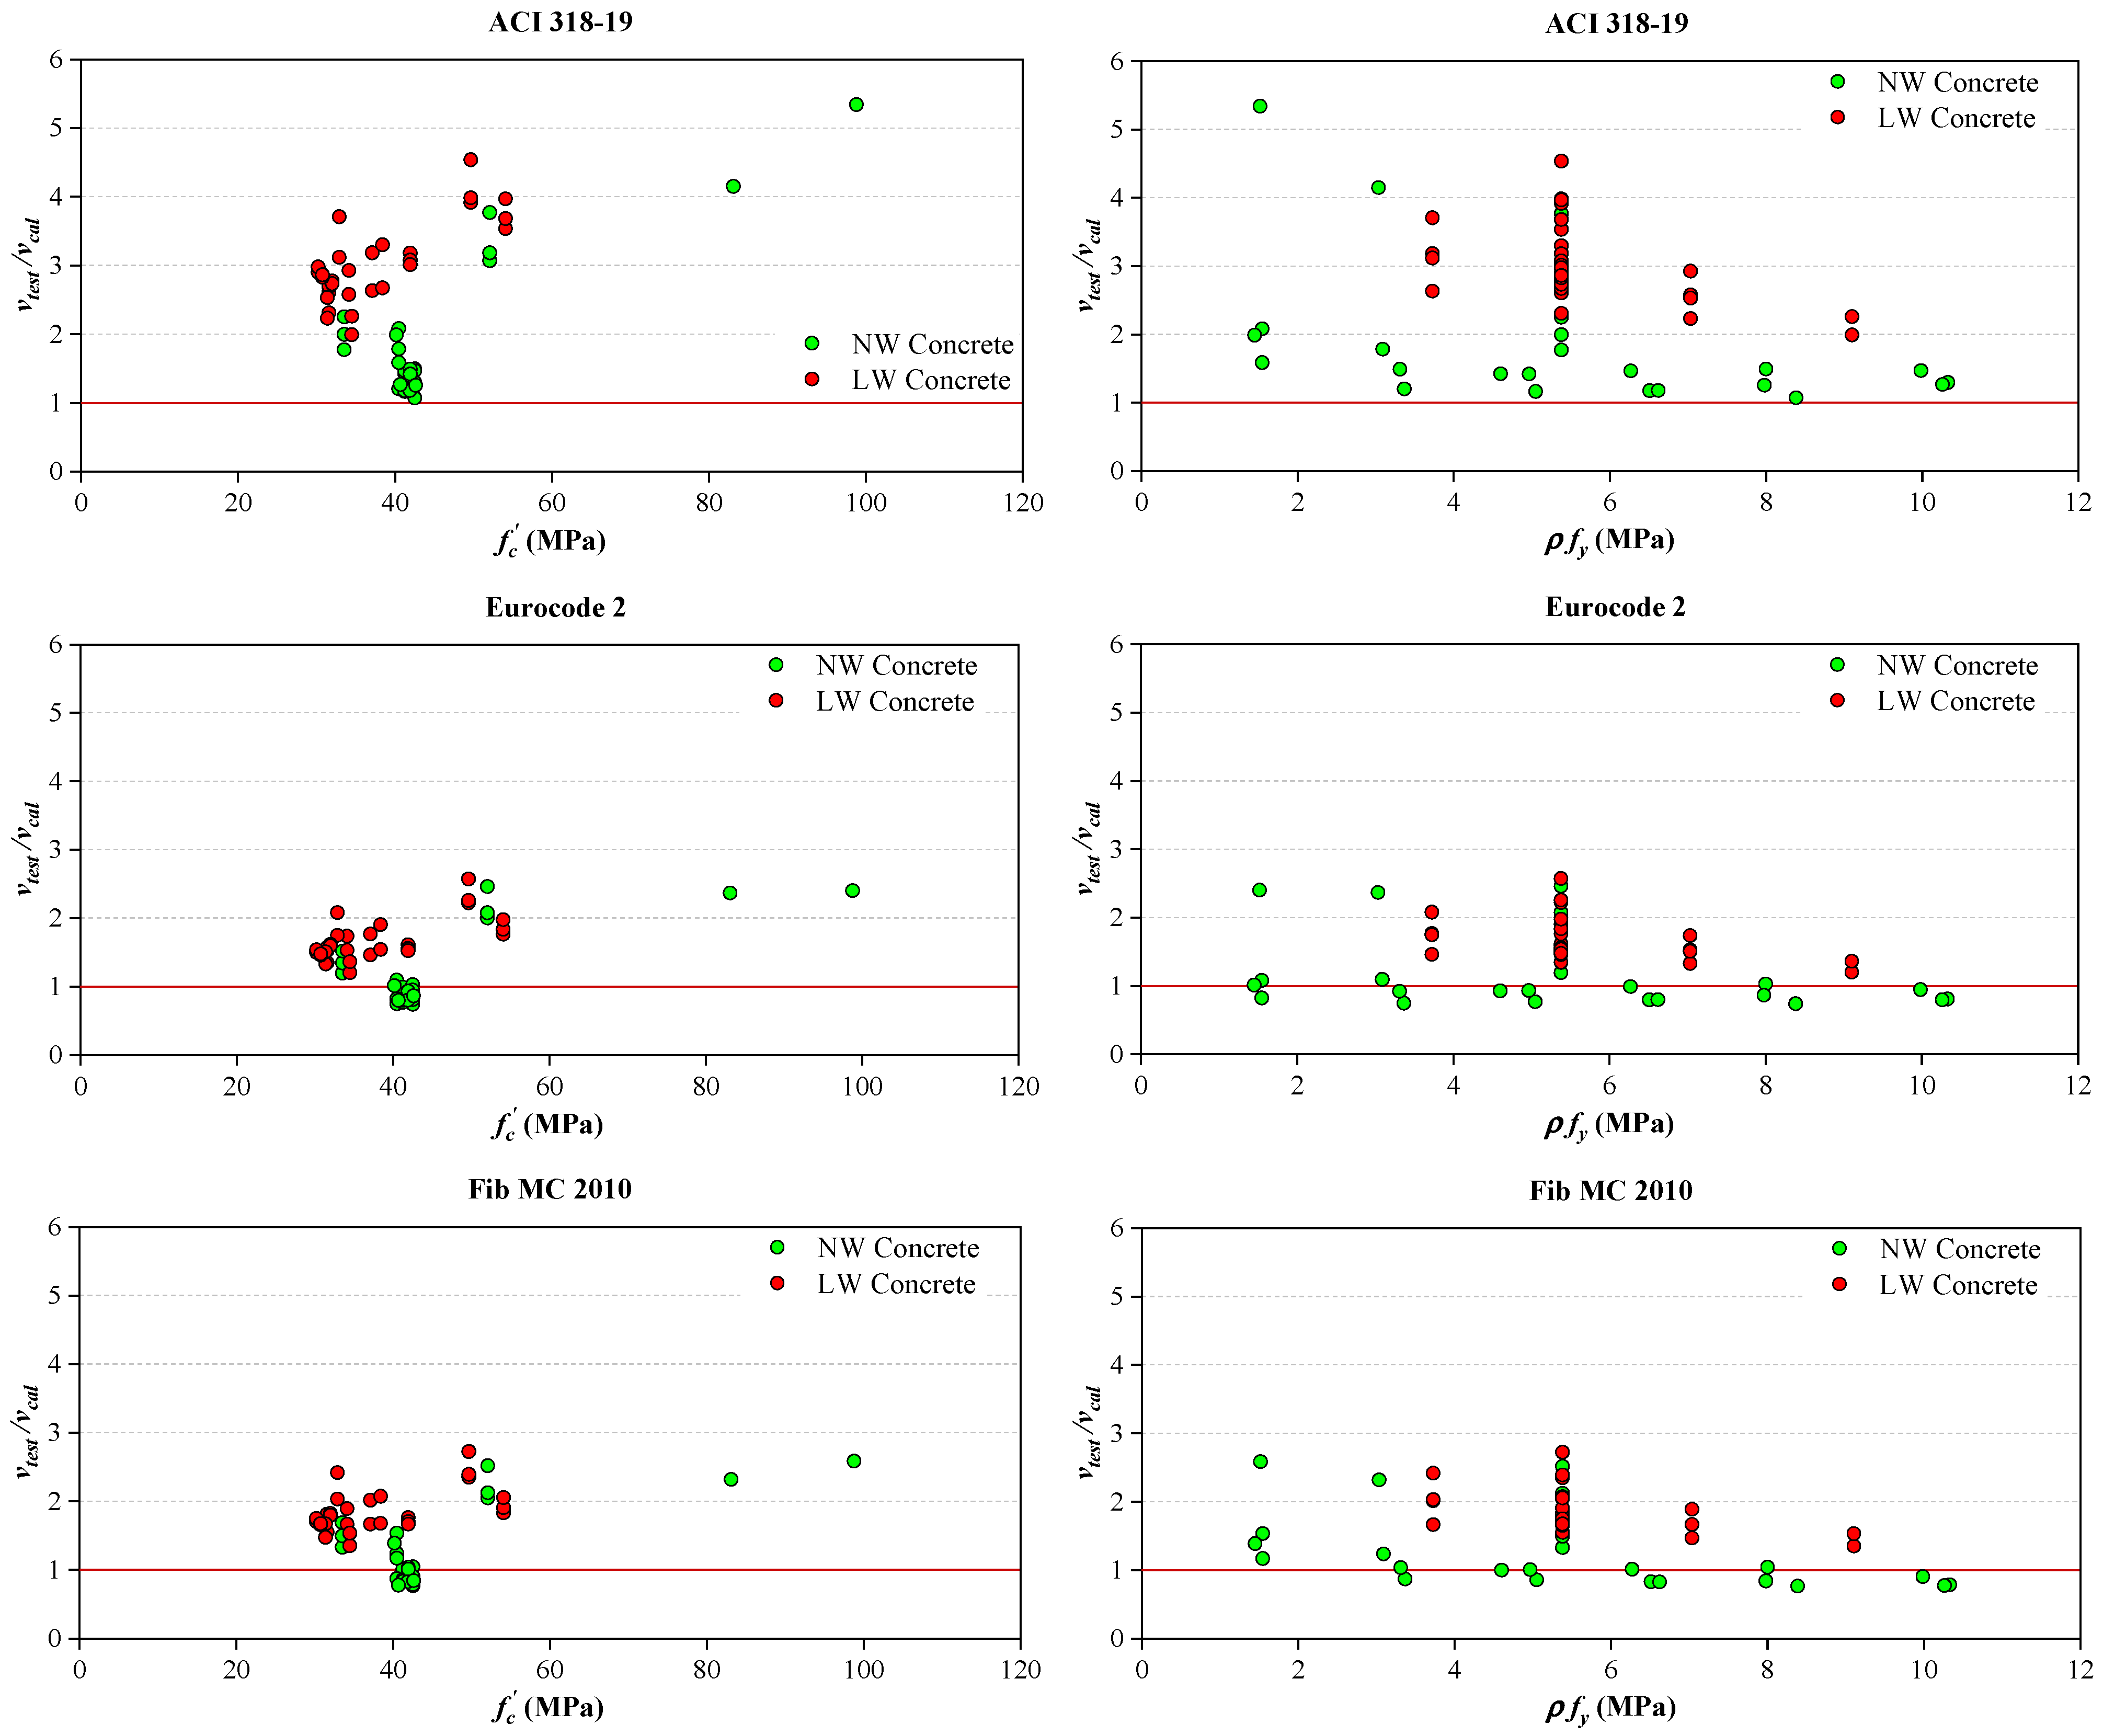
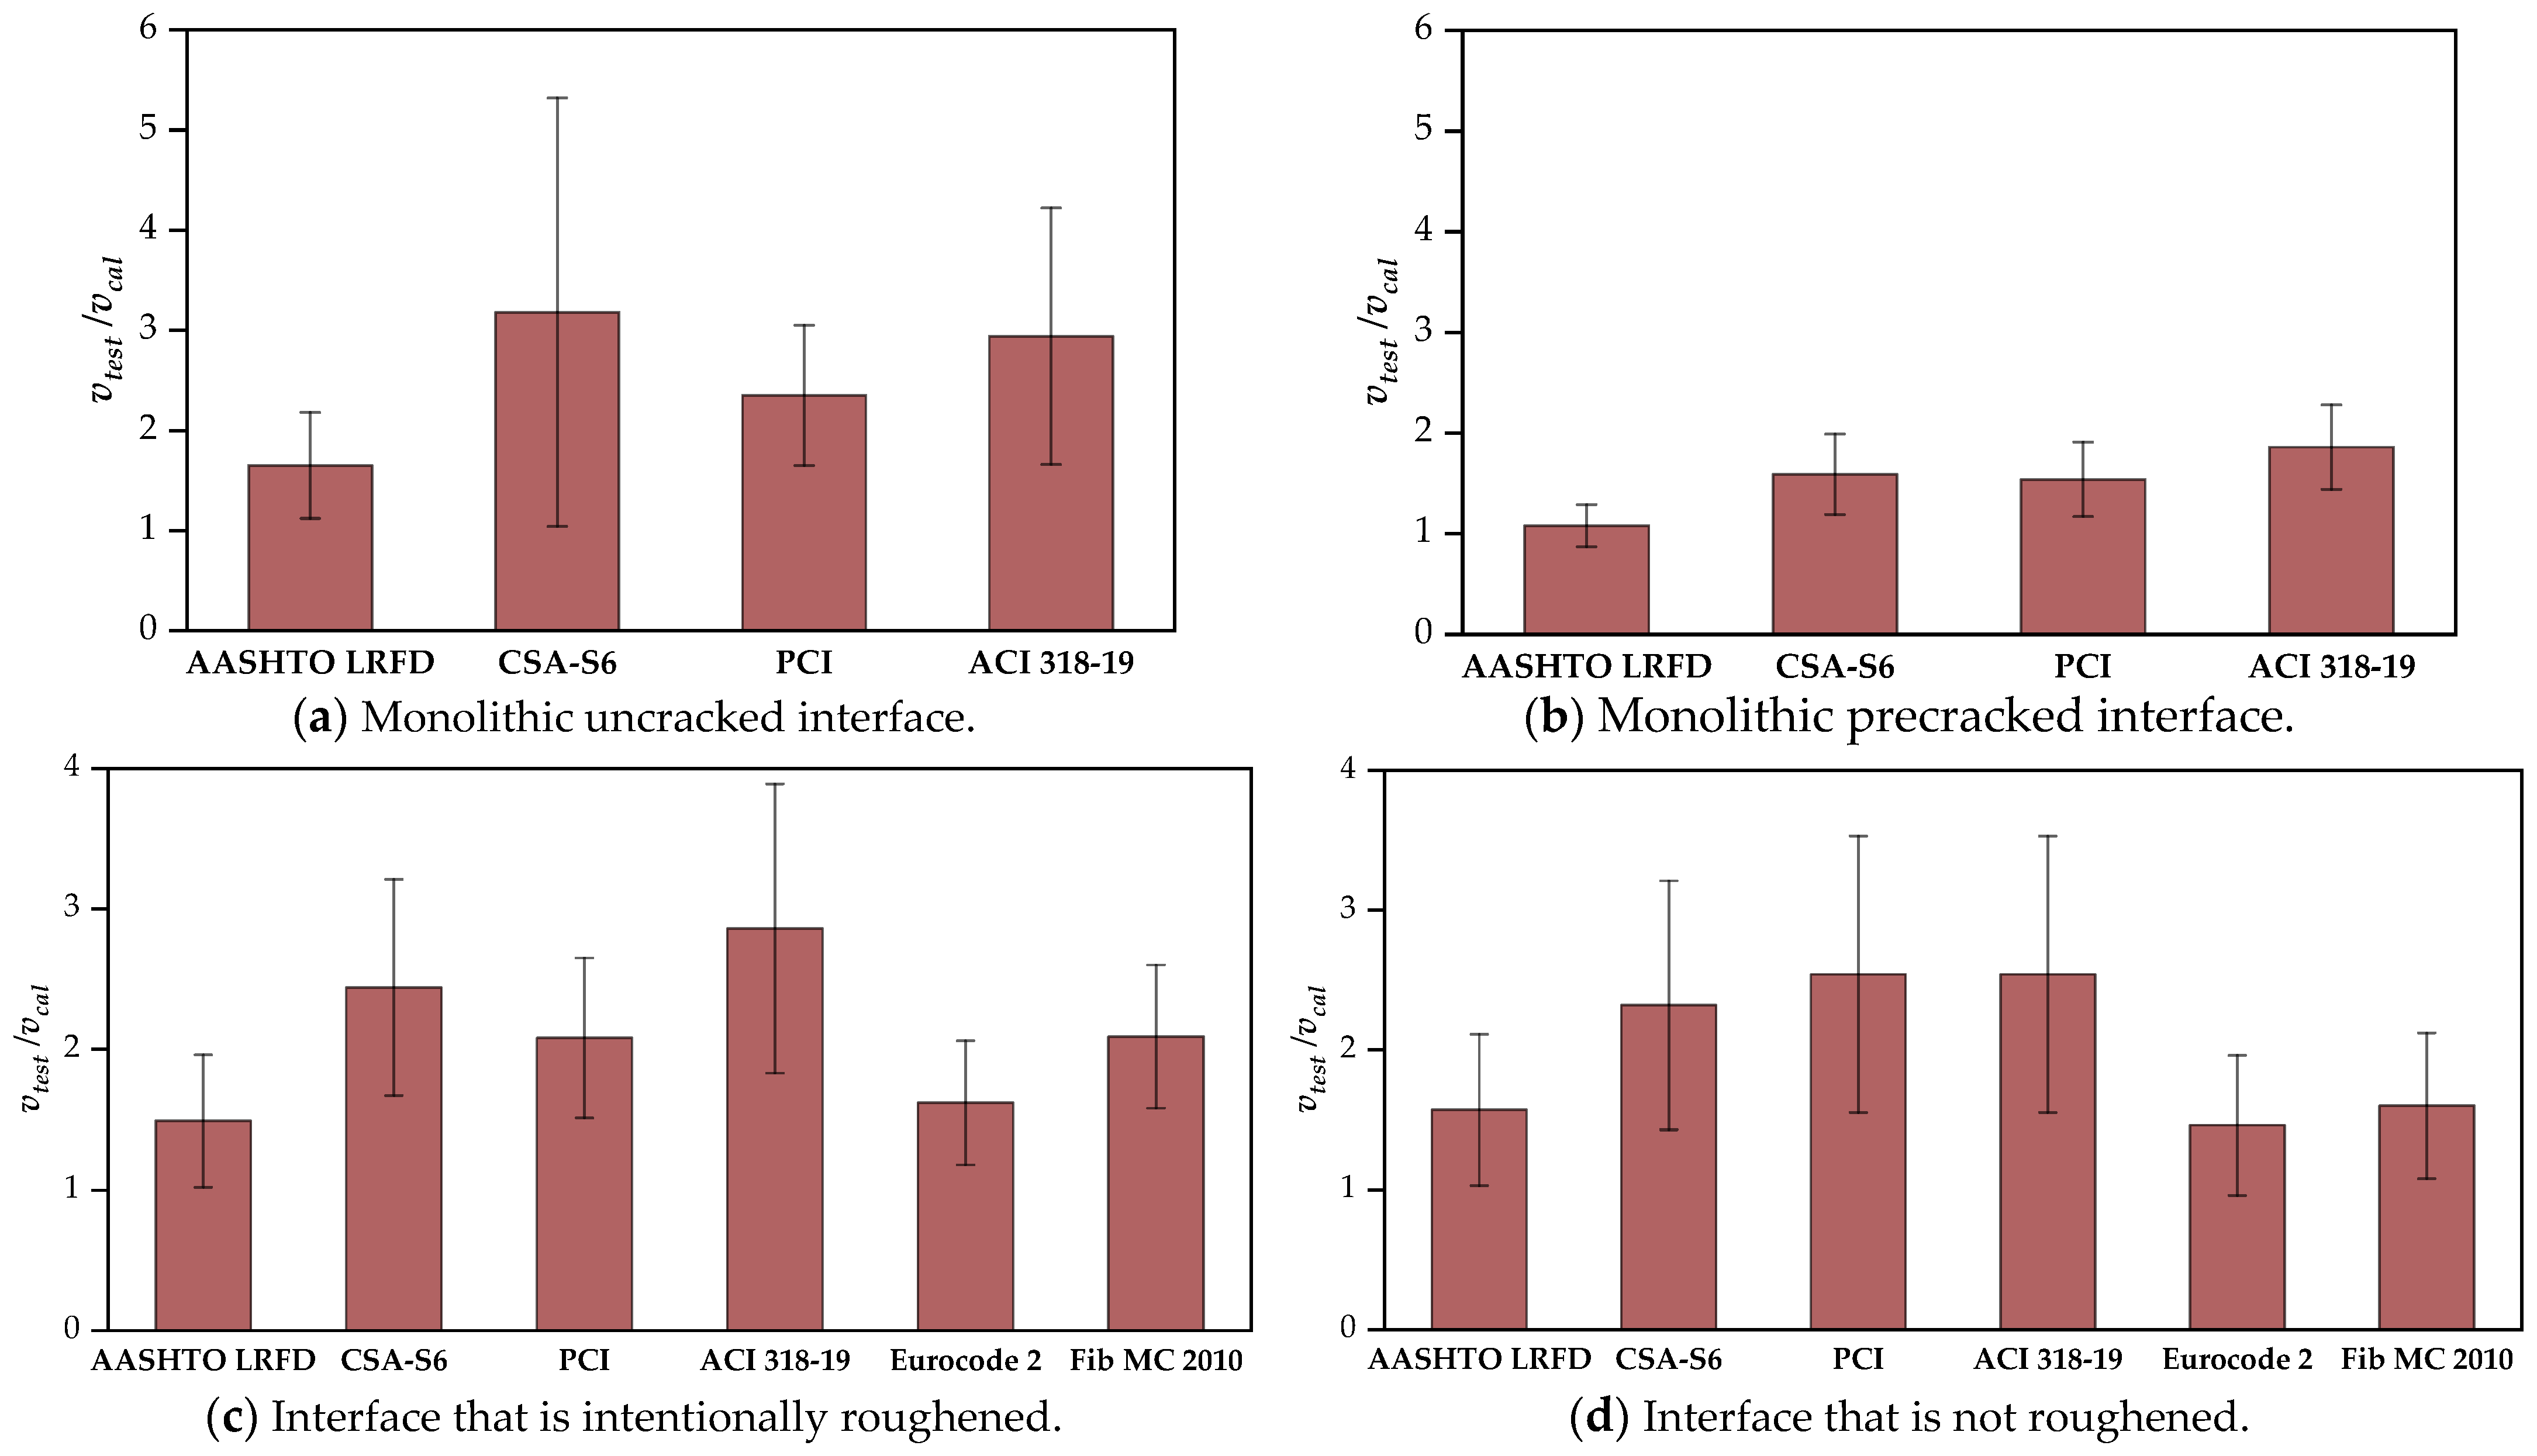
- For the monolithic uncracked or roughened interfaces, all mentioned codes provided conservative predictions of the interface shear resistance. The AASHTO LRFD tended to provide the most accurate predictions of the interface shear resistance for the monolithic uncracked interface. The most precise shear resistance was found for the roughened interface when calculated using the AASHTO LRFD or Eurocode 2. It should be noted that Eurocode 2 is not applicable to the monolithic uncracked interface.
- (2)
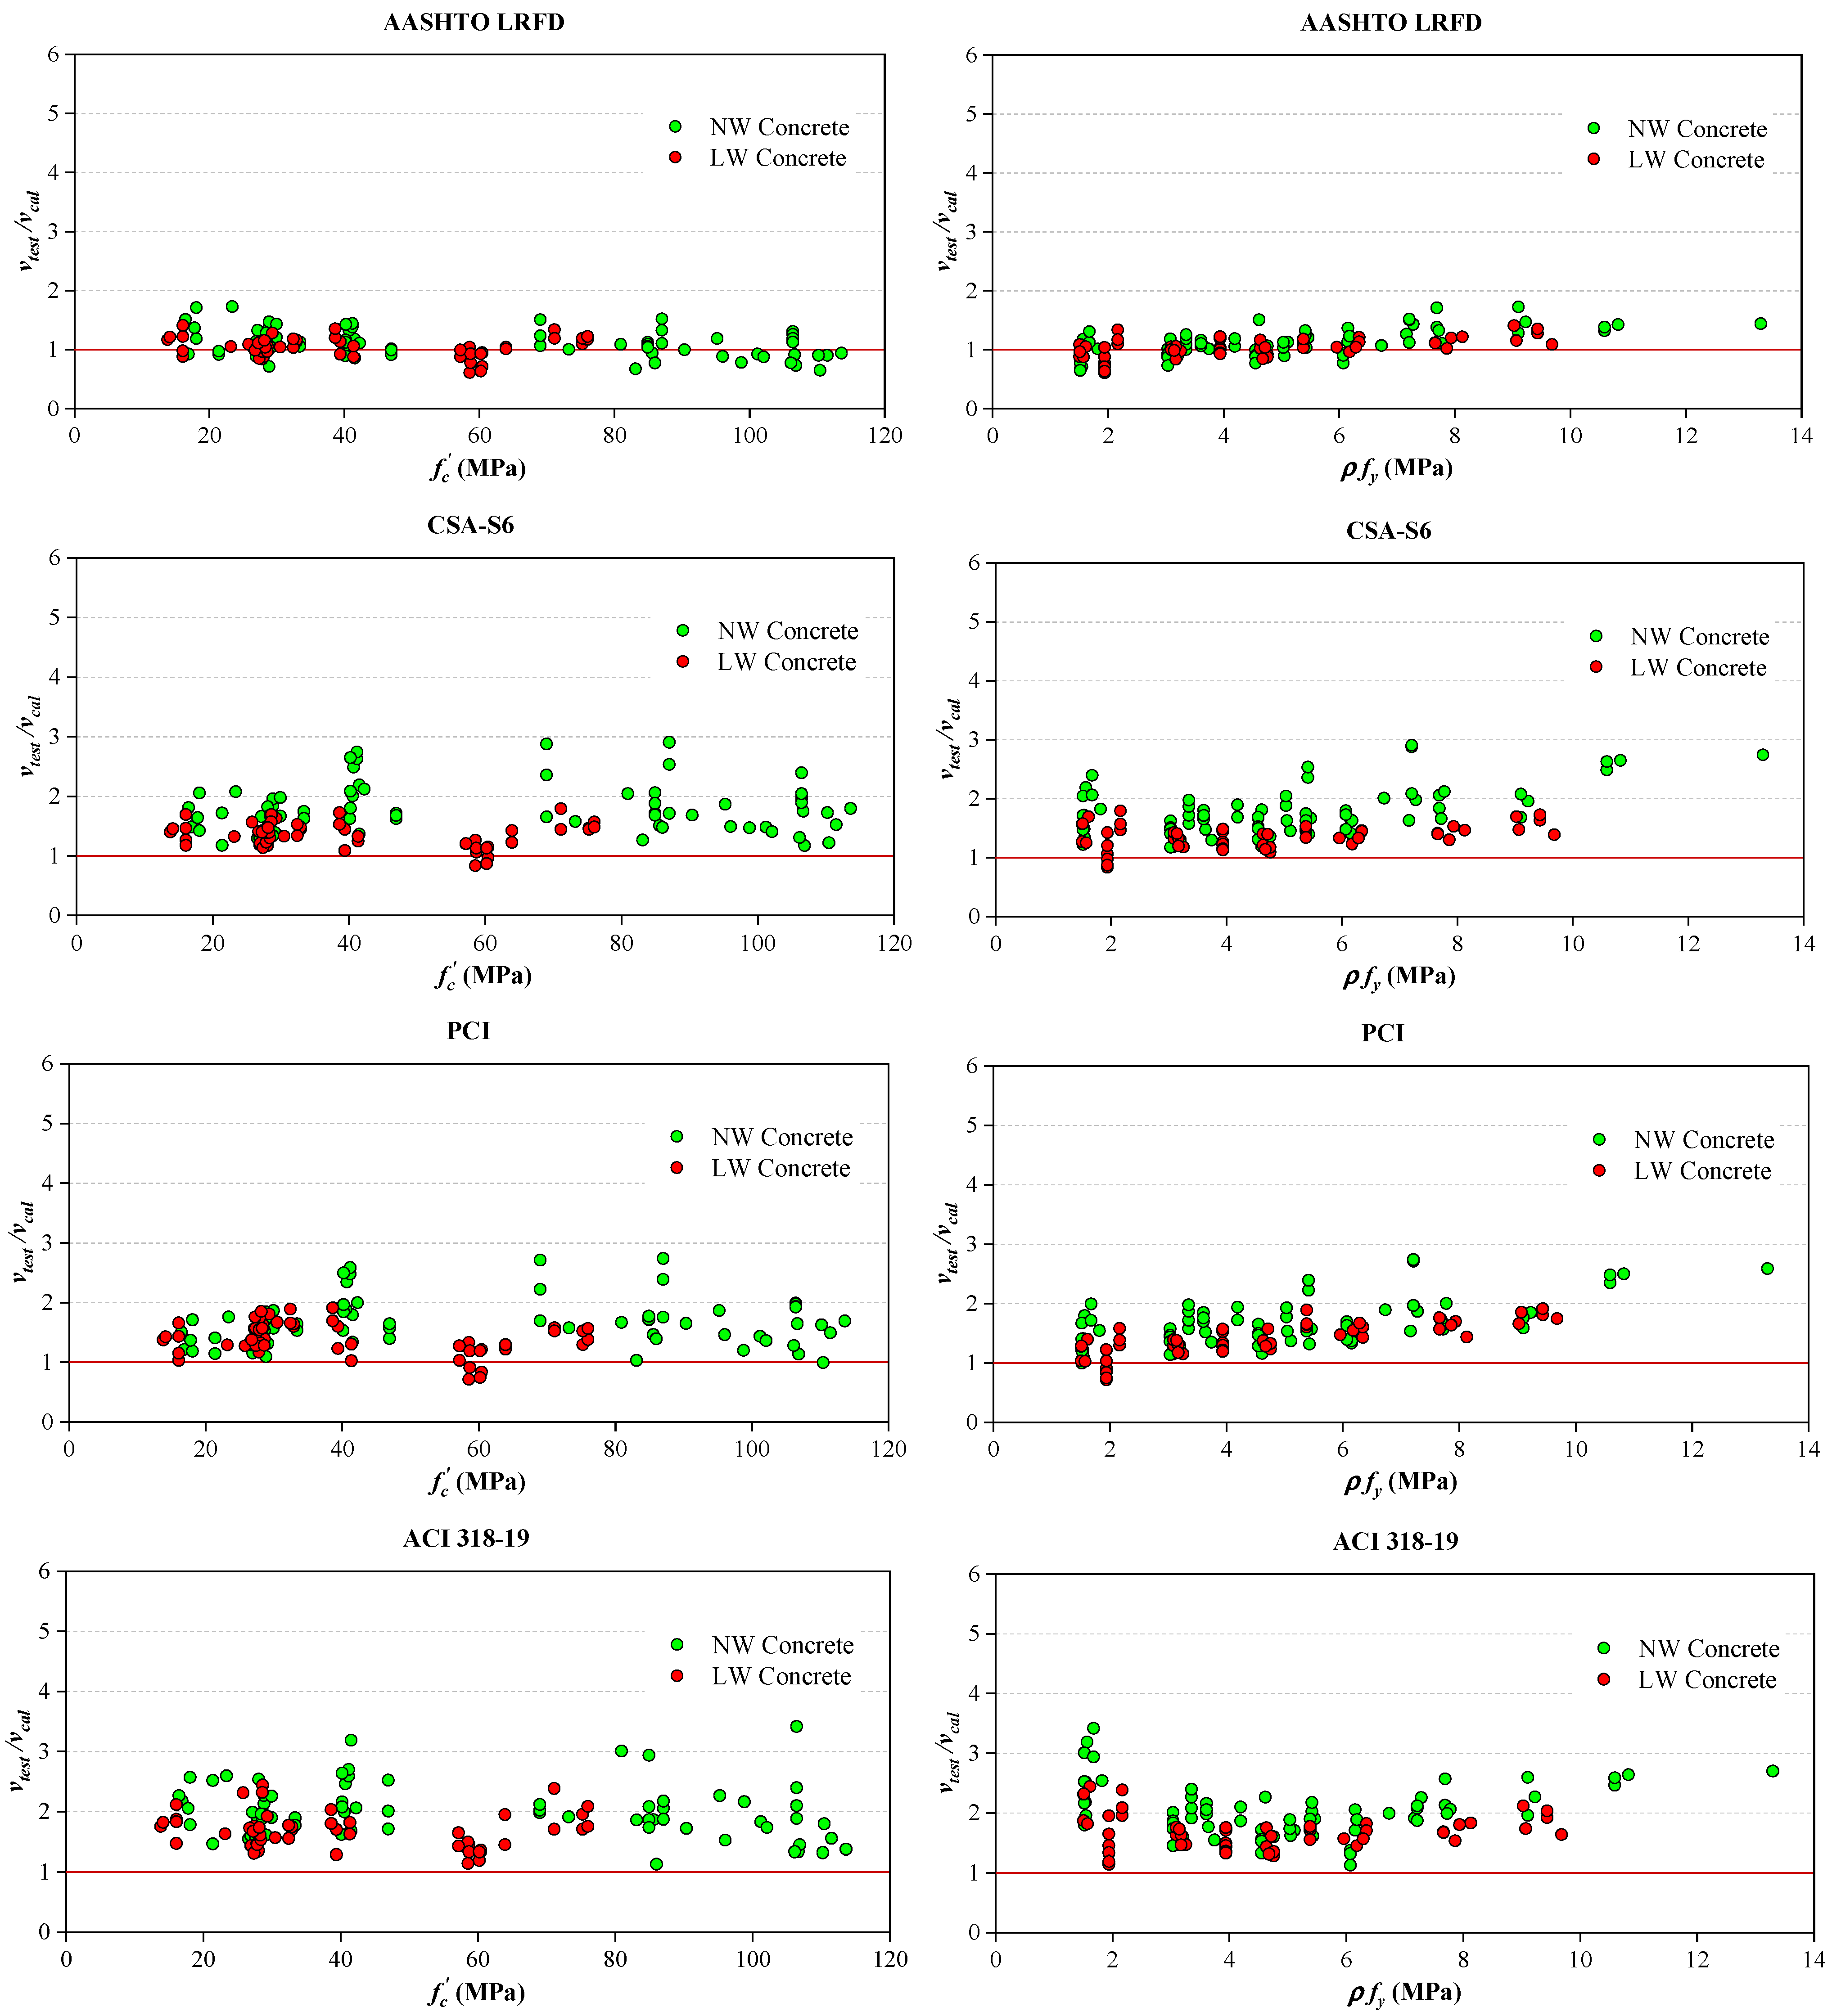
- For the monolithic precracked interface, only the ACI 318-19 gave conservative estimates, while the other codes gave more or less unconservative cases. It proves that the pure friction approach is more suitable when calculating shear resistance for this interface type.
- (3)
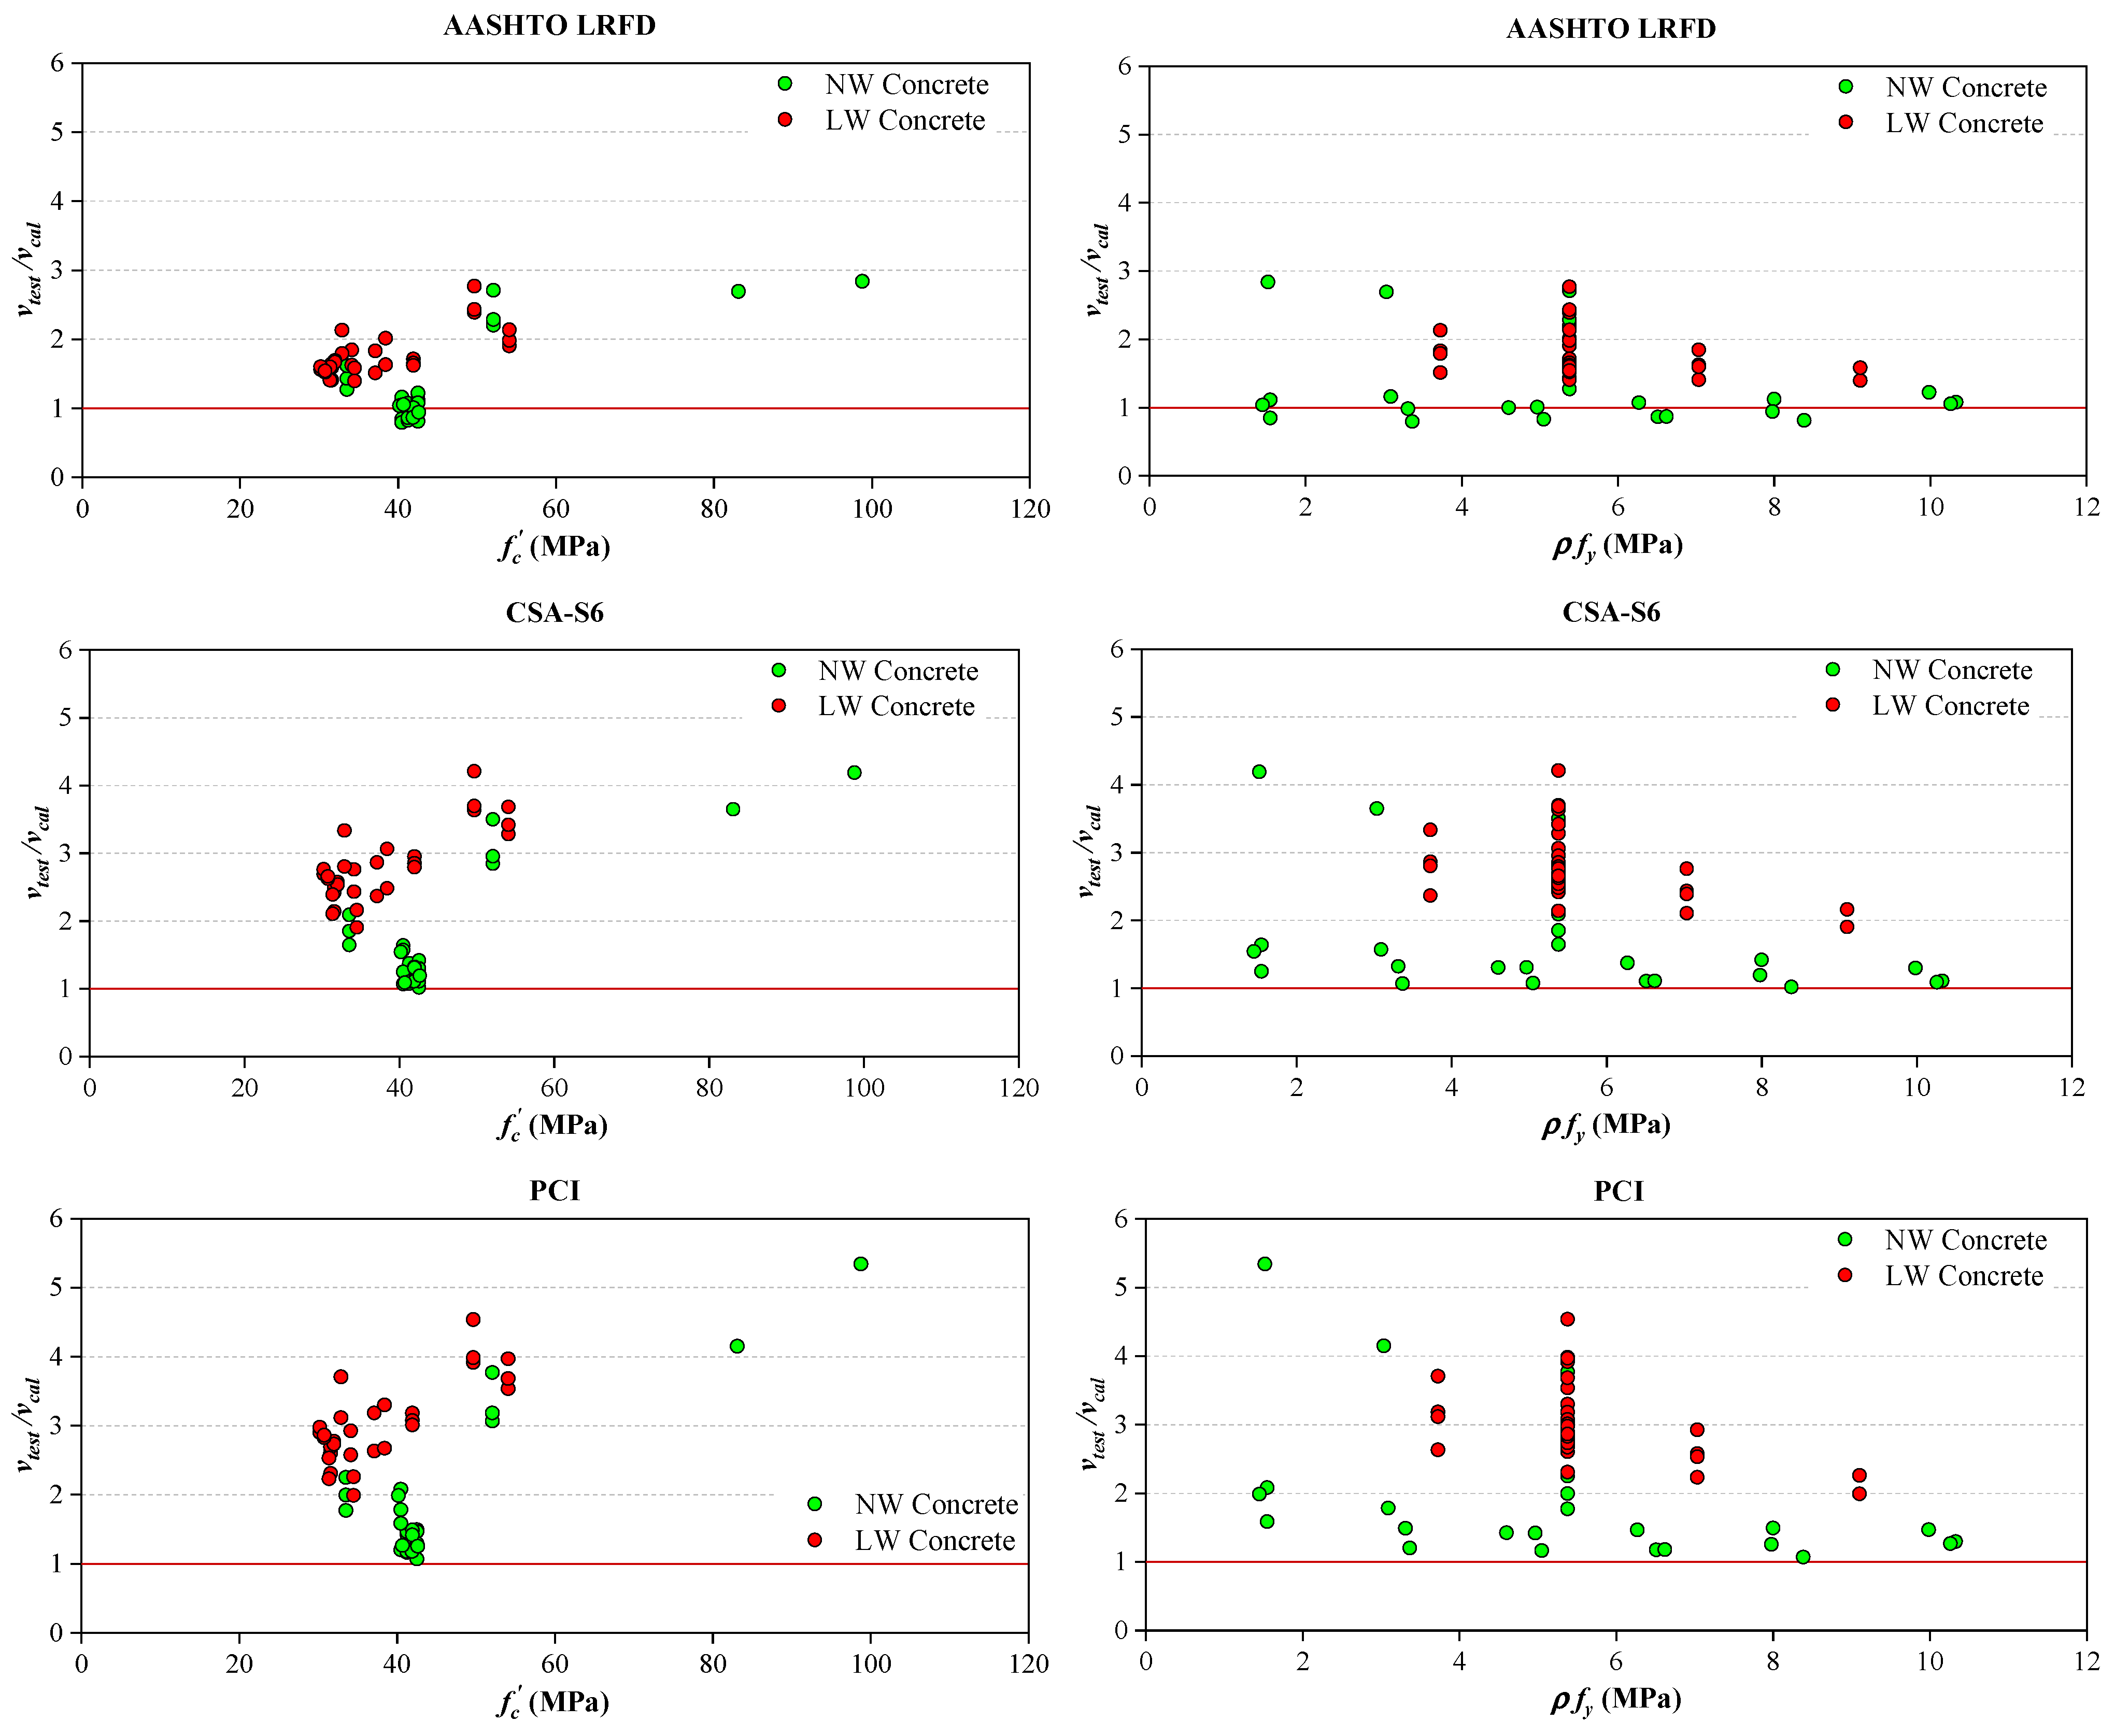
- For the smooth interface, the ACI 318-19, PCI, and CSA-S6 were conservative for all collected experimental data. But it should be noted that this interface condition has fewer data and high scatter in the tests.
- (4)
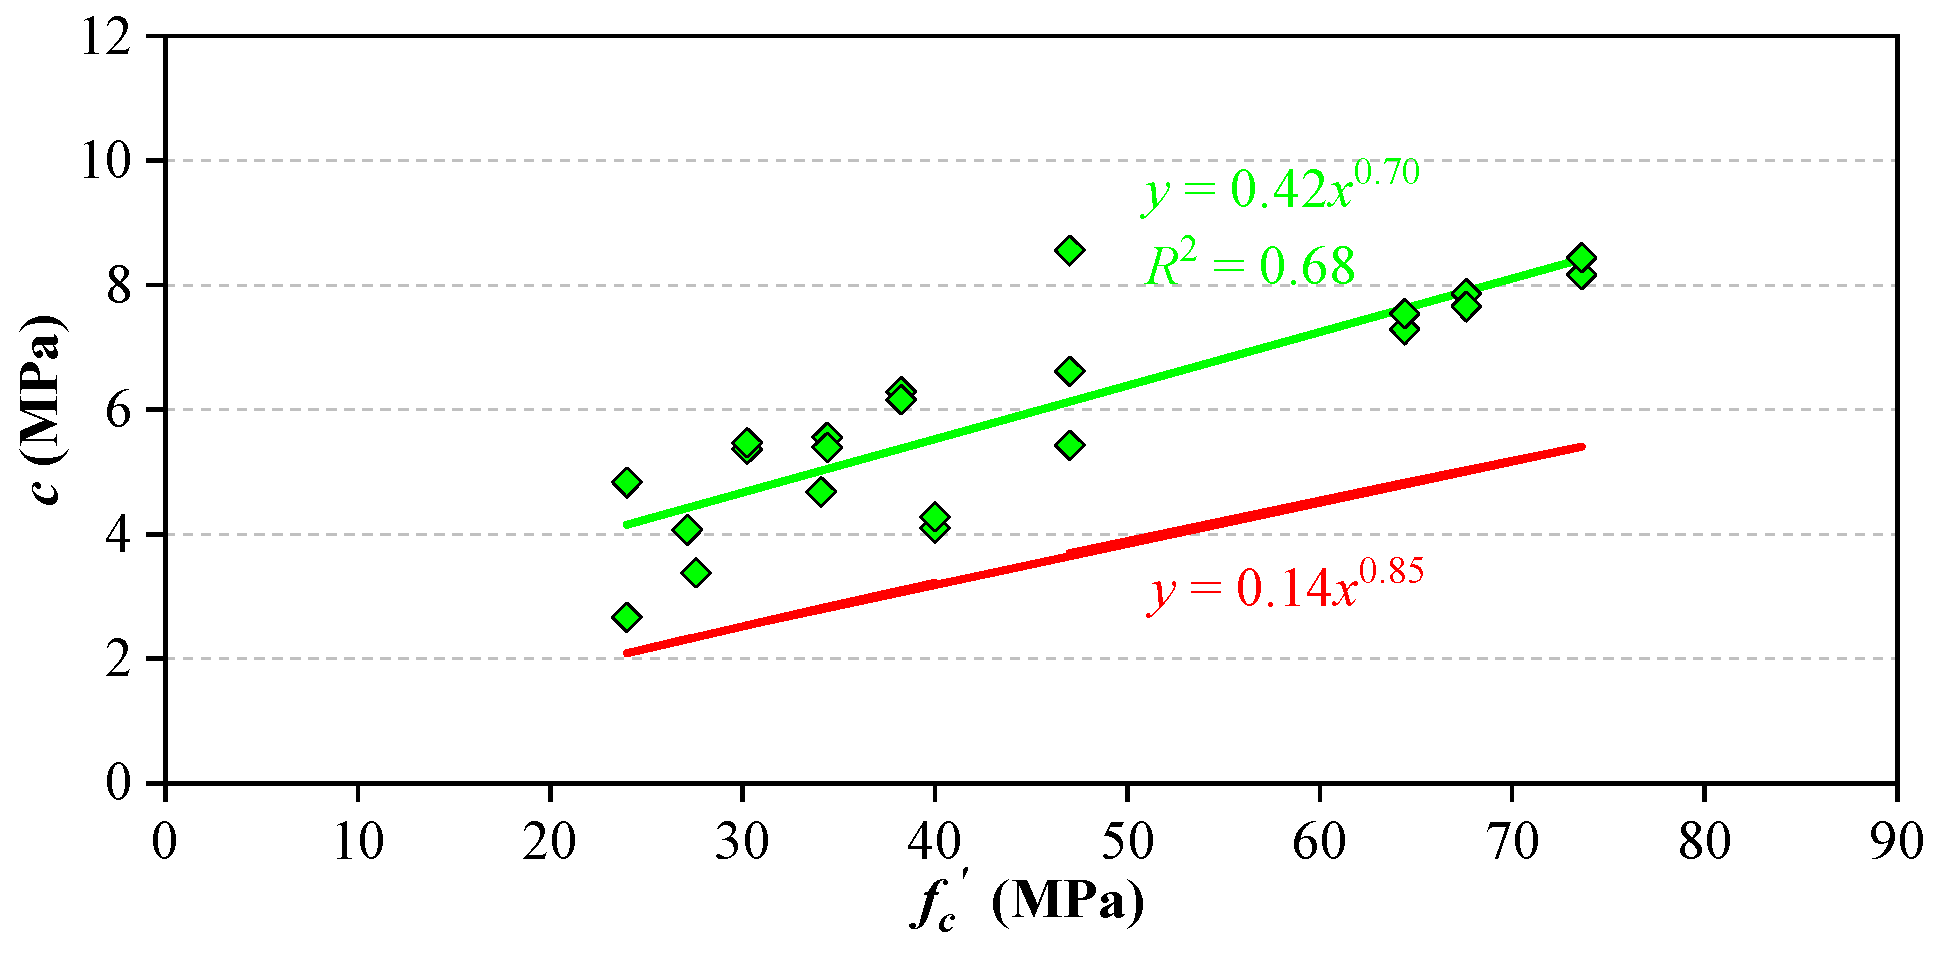
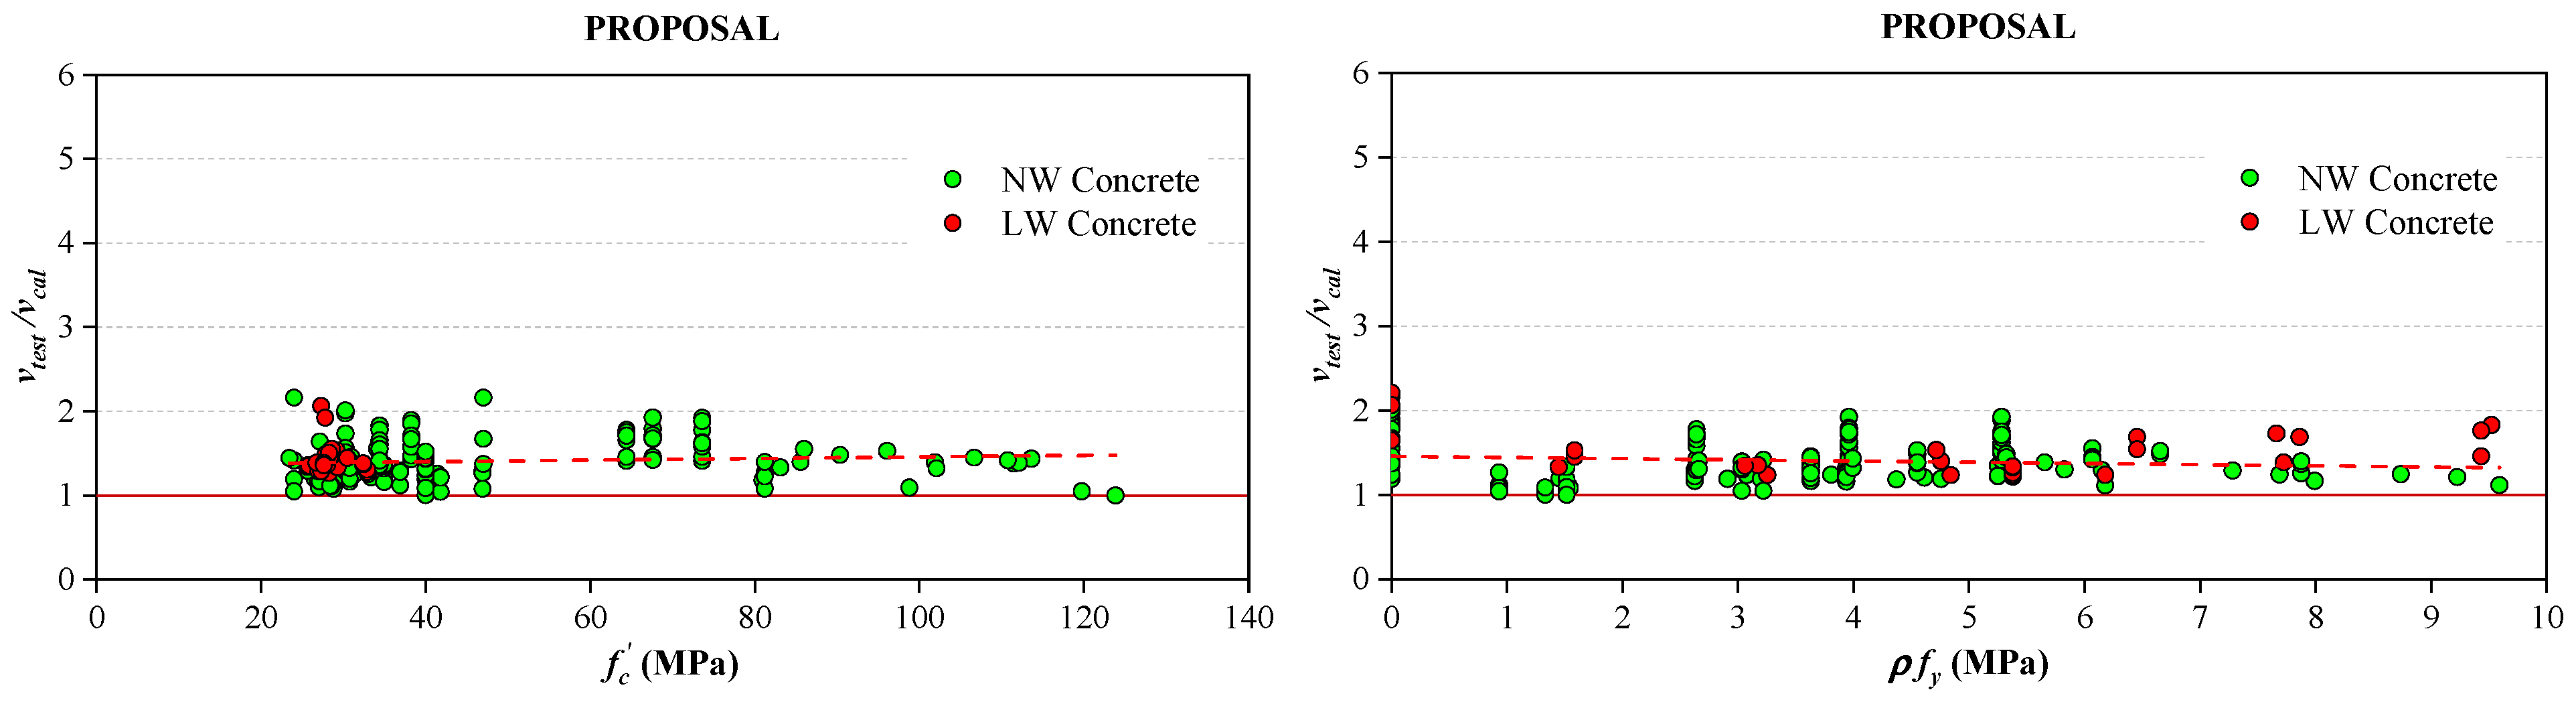
- The proposed equation for predicting the shear resistance for the monolithic uncracked interface is more accurate than the equations that are provided from the mentioned codes. Also, the proposed equation produced conservative and uniform predictions over the entire range of compressive strength of concrete and clamping stress. It is expected that this equation can be applied more accurately than the existing design provisions when high-strength concrete or grout is used for prefabricated structures.
Author Contributions
Funding
Institutional Review Board Statement
Informed Consent Statement
Data Availability Statement
Acknowledgments
Conflicts of Interest
Appendix A

| Researcher(s) | Specimen | fc’ (MPa) | Acv (mm2) | Avf (mm2) | ρ | fy (MPa) | ρfy (MPa) | vtest (MPa) | AASHTO LRFD | CSA-S6 | PCI | ACI 318-19 | Proposal | |||||
|---|---|---|---|---|---|---|---|---|---|---|---|---|---|---|---|---|---|---|
| vcal (MPa) | vtest/vcal | vcal (MPa) | vtest/vcal | vcal (MPa) | vtest/vcal | vcal (MPa) | vtest/vcal | vcal (MPa) | vtest/vcal | |||||||||
| Normalweight concrete | ||||||||||||||||||
| Hofbeck et al. (1969) | 1 | 27.58 | 32258.0 | 0.00 | 0.000 | 0.0 | 0.00 | 3.38 | 2.48 | 1.36 | 0.75 | 4.50 | 2.35 | 1.44 | ||||
| 1.1A | 27.03 | 32258.0 | 141.94 | 0.004 | 349.6 | 1.54 | 5.17 | 4.42 | 1.17 | 2.36 | 2.19 | 2.89 | 1.79 | 1.61 | 3.20 | 4.79 | 1.08 | |
| 1.1B | 29.92 | 32258.0 | 141.94 | 0.004 | 331.0 | 1.45 | 5.82 | 4.32 | 1.35 | 2.28 | 2.56 | 2.81 | 2.07 | 1.53 | 3.81 | 4.93 | 1.18 | |
| 1.2A | 26.48 | 32258.0 | 283.87 | 0.009 | 349.6 | 3.08 | 6.90 | 5.96 | 1.16 | 3.98 | 1.73 | 4.09 | 1.69 | 3.23 | 2.14 | 5.77 | 1.19 | |
| 1.2B | 28.82 | 32258.0 | 283.87 | 0.009 | 331.0 | 2.91 | 6.76 | 6.15 | 1.10 | 3.81 | 1.78 | 3.97 | 1.70 | 3.06 | 2.21 | 5.85 | 1.16 | |
| 1.3A | 26.48 | 32258.0 | 425.81 | 0.013 | 349.6 | 4.61 | 7.58 | 5.96 | 1.27 | 4.88 | 1.56 | 5.00 | 1.52 | 3.97 | 1.91 | 6.56 | 1.16 | |
| 1.3B | 27.03 | 32258.0 | 425.81 | 0.013 | 331.0 | 4.37 | 7.38 | 6.08 | 1.21 | 4.88 | 1.51 | 4.87 | 1.51 | 4.05 | 1.82 | 6.49 | 1.14 | |
| 1.4A | 31.10 | 32258.0 | 567.74 | 0.018 | 349.6 | 6.15 | 9.38 | 7.00 | 1.34 | 4.88 | 1.92 | 5.17 | 1.81 | 4.35 | 2.16 | 7.56 | 1.24 | |
| 1.4B | 26.58 | 32258.0 | 567.74 | 0.018 | 331.0 | 5.83 | 8.83 | 5.98 | 1.48 | 4.88 | 1.81 | 5.17 | 1.71 | 3.99 | 2.21 | 7.10 | 1.24 | |
| 1.5A | 31.10 | 32258.0 | 709.68 | 0.022 | 349.6 | 7.69 | 9.65 | 7.00 | 1.38 | 4.88 | 1.98 | 5.17 | 1.87 | 4.35 | 2.22 | 8.15 | 1.19 | |
| 1.5B | 28.03 | 32258.0 | 709.68 | 0.022 | 331.0 | 7.28 | 9.54 | 6.31 | 1.51 | 4.88 | 1.96 | 5.17 | 1.85 | 4.16 | 2.29 | 7.78 | 1.23 | |
| 1.6A | 29.72 | 32258.0 | 851.61 | 0.026 | 349.6 | 9.23 | 9.87 | 6.69 | 1.48 | 4.88 | 2.03 | 5.17 | 1.91 | 4.27 | 2.31 | 8.58 | 1.15 | |
| 1.6B | 27.92 | 32258.0 | 851.61 | 0.026 | 331.0 | 8.74 | 9.79 | 6.28 | 1.56 | 4.88 | 2.01 | 5.17 | 1.89 | 4.16 | 2.35 | 8.28 | 1.18 | |
| Mattock et al. (1975) | E1U | 27.99 | 54193.4 | 567.74 | 0.010 | 363.4 | 3.81 | 7.51 | 6.30 | 1.19 | 4.75 | 1.58 | 4.55 | 1.65 | 4.00 | 1.88 | 6.28 | 1.20 |
| F1U | 27.82 | 54193.4 | 851.61 | 0.016 | 359.9 | 5.65 | 9.44 | 6.26 | 1.51 | 4.88 | 1.94 | 5.17 | 1.83 | 4.15 | 2.27 | 7.12 | 1.33 | |
| Mattlock et al. (1976) | M0 | 27.13 | 32258.0 | 0.00 | 0.000 | 0.0 | 0.00 | 4.07 | 2.48 | 1.64 | 0.75 | 5.42 | 2.32 | 1.76 | ||||
| M1 | 28.82 | 32258.0 | 141.94 | 0.004 | 351.0 | 1.54 | 5.24 | 4.43 | 1.18 | 2.37 | 2.21 | 2.90 | 1.81 | 1.62 | 3.23 | 4.92 | 1.06 | |
| M2 | 26.89 | 32258.0 | 283.87 | 0.009 | 363.4 | 3.20 | 6.76 | 6.05 | 1.12 | 4.11 | 1.64 | 4.17 | 1.62 | 3.36 | 2.01 | 5.87 | 1.15 | |
| M3 | 27.55 | 32258.0 | 425.81 | 0.013 | 360.6 | 4.76 | 7.65 | 6.20 | 1.23 | 4.88 | 1.57 | 5.08 | 1.51 | 4.13 | 1.85 | 6.71 | 1.14 | |
| M4 | 28.61 | 32258.0 | 567.74 | 0.018 | 351.0 | 6.18 | 7.86 | 6.44 | 1.22 | 4.88 | 1.61 | 5.17 | 1.52 | 4.20 | 1.87 | 7.39 | 1.06 | |
| M5 | 27.13 | 32258.0 | 709.68 | 0.022 | 363.4 | 7.99 | 8.83 | 6.10 | 1.45 | 4.88 | 1.81 | 5.17 | 1.71 | 4.07 | 2.17 | 7.97 | 1.11 | |
| M6 | 28.41 | 32258.0 | 851.61 | 0.026 | 363.4 | 9.59 | 9.10 | 6.39 | 1.42 | 4.88 | 1.87 | 5.17 | 1.76 | 4.19 | 2.17 | 8.52 | 1.07 | |
| Kahn and Mitchell (2002) | SF-4-1-U | 46.92 | 38709.6 | 141.94 | 0.004 | 479.2 | 1.52 | 6.65 | 4.39 | 1.51 | 2.34 | 2.84 | 2.87 | 2.32 | 1.59 | 4.18 | 6.15 | 1.08 |
| SF4-2-U | 46.92 | 38709.6 | 283.87 | 0.007 | 479.2 | 3.03 | 9.20 | 6.30 | 1.46 | 3.94 | 2.34 | 4.06 | 2.27 | 3.19 | 2.89 | 7.17 | 1.28 | |
| SF-4-3-U | 46.92 | 38709.6 | 425.81 | 0.011 | 479.2 | 4.55 | 9.87 | 8.22 | 1.20 | 4.88 | 2.02 | 4.97 | 1.98 | 4.78 | 2.06 | 7.95 | 1.24 | |
| SF-7-1-U | 80.91 | 38709.6 | 141.94 | 0.004 | 572.3 | 1.52 | 10.06 | 4.39 | 2.29 | 2.34 | 4.29 | 2.87 | 3.51 | 1.59 | 6.32 | 8.32 | 1.21 | |
| SF-7-2-U | 85.57 | 38709.6 | 283.87 | 0.007 | 572.3 | 3.03 | 13.58 | 6.30 | 2.15 | 3.94 | 3.45 | 4.06 | 3.34 | 3.19 | 4.26 | 9.63 | 1.41 | |
| SF-7-3-U | 90.35 | 38709.6 | 425.81 | 0.011 | 572.3 | 4.55 | 15.91 | 8.22 | 1.94 | 4.88 | 3.26 | 4.97 | 3.20 | 4.78 | 3.33 | 10.70 | 1.49 | |
| SF-7-4-U | 85.99 | 38709.6 | 567.74 | 0.015 | 572.3 | 6.07 | 17.13 | 9.31 | 1.84 | 4.88 | 3.51 | 5.17 | 3.31 | 6.37 | 2.69 | 11.10 | 1.54 | |
| SF-10-1-U-a | 83.11 | 38709.6 | 141.94 | 0.004 | 572.3 | 1.52 | 11.50 | 4.39 | 2.62 | 2.34 | 4.91 | 2.87 | 4.01 | 1.59 | 7.22 | 8.46 | 1.36 | |
| SF-10-1-U-b | 98.78 | 38709.6 | 141.94 | 0.004 | 572.3 | 1.52 | 10.56 | 4.39 | 2.40 | 2.34 | 4.51 | 2.87 | 3.68 | 1.59 | 6.63 | 9.41 | 1.12 | |
| SF-10-2-U-a | 101.88 | 38709.6 | 283.87 | 0.007 | 572.3 | 3.03 | 15.02 | 6.30 | 2.38 | 3.94 | 3.82 | 4.06 | 3.70 | 3.19 | 4.71 | 10.61 | 1.42 | |
| SF-10-2-U-b | 102.07 | 38709.6 | 283.87 | 0.007 | 572.3 | 3.03 | 14.26 | 6.30 | 2.26 | 3.94 | 3.62 | 4.06 | 3.51 | 3.19 | 4.48 | 10.62 | 1.34 | |
| SF-10-3-U-a | 111.49 | 38709.6 | 425.81 | 0.011 | 572.3 | 4.55 | 16.64 | 8.22 | 2.03 | 4.88 | 3.41 | 4.97 | 3.35 | 4.78 | 3.48 | 11.96 | 1.39 | |
| SF-10-3-U-b | 96.07 | 38709.6 | 425.81 | 0.011 | 572.3 | 4.55 | 17.00 | 8.22 | 2.07 | 4.88 | 3.49 | 4.97 | 3.42 | 4.78 | 3.56 | 11.05 | 1.54 | |
| SF-10-4-U-a | 106.65 | 38709.6 | 567.74 | 0.015 | 572.3 | 6.07 | 17.93 | 9.31 | 1.93 | 4.88 | 3.68 | 5.17 | 3.47 | 6.37 | 2.81 | 12.34 | 1.45 | |
| SF-10-4-U-b | 113.60 | 38709.6 | 567.74 | 0.015 | 572.3 | 6.07 | 18.39 | 9.31 | 1.98 | 4.88 | 3.77 | 5.17 | 3.56 | 6.37 | 2.89 | 12.75 | 1.44 | |
| SF-14-1-U | 123.81 | 38709.6 | 141.94 | 0.004 | 572.3 | 1.52 | 11.24 | 4.39 | 2.56 | 2.34 | 4.80 | 2.87 | 3.92 | 1.59 | 7.06 | 10.88 | 1.03 | |
| SF-14-2-U | 119.71 | 38709.6 | 283.87 | 0.007 | 572.3 | 3.03 | 12.47 | 6.30 | 1.98 | 3.94 | 3.17 | 4.06 | 3.07 | 3.19 | 3.91 | 11.66 | 1.07 | |
| SF-14-3-U | 112.08 | 38709.6 | 425.81 | 0.011 | 572.3 | 4.55 | 16.80 | 8.22 | 2.05 | 4.88 | 3.45 | 4.97 | 3.38 | 4.78 | 3.52 | 12.00 | 1.40 | |
| SF-14-4-U | 110.73 | 38709.6 | 567.74 | 0.015 | 572.3 | 6.07 | 17.93 | 9.31 | 1.93 | 4.88 | 3.68 | 5.17 | 3.47 | 6.37 | 2.81 | 12.58 | 1.43 | |
| Aziz (2010) | S1 | 24.00 | 60000.0 | 0.00 | 0.000 | 0.0 | 0.00 | 4.83 | 2.48 | 1.95 | 0.75 | 6.44 | 2.09 | 2.32 | ||||
| S2 | 24.00 | 60000.0 | 0.00 | 0.000 | 0.0 | 0.00 | 2.67 | 2.48 | 1.07 | 0.75 | 3.56 | 2.09 | 1.28 | |||||
| S3 | 24.00 | 60000.0 | 471.24 | 0.008 | 410.0 | 3.22 | 7.73 | 5.40 | 1.43 | 4.13 | 1.87 | 4.18 | 1.85 | 3.38 | 2.29 | 5.67 | 1.36 | |
| S4 | 24.00 | 60000.0 | 471.24 | 0.008 | 410.0 | 3.22 | 5.73 | 5.40 | 1.06 | 4.13 | 1.39 | 4.18 | 1.37 | 3.38 | 1.70 | 5.67 | 1.01 | |
| Rahal and Al-Khaleefi (2015) | 35-2T6-0 | 36.89 | 31250.0 | 113.10 | 0.004 | 258.0 | 0.93 | 5.55 | 3.66 | 1.52 | 1.73 | 3.21 | 2.25 | 2.46 | 0.98 | 5.66 | 4.94 | 1.12 |
| 35-2T8-0 | 36.89 | 31250.0 | 201.06 | 0.006 | 408.0 | 2.63 | 7.94 | 5.79 | 1.37 | 3.51 | 2.26 | 3.78 | 2.10 | 2.76 | 2.88 | 6.25 | 1.27 | |
| 35-3T8-0 | 36.89 | 31250.0 | 301.59 | 0.010 | 408.0 | 3.94 | 8.68 | 7.44 | 1.17 | 4.88 | 1.78 | 4.62 | 1.88 | 4.13 | 2.10 | 6.97 | 1.24 | |
| 35-0T-100 | 34.09 | 31250.0 | 0.00 | 0.000 | 0.0 | 0.00 | 4.68 | 2.48 | 1.89 | 0.75 | 6.24 | 2.81 | 1.67 | |||||
| 35-2T6-100 | 41.40 | 31250.0 | 113.10 | 0.004 | 258.0 | 0.93 | 5.63 | 3.66 | 1.54 | 1.73 | 3.25 | 2.25 | 2.50 | 0.98 | 5.74 | 5.25 | 1.07 | |
| 35-2T8-100 | 41.40 | 31250.0 | 201.06 | 0.006 | 408.0 | 2.63 | 7.54 | 5.79 | 1.30 | 3.51 | 2.15 | 3.78 | 2.00 | 2.76 | 2.74 | 6.56 | 1.15 | |
| 35-3T8-100 | 41.40 | 31250.0 | 301.59 | 0.010 | 408.0 | 3.94 | 8.71 | 7.44 | 1.17 | 4.88 | 1.79 | 4.62 | 1.88 | 4.13 | 2.11 | 7.28 | 1.20 | |
| 35-4T8-100 | 41.40 | 31250.0 | 402.12 | 0.013 | 408.0 | 5.25 | 9.36 | 9.10 | 1.03 | 4.88 | 1.92 | 5.17 | 1.81 | 4.97 | 1.88 | 7.90 | 1.19 | |
| 35-6T8-100 | 41.40 | 31250.0 | 603.19 | 0.019 | 408.0 | 7.88 | 10.80 | 9.31 | 1.16 | 4.88 | 2.22 | 5.17 | 2.09 | 4.97 | 2.17 | 8.93 | 1.21 | |
| Sneed et al. (2016) | N-MO-U-1 | 33.37 | 31935.4 | 425.81 | 0.013 | 497.8 | 5.38 | 8.83 | 7.51 | 1.18 | 4.88 | 1.81 | 5.17 | 1.71 | 4.48 | 1.97 | 7.40 | 1.19 |
| N-MO-U-2 | 33.37 | 31935.4 | 425.81 | 0.013 | 497.8 | 5.38 | 8.67 | 7.51 | 1.15 | 4.88 | 1.78 | 5.17 | 1.68 | 4.48 | 1.93 | 7.40 | 1.17 | |
| Rahal et al. (2016) | 35-2T6-SCC | 34.96 | 31250.0 | 113.10 | 0.004 | 258.0 | 0.93 | 6.10 | 3.66 | 1.67 | 1.73 | 3.53 | 2.25 | 2.71 | 0.98 | 6.22 | 4.80 | 1.27 |
| 35-2T8-SCC | 34.96 | 31250.0 | 201.06 | 0.006 | 408.0 | 2.63 | 7.33 | 5.79 | 1.27 | 3.51 | 2.09 | 3.78 | 1.94 | 2.76 | 2.66 | 6.11 | 1.20 | |
| 35-3T8-SCC | 34.96 | 31250.0 | 301.59 | 0.010 | 408.0 | 3.94 | 7.70 | 7.44 | 1.03 | 4.88 | 1.58 | 4.62 | 1.67 | 4.13 | 1.86 | 6.84 | 1.13 | |
| 35-3T8-SCCrb | 34.96 | 31250.0 | 301.59 | 0.010 | 408.0 | 3.94 | 8.79 | 7.44 | 1.18 | 4.88 | 1.80 | 4.62 | 1.90 | 4.13 | 2.13 | 6.84 | 1.28 | |
| 35-4T8-SCC | 34.96 | 31250.0 | 402.12 | 0.013 | 408.0 | 5.25 | 9.70 | 7.87 | 1.23 | 4.88 | 1.99 | 5.17 | 1.88 | 4.58 | 2.12 | 7.45 | 1.30 | |
| 35-6T8-SCC | 34.96 | 31250.0 | 603.19 | 0.019 | 408.0 | 7.88 | 11.10 | 7.87 | 1.41 | 4.88 | 2.28 | 5.17 | 2.15 | 4.58 | 2.42 | 8.48 | 1.31 | |
| 70-2T6-SCC | 81.20 | 31250.0 | 113.10 | 0.004 | 258.0 | 0.93 | 8.69 | 3.66 | 2.38 | 1.73 | 5.02 | 2.25 | 3.86 | 0.98 | 8.86 | 7.81 | 1.11 | |
| 70-2T8-SCC | 81.20 | 31250.0 | 201.06 | 0.006 | 408.0 | 2.63 | 11.50 | 5.79 | 1.99 | 3.51 | 3.28 | 3.78 | 3.05 | 2.76 | 4.17 | 9.12 | 1.26 | |
| 70-3T8-SCC | 81.20 | 31250.0 | 301.59 | 0.010 | 408.0 | 3.94 | 12.57 | 7.44 | 1.69 | 4.88 | 2.58 | 4.62 | 2.72 | 4.13 | 3.04 | 9.85 | 1.28 | |
| 70-3T8-SCCrb | 81.20 | 31250.0 | 301.59 | 0.010 | 408.0 | 3.94 | 12.30 | 7.44 | 1.65 | 4.88 | 2.52 | 4.62 | 2.66 | 4.13 | 2.97 | 9.85 | 1.25 | |
| 70-4T8-SCC | 81.20 | 31250.0 | 402.12 | 0.013 | 408.0 | 5.25 | 12.77 | 9.10 | 1.40 | 4.88 | 2.62 | 5.17 | 2.47 | 5.51 | 2.32 | 10.46 | 1.22 | |
| 70-6T8-SCC | 81.20 | 31250.0 | 603.19 | 0.019 | 408.0 | 7.88 | 15.85 | 9.31 | 1.70 | 4.88 | 3.25 | 5.17 | 3.07 | 7.35 | 2.16 | 11.49 | 1.38 | |
| 35-2T6-0 | 41.80 | 31250.0 | 113.10 | 0.004 | 258.0 | 0.93 | 5.55 | 3.66 | 1.52 | 1.73 | 3.21 | 2.25 | 2.46 | 0.98 | 5.66 | 5.28 | 1.05 | |
| 35-2T8-0 | 41.80 | 31250.0 | 201.06 | 0.006 | 408.0 | 2.63 | 7.94 | 5.79 | 1.37 | 3.51 | 2.26 | 3.78 | 2.10 | 2.76 | 2.88 | 6.58 | 1.21 | |
| 35-3T8-0 | 41.80 | 31250.0 | 301.59 | 0.010 | 408.0 | 3.94 | 8.68 | 7.44 | 1.17 | 4.88 | 1.78 | 4.62 | 1.88 | 4.13 | 2.10 | 7.31 | 1.19 | |
| Waseem and Singh (2016) | N-00-0-A | 38.24 | 31500.0 | 0.00 | 0.000 | 0.0 | 0.00 | 6.29 | 2.48 | 2.53 | 0.75 | 8.39 | 3.10 | 2.03 | ||||
| N-00-0-B | 38.24 | 31500.0 | 0.00 | 0.000 | 0.0 | 0.00 | 6.16 | 2.48 | 2.48 | 0.75 | 8.21 | 3.10 | 1.99 | |||||
| N-00-2-A | 38.24 | 31500.0 | 201.06 | 0.006 | 525.0 | 2.64 | 8.92 | 5.81 | 1.54 | 3.52 | 2.53 | 3.79 | 2.36 | 2.77 | 3.22 | 6.35 | 1.40 | |
| N-00-2-B | 38.24 | 31500.0 | 201.06 | 0.006 | 525.0 | 2.64 | 10.66 | 5.81 | 1.84 | 3.52 | 3.03 | 3.79 | 2.82 | 2.77 | 3.84 | 6.35 | 1.68 | |
| N-00-3-A | 38.24 | 31500.0 | 301.59 | 0.010 | 525.0 | 3.96 | 11.81 | 7.47 | 1.58 | 4.88 | 2.42 | 4.64 | 2.55 | 4.16 | 2.84 | 7.08 | 1.67 | |
| N-00-3-B | 38.24 | 31500.0 | 301.59 | 0.010 | 525.0 | 3.96 | 10.17 | 7.47 | 1.36 | 4.88 | 2.09 | 4.64 | 2.19 | 4.16 | 2.45 | 7.08 | 1.44 | |
| N-00-4-A | 38.24 | 31500.0 | 402.12 | 0.013 | 525.0 | 5.28 | 11.77 | 8.60 | 1.37 | 4.88 | 2.41 | 5.17 | 2.28 | 4.78 | 2.46 | 7.70 | 1.53 | |
| N-00-4-B | 38.24 | 31500.0 | 402.12 | 0.013 | 525.0 | 5.28 | 12.44 | 8.60 | 1.45 | 4.88 | 2.55 | 5.17 | 2.41 | 4.78 | 2.60 | 7.70 | 1.62 | |
| N-50-0-A | 34.40 | 31500.0 | 0.00 | 0.000 | 525.0 | 0.00 | 5.56 | 2.48 | 2.24 | 0.75 | 7.41 | 2.83 | 1.96 | |||||
| N-50-0-B | 34.40 | 31500.0 | 0.00 | 0.000 | 525.0 | 0.00 | 5.40 | 2.48 | 2.18 | 0.75 | 7.20 | 2.83 | 1.91 | |||||
| N-50-2-A | 34.40 | 31500.0 | 201.06 | 0.006 | 525.0 | 2.64 | 9.88 | 5.81 | 1.70 | 3.52 | 2.80 | 3.79 | 2.61 | 2.77 | 3.56 | 6.08 | 1.62 | |
| N-50-2-B | 34.40 | 31500.0 | 201.06 | 0.006 | 525.0 | 2.64 | 8.11 | 5.81 | 1.40 | 3.52 | 2.30 | 3.79 | 2.14 | 2.77 | 2.93 | 6.08 | 1.33 | |
| N-50-3-A | 34.40 | 31500.0 | 301.59 | 0.010 | 525.0 | 3.96 | 9.46 | 7.47 | 1.27 | 4.88 | 1.94 | 4.64 | 2.04 | 4.16 | 2.27 | 6.81 | 1.39 | |
| N-50-3-B | 34.40 | 31500.0 | 301.59 | 0.010 | 525.0 | 3.96 | 10.61 | 7.47 | 1.42 | 4.88 | 2.18 | 4.64 | 2.29 | 4.16 | 2.55 | 6.81 | 1.56 | |
| N-50-4-A | 34.40 | 31500.0 | 402.12 | 0.013 | 525.0 | 5.28 | 11.14 | 7.74 | 1.44 | 4.88 | 2.29 | 5.17 | 2.15 | 4.55 | 2.45 | 7.43 | 1.50 | |
| N-50-4-B | 34.40 | 31500.0 | 402.12 | 0.013 | 525.0 | 5.28 | 10.14 | 7.74 | 1.31 | 4.88 | 2.08 | 5.17 | 1.96 | 4.55 | 2.23 | 7.43 | 1.36 | |
| N-100-0-A | 30.24 | 31500.0 | 0.00 | 0.000 | 525.0 | 0.00 | 5.37 | 2.48 | 2.16 | 0.75 | 7.16 | 2.54 | 2.12 | |||||
| N-100-0-B | 30.24 | 31500.0 | 0.00 | 0.000 | 525.0 | 0.00 | 5.47 | 2.48 | 2.20 | 0.75 | 7.29 | 2.54 | 2.15 | |||||
| N-100-2-A | 30.24 | 31500.0 | 201.06 | 0.006 | 525.0 | 2.64 | 9.80 | 5.81 | 1.69 | 3.52 | 2.78 | 3.79 | 2.59 | 2.77 | 3.53 | 5.79 | 1.69 | |
| N-100-2-B | 30.24 | 31500.0 | 201.06 | 0.006 | 525.0 | 2.64 | 7.28 | 5.81 | 1.25 | 3.52 | 2.07 | 3.79 | 1.92 | 2.77 | 2.63 | 5.79 | 1.26 | |
| N-100-3-A | 30.24 | 31500.0 | 301.59 | 0.010 | 525.0 | 3.96 | 9.75 | 6.80 | 1.43 | 4.88 | 2.00 | 4.64 | 2.10 | 4.16 | 2.34 | 6.52 | 1.50 | |
| N-100-3-B | 30.24 | 31500.0 | 301.59 | 0.010 | 525.0 | 3.96 | 9.86 | 6.80 | 1.45 | 4.88 | 2.02 | 4.64 | 2.13 | 4.16 | 2.37 | 6.52 | 1.51 | |
| N-100-4-A | 30.24 | 31500.0 | 402.12 | 0.013 | 525.0 | 5.28 | 10.13 | 6.80 | 1.49 | 4.88 | 2.08 | 5.17 | 1.96 | 4.30 | 2.36 | 7.13 | 1.42 | |
| N-100-4-B | 30.24 | 31500.0 | 402.12 | 0.013 | 525.0 | 5.28 | 10.38 | 6.80 | 1.53 | 4.88 | 2.13 | 5.17 | 2.01 | 4.30 | 2.42 | 7.13 | 1.45 | |
| H-00-0-A | 73.60 | 31500.0 | 0.00 | 0.000 | 525.0 | 0.00 | 8.17 | 2.48 | 3.29 | 0.75 | 10.89 | 5.41 | 1.51 | |||||
| H-00-0-B | 73.60 | 31500.0 | 0.00 | 0.000 | 525.0 | 0.00 | 8.44 | 2.48 | 3.40 | 0.75 | 11.25 | 5.41 | 1.56 | |||||
| H-00-2-A | 73.60 | 31500.0 | 201.06 | 0.006 | 525.0 | 2.64 | 13.78 | 5.81 | 2.37 | 3.52 | 3.91 | 3.79 | 3.64 | 2.77 | 4.97 | 8.66 | 1.59 | |
| H-00-2-B | 73.60 | 31500.0 | 201.06 | 0.006 | 525.0 | 2.64 | 15.49 | 5.81 | 2.67 | 3.52 | 4.40 | 3.79 | 4.09 | 2.77 | 5.59 | 8.66 | 1.79 | |
| H-00-3-A | 73.60 | 31500.0 | 301.59 | 0.010 | 525.0 | 3.96 | 15.29 | 7.47 | 2.05 | 4.88 | 3.14 | 4.64 | 3.30 | 4.16 | 3.68 | 9.39 | 1.63 | |
| H-00-3-B | 73.60 | 31500.0 | 301.59 | 0.010 | 525.0 | 3.96 | 18.04 | 7.47 | 2.41 | 4.88 | 3.70 | 4.64 | 3.89 | 4.16 | 4.34 | 9.39 | 1.92 | |
| H-00-4-A | 73.60 | 31500.0 | 402.12 | 0.013 | 525.0 | 5.28 | 18.70 | 9.14 | 2.05 | 4.88 | 3.84 | 5.17 | 3.62 | 5.55 | 3.37 | 10.00 | 1.87 | |
| H-00-4-B | 73.60 | 31500.0 | 402.12 | 0.013 | 525.0 | 5.28 | 16.09 | 9.14 | 1.76 | 4.88 | 3.30 | 5.17 | 3.11 | 5.55 | 2.90 | 10.00 | 1.61 | |
| H-50-0-A | 67.60 | 31500.0 | 0.00 | 0.000 | 525.0 | 0.00 | 7.86 | 2.48 | 3.17 | 0.75 | 10.48 | 5.03 | 1.56 | |||||
| H-50-0-B | 67.60 | 31500.0 | 0.00 | 0.000 | 525.0 | 0.00 | 7.66 | 2.48 | 3.09 | 0.75 | 10.21 | 5.03 | 1.52 | |||||
| H-50-2-A | 67.60 | 31500.0 | 201.06 | 0.006 | 525.0 | 2.64 | 14.06 | 5.81 | 2.42 | 3.52 | 3.99 | 3.79 | 3.71 | 2.77 | 5.07 | 8.28 | 1.70 | |
| H-50-2-B | 67.60 | 31500.0 | 201.06 | 0.006 | 525.0 | 2.64 | 13.88 | 5.81 | 2.39 | 3.52 | 3.94 | 3.79 | 3.67 | 2.77 | 5.01 | 8.28 | 1.68 | |
| H-50-3-A | 67.60 | 31500.0 | 301.59 | 0.010 | 525.0 | 3.96 | 16.08 | 7.47 | 2.15 | 4.88 | 3.30 | 4.64 | 3.47 | 4.16 | 3.87 | 9.01 | 1.78 | |
| H-50-3-B | 67.60 | 31500.0 | 301.59 | 0.010 | 525.0 | 3.96 | 15.39 | 7.47 | 2.06 | 4.88 | 3.16 | 4.64 | 3.32 | 4.16 | 3.70 | 9.01 | 1.71 | |
| H-50-4-A | 67.60 | 31500.0 | 402.12 | 0.013 | 525.0 | 5.28 | 18.35 | 9.14 | 2.01 | 4.88 | 3.76 | 5.17 | 3.55 | 5.55 | 3.31 | 9.63 | 1.91 | |
| H-50-4-B | 67.60 | 31500.0 | 402.12 | 0.013 | 525.0 | 5.28 | 15.97 | 9.14 | 1.75 | 4.88 | 3.28 | 5.17 | 3.09 | 5.55 | 2.88 | 9.63 | 1.66 | |
| H-100-0-A | 64.40 | 31500.0 | 0.00 | 0.000 | 525.0 | 0.00 | 7.29 | 2.48 | 2.94 | 0.75 | 9.72 | 4.83 | 1.51 | |||||
| H-100-0-B | 64.40 | 31500.0 | 0.00 | 0.000 | 525.0 | 0.00 | 7.54 | 2.48 | 3.04 | 0.75 | 10.05 | 4.83 | 1.56 | |||||
| H-100-2-A | 64.40 | 31500.0 | 201.06 | 0.006 | 525.0 | 2.64 | 13.41 | 5.81 | 2.31 | 3.52 | 3.81 | 3.79 | 3.54 | 2.77 | 4.84 | 8.08 | 1.66 | |
| H-100-2-B | 64.40 | 31500.0 | 201.06 | 0.006 | 525.0 | 2.64 | 13.90 | 5.81 | 2.39 | 3.52 | 3.95 | 3.79 | 3.67 | 2.77 | 5.01 | 8.08 | 1.72 | |
| H-100-3-A | 64.40 | 31500.0 | 301.59 | 0.010 | 525.0 | 3.96 | 15.57 | 7.47 | 2.08 | 4.88 | 3.19 | 4.64 | 3.36 | 4.16 | 3.74 | 8.81 | 1.77 | |
| H-100-3-B | 64.40 | 31500.0 | 301.59 | 0.010 | 525.0 | 3.96 | 15.28 | 7.47 | 2.04 | 4.88 | 3.13 | 4.64 | 3.29 | 4.16 | 3.67 | 8.81 | 1.73 | |
| H-100-4-A | 64.40 | 31500.0 | 402.12 | 0.013 | 525.0 | 5.28 | 16.29 | 9.14 | 1.78 | 4.88 | 3.34 | 5.17 | 3.15 | 5.55 | 2.94 | 9.42 | 1.73 | |
| H-100-4-B | 64.40 | 31500.0 | 402.12 | 0.013 | 525.0 | 5.28 | 15.92 | 9.14 | 1.74 | 4.88 | 3.27 | 5.17 | 3.08 | 5.55 | 2.87 | 9.42 | 1.69 | |
| Xiao et al. (2016) | NC-1-U-A | 30.94 | 36000.0 | 402.12 | 0.011 | 325.0 | 3.63 | 8.45 | 6.96 | 1.21 | 4.56 | 1.85 | 4.44 | 1.90 | 3.81 | 2.22 | 6.40 | 1.32 |
| NC-1-U-B | 30.94 | 36000.0 | 402.12 | 0.011 | 325.0 | 3.63 | 9.05 | 6.96 | 1.30 | 4.56 | 1.98 | 4.44 | 2.04 | 3.81 | 2.37 | 6.40 | 1.41 | |
| NC-1-U-C | 30.94 | 36000.0 | 402.12 | 0.011 | 325.0 | 3.63 | 8.65 | 6.96 | 1.24 | 4.56 | 1.90 | 4.44 | 1.95 | 3.81 | 2.27 | 6.40 | 1.35 | |
| NC-1-U-D | 30.94 | 36000.0 | 402.12 | 0.011 | 325.0 | 3.63 | 8.01 | 6.96 | 1.15 | 4.56 | 1.76 | 4.44 | 1.80 | 3.81 | 2.10 | 6.40 | 1.25 | |
| NC-1-U-E | 30.94 | 36000.0 | 402.12 | 0.011 | 325.0 | 3.63 | 8.65 | 6.96 | 1.24 | 4.56 | 1.90 | 4.44 | 1.95 | 3.81 | 2.27 | 6.40 | 1.35 | |
| RC-2-U | 31.41 | 36000.0 | 402.12 | 0.011 | 325.0 | 3.63 | 7.84 | 7.06 | 1.11 | 4.56 | 1.72 | 4.44 | 1.77 | 3.81 | 2.06 | 6.43 | 1.22 | |
| RC-3-U-A | 25.64 | 36000.0 | 402.12 | 0.011 | 325.0 | 3.63 | 7.86 | 5.77 | 1.36 | 4.56 | 1.72 | 4.44 | 1.77 | 3.81 | 2.06 | 6.02 | 1.31 | |
| RC-3-U-B | 25.64 | 36000.0 | 402.12 | 0.011 | 325.0 | 3.63 | 7.86 | 5.77 | 1.36 | 4.56 | 1.72 | 4.44 | 1.77 | 3.81 | 2.06 | 6.02 | 1.31 | |
| RC-3-U-C | 25.64 | 36000.0 | 402.12 | 0.011 | 325.0 | 3.63 | 7.50 | 5.77 | 1.30 | 4.56 | 1.64 | 4.44 | 1.69 | 3.81 | 1.97 | 6.02 | 1.25 | |
| RC-3-U-D | 25.64 | 36000.0 | 402.12 | 0.011 | 325.0 | 3.63 | 7.75 | 5.77 | 1.34 | 4.56 | 1.70 | 4.44 | 1.75 | 3.81 | 2.03 | 6.02 | 1.29 | |
| RC-3-U-E | 25.64 | 36000.0 | 402.12 | 0.011 | 325.0 | 3.63 | 7.82 | 5.77 | 1.36 | 4.56 | 1.71 | 4.44 | 1.76 | 3.81 | 2.05 | 6.02 | 1.30 | |
| RC-4-U | 30.06 | 36000.0 | 402.12 | 0.011 | 325.0 | 3.63 | 8.73 | 6.76 | 1.29 | 4.56 | 1.91 | 4.44 | 1.97 | 3.81 | 2.29 | 6.34 | 1.38 | |
| RC-5-U-A | 30.76 | 36000.0 | 402.12 | 0.011 | 325.0 | 3.63 | 7.43 | 6.92 | 1.07 | 4.56 | 1.63 | 4.44 | 1.67 | 3.81 | 1.95 | 6.39 | 1.16 | |
| RC-5-U-B | 30.76 | 36000.0 | 402.12 | 0.011 | 325.0 | 3.63 | 7.92 | 6.92 | 1.14 | 4.56 | 1.74 | 4.44 | 1.78 | 3.81 | 2.08 | 6.39 | 1.24 | |
| RC-5-U-C | 30.76 | 36000.0 | 402.12 | 0.011 | 325.0 | 3.63 | 7.20 | 6.92 | 1.04 | 4.56 | 1.58 | 4.44 | 1.62 | 3.81 | 1.89 | 6.39 | 1.13 | |
| RC-5-U-D | 30.76 | 36000.0 | 402.12 | 0.011 | 325.0 | 3.63 | 7.43 | 6.92 | 1.07 | 4.56 | 1.63 | 4.44 | 1.67 | 3.81 | 1.95 | 6.39 | 1.16 | |
| RC-5-U-E | 30.76 | 36000.0 | 402.12 | 0.011 | 325.0 | 3.63 | 8.21 | 6.92 | 1.19 | 4.56 | 1.80 | 4.44 | 1.85 | 3.81 | 2.15 | 6.39 | 1.29 | |
| RC-6-U | 23.43 | 36000.0 | 402.12 | 0.011 | 325.0 | 3.63 | 8.12 | 5.27 | 1.54 | 4.39 | 1.85 | 4.44 | 1.83 | 3.51 | 2.31 | 5.85 | 1.39 | |
| RC-7-U | 33.03 | 36000.0 | 402.12 | 0.011 | 325.0 | 3.63 | 7.99 | 7.06 | 1.13 | 4.56 | 1.75 | 4.44 | 1.80 | 3.81 | 2.10 | 6.55 | 1.22 | |
| Ahmad et al. (2018) | N-0a | 40.00 | 31250.0 | 0.00 | 0.000 | 0.0 | 0.00 | 4.10 | 2.48 | 1.65 | 0.75 | 5.47 | 3.22 | 1.27 | ||||
| N-0b | 40.00 | 31250.0 | 0.00 | 0.000 | 0.0 | 0.00 | 4.28 | 2.48 | 1.72 | 0.75 | 5.71 | 3.22 | 1.33 | |||||
| N-1a | 40.00 | 31250.0 | 100.53 | 0.003 | 567.2 | 1.33 | 5.54 | 4.16 | 1.33 | 2.15 | 2.58 | 2.69 | 2.06 | 1.40 | 3.96 | 5.53 | 1.00 | |
| N-1b | 40.00 | 31250.0 | 100.53 | 0.003 | 567.2 | 1.33 | 6.02 | 4.16 | 1.45 | 2.15 | 2.80 | 2.69 | 2.24 | 1.40 | 4.31 | 5.53 | 1.09 | |
| N-2a | 40.00 | 31250.0 | 201.06 | 0.006 | 567.2 | 2.66 | 8.98 | 5.84 | 1.54 | 3.54 | 2.53 | 3.80 | 2.36 | 2.79 | 3.21 | 6.48 | 1.39 | |
| N-2b | 40.00 | 31250.0 | 201.06 | 0.006 | 567.2 | 2.66 | 8.35 | 5.84 | 1.43 | 3.54 | 2.36 | 3.80 | 2.20 | 2.79 | 2.99 | 6.48 | 1.29 | |
| N-3a | 40.00 | 31250.0 | 301.59 | 0.010 | 567.2 | 3.99 | 9.30 | 7.51 | 1.24 | 4.88 | 1.91 | 4.66 | 2.00 | 4.19 | 2.22 | 7.22 | 1.29 | |
| N-3b | 40.00 | 31250.0 | 301.59 | 0.010 | 567.2 | 3.99 | 10.10 | 7.51 | 1.34 | 4.88 | 2.07 | 4.66 | 2.17 | 4.19 | 2.41 | 7.22 | 1.40 | |
| N-4a | 40.00 | 31250.0 | 402.12 | 0.013 | 567.2 | 5.32 | 11.30 | 9.00 | 1.26 | 4.88 | 2.32 | 5.17 | 2.19 | 4.88 | 2.31 | 7.83 | 1.44 | |
| N-4b | 40.00 | 31250.0 | 402.12 | 0.013 | 567.2 | 5.32 | 10.97 | 9.00 | 1.22 | 4.88 | 2.25 | 5.17 | 2.12 | 4.88 | 2.25 | 7.83 | 1.40 | |
| N-5a | 40.00 | 31250.0 | 502.65 | 0.016 | 567.2 | 6.65 | 11.98 | 9.00 | 1.33 | 4.88 | 2.46 | 5.17 | 2.32 | 4.88 | 2.45 | 8.38 | 1.43 | |
| N-5b | 40.00 | 31250.0 | 502.65 | 0.016 | 567.2 | 6.65 | 12.30 | 9.00 | 1.37 | 4.88 | 2.52 | 5.17 | 2.38 | 4.88 | 2.52 | 8.38 | 1.47 | |
| Valikhani et al. (2021) | Ref.1 | 47.00 | 93330.0 | 0.00 | 0.000 | 0.0 | 0.00 | 8.56 | 2.48 | 3.45 | 0.75 | 11.41 | 3.69 | 2.32 | ||||
| Ref.2 | 47.00 | 93330.0 | 0.00 | 0.000 | 0.0 | 0.00 | 6.62 | 2.48 | 2.67 | 0.75 | 8.83 | 3.69 | 1.79 | |||||
| Ref.3 | 47.00 | 93330.0 | 0.00 | 0.000 | 0.0 | 0.00 | 5.43 | 2.48 | 2.19 | 0.75 | 7.24 | 3.69 | 1.47 | |||||
| Sand-lightweight concrete | ||||||||||||||||||
| Mattock et al. (1976) | A0 | 29.17 | 32258.0 | 0.00 | 0.000 | 0.0 | 0.00 | 3.45 | 1.49 | 2.31 | 0.64 | 5.41 | 2.09 | 1.65 | ||||
| A1 | 25.79 | 32258.0 | 141.94 | 0.004 | 328.9 | 1.45 | 5.23 | 2.79 | 1.87 | 1.93 | 2.71 | 2.38 | 2.19 | 1.29 | 4.04 | 3.93 | 1.33 | |
| A2 | 28.24 | 32258.0 | 283.87 | 0.009 | 369.6 | 3.25 | 6.30 | 4.42 | 1.43 | 3.54 | 1.78 | 3.57 | 1.76 | 2.90 | 2.17 | 5.10 | 1.24 | |
| A3 | 26.96 | 32258.0 | 425.81 | 0.013 | 366.8 | 4.84 | 7.03 | 5.85 | 1.20 | 4.88 | 1.44 | 4.36 | 1.61 | 4.04 | 1.74 | 5.70 | 1.23 | |
| A4 | 28.27 | 32258.0 | 567.74 | 0.018 | 351.0 | 6.18 | 7.58 | 6.21 | 1.22 | 4.88 | 1.56 | 4.40 | 1.73 | 4.14 | 1.83 | 6.13 | 1.24 | |
| A5 | 27.30 | 32258.0 | 709.68 | 0.022 | 351.0 | 7.72 | 8.21 | 6.14 | 1.34 | 4.88 | 1.68 | 4.40 | 1.87 | 4.10 | 2.00 | 5.92 | 1.39 | |
| A6 | 29.30 | 32258.0 | 851.61 | 0.026 | 357.2 | 9.43 | 9.27 | 6.21 | 1.49 | 4.88 | 1.90 | 4.40 | 2.11 | 4.14 | 2.24 | 6.35 | 1.46 | |
| Sneed et al. (2016) | S-SH-MO-U-1 | 32.89 | 31935.4 | 425.81 | 0.013 | 497.8 | 5.38 | 7.72 | 6.21 | 1.24 | 4.88 | 1.58 | 4.40 | 1.76 | 4.14 | 1.87 | 6.26 | 1.23 |
| S-SH-MO-U-2 | 32.89 | 31935.4 | 425.81 | 0.013 | 497.8 | 5.38 | 7.88 | 6.21 | 1.27 | 4.88 | 1.62 | 4.40 | 1.79 | 4.14 | 1.91 | 6.26 | 1.26 | |
| All-lightweight concrete | ||||||||||||||||||
| Mattock et al. (1976) | E0 | 27.30 | 32258.0 | 0.00 | 0.000 | 0.0 | 0.00 | 3.86 | 1.49 | 2.59 | 0.56 | 6.86 | 1.75 | 2.21 | ||||
| E1 | 28.61 | 32258.0 | 141.94 | 0.004 | 360.6 | 1.59 | 5.38 | 2.92 | 1.84 | 1.81 | 2.97 | 2.20 | 2.44 | 1.25 | 4.31 | 3.71 | 1.45 | |
| E2 | 27.79 | 32258.0 | 283.87 | 0.009 | 360.6 | 3.17 | 6.01 | 4.34 | 1.38 | 3.06 | 1.96 | 3.11 | 1.93 | 2.50 | 2.41 | 4.44 | 1.35 | |
| E3 | 28.03 | 32258.0 | 425.81 | 0.013 | 360.6 | 4.76 | 6.62 | 5.77 | 1.15 | 4.31 | 1.54 | 3.81 | 1.74 | 3.75 | 1.77 | 4.73 | 1.40 | |
| E4 | 27.86 | 32258.0 | 567.74 | 0.018 | 366.8 | 6.45 | 7.93 | 6.21 | 1.28 | 4.88 | 1.63 | 3.88 | 2.04 | 4.14 | 1.92 | 4.70 | 1.69 | |
| E5 | 28.37 | 32258.0 | 709.68 | 0.022 | 348.2 | 7.66 | 8.27 | 6.21 | 1.33 | 4.88 | 1.70 | 3.88 | 2.13 | 4.14 | 2.00 | 4.79 | 1.73 | |
| E6 | 27.92 | 32258.0 | 851.61 | 0.026 | 360.6 | 9.52 | 8.62 | 6.21 | 1.39 | 4.88 | 1.77 | 3.88 | 2.22 | 4.14 | 2.08 | 4.71 | 1.83 | |
| G0 | 27.79 | 32258.0 | 0.00 | 0.000 | 0.0 | 0.00 | 3.65 | 1.49 | 2.45 | 0.56 | 6.50 | 1.77 | 2.06 | |||||
| G1 | 28.58 | 32258.0 | 141.94 | 0.004 | 360.6 | 1.59 | 5.65 | 2.92 | 1.94 | 1.81 | 3.12 | 2.20 | 2.57 | 1.25 | 4.53 | 3.70 | 1.53 | |
| G2 | 26.75 | 32258.0 | 283.87 | 0.009 | 348.2 | 3.06 | 5.83 | 4.24 | 1.37 | 2.97 | 1.96 | 3.06 | 1.91 | 2.41 | 2.42 | 4.34 | 1.34 | |
| G3 | 28.27 | 32258.0 | 425.81 | 0.013 | 357.2 | 4.72 | 7.31 | 5.73 | 1.27 | 4.28 | 1.71 | 3.80 | 1.93 | 3.71 | 1.97 | 4.77 | 1.53 | |
| G4 | 30.48 | 32258.0 | 567.74 | 0.018 | 366.8 | 6.45 | 7.93 | 6.21 | 1.28 | 4.88 | 1.63 | 3.88 | 2.04 | 4.14 | 1.92 | 5.14 | 1.54 | |
| G5 | 27.61 | 32258.0 | 709.68 | 0.022 | 357.2 | 7.86 | 7.86 | 6.21 | 1.27 | 4.88 | 1.61 | 3.88 | 2.03 | 4.14 | 1.90 | 4.66 | 1.69 | |
| G6 | 27.61 | 32258.0 | 851.61 | 0.026 | 357.2 | 9.43 | 8.21 | 6.21 | 1.32 | 4.88 | 1.68 | 3.88 | 2.12 | 4.14 | 1.98 | 4.66 | 1.76 | |
| Sneed et al. (2016) | A-SH-MO-U-1 | 32.41 | 31935.4 | 425.81 | 0.013 | 497.8 | 5.38 | 7.25 | 6.21 | 1.17 | 4.80 | 1.51 | 3.88 | 1.87 | 4.14 | 1.75 | 5.47 | 1.33 |
| A-SH-MO-U-2 | 32.41 | 31935.4 | 425.81 | 0.013 | 497.8 | 5.38 | 7.32 | 6.21 | 1.18 | 4.80 | 1.53 | 3.88 | 1.89 | 4.14 | 1.77 | 5.47 | 1.34 | |
| Average | 1.65 | 3.18 | 2.35 | 2.94 | 1.42 | |||||||||||||
| Maximum | 3.45 | 11.41 | 4.09 | 8.86 | 2.32 | |||||||||||||
| Minimum | 1.03 | 1.39 | 1.37 | 1.70 | 1.00 | |||||||||||||
| STD | 0.53 | 2.14 | 0.70 | 1.28 | 0.27 | |||||||||||||
| COV | 31.87 | 67.31 | 29.60 | 43.39 | 18.87 | |||||||||||||
| Researcher(s) | Specimen | fc’ (MPa) | Acv (mm2) | Avf (mm2) | ρ | fy (MPa) | ρfy (MPa) | vtest (MPa) | AASHTO LRFD | CSA-S6 | PCI | ACI 318-19 | ||||
|---|---|---|---|---|---|---|---|---|---|---|---|---|---|---|---|---|
| vcal (MPa) | vtest/vcal | vcal (MPa) | vtest/vcal | vcal (MPa) | vtest/vcal | vcal (MPa) | vtest/vcal | |||||||||
| Normalweight concrete | ||||||||||||||||
| Hofbeck et al. (1969) | 2.1 | 21.37 | 32258.0 | 141.94 | 0.004 | 349.6 | 1.54 | 4.07 | 4.42 | 0.92 | 2.36 | 1.72 | 2.89 | 1.41 | 1.61 | 2.52 |
| 2.2 | 21.37 | 32258.0 | 283.87 | 0.009 | 349.6 | 3.08 | 4.69 | 4.81 | 0.97 | 3.98 | 1.18 | 4.09 | 1.15 | 3.21 | 1.46 | |
| 2.3 | 26.89 | 32258.0 | 425.81 | 0.013 | 349.6 | 4.61 | 5.79 | 6.05 | 0.96 | 4.88 | 1.19 | 5.00 | 1.16 | 4.03 | 1.44 | |
| 2.4 | 26.89 | 32258.0 | 567.74 | 0.018 | 349.6 | 6.15 | 6.90 | 6.05 | 1.14 | 4.88 | 1.41 | 5.17 | 1.33 | 4.03 | 1.71 | |
| 2.5 | 28.82 | 32258.0 | 709.68 | 0.022 | 349.6 | 7.69 | 8.96 | 6.48 | 1.38 | 4.88 | 1.84 | 5.17 | 1.73 | 4.21 | 2.13 | |
| 2.6 | 28.82 | 32258.0 | 851.61 | 0.026 | 349.6 | 9.23 | 9.55 | 6.48 | 1.47 | 4.88 | 1.96 | 5.17 | 1.85 | 4.21 | 2.27 | |
| 3.3 | 21.37 | 32258.0 | 283.77 | 0.009 | 349.6 | 3.08 | 4.69 | 4.81 | 0.97 | 3.98 | 1.18 | 4.09 | 1.15 | 3.21 | 1.46 | |
| 3.4 | 27.86 | 32258.0 | 506.42 | 0.016 | 325.4 | 5.11 | 7.09 | 6.27 | 1.13 | 4.88 | 1.45 | 5.17 | 1.37 | 4.15 | 1.71 | |
| 3.5 | 27.86 | 32258.0 | 790.47 | 0.025 | 292.3 | 7.16 | 7.94 | 6.27 | 1.27 | 4.88 | 1.63 | 5.17 | 1.54 | 4.15 | 1.91 | |
| 4.1 | 28.06 | 32258.0 | 141.94 | 0.004 | 455.8 | 1.82 | 4.85 | 4.78 | 1.02 | 2.66 | 1.82 | 3.14 | 1.54 | 1.91 | 2.54 | |
| 4.2 | 28.06 | 32258.0 | 283.87 | 0.009 | 455.8 | 3.64 | 6.76 | 6.31 | 1.07 | 4.57 | 1.48 | 4.45 | 1.52 | 3.82 | 1.77 | |
| 4.3 | 29.92 | 32258.0 | 425.81 | 0.013 | 455.8 | 5.46 | 8.14 | 6.73 | 1.21 | 4.88 | 1.67 | 5.17 | 1.57 | 4.28 | 1.90 | |
| 4.4 | 29.92 | 32258.0 | 567.74 | 0.018 | 455.8 | 7.28 | 9.65 | 6.73 | 1.43 | 4.88 | 1.98 | 5.17 | 1.87 | 4.28 | 2.26 | |
| 4.5 | 23.37 | 32258.0 | 709.68 | 0.022 | 455.8 | 9.10 | 9.10 | 5.26 | 1.73 | 4.38 | 2.08 | 5.17 | 1.76 | 3.51 | 2.60 | |
| 5.1 | 16.89 | 32258.0 | 141.94 | 0.004 | 349.6 | 1.54 | 3.52 | 3.80 | 0.93 | 2.36 | 1.49 | 2.89 | 1.22 | 1.61 | 2.18 | |
| 5.2 | 18.06 | 32258.0 | 283.87 | 0.009 | 349.6 | 3.08 | 4.83 | 4.06 | 1.19 | 3.39 | 1.42 | 4.06 | 1.19 | 2.71 | 1.78 | |
| 5.3 | 16.44 | 32258.0 | 425.81 | 0.013 | 349.6 | 4.61 | 5.58 | 3.70 | 1.51 | 3.08 | 1.81 | 3.70 | 1.51 | 2.47 | 2.26 | |
| 5.4 | 17.79 | 32258.0 | 567.74 | 0.018 | 349.6 | 6.15 | 5.48 | 4.00 | 1.37 | 3.34 | 1.64 | 4.00 | 1.37 | 2.67 | 2.05 | |
| 5.5 | 18.06 | 32258.0 | 709.68 | 0.022 | 349.6 | 7.69 | 6.96 | 4.06 | 1.71 | 3.39 | 2.06 | 4.06 | 1.71 | 2.71 | 2.57 | |
| Mattock et al. (1975) | E1C | 26.58 | 54193.4 | 567.74 | 0.010 | 357.2 | 3.74 | 6.07 | 5.98 | 1.02 | 4.68 | 1.30 | 4.51 | 1.35 | 3.93 | 1.55 |
| F1C | 29.10 | 54193.4 | 851.61 | 0.016 | 345.4 | 5.43 | 6.81 | 6.55 | 1.04 | 4.88 | 1.40 | 5.17 | 1.32 | 4.23 | 1.61 | |
| Mattock (1976) | A1 | 41.51 | 32258.0 | 141.94 | 0.004 | 356.1 | 1.57 | 5.24 | 4.45 | 1.18 | 2.39 | 2.19 | 2.92 | 1.80 | 1.64 | 3.19 |
| A2 | 41.51 | 32258.0 | 283.87 | 0.009 | 356.1 | 3.13 | 5.52 | 6.43 | 0.86 | 4.04 | 1.37 | 4.12 | 1.34 | 3.29 | 1.68 | |
| A3 | 40.13 | 32258.0 | 425.81 | 0.013 | 382.3 | 5.05 | 7.93 | 8.84 | 0.90 | 4.88 | 1.63 | 5.17 | 1.53 | 4.89 | 1.62 | |
| A4 | 40.54 | 32258.0 | 567.74 | 0.018 | 382.3 | 6.73 | 9.79 | 9.12 | 1.07 | 4.88 | 2.01 | 5.17 | 1.89 | 4.91 | 1.99 | |
| A5 | 42.23 | 32258.0 | 709.68 | 0.022 | 353.5 | 7.78 | 10.34 | 9.31 | 1.11 | 4.88 | 2.12 | 5.17 | 2.00 | 5.02 | 2.06 | |
| A6 | 40.68 | 32258.0 | 1032.26 | 0.032 | 331.0 | 10.59 | 12.14 | 9.15 | 1.33 | 4.88 | 2.49 | 5.17 | 2.35 | 4.92 | 2.46 | |
| A6A | 41.16 | 32258.0 | 1032.26 | 0.032 | 331.0 | 10.59 | 12.82 | 9.26 | 1.38 | 4.88 | 2.63 | 5.17 | 2.48 | 4.95 | 2.59 | |
| A7 | 41.16 | 32258.0 | 1290.32 | 0.040 | 332.3 | 13.29 | 13.38 | 9.26 | 1.44 | 4.88 | 2.74 | 5.17 | 2.59 | 4.95 | 2.70 | |
| Mattock et al. (1976) | N1 | 28.82 | 32258.0 | 141.94 | 0.004 | 351.0 | 1.54 | 3.17 | 4.43 | 0.72 | 2.37 | 1.34 | 2.90 | 1.10 | 1.62 | 1.96 |
| N2 | 26.89 | 32258.0 | 283.87 | 0.009 | 363.4 | 3.20 | 5.38 | 6.05 | 0.89 | 4.11 | 1.31 | 4.17 | 1.29 | 3.36 | 1.60 | |
| N3 | 27.55 | 32258.0 | 425.81 | 0.013 | 360.6 | 4.76 | 6.62 | 6.20 | 1.07 | 4.88 | 1.36 | 5.08 | 1.30 | 4.13 | 1.60 | |
| N4 | 28.61 | 32258.0 | 567.74 | 0.018 | 351.0 | 6.18 | 7.93 | 6.44 | 1.23 | 4.88 | 1.63 | 5.17 | 1.53 | 4.20 | 1.89 | |
| N5 | 27.13 | 32258.0 | 709.68 | 0.022 | 351.0 | 7.72 | 8.10 | 6.10 | 1.33 | 4.88 | 1.66 | 5.17 | 1.57 | 4.07 | 1.99 | |
| N6 | 28.41 | 32258.0 | 851.61 | 0.026 | 344.8 | 9.10 | 8.21 | 6.39 | 1.28 | 4.88 | 1.68 | 5.17 | 1.59 | 4.19 | 1.96 | |
| Kahn and Mitchell (2002) | SF-4-1-C | 46.92 | 38709.6 | 141.94 | 0.004 | 479.2 | 1.52 | 4.02 | 4.39 | 0.91 | 2.34 | 1.72 | 2.87 | 1.40 | 1.59 | 2.52 |
| SF-4-2-C | 46.92 | 38709.6 | 283.87 | 0.007 | 479.2 | 3.03 | 6.40 | 6.30 | 1.01 | 3.94 | 1.63 | 4.06 | 1.58 | 3.19 | 2.01 | |
| SF-4-3-C | 46.92 | 38709.6 | 425.81 | 0.011 | 479.2 | 4.55 | 8.18 | 8.22 | 1.00 | 4.88 | 1.68 | 4.97 | 1.65 | 4.78 | 1.71 | |
| SF-7-1-C | 80.91 | 38709.6 | 141.94 | 0.004 | 572.3 | 1.52 | 4.79 | 4.39 | 1.09 | 2.34 | 2.05 | 2.87 | 1.67 | 1.59 | 3.01 | |
| SF-7-2-C | 85.57 | 38709.6 | 283.87 | 0.007 | 572.3 | 3.03 | 5.94 | 6.30 | 0.94 | 3.94 | 1.51 | 4.06 | 1.46 | 3.19 | 1.87 | |
| SF-7-3-C | 90.35 | 38709.6 | 425.81 | 0.011 | 572.3 | 4.55 | 8.22 | 8.22 | 1.00 | 4.88 | 1.69 | 4.97 | 1.65 | 4.78 | 1.72 | |
| SF-7-4-C | 85.99 | 38709.6 | 567.74 | 0.015 | 572.3 | 6.07 | 7.21 | 9.31 | 0.77 | 4.88 | 1.48 | 5.17 | 1.39 | 6.37 | 1.13 | |
| SF-10-1-C-a | 83.11 | 38709.6 | 141.94 | 0.004 | 572.3 | 1.52 | 2.96 | 4.39 | 0.67 | 2.34 | 1.27 | 2.87 | 1.03 | 1.59 | 1.86 | |
| SF-10-1-C-b | 98.78 | 38709.6 | 141.94 | 0.004 | 572.3 | 1.52 | 3.45 | 4.39 | 0.78 | 2.34 | 1.47 | 2.87 | 1.20 | 1.59 | 2.16 | |
| SF-10-2-C-a | 101.19 | 38709.6 | 283.87 | 0.007 | 572.3 | 3.03 | 5.83 | 6.30 | 0.93 | 3.94 | 1.48 | 4.06 | 1.44 | 3.19 | 1.83 | |
| SF-10-2-C-b | 102.07 | 38709.6 | 283.87 | 0.007 | 572.3 | 3.03 | 5.53 | 6.30 | 0.88 | 3.94 | 1.41 | 4.06 | 1.36 | 3.19 | 1.74 | |
| SF-10-3-C-a | 111.49 | 38709.6 | 425.81 | 0.011 | 572.3 | 4.55 | 7.43 | 8.22 | 0.90 | 4.88 | 1.52 | 4.97 | 1.50 | 4.78 | 1.56 | |
| SF-10-3-C-b | 96.01 | 38709.6 | 425.81 | 0.011 | 572.3 | 4.55 | 7.28 | 8.22 | 0.89 | 4.88 | 1.49 | 4.97 | 1.46 | 4.78 | 1.52 | |
| SF-10-4-C-a | 106.65 | 38709.6 | 567.74 | 0.015 | 572.3 | 6.07 | 8.52 | 9.31 | 0.92 | 4.88 | 1.75 | 5.17 | 1.65 | 6.37 | 1.34 | |
| SF-10-4-C-b | 113.60 | 38709.6 | 567.74 | 0.015 | 572.3 | 6.07 | 8.76 | 9.31 | 0.94 | 4.88 | 1.80 | 5.17 | 1.69 | 6.37 | 1.38 | |
| SF-14-1-C | 110.42 | 38709.6 | 141.94 | 0.004 | 572.3 | 1.52 | 2.86 | 4.39 | 0.65 | 2.34 | 1.22 | 2.87 | 1.00 | 1.59 | 1.80 | |
| SF-14-2-C | 106.84 | 38709.6 | 283.87 | 0.007 | 572.3 | 3.03 | 4.62 | 6.30 | 0.73 | 3.94 | 1.17 | 4.06 | 1.14 | 3.19 | 1.45 | |
| SF-14-3-C | 106.13 | 38709.6 | 425.81 | 0.011 | 572.3 | 4.55 | 6.38 | 8.22 | 0.78 | 4.88 | 1.31 | 4.97 | 1.28 | 4.78 | 1.33 | |
| SF-14-4-C | 110.20 | 38709.6 | 567.74 | 0.015 | 572.3 | 6.07 | 8.42 | 9.31 | 0.90 | 4.88 | 1.73 | 5.17 | 1.63 | 6.37 | 1.32 | |
| Mansur et al. (2008) | AN-2 | 40.20 | 35999.9 | 314.16 | 0.009 | 530.0 | 3.61 | 8.18 | 7.03 | 1.16 | 4.54 | 1.80 | 4.43 | 1.85 | 3.79 | 2.16 |
| AN-4 | 40.20 | 35999.9 | 628.32 | 0.017 | 530.0 | 7.21 | 10.17 | 9.05 | 1.12 | 4.88 | 2.09 | 5.17 | 1.97 | 4.89 | 2.08 | |
| AN-6 | 40.20 | 35999.9 | 942.48 | 0.026 | 530.0 | 10.83 | 12.92 | 9.05 | 1.43 | 4.88 | 2.65 | 5.17 | 2.50 | 4.89 | 2.64 | |
| AM-2 | 69.01 | 35999.9 | 314.16 | 0.009 | 530.0 | 3.61 | 7.50 | 7.03 | 1.07 | 4.54 | 1.65 | 4.43 | 1.70 | 3.79 | 1.98 | |
| AM-3 | 69.01 | 35999.9 | 471.24 | 0.013 | 530.0 | 5.41 | 11.50 | 9.30 | 1.24 | 4.88 | 2.36 | 5.17 | 2.22 | 5.68 | 2.02 | |
| AM-4 | 69.01 | 35999.9 | 628.32 | 0.017 | 530.0 | 7.21 | 14.03 | 9.31 | 1.51 | 4.88 | 2.88 | 5.17 | 2.71 | 6.62 | 2.12 | |
| AH-2 | 87.00 | 35999.9 | 314.16 | 0.009 | 530.0 | 3.61 | 7.78 | 7.03 | 1.11 | 4.54 | 1.71 | 4.43 | 1.76 | 3.79 | 2.05 | |
| AH-3 | 87.00 | 35999.9 | 471.24 | 0.013 | 530.0 | 5.41 | 12.36 | 9.30 | 1.33 | 4.88 | 2.54 | 5.17 | 2.39 | 5.68 | 2.18 | |
| AH-4 | 87.00 | 35999.9 | 628.32 | 0.017 | 530.0 | 7.21 | 14.17 | 9.31 | 1.52 | 4.88 | 2.91 | 5.17 | 2.74 | 7.57 | 1.87 | |
| B1-4 | 73.21 | 35999.9 | 402.12 | 0.011 | 300.0 | 3.35 | 6.73 | 6.70 | 1.00 | 4.27 | 1.58 | 4.27 | 1.58 | 3.52 | 1.91 | |
| B2-2 | 84.91 | 35999.9 | 201.06 | 0.006 | 300.0 | 1.68 | 5.17 | 4.59 | 1.13 | 2.51 | 2.06 | 3.02 | 1.71 | 1.76 | 2.94 | |
| B2-4 | 84.91 | 35999.9 | 402.12 | 0.011 | 300.0 | 3.35 | 7.32 | 6.70 | 1.09 | 4.27 | 1.72 | 4.27 | 1.72 | 3.52 | 2.08 | |
| B2-5 | 84.91 | 35999.9 | 502.65 | 0.014 | 300.0 | 4.19 | 8.21 | 7.76 | 1.06 | 4.88 | 1.68 | 4.77 | 1.72 | 4.40 | 1.87 | |
| B2-6 | 84.91 | 35999.9 | 603.19 | 0.017 | 300.0 | 5.03 | 9.17 | 8.82 | 1.04 | 4.88 | 1.88 | 5.17 | 1.77 | 5.29 | 1.74 | |
| B3-4 | 95.21 | 35999.9 | 402.12 | 0.011 | 300.0 | 3.35 | 7.97 | 6.70 | 1.19 | 4.27 | 1.87 | 4.27 | 1.87 | 3.52 | 2.27 | |
| B4-2 | 106.40 | 35999.9 | 201.06 | 0.006 | 300.0 | 1.68 | 6.01 | 4.59 | 1.31 | 2.51 | 2.40 | 3.02 | 1.99 | 1.76 | 3.42 | |
| B4-4 | 106.40 | 35999.9 | 402.12 | 0.011 | 300.0 | 3.35 | 8.43 | 6.70 | 1.26 | 4.27 | 1.98 | 4.27 | 1.98 | 3.52 | 2.40 | |
| B4-5 | 106.40 | 35999.9 | 502.65 | 0.014 | 300.0 | 4.19 | 9.24 | 7.76 | 1.19 | 4.88 | 1.90 | 4.77 | 1.94 | 4.40 | 2.10 | |
| B4-6 | 106.40 | 35999.9 | 603.19 | 0.017 | 300.0 | 5.03 | 9.96 | 8.82 | 1.13 | 4.88 | 2.04 | 5.17 | 1.93 | 5.29 | 1.89 | |
| Sneed et al. (2016) | N-MO-P-1 | 33.37 | 31935.4 | 425.81 | 0.013 | 497.8 | 5.38 | 8.51 | 7.51 | 1.13 | 4.88 | 1.75 | 5.17 | 1.65 | 4.48 | 1.90 |
| N-MO-P-2 | 33.37 | 31935.4 | 425.81 | 0.013 | 497.8 | 5.38 | 7.94 | 7.51 | 1.06 | 4.88 | 1.63 | 5.17 | 1.53 | 4.48 | 1.77 | |
| Sand-lightweight concrete | ||||||||||||||||
| Mattock et al. (1976) | B1 | 25.79 | 32258.0 | 141.94 | 0.004 | 342.0 | 1.50 | 3.10 | 2.84 | 1.09 | 1.98 | 1.57 | 2.43 | 1.28 | 1.34 | 2.31 |
| B2 | 23.17 | 32258.0 | 283.87 | 0.009 | 351.0 | 3.09 | 4.50 | 4.27 | 1.05 | 3.39 | 1.32 | 3.48 | 1.29 | 2.76 | 1.63 | |
| B3 | 26.96 | 32258.0 | 425.81 | 0.013 | 351.0 | 4.63 | 5.79 | 5.66 | 1.02 | 4.77 | 1.21 | 4.26 | 1.36 | 4.04 | 1.43 | |
| B4 | 28.27 | 32258.0 | 567.74 | 0.018 | 338.5 | 5.96 | 6.48 | 6.21 | 1.04 | 4.88 | 1.33 | 4.40 | 1.47 | 4.14 | 1.57 | |
| B5 | 27.30 | 32258.0 | 709.68 | 0.022 | 348.2 | 7.66 | 6.90 | 6.14 | 1.12 | 4.88 | 1.41 | 4.40 | 1.57 | 4.10 | 1.68 | |
| B6 | 29.30 | 32258.0 | 851.61 | 0.026 | 357.2 | 9.43 | 7.96 | 6.21 | 1.28 | 4.88 | 1.63 | 4.40 | 1.81 | 4.14 | 1.92 | |
| C1 | 16.07 | 32258.0 | 141.94 | 0.004 | 342.0 | 1.50 | 2.51 | 2.84 | 0.88 | 1.98 | 1.27 | 2.43 | 1.03 | 1.34 | 1.87 | |
| C2 | 16.07 | 32258.0 | 283.87 | 0.009 | 369.6 | 3.25 | 3.54 | 3.61 | 0.98 | 3.01 | 1.18 | 3.07 | 1.15 | 2.41 | 1.47 | |
| C3 | 13.79 | 32258.0 | 425.81 | 0.013 | 351.0 | 4.63 | 3.63 | 3.10 | 1.17 | 2.59 | 1.40 | 2.64 | 1.38 | 2.07 | 1.75 | |
| C4 | 14.13 | 32258.0 | 567.74 | 0.018 | 360.6 | 6.34 | 3.86 | 3.18 | 1.21 | 2.65 | 1.46 | 2.70 | 1.43 | 2.12 | 1.82 | |
| C5 | 16.07 | 32258.0 | 709.68 | 0.022 | 369.6 | 8.13 | 4.41 | 3.61 | 1.22 | 3.01 | 1.46 | 3.07 | 1.44 | 2.41 | 1.83 | |
| C6 | 16.07 | 32258.0 | 851.61 | 0.026 | 342.0 | 9.03 | 5.10 | 3.61 | 1.41 | 3.01 | 1.69 | 3.07 | 1.66 | 2.41 | 2.12 | |
| D1 | 41.34 | 32258.0 | 141.94 | 0.004 | 357.2 | 1.57 | 2.55 | 2.90 | 0.88 | 2.04 | 1.25 | 2.48 | 1.03 | 1.40 | 1.82 | |
| D2 | 41.34 | 32258.0 | 283.87 | 0.009 | 360.6 | 3.17 | 4.61 | 4.34 | 1.06 | 3.47 | 1.33 | 3.53 | 1.31 | 2.83 | 1.63 | |
| D3 | 39.37 | 32258.0 | 425.81 | 0.013 | 360.6 | 4.76 | 5.32 | 5.77 | 0.92 | 4.88 | 1.09 | 4.32 | 1.23 | 4.14 | 1.29 | |
| D4 | 39.37 | 32258.0 | 567.74 | 0.018 | 360.6 | 6.34 | 7.05 | 6.21 | 1.14 | 4.88 | 1.45 | 4.40 | 1.60 | 4.14 | 1.70 | |
| D5 | 38.61 | 32258.0 | 709.68 | 0.022 | 360.6 | 7.94 | 7.46 | 6.21 | 1.20 | 4.88 | 1.53 | 4.40 | 1.70 | 4.14 | 1.80 | |
| D6 | 38.61 | 32258.0 | 851.61 | 0.026 | 357.2 | 9.43 | 8.41 | 6.21 | 1.36 | 4.88 | 1.73 | 4.40 | 1.91 | 4.14 | 2.03 | |
| Hoff (1993) | 1 LWC1 | 58.54 | 54193.4 | 283.87 | 0.005 | 369.6 | 1.94 | 1.98 | 3.23 | 0.61 | 2.37 | 0.84 | 2.76 | 0.72 | 1.73 | 1.14 |
| 2 LWC1 | 58.68 | 54193.4 | 283.87 | 0.005 | 369.6 | 1.94 | 2.52 | 3.23 | 0.78 | 2.37 | 1.06 | 2.76 | 0.91 | 1.73 | 1.46 | |
| 3 LWC1 | 57.16 | 54193.4 | 283.87 | 0.005 | 369.6 | 1.94 | 2.85 | 3.23 | 0.88 | 2.37 | 1.20 | 2.76 | 1.03 | 1.73 | 1.65 | |
| 4 LWC1 | 58.54 | 54193.4 | 567.74 | 0.01 | 468.9 | 3.94 | 5.25 | 5.03 | 1.04 | 4.15 | 1.26 | 3.93 | 1.34 | 3.51 | 1.49 | |
| 5 LWC1 | 58.68 | 54193.4 | 567.74 | 0.01 | 475.8 | 3.94 | 4.69 | 5.03 | 0.93 | 4.15 | 1.13 | 3.93 | 1.19 | 3.51 | 1.33 | |
| 6 LWC1 | 57.16 | 54193.4 | 567.74 | 0.01 | 468.9 | 3.94 | 5.01 | 5.03 | 1.00 | 4.15 | 1.21 | 3.93 | 1.28 | 3.51 | 1.43 | |
| 1 LWC2 | 63.92 | 54193.4 | 283.87 | 0.005 | 369.6 | 1.94 | 3.37 | 3.23 | 1.04 | 2.37 | 1.42 | 2.76 | 1.22 | 1.73 | 1.95 | |
| 2 LWC2 | 60.40 | 54193.4 | 283.87 | 0.005 | 369.6 | 1.94 | 2.31 | 3.23 | 0.71 | 2.37 | 0.98 | 2.76 | 0.84 | 1.73 | 1.34 | |
| 3 LWC2 | 60.19 | 54193.4 | 283.87 | 0.005 | 369.6 | 1.94 | 2.06 | 3.23 | 0.64 | 2.37 | 0.87 | 2.76 | 0.75 | 1.73 | 1.19 | |
| 4 LWC2 | 63.92 | 54193.4 | 567.74 | 0.01 | 468.9 | 3.94 | 5.10 | 5.03 | 1.01 | 4.15 | 1.23 | 3.93 | 1.30 | 3.51 | 1.45 | |
| 5 LWC2 | 60.40 | 54193.4 | 567.74 | 0.01 | 472.3 | 3.94 | 4.77 | 5.03 | 0.95 | 4.15 | 1.15 | 3.93 | 1.21 | 3.51 | 1.36 | |
| 6 LWC2 | 60.19 | 54193.4 | 567.74 | 0.01 | 472.3 | 3.94 | 4.69 | 5.03 | 0.93 | 4.15 | 1.13 | 3.93 | 1.19 | 3.51 | 1.33 | |
| 1 HSLWC | 71.09 | 54193.4 | 283.87 | 0.005 | 497.1 | 2.17 | 4.61 | 3.44 | 1.34 | 2.57 | 1.79 | 2.91 | 1.58 | 1.93 | 2.38 | |
| 2 HSLWC | 75.22 | 54193.4 | 283.87 | 0.005 | 497.1 | 2.17 | 3.78 | 3.44 | 1.10 | 2.57 | 1.47 | 2.91 | 1.30 | 1.93 | 1.96 | |
| 3 HSLWC | 75.98 | 54193.4 | 283.87 | 0.005 | 497.1 | 2.17 | 4.03 | 3.44 | 1.17 | 2.57 | 1.57 | 2.91 | 1.38 | 1.93 | 2.09 | |
| 4 HSLWC | 71.09 | 54193.4 | 567.74 | 0.01 | 460.6 | 3.94 | 6.00 | 5.03 | 1.19 | 4.15 | 1.45 | 3.93 | 1.53 | 3.51 | 1.71 | |
| 5 HSLWC | 75.22 | 54193.4 | 567.74 | 0.01 | 460.6 | 3.94 | 6.00 | 5.03 | 1.19 | 4.15 | 1.45 | 3.93 | 1.53 | 3.51 | 1.71 | |
| 6 HSLWC | 75.98 | 54193.4 | 567.74 | 0.01 | 460.6 | 3.94 | 6.16 | 5.03 | 1.22 | 4.15 | 1.48 | 3.93 | 1.57 | 3.51 | 1.75 | |
| Sneed et al. (2016) | S-SH-MO-P-1 | 32.89 | 31935.4 | 425.81 | 0.013 | 497.8 | 5.38 | 7.05 | 6.21 | 1.14 | 4.88 | 1.45 | 4.40 | 1.60 | 4.14 | 1.70 |
| S-SH-MO-P-2 | 32.89 | 31935.4 | 425.81 | 0.013 | 497.8 | 5.38 | 7.23 | 6.21 | 1.16 | 4.88 | 1.48 | 4.40 | 1.64 | 4.14 | 1.75 | |
| All-lightweight concrete | ||||||||||||||||
| Mattock et al. (1976) | F1 | 28.61 | 32258.0 | 141.94 | 0.004 | 366.8 | 1.61 | 3.10 | 2.94 | 1.05 | 1.83 | 1.69 | 2.22 | 1.40 | 1.27 | 2.44 |
| F2 | 27.79 | 32258.0 | 283.87 | 0.009 | 360.6 | 3.17 | 3.65 | 4.34 | 0.84 | 3.06 | 1.19 | 3.11 | 1.17 | 2.50 | 1.46 | |
| F2A | 27.37 | 32258.0 | 283.87 | 0.009 | 351.0 | 3.09 | 4.27 | 4.27 | 1.00 | 3.00 | 1.43 | 3.07 | 1.39 | 2.43 | 1.76 | |
| F3 | 28.03 | 32258.0 | 425.81 | 0.013 | 360.6 | 4.76 | 5.06 | 5.77 | 0.88 | 4.31 | 1.17 | 3.81 | 1.33 | 3.75 | 1.35 | |
| F3A | 27.37 | 32258.0 | 425.81 | 0.013 | 354.4 | 4.67 | 4.84 | 5.70 | 0.85 | 4.24 | 1.14 | 3.78 | 1.28 | 3.68 | 1.31 | |
| F4 | 27.86 | 32258.0 | 567.74 | 0.018 | 351.0 | 6.18 | 6.00 | 6.21 | 0.97 | 4.88 | 1.23 | 3.88 | 1.55 | 4.14 | 1.45 | |
| F5 | 28.37 | 32258.0 | 709.68 | 0.022 | 357.2 | 7.86 | 6.34 | 6.21 | 1.02 | 4.88 | 1.30 | 3.88 | 1.64 | 4.14 | 1.53 | |
| F6 | 27.92 | 32258.0 | 851.61 | 0.026 | 366.8 | 9.68 | 6.77 | 6.21 | 1.09 | 4.88 | 1.39 | 3.88 | 1.75 | 4.14 | 1.64 | |
| H1 | 28.58 | 32258.0 | 141.94 | 0.004 | 343.4 | 1.51 | 2.76 | 2.85 | 0.97 | 1.75 | 1.57 | 2.15 | 1.28 | 1.19 | 2.32 | |
| H2 | 26.75 | 32258.0 | 283.87 | 0.009 | 357.2 | 3.14 | 4.27 | 4.32 | 0.99 | 3.04 | 1.41 | 3.10 | 1.38 | 2.48 | 1.73 | |
| H3 | 28.27 | 32258.0 | 425.81 | 0.013 | 357.2 | 4.72 | 5.97 | 5.73 | 1.04 | 4.28 | 1.40 | 3.80 | 1.57 | 3.71 | 1.61 | |
| H4 | 30.48 | 32258.0 | 567.74 | 0.018 | 357.2 | 6.29 | 6.48 | 6.21 | 1.04 | 4.88 | 1.33 | 3.88 | 1.67 | 4.14 | 1.57 | |
| H5 | 27.24 | 32258.0 | 709.68 | 0.022 | 348.2 | 7.66 | 6.83 | 6.13 | 1.11 | 4.88 | 1.40 | 3.88 | 1.76 | 4.09 | 1.67 | |
| H6 | 28.13 | 32258.0 | 851.61 | 0.026 | 343.4 | 9.07 | 7.18 | 6.21 | 1.16 | 4.88 | 1.47 | 3.88 | 1.85 | 4.14 | 1.74 | |
| Sneed et al. (2016) | A-SH-MO-P-1 | 32.41 | 31935.4 | 425.81 | 0.013 | 497.8 | 5.38 | 6.43 | 6.21 | 1.04 | 4.80 | 1.34 | 3.88 | 1.66 | 4.14 | 1.55 |
| A-SH-MO-P-2 | 32.41 | 31935.4 | 425.81 | 0.013 | 497.8 | 5.38 | 7.34 | 6.21 | 1.18 | 4.80 | 1.53 | 3.88 | 1.89 | 4.14 | 1.77 | |
| Average | 1.08 | 1.59 | 1.54 | 1.86 | ||||||||||||
| Maximum | 1.73 | 2.91 | 2.74 | 3.42 | ||||||||||||
| Minimum | 0.61 | 0.84 | 0.72 | 1.13 | ||||||||||||
| STD | 0.21 | 0.40 | 0.37 | 0.42 | ||||||||||||
| COV | 19.29 | 24.85 | 23.74 | 22.49 | ||||||||||||
| Researcher(s) | Specimen | fc’ (MPa) | Acv (mm2) | Avf (mm2) | ρ | fy (MPa) | ρfy (MPa) | vtest (MPa) | AASHTO LRFD | CSA-S6 | PCI | ACI 318-19 | EuroCode 2 | CEB-FIP 2010 | ||||||
|---|---|---|---|---|---|---|---|---|---|---|---|---|---|---|---|---|---|---|---|---|
| vcal (MPa) | vtest/vcal | vcal (MPa) | vtest/vcal | vcal (MPa) | vtest/vcal | vcal (MPa) | vtest/vcal | vcal (MPa) | vtest/vcal | vcal (MPa) | vtest/vcal | |||||||||
| Normalweight concrete | ||||||||||||||||||||
| Mattock (1976) | B1 | 40.27 | 32258.0 | 141.94 | 0.004 | 353.5 | 1.56 | 3.36 | 2.89 | 1.16 | 1.54 | 2.18 | 2.46 | 1.37 | 1.17 | 2.87 | 2.43 | 1.38 | 1.70 | 1.97 |
| B2 | 40.27 | 32258.0 | 283.87 | 0.009 | 348.5 | 3.07 | 4.83 | 4.25 | 1.14 | 2.68 | 1.80 | 3.45 | 1.40 | 2.30 | 2.10 | 3.79 | 1.27 | 2.79 | 1.73 | |
| B3 | 41.75 | 32258.0 | 425.81 | 0.013 | 353.5 | 4.67 | 7.27 | 5.69 | 1.28 | 3.88 | 1.87 | 4.25 | 1.71 | 3.50 | 2.08 | 5.25 | 1.38 | 3.86 | 1.88 | |
| B4 | 41.75 | 32258.0 | 567.74 | 0.018 | 371.1 | 6.53 | 8.80 | 7.37 | 1.19 | 4.88 | 1.80 | 5.03 | 1.75 | 4.90 | 1.80 | 6.93 | 1.27 | 5.15 | 1.71 | |
| B5 | 40.65 | 32258.0 | 800.00 | 0.025 | 339.6 | 8.70 | 10.83 | 9.15 | 1.18 | 4.88 | 2.22 | 5.17 | 2.09 | 4.92 | 2.20 | 8.51 | 1.27 | 6.58 | 1.64 | |
| B6 | 40.65 | 32258.0 | 1032.26 | 0.032 | 339.6 | 10.87 | 11.72 | 9.15 | 1.28 | 4.88 | 2.40 | 5.17 | 2.27 | 4.92 | 2.38 | 8.51 | 1.38 | 8.12 | 1.44 | |
| D1 | 25.99 | 32258.0 | 141.94 | 0.004 | 353.5 | 1.56 | 4.07 | 2.89 | 1.41 | 1.54 | 2.64 | 2.46 | 1.65 | 1.17 | 3.48 | 2.17 | 1.87 | 1.53 | 2.66 | |
| D2 | 25.99 | 32258.0 | 283.87 | 0.009 | 353.5 | 3.11 | 6.34 | 4.29 | 1.48 | 2.71 | 2.34 | 3.47 | 1.83 | 2.33 | 2.72 | 3.57 | 1.78 | 2.55 | 2.49 | |
| D3 | 20.27 | 32258.0 | 425.81 | 0.013 | 386.1 | 5.10 | 6.96 | 4.56 | 1.53 | 3.80 | 1.83 | 3.80 | 1.83 | 3.04 | 2.29 | 4.66 | 1.50 | 3.53 | 1.97 | |
| D4 | 20.27 | 32258.0 | 567.74 | 0.018 | 386.1 | 6.80 | 6.91 | 4.56 | 1.51 | 3.80 | 1.82 | 3.80 | 1.82 | 3.04 | 2.27 | 4.66 | 1.48 | 4.57 | 1.51 | |
| D4A | 17.20 | 32258.0 | 567.74 | 0.018 | 372.3 | 6.55 | 6.85 | 3.87 | 1.77 | 3.23 | 2.12 | 3.23 | 2.12 | 2.58 | 2.66 | 4.00 | 1.71 | 3.94 | 1.74 | |
| D5 | 20.37 | 32258.0 | 800.00 | 0.025 | 319.7 | 7.93 | 8.34 | 4.58 | 1.82 | 3.82 | 2.18 | 3.82 | 2.18 | 3.06 | 2.73 | 4.68 | 1.78 | 4.67 | 1.79 | |
| D5A | 19.27 | 32258.0 | 800.00 | 0.025 | 318.5 | 7.90 | 8.62 | 4.34 | 1.99 | 3.61 | 2.39 | 3.61 | 2.39 | 2.89 | 2.98 | 4.45 | 1.94 | 4.42 | 1.95 | |
| D6 | 20.37 | 32258.0 | 1032.26 | 0.032 | 334.4 | 10.70 | 10.14 | 4.58 | 2.21 | 3.82 | 2.65 | 3.82 | 2.65 | 3.06 | 3.32 | 4.68 | 2.17 | 4.67 | 2.17 | |
| Kahn and Mitchell (2002) | SF-7-1-CJ | 80.91 | 38709.6 | 141.94 | 0.004 | 572.3 | 1.52 | 6.21 | 2.85 | 2.17 | 1.51 | 4.10 | 2.43 | 2.56 | 1.14 | 5.45 | 2.78 | 2.23 | 2.18 | 2.85 |
| SF-7-2-CJ | 80.91 | 38709.6 | 283.87 | 0.007 | 572.3 | 3.03 | 9.43 | 4.22 | 2.24 | 2.65 | 3.56 | 3.43 | 2.75 | 2.28 | 4.15 | 4.15 | 2.27 | 3.32 | 2.84 | |
| SF-7-3-CJ | 85.99 | 38709.6 | 425.81 | 0.011 | 572.3 | 4.55 | 12.67 | 5.59 | 2.27 | 3.79 | 3.35 | 4.20 | 3.02 | 3.41 | 3.71 | 5.54 | 2.29 | 4.71 | 2.69 | |
| SF-7-4-CJ | 85.99 | 38709.6 | 567.74 | 0.015 | 572.3 | 6.07 | 15.24 | 6.95 | 2.19 | 4.88 | 3.13 | 4.85 | 3.14 | 4.55 | 3.35 | 6.91 | 2.21 | 6.04 | 2.52 | |
| SF-10-3-CJ | 89.31 | 38709.6 | 425.81 | 0.011 | 572.3 | 4.55 | 13.09 | 5.59 | 2.34 | 3.79 | 3.46 | 4.20 | 3.12 | 3.41 | 3.84 | 5.56 | 2.35 | 4.76 | 2.75 | |
| SF-10-4-CJ | 89.31 | 38709.6 | 567.74 | 0.015 | 572.3 | 6.07 | 14.49 | 6.95 | 2.08 | 4.88 | 2.97 | 4.85 | 2.99 | 4.55 | 3.18 | 6.93 | 2.09 | 6.11 | 2.37 | |
| SF-14-1-CJ | 101.74 | 38709.6 | 141.94 | 0.004 | 572.3 | 1.52 | 10.45 | 2.85 | 3.66 | 1.51 | 6.91 | 2.43 | 4.31 | 1.14 | 9.18 | 2.90 | 3.60 | 2.33 | 4.48 | |
| SF-14-2-CJ | 101.74 | 38709.6 | 283.87 | 0.007 | 572.3 | 3.03 | 11.40 | 4.22 | 2.70 | 2.65 | 4.30 | 3.43 | 3.32 | 2.28 | 5.01 | 4.27 | 2.67 | 3.53 | 3.22 | |
| SF-14-3-CJ | 104.93 | 38709.6 | 425.81 | 0.011 | 572.3 | 4.55 | 15.48 | 5.59 | 2.77 | 3.79 | 4.09 | 4.20 | 3.68 | 3.41 | 4.54 | 5.65 | 2.74 | 4.98 | 3.11 | |
| SF-14-4-CJ | 104.93 | 38709.6 | 567.74 | 0.015 | 572.3 | 6.07 | 17.60 | 6.95 | 2.53 | 4.88 | 3.61 | 4.85 | 3.63 | 4.55 | 3.87 | 7.01 | 2.51 | 6.39 | 2.75 | |
| Scott (2010) | NN-3-A | 42.40 | 247741.4 | 1200.00 | 0.005 | 413.7 | 2.00 | 3.50 | 3.33 | 1.05 | 1.92 | 1.83 | 2.79 | 1.26 | 1.50 | 2.33 | 2.91 | 1.20 | 2.07 | 1.69 |
| NN-3-B | 42.40 | 247741.4 | 1200.00 | 0.005 | 413.7 | 2.00 | 3.91 | 3.33 | 1.17 | 1.92 | 2.04 | 2.79 | 1.40 | 1.50 | 2.60 | 2.91 | 1.34 | 2.07 | 1.89 | |
| NN-3-C | 42.40 | 247741.4 | 1200.00 | 0.005 | 413.7 | 2.00 | 4.11 | 3.33 | 1.23 | 1.92 | 2.15 | 2.79 | 1.47 | 1.50 | 2.74 | 2.91 | 1.41 | 2.07 | 1.99 | |
| Harries et al. (2012) | 615-3A | 39.99 | 103225.6 | 425.81 | 0.004 | 464.0 | 1.65 | 4.83 | 2.98 | 1.62 | 1.62 | 2.99 | 2.53 | 1.91 | 1.24 | 3.89 | 2.51 | 1.92 | 1.79 | 2.69 |
| 615-3B | 39.99 | 103225.6 | 425.81 | 0.004 | 464.0 | 1.65 | 4.07 | 2.98 | 1.37 | 1.62 | 2.52 | 2.53 | 1.61 | 1.24 | 3.28 | 2.51 | 1.62 | 1.79 | 2.27 | |
| 615-4A | 39.99 | 103225.6 | 722.58 | 0.007 | 424.0 | 2.90 | 4.79 | 4.10 | 1.17 | 2.55 | 1.88 | 3.35 | 1.43 | 2.17 | 2.20 | 3.63 | 1.32 | 2.59 | 1.85 | |
| 615-4B | 39.99 | 103225.6 | 722.58 | 0.007 | 424.0 | 2.90 | 5.47 | 4.10 | 1.34 | 2.55 | 2.15 | 3.35 | 1.63 | 2.17 | 2.52 | 3.63 | 1.51 | 2.59 | 2.11 | |
| 1035-3A | 39.99 | 103225.6 | 425.81 | 0.004 | 896.4 | 1.65 | 3.94 | 2.98 | 1.32 | 1.62 | 2.44 | 2.53 | 1.55 | 1.24 | 3.17 | 2.51 | 1.57 | 1.97 | 2.00 | |
| 1035-3B | 39.99 | 103225.6 | 425.81 | 0.004 | 868.8 | 1.65 | 4.50 | 2.98 | 1.51 | 1.62 | 2.79 | 2.53 | 1.78 | 1.24 | 3.63 | 2.51 | 1.79 | 1.96 | 2.30 | |
| 1035-4A | 39.99 | 103225.6 | 722.58 | 0.007 | 965.3 | 2.90 | 5.76 | 4.10 | 1.41 | 2.55 | 2.26 | 3.35 | 1.72 | 2.17 | 2.65 | 3.63 | 1.59 | 2.97 | 1.94 | |
| 1035-4B | 39.99 | 103225.6 | 722.58 | 0.007 | 905.3 | 2.90 | 4.87 | 4.10 | 1.19 | 2.55 | 1.91 | 3.35 | 1.45 | 2.17 | 2.24 | 3.63 | 1.34 | 2.94 | 1.66 | |
| Shaw and Sneed (2014) | N-5-R-4 | 33.51 | 31935.4 | 425.81 | 0.013 | 456.4 | 5.38 | 8.23 | 6.33 | 1.30 | 4.41 | 1.87 | 4.57 | 1.80 | 4.03 | 2.04 | 5.75 | 1.43 | 4.12 | 2.00 |
| N-5-R-5 | 33.51 | 31935.4 | 425.81 | 0.013 | 456.4 | 5.38 | 7.44 | 6.33 | 1.18 | 4.41 | 1.69 | 4.57 | 1.63 | 4.03 | 1.84 | 5.75 | 1.29 | 4.12 | 1.81 | |
| N-5-R-6 | 33.51 | 31935.4 | 425.81 | 0.013 | 456.4 | 5.38 | 7.45 | 6.33 | 1.18 | 4.41 | 1.69 | 4.57 | 1.63 | 4.03 | 1.85 | 5.75 | 1.30 | 4.12 | 1.81 | |
| N-8-R-1 | 52.06 | 31935.4 | 425.81 | 0.013 | 456.4 | 5.38 | 10.31 | 6.33 | 1.63 | 4.41 | 2.34 | 4.57 | 2.26 | 4.03 | 2.56 | 6.04 | 1.71 | 4.54 | 2.27 | |
| N-8-R-2 | 52.06 | 31935.4 | 425.81 | 0.013 | 456.4 | 5.38 | 7.81 | 6.33 | 1.23 | 4.41 | 1.77 | 4.57 | 1.71 | 4.03 | 1.94 | 6.04 | 1.29 | 4.54 | 1.72 | |
| N-8-R-3 | 52.06 | 31935.4 | 425.81 | 0.013 | 456.4 | 5.38 | 8.94 | 6.33 | 1.41 | 4.41 | 2.03 | 4.57 | 1.96 | 4.03 | 2.22 | 6.04 | 1.48 | 4.54 | 1.97 | |
| Barbosa et al. (2017) | 4G60 | 28.2 | 247660 | 1032.00 | 0.0042 | 473 | 1.72 | 4.72 | 3.04 | 1.55 | 1.67 | 2.83 | 2.59 | 1.82 | 1.29 | 3.65 | 2.36 | 2.00 | 1.69 | 2.79 |
| 4G80 | 28.2 | 247660 | 1032.00 | 0.0042 | 591 | 1.72 | 4.71 | 3.04 | 1.55 | 1.67 | 2.82 | 2.59 | 1.82 | 1.29 | 3.64 | 2.36 | 1.99 | 1.74 | 2.71 | |
| 5G60 | 28.2 | 186050 | 1200.00 | 0.0064 | 443 | 2.67 | 6.59 | 3.89 | 1.69 | 2.38 | 2.77 | 3.22 | 2.05 | 2.00 | 3.29 | 3.21 | 2.05 | 2.27 | 2.90 | |
| 5G80 | 28.2 | 186050 | 1200.00 | 0.0064 | 589 | 2.67 | 7.17 | 3.89 | 1.84 | 2.38 | 3.02 | 3.22 | 2.23 | 2.00 | 3.58 | 3.21 | 2.23 | 2.36 | 3.04 | |
| Sand-lightweight concrete | ||||||||||||||||||||
| Scott (2010) | LL-3-A | 39.51 | 247741.4 | 1200.00 | 0.005 | 413.7 | 2.00 | 3.61 | 3.33 | 1.08 | 1.63 | 2.22 | 2.37 | 1.52 | 1.28 | 2.83 | 2.71 | 1.33 | 1.99 | 1.81 |
| LL-3-B | 39.51 | 247741.4 | 1200.00 | 0.005 | 413.7 | 2.00 | 4.00 | 3.33 | 1.20 | 1.63 | 2.46 | 2.37 | 1.69 | 1.28 | 3.13 | 2.71 | 1.48 | 1.99 | 2.01 | |
| LL-3-C | 39.51 | 247741.4 | 1200.00 | 0.005 | 413.7 | 2.00 | 4.13 | 3.33 | 1.24 | 1.63 | 2.54 | 2.37 | 1.74 | 1.28 | 3.23 | 2.71 | 1.52 | 1.99 | 2.07 | |
| NL-3-A | 39.51 | 247741.4 | 1200.00 | 0.005 | 413.7 | 2.00 | 4.35 | 3.33 | 1.30 | 1.63 | 2.67 | 2.37 | 1.83 | 1.28 | 3.40 | 2.71 | 1.60 | 1.99 | 2.18 | |
| NL-3-B | 39.51 | 247741.4 | 1200.00 | 0.005 | 413.7 | 2.00 | 4.27 | 3.33 | 1.28 | 1.63 | 2.62 | 2.37 | 1.80 | 1.28 | 3.35 | 2.71 | 1.58 | 1.99 | 2.15 | |
| NL-3-C | 39.51 | 247741.4 | 1200.00 | 0.005 | 413.7 | 2.00 | 3.34 | 3.33 | 1.00 | 1.63 | 2.05 | 2.37 | 1.41 | 1.28 | 2.61 | 2.71 | 1.23 | 1.99 | 1.67 | |
| Shaw and Sneed (2014) | S-5-R-1 | 31.58 | 31935.4 | 425.81 | 0.013 | 456.4 | 5.38 | 7.16 | 6.21 | 1.15 | 3.75 | 1.91 | 3.88 | 1.85 | 3.43 | 2.09 | 5.58 | 1.28 | 3.97 | 1.81 |
| S-5-R-2 | 31.58 | 31935.4 | 425.81 | 0.013 | 456.4 | 5.38 | 7.02 | 6.21 | 1.13 | 3.75 | 1.87 | 3.88 | 1.81 | 3.43 | 2.05 | 5.58 | 1.26 | 3.97 | 1.77 | |
| S-5-R-3 | 31.58 | 31935.4 | 425.81 | 0.013 | 456.4 | 5.38 | 8.90 | 6.21 | 1.43 | 3.75 | 2.38 | 3.88 | 2.29 | 3.43 | 2.60 | 5.58 | 1.59 | 3.97 | 2.24 | |
| S-8-R-1 | 49.64 | 31935.4 | 425.81 | 0.013 | 456.4 | 5.38 | 10.03 | 6.21 | 1.62 | 3.75 | 2.68 | 3.88 | 2.58 | 3.43 | 2.93 | 5.84 | 1.72 | 4.37 | 2.30 | |
| S-8-R-2 | 49.64 | 31935.4 | 425.81 | 0.013 | 456.4 | 5.38 | 9.38 | 6.21 | 1.51 | 3.75 | 2.50 | 3.88 | 2.42 | 3.43 | 2.74 | 5.84 | 1.61 | 4.37 | 2.15 | |
| S-8-R-3 | 49.64 | 31935.4 | 425.81 | 0.013 | 456.4 | 5.38 | 9.29 | 6.21 | 1.50 | 3.75 | 2.48 | 3.88 | 2.39 | 3.43 | 2.71 | 5.84 | 1.59 | 4.37 | 2.13 | |
| Sneed et al. (2016) | S-SL-CJ-09-R-1 | 37.10 | 31935.4 | 283.87 | 0.009 | 497.8 | 3.72 | 6.87 | 4.84 | 1.42 | 2.69 | 2.55 | 3.23 | 2.13 | 2.37 | 2.90 | 4.18 | 1.65 | 3.08 | 2.23 |
| S-SL-CJ-09-R-2 | 37.10 | 31935.4 | 283.87 | 0.009 | 497.8 | 3.72 | 7.03 | 4.84 | 1.45 | 2.69 | 2.61 | 3.23 | 2.18 | 2.37 | 2.96 | 4.18 | 1.68 | 3.08 | 2.28 | |
| S-SL-CJ-13-R-1 | 38.41 | 31935.4 | 425.81 | 0.013 | 497.8 | 5.38 | 8.80 | 6.21 | 1.42 | 3.75 | 2.35 | 3.88 | 2.27 | 3.43 | 2.57 | 5.69 | 1.55 | 4.19 | 2.10 | |
| S-SL-CJ-13-R-2 | 38.41 | 31935.4 | 425.81 | 0.013 | 497.8 | 5.38 | 8.27 | 6.21 | 1.33 | 3.75 | 2.21 | 3.88 | 2.13 | 3.43 | 2.41 | 5.69 | 1.45 | 4.19 | 1.97 | |
| S-SL-CJ-17-R-1 | 34.13 | 31935.4 | 567.74 | 0.017 | 497.8 | 7.03 | 8.69 | 6.21 | 1.40 | 4.80 | 1.81 | 4.40 | 1.98 | 4.14 | 2.10 | 6.26 | 1.39 | 5.14 | 1.69 | |
| S-SL-CJ-17-R-2 | 34.13 | 31935.4 | 567.74 | 0.017 | 497.8 | 7.03 | 9.07 | 6.21 | 1.46 | 4.80 | 1.89 | 4.40 | 2.06 | 4.14 | 2.19 | 6.26 | 1.45 | 5.14 | 1.77 | |
| S-SL-CJ-22-R-1 | 34.48 | 31935.4 | 709.68 | 0.022 | 497.8 | 9.10 | 8.98 | 6.21 | 1.45 | 4.88 | 1.84 | 4.40 | 2.04 | 4.14 | 2.17 | 6.32 | 1.42 | 6.41 | 1.40 | |
| S-SL-CJ-22-R-2 | 34.48 | 31935.4 | 709.68 | 0.022 | 497.8 | 9.10 | 8.02 | 6.21 | 1.29 | 4.88 | 1.64 | 4.40 | 1.82 | 4.14 | 1.94 | 6.32 | 1.27 | 6.41 | 1.25 | |
| S-CL-CJ-9-R-1 | 32.89 | 31935.4 | 283.87 | 0.009 | 497.8 | 3.72 | 5.16 | 4.84 | 1.07 | 2.69 | 1.92 | 3.23 | 1.60 | 2.37 | 2.18 | 4.11 | 1.26 | 3.00 | 1.72 | |
| S-CL-CJ-9-R-2 | 32.89 | 31935.4 | 283.87 | 0.009 | 497.8 | 3.72 | 5.98 | 4.84 | 1.23 | 2.69 | 2.22 | 3.23 | 1.85 | 2.37 | 2.52 | 4.11 | 1.45 | 3.00 | 1.99 | |
| S-CL-CJ-13-R-1 | 31.99 | 31935.4 | 425.81 | 0.013 | 497.8 | 5.38 | 7.07 | 6.21 | 1.14 | 3.75 | 1.89 | 3.88 | 1.82 | 3.43 | 2.06 | 5.59 | 1.27 | 4.03 | 1.76 | |
| S-CL-CJ-13-R-2 | 31.99 | 31935.4 | 425.81 | 0.013 | 497.8 | 5.38 | 6.53 | 6.21 | 1.05 | 3.75 | 1.74 | 3.88 | 1.68 | 3.43 | 1.90 | 5.59 | 1.17 | 4.03 | 1.62 | |
| All-lightweight concrete | ||||||||||||||||||||
| Shaw and Sneed (2014) | A-5-R-1 | 41.92 | 31935.4 | 425.81 | 0.013 | 456.4 | 5.38 | 6.75 | 6.21 | 1.09 | 3.31 | 2.04 | 3.43 | 1.97 | 3.03 | 2.23 | 5.74 | 1.18 | 4.21 | 1.60 |
| A-5-R-2 | 41.92 | 31935.4 | 425.81 | 0.013 | 456.4 | 5.38 | 7.36 | 6.21 | 1.19 | 3.31 | 2.23 | 3.43 | 2.15 | 3.03 | 2.43 | 5.74 | 1.28 | 4.21 | 1.75 | |
| A-5-R-3 | 41.92 | 31935.4 | 425.81 | 0.013 | 456.4 | 5.38 | 7.16 | 6.21 | 1.15 | 3.31 | 2.17 | 3.43 | 2.09 | 3.03 | 2.37 | 5.74 | 1.25 | 4.21 | 1.70 | |
| A-8-R-1 | 54.08 | 31935.4 | 425.81 | 0.013 | 456.4 | 5.38 | 8.60 | 6.21 | 1.39 | 3.31 | 2.60 | 3.43 | 2.51 | 3.03 | 2.84 | 5.88 | 1.46 | 4.45 | 1.93 | |
| A-8-R-2 | 54.08 | 31935.4 | 425.81 | 0.013 | 456.4 | 5.38 | 8.91 | 6.21 | 1.44 | 3.31 | 2.69 | 3.43 | 2.60 | 3.03 | 2.94 | 5.88 | 1.52 | 4.45 | 2.00 | |
| A-8-R-3 | 54.08 | 31935.4 | 425.81 | 0.013 | 456.4 | 5.38 | 8.93 | 6.21 | 1.44 | 3.31 | 2.70 | 3.43 | 2.61 | 3.03 | 2.95 | 5.88 | 1.52 | 4.45 | 2.00 | |
| Sneed et al. (2016) | A-SL-CJ-13-R-1 | 30.20 | 31935.4 | 425.81 | 0.013 | 497.8 | 5.38 | 6.47 | 6.21 | 1.04 | 3.31 | 1.96 | 3.43 | 1.89 | 3.03 | 2.14 | 5.56 | 1.16 | 3.98 | 1.63 |
| A-SL-CJ-13-R-2 | 30.20 | 31935.4 | 425.81 | 0.013 | 497.8 | 5.38 | 6.53 | 6.21 | 1.05 | 3.31 | 1.97 | 3.43 | 1.91 | 3.03 | 2.16 | 5.56 | 1.17 | 3.98 | 1.64 | |
| A-CL-CJ-13-R-1 | 30.75 | 31935.4 | 425.81 | 0.013 | 497.8 | 5.38 | 6.20 | 6.21 | 1.00 | 3.31 | 1.88 | 3.43 | 1.81 | 3.03 | 2.05 | 5.57 | 1.11 | 4.00 | 1.55 | |
| A-CL-CJ-13-R-2 | 30.75 | 31935.4 | 425.81 | 0.013 | 497.8 | 5.38 | 6.28 | 6.21 | 1.01 | 3.31 | 1.90 | 3.43 | 1.83 | 3.03 | 2.08 | 5.57 | 1.13 | 4.00 | 1.57 | |
| Average | 1.49 | 2.44 | 2.08 | 2.86 | 1.62 | 2.09 | ||||||||||||||
| Maximum | 3.66 | 6.91 | 4.31 | 9.18 | 3.60 | 4.48 | ||||||||||||||
| Minimum | 1.00 | 1.64 | 1.26 | 1.80 | 1.11 | 1.25 | ||||||||||||||
| STD | 0.47 | 0.77 | 0.57 | 1.03 | 0.44 | 0.51 | ||||||||||||||
| COV | 31.75 | 31.60 | 27.60 | 35.99 | 27.08 | 24.49 | ||||||||||||||
| Researcher(s) | Specimen | fc’ (MPa) | Acv (mm2) | Avf (mm2) | ρ | fy (MPa) | ρfy (MPa) | vtest (MPa) | AASHTO LRFD | CSA-S6 | PCI | ACI 318-19 | EuroCode 2 | CEB-FIP 2010 | ||||||
|---|---|---|---|---|---|---|---|---|---|---|---|---|---|---|---|---|---|---|---|---|
| vcal (MPa) | vtest/vcal | vcal (MPa) | vtest/vcal | vcal (MPa) | vtest/vcal | vcal (MPa) | vtest/vcal | vcal (MPa) | vtest/vcal | vcal (MPa) | vtest/vcal | |||||||||
| Normalweight concrete | ||||||||||||||||||||
| Mattock (1976) | C1 | 40.47 | 32258.0 | 141.94 | 0.004 | 351.0 | 1.54 | 1.45 | 1.30 | 1.11 | 0.88 | 1.64 | 0.70 | 2.08 | 0.70 | 2.08 | 1.34 | 1.08 | 0.94 | 1.54 |
| C2 | 40.47 | 32258.0 | 283.87 | 0.009 | 351.0 | 3.09 | 2.48 | 2.13 | 1.16 | 1.58 | 1.57 | 1.39 | 1.79 | 1.39 | 1.79 | 2.27 | 1.10 | 2.00 | 1.24 | |
| C3 | 41.23 | 32258.0 | 425.81 | 0.013 | 348.5 | 4.60 | 2.95 | 2.95 | 1.00 | 2.26 | 1.31 | 2.07 | 1.43 | 2.07 | 1.43 | 3.18 | 0.93 | 2.94 | 1.00 | |
| C4 | 41.23 | 32258.0 | 567.74 | 0.018 | 356.1 | 6.27 | 4.14 | 3.85 | 1.07 | 3.01 | 1.38 | 2.82 | 1.47 | 2.82 | 1.47 | 4.18 | 0.99 | 4.07 | 1.02 | |
| C5 | 42.51 | 32258.0 | 709.68 | 0.022 | 363.6 | 8.00 | 5.38 | 4.78 | 1.12 | 3.79 | 1.42 | 3.60 | 1.49 | 3.60 | 1.49 | 5.23 | 1.03 | 5.15 | 1.05 | |
| C6 | 42.51 | 32258.0 | 1032.26 | 0.032 | 312.0 | 9.98 | 6.08 | 4.96 | 1.23 | 4.68 | 1.30 | 4.14 | 1.47 | 4.14 | 1.47 | 6.42 | 0.95 | 6.70 | 0.91 | |
| G1 | 40.47 | 32258.0 | 141.94 | 0.004 | 351.0 | 1.54 | 1.10 | 1.30 | 0.85 | 0.88 | 1.25 | 0.70 | 1.59 | 0.70 | 1.59 | 1.34 | 0.82 | 0.94 | 1.17 | |
| G2 | 40.47 | 32258.0 | 283.87 | 0.009 | 351.0 | 3.36 | 1.82 | 2.28 | 0.80 | 1.70 | 1.07 | 1.51 | 1.20 | 1.51 | 1.20 | 2.43 | 0.75 | 2.09 | 0.87 | |
| G3 | 41.23 | 32258.0 | 425.81 | 0.013 | 348.5 | 5.05 | 2.65 | 3.19 | 0.83 | 2.46 | 1.08 | 2.27 | 1.17 | 2.27 | 1.17 | 3.45 | 0.77 | 3.08 | 0.86 | |
| G4 | 41.23 | 32258.0 | 567.74 | 0.018 | 356.1 | 6.51 | 3.45 | 3.98 | 0.87 | 3.12 | 1.11 | 2.93 | 1.18 | 2.93 | 1.18 | 4.32 | 0.80 | 4.14 | 0.83 | |
| G5 | 42.51 | 32258.0 | 800.00 | 0.022 | 363.6 | 8.38 | 4.04 | 4.96 | 0.81 | 3.96 | 1.02 | 3.77 | 1.07 | 3.77 | 1.07 | 5.46 | 0.74 | 5.26 | 0.77 | |
| G6 | 42.51 | 32258.0 | 1032.26 | 0.032 | 312.0 | 10.33 | 5.36 | 4.96 | 1.08 | 4.84 | 1.11 | 4.14 | 1.30 | 4.14 | 1.30 | 6.62 | 0.81 | 6.80 | 0.79 | |
| H1 | 40.16 | 32258.0 | 141.94 | 0.004 | 382.3 | 1.45 | 1.30 | 1.25 | 1.04 | 0.84 | 1.54 | 0.65 | 1.99 | 0.65 | 1.99 | 1.28 | 1.01 | 0.93 | 1.39 | |
| H2 | 41.92 | 32258.0 | 283.87 | 0.009 | 382.3 | 3.31 | 2.22 | 2.25 | 0.99 | 1.68 | 1.32 | 1.49 | 1.49 | 1.49 | 1.49 | 2.41 | 0.92 | 2.14 | 1.04 | |
| H3 | 41.92 | 32258.0 | 425.81 | 0.013 | 382.3 | 4.96 | 3.17 | 3.15 | 1.01 | 2.42 | 1.31 | 2.23 | 1.42 | 2.23 | 1.42 | 3.40 | 0.93 | 3.14 | 1.01 | |
| H4 | 41.89 | 32258.0 | 567.74 | 0.018 | 369.8 | 6.62 | 3.52 | 4.04 | 0.87 | 3.17 | 1.11 | 2.98 | 1.18 | 2.98 | 1.18 | 4.39 | 0.80 | 4.24 | 0.83 | |
| H5 | 42.61 | 32258.0 | 800.00 | 0.025 | 322.7 | 7.98 | 4.51 | 4.77 | 0.94 | 3.78 | 1.19 | 3.59 | 1.26 | 3.59 | 1.26 | 5.21 | 0.86 | 5.34 | 0.84 | |
| H6 | 40.68 | 32258.0 | 1032.26 | 0.032 | 322.7 | 10.26 | 5.24 | 4.96 | 1.06 | 4.80 | 1.09 | 4.14 | 1.27 | 4.14 | 1.27 | 6.57 | 0.80 | 6.74 | 0.78 | |
| Kahn and Mitchell (2002) | SF-10-1-CJ† | 98.78 | 38709.6 | 141.94 | 0.004 | 572.3 | 1.52 | 3.65 | 1.28 | 2.84 | 0.87 | 4.19 | 0.68 | 5.34 | 0.68 | 5.34 | 1.52 | 2.40 | 1.41 | 2.59 |
| SF-10-2-CJ† | 83.11 | 38709.6 | 283.87 | 0.007 | 572.3 | 3.03 | 5.67 | 2.10 | 2.69 | 1.55 | 3.65 | 1.37 | 4.15 | 1.37 | 4.15 | 2.39 | 2.37 | 2.44 | 2.32 | |
| Shaw and Sneed (2014) | N-5-S-4 | 33.51 | 31935.4 | 425.81 | 0.013 | 456.4 | 5.38 | 4.30 | 3.37 | 1.27 | 2.61 | 1.65 | 2.42 | 1.77 | 2.42 | 1.77 | 3.59 | 1.20 | 3.23 | 1.33 |
| N-5-S-5 | 33.51 | 31935.4 | 425.81 | 0.013 | 456.4 | 5.38 | 4.83 | 3.37 | 1.43 | 2.61 | 1.85 | 2.42 | 2.00 | 2.42 | 2.00 | 3.59 | 1.35 | 3.23 | 1.50 | |
| N-5-S-6 | 33.51 | 31935.4 | 425.81 | 0.013 | 456.4 | 5.38 | 5.45 | 3.37 | 1.62 | 2.61 | 2.09 | 2.42 | 2.25 | 2.42 | 2.25 | 3.59 | 1.52 | 3.23 | 1.69 | |
| N-8-S-1 | 52.06 | 31935.4 | 425.81 | 0.013 | 456.4 | 5.38 | 9.13 | 3.37 | 2.71 | 2.61 | 3.50 | 2.42 | 3.77 | 2.42 | 3.77 | 3.71 | 2.46 | 3.63 | 2.52 | |
| N-8-S-2 | 52.06 | 31935.4 | 425.81 | 0.013 | 456.4 | 5.38 | 7.43 | 3.37 | 2.20 | 2.61 | 2.85 | 2.42 | 3.07 | 2.42 | 3.07 | 3.71 | 2.00 | 3.63 | 2.05 | |
| N-8-S-3 | 52.06 | 31935.4 | 425.81 | 0.013 | 456.4 | 5.38 | 7.71 | 3.37 | 2.29 | 2.61 | 2.96 | 2.42 | 3.19 | 2.42 | 3.19 | 3.71 | 2.08 | 3.63 | 2.13 | |
| Sand-lightweight concrete | ||||||||||||||||||||
| Shaw and Sneed (2014) | S-5-S-1 | 31.58 | 31935.4 | 425.81 | 0.013 | 456.4 | 5.38 | 5.36 | 3.37 | 1.59 | 2.22 | 2.42 | 2.06 | 2.61 | 2.06 | 2.61 | 3.52 | 1.52 | 3.06 | 1.75 |
| S-5-S-2 | 31.58 | 31935.4 | 425.81 | 0.013 | 456.4 | 5.38 | 4.75 | 3.37 | 1.41 | 2.22 | 2.14 | 2.06 | 2.31 | 2.06 | 2.31 | 3.52 | 1.35 | 3.06 | 1.55 | |
| S-5-S-3 | 31.58 | 31935.4 | 425.81 | 0.013 | 456.4 | 5.38 | 5.54 | 3.37 | 1.65 | 2.22 | 2.50 | 2.06 | 2.69 | 2.06 | 2.69 | 3.52 | 1.57 | 3.06 | 1.81 | |
| S-8-S-1 | 49.64 | 31935.4 | 425.81 | 0.013 | 456.4 | 5.38 | 9.34 | 3.37 | 2.77 | 2.22 | 4.21 | 2.06 | 4.54 | 2.06 | 4.54 | 3.63 | 2.57 | 3.43 | 2.73 | |
| S-8-S-2 | 49.64 | 31935.4 | 425.81 | 0.013 | 456.4 | 5.38 | 8.06 | 3.37 | 2.39 | 2.22 | 3.64 | 2.06 | 3.92 | 2.06 | 3.92 | 3.63 | 2.22 | 3.43 | 2.35 | |
| S-8-S-3 | 49.64 | 31935.4 | 425.81 | 0.013 | 456.4 | 5.38 | 8.20 | 3.37 | 2.43 | 2.22 | 3.70 | 2.06 | 3.99 | 2.06 | 3.99 | 3.63 | 2.26 | 3.43 | 2.39 | |
| Sneed et al. (2016) | S-SL-CJ-09-S-1 | 37.10 | 31935.4 | 283.87 | 0.009 | 497.8 | 3.72 | 3.75 | 2.48 | 1.51 | 1.58 | 2.37 | 1.42 | 2.63 | 1.42 | 2.63 | 2.56 | 1.46 | 2.25 | 1.67 |
| S-SL-CJ-09-S-2 | 37.10 | 31935.4 | 283.87 | 0.009 | 497.8 | 3.72 | 4.54 | 2.48 | 1.83 | 1.58 | 2.87 | 1.42 | 3.19 | 1.42 | 3.19 | 2.56 | 1.77 | 2.25 | 2.02 | |
| S-SL-CJ-13-S-1 | 38.41 | 31935.4 | 425.81 | 0.013 | 497.8 | 5.38 | 5.50 | 3.37 | 1.63 | 2.22 | 2.48 | 2.06 | 2.67 | 2.06 | 2.67 | 3.57 | 1.54 | 3.28 | 1.68 | |
| S-SL-CJ-13-S-2 | 38.41 | 31935.4 | 425.81 | 0.013 | 497.8 | 5.38 | 6.79 | 3.37 | 2.02 | 2.22 | 3.06 | 2.06 | 3.30 | 2.06 | 3.30 | 3.57 | 1.90 | 3.28 | 2.07 | |
| S-SL-CJ-17-S-1 | 34.13 | 31935.4 | 567.74 | 0.017 | 497.8 | 7.03 | 6.94 | 4.26 | 1.63 | 2.85 | 2.43 | 2.69 | 2.58 | 2.69 | 2.58 | 4.53 | 1.53 | 4.16 | 1.67 | |
| S-SL-CJ-17-S-2 | 34.13 | 31935.4 | 567.74 | 0.017 | 497.8 | 7.03 | 7.87 | 4.26 | 1.85 | 2.85 | 2.76 | 2.69 | 2.93 | 2.69 | 2.93 | 4.53 | 1.74 | 4.16 | 1.89 | |
| S-SL-CJ-22-S-1 | 34.48 | 31935.4 | 709.68 | 0.022 | 497.8 | 9.10 | 6.94 | 4.96 | 1.40 | 3.64 | 1.91 | 3.48 | 1.99 | 3.48 | 1.99 | 5.78 | 1.20 | 5.13 | 1.35 | |
| S-SL-CJ-22-S-2 | 34.48 | 31935.4 | 709.68 | 0.022 | 497.8 | 9.10 | 7.87 | 4.96 | 1.59 | 3.64 | 2.16 | 3.48 | 2.26 | 3.48 | 2.26 | 5.78 | 1.36 | 5.13 | 1.54 | |
| S-CL-CJ-9-S-1 | 32.89 | 31935.4 | 283.87 | 0.009 | 497.8 | 3.72 | 4.44 | 2.48 | 1.79 | 1.58 | 2.80 | 1.42 | 3.12 | 1.42 | 3.12 | 2.54 | 1.75 | 2.18 | 2.03 | |
| S-CL-CJ-9-S-2 | 32.89 | 31935.4 | 283.87 | 0.009 | 497.8 | 3.72 | 5.28 | 2.48 | 2.13 | 1.58 | 3.34 | 1.42 | 3.71 | 1.42 | 3.71 | 2.54 | 2.08 | 2.18 | 2.42 | |
| S-CL-CJ-13-S-1 | 31.99 | 31935.4 | 425.81 | 0.013 | 497.8 | 5.38 | 5.71 | 3.37 | 1.69 | 2.22 | 2.58 | 2.06 | 2.78 | 2.06 | 2.78 | 3.53 | 1.62 | 3.13 | 1.82 | |
| S-CL-CJ-13-S-2 | 31.99 | 31935.4 | 425.81 | 0.013 | 497.8 | 5.38 | 5.63 | 3.37 | 1.67 | 2.22 | 2.54 | 2.06 | 2.74 | 2.06 | 2.74 | 3.53 | 1.60 | 3.13 | 1.80 | |
| S-CL-CJ-17-S-1 | 31.37 | 31935.4 | 567.74 | 0.017 | 497.8 | 7.03 | 6.01 | 4.26 | 1.41 | 2.85 | 2.11 | 2.69 | 2.23 | 2.69 | 2.23 | 4.52 | 1.33 | 4.08 | 1.47 | |
| S-CL-CJ-17-S-2 | 31.37 | 31935.4 | 567.74 | 0.017 | 497.8 | 7.03 | 6.81 | 4.26 | 1.60 | 2.85 | 2.39 | 2.69 | 2.53 | 2.69 | 2.53 | 4.52 | 1.51 | 4.08 | 1.67 | |
| All-lightweight concrete | ||||||||||||||||||||
| Shaw and Sneed (2014) | A-5-S-1 | 41.92 | 31935.4 | 425.81 | 0.013 | 456.4 | 5.38 | 5.78 | 3.37 | 1.71 | 1.96 | 2.95 | 1.82 | 3.18 | 1.82 | 3.18 | 3.59 | 1.61 | 3.28 | 1.76 |
| A-5-S-2 | 41.92 | 31935.4 | 425.81 | 0.013 | 456.4 | 5.38 | 5.58 | 3.37 | 1.66 | 1.96 | 2.86 | 1.82 | 3.08 | 1.82 | 3.08 | 3.59 | 1.56 | 3.28 | 1.70 | |
| A-5-S-3 | 41.92 | 31935.4 | 425.81 | 0.013 | 456.4 | 5.38 | 5.47 | 3.37 | 1.62 | 1.96 | 2.80 | 1.82 | 3.01 | 1.82 | 3.01 | 3.59 | 1.52 | 3.28 | 1.67 | |
| A-8-S-1 | 54.08 | 31935.4 | 425.81 | 0.013 | 456.4 | 5.38 | 6.42 | 3.37 | 1.91 | 1.96 | 3.28 | 1.82 | 3.54 | 1.82 | 3.54 | 3.64 | 1.76 | 3.50 | 1.83 | |
| A-8-S-2 | 54.08 | 31935.4 | 425.81 | 0.013 | 456.4 | 5.38 | 6.69 | 3.37 | 1.98 | 1.96 | 3.42 | 1.82 | 3.68 | 1.82 | 3.68 | 3.64 | 1.84 | 3.50 | 1.91 | |
| A-8-S-3 | 54.08 | 31935.4 | 425.81 | 0.013 | 456.4 | 5.38 | 7.21 | 3.37 | 2.14 | 1.96 | 3.68 | 1.82 | 3.97 | 1.82 | 3.97 | 3.64 | 1.98 | 3.50 | 2.06 | |
| Sneed et al. (2016) | A-SL-CJ-13-S-1 | 30.20 | 31935.4 | 425.81 | 0.013 | 497.8 | 5.38 | 5.27 | 3.37 | 1.56 | 1.96 | 2.69 | 1.82 | 2.90 | 1.82 | 2.90 | 3.52 | 1.50 | 3.09 | 1.71 |
| A-SL-CJ-13-S-2 | 30.20 | 31935.4 | 425.81 | 0.013 | 497.8 | 5.38 | 5.41 | 3.37 | 1.60 | 1.96 | 2.76 | 1.82 | 2.98 | 1.82 | 2.98 | 3.52 | 1.54 | 3.09 | 1.75 | |
| A-CL-CJ-13-S-1 | 30.75 | 31935.4 | 425.81 | 0.013 | 497.8 | 5.38 | 5.14 | 3.37 | 1.52 | 1.96 | 2.63 | 1.82 | 2.83 | 1.82 | 2.83 | 3.52 | 1.46 | 3.10 | 1.66 | |
| A-CL-CJ-13-S-2 | 30.75 | 31935.4 | 425.81 | 0.013 | 497.8 | 5.38 | 5.20 | 3.37 | 1.54 | 1.96 | 2.66 | 1.82 | 2.86 | 1.82 | 2.86 | 3.52 | 1.48 | 3.10 | 1.68 | |
| Average | 1.57 | 2.32 | 2.54 | 2.54 | 1.46 | 1.60 | ||||||||||||||
| Maximum | 2.84 | 4.21 | 5.34 | 5.34 | 2.57 | 2.73 | ||||||||||||||
| Minimum | 0.80 | 1.02 | 1.07 | 1.07 | 0.74 | 0.77 | ||||||||||||||
| STD | 0.54 | 0.89 | 0.99 | 0.99 | 0.50 | 0.52 | ||||||||||||||
| COV | 34.10 | 38.64 | 39.13 | 39.13 | 33.99 | 32.45 | ||||||||||||||
References
- Diep, H.T.; Jang, M.; Moon, J.; Choi, B.H. Numerical Analysis on Plastic Moment Capacity of Prefabricated Steel Girders with Injection Channel Connections. Int. J. Steel Struct. 2022, 22, 1722–1733. [Google Scholar] [CrossRef]
- Diep, H.T.; Moon, J.; Choi, B.H. Structural Performance of Prefabricated Composite Girders for Railway Bridges along with Girder-to-Deck Interface Connections for Mechanical Injection. Appl. Sci. 2023, 13, 6686. [Google Scholar] [CrossRef]
- Choi, B.H.; Diep, H.T.; Moon, J. Flexural Performance of Prefabricated Composite Girders along with Precast Deck-to-Girder Continuous Connections. Int. J. Steel Struct. 2023; submitted. [Google Scholar]
- Birkeland, P.W.; Birkeland, H.W. Connections in precast concrete construction. ACI J. Proc. 1966, 63, 345–368. [Google Scholar]
- Mattock, A.H.; Hawkins, N.M. Shear transfer in reinforced concrete–Recent research. PCI J. 1972, 17, 55–75. [Google Scholar] [CrossRef]
- Mattock, A.H. Cyclic shear transfer and type of interface. J. Struct. Div. 1981, 107, 1945–1964. [Google Scholar] [CrossRef]
- Mattock, A.H. Shear transfer in concrete having reinforcement at an angle to the shear plane–Shear in Reinforced Concrete. In ACI Special Publication SP-42, 17-42; ACI: Farmington Hills, MI, USA, 1974. [Google Scholar]
- Mattock, A.H.; Johal, L.; Chow, H.C. Shear Transfer in Reinforced Concrete with Moment or Tension Acting across the Shear Plane. PCI J. 1975, 20, 76–93. [Google Scholar] [CrossRef]
- Mattock, A.H. Shear Transfer under Monotonic Loading across an Interface between Concretes Cast at Different Times; Department of Civil Engineering Report SM 76-3; University of Washington: Seattle, WA, USA, 1976. [Google Scholar]
- Mattock, A.H.; Li, W.K.; Wang, T.C. Shear Transfer in Lightweight Reinforced Concrete. PCI J. 1976, 21, 20–39. [Google Scholar] [CrossRef]
- Randl, N. Investigations on Transfer of Forces between Old and New Concrete at Different Joint Roughness. Ph.D. Thesis, University of Innsbruck, Innsbruck, Austria, 1997. [Google Scholar]
- Valluvan, R.; Kreger, M.E.; Jirsa, J.O. Evaluation of ACI 318-95 shear-friction provisions. Struct. J. 1999, 96, 473–481. [Google Scholar]
- Zilch, K.; Reinecke, R. Capacity of shear joints between high-strength precast elements and normal-strength cast-in-place decks. In Proceedings of the 2000 PCI/FHWA/FIB International Symposium on High Performance Concrete Precast/Prestressed Concrete Institute Federal Highway Administration Federation Internationale du Beton, Orlando, FL, USA, 25–27 September 2000. [Google Scholar]
- Gohnert, M. Horizontal shear transfer across a roughened surface. Cem. Concr. Compos. 2003, 25, 379–385. [Google Scholar] [CrossRef]
- Santos, P.M.D.; Júlio, E.N.B.S. A state-of-the-art review on roughness quantification methods for concrete surfaces. Constr. Build. Mater. 2013, 38, 912–923. [Google Scholar] [CrossRef]
- ACI (American Concrete Institute) Committee 318. Building Code Requirements for Structural Concrete (ACI 318-19) and Commentary (ACI 318R-19); ACI: Farmington Hills, MI, USA, 2019. [Google Scholar]
- PCI Industry Handbook Committee. PCI Design Handbook: Precast and Prestressed Concrete. MNL-120, 7th ed.; PCI: Chicago, IL, USA, 2010. [Google Scholar]
- AASHTO (American Association of State Highway and Transportation Officials). AASHTO LRFD Bridge Design Specifications, 9th ed.; AASHTO: Washington, DC, USA, 2020. [Google Scholar]
- CSA (Canadian Standards Association). Canadian Highway Bridge Design Code (CAN/CSA-S6-06); CSA: Toronto, ON, Canada, USA, 2006. [Google Scholar]
- CEN (Comité Européen de Normalisation). Design of Concrete Structures. In Eurocode 2, Part 1.1: General Rules and Rules for Buildings; CEN: Brussels, Belgium, 2004. [Google Scholar]
- FIB (fédération internationale du béton). Model Code for Concrete Structures. In CEB-FIP Model Code; FIB: Lausanne, Switzerland, 2010. [Google Scholar]
- Hofbeck, J.A.; Ibrahim, I.O.; Mattock, A.H. Shear Transfer in Reinforced Concrete. ACI J. Proc. 1969, 66, 119–128. [Google Scholar]
- Hoff, G.C. High Strength Lightweight Aggregate Concrete for Arctic Applications-Part 3: Structural Parameters. In ACI Special Publication SP-136, 175–246; ACI: Farmington Hills, MI, USA, 1993. [Google Scholar]
- Kahn, L.F.; Mitchell, A.D. Shear Friction Tests with High-Strength Concrete. ACI Struct. J. 2002, 99, 98–103. [Google Scholar]
- Mansur, M.A.; Vinayagam, T.; Tan, K.H. Shear Transfer across a Crack in Reinforced HighStrength Concrete. J. Mater. Civ. Eng. 2008, 20, 294–302. [Google Scholar] [CrossRef]
- Aziz, R.J. Shear Capacity of Concrete Prisms with Interface Joints. J. Eng. 2010, 16, 5084–5097. [Google Scholar]
- Scott, J. Interface Shear Strength in Lightweight Concrete Bridge Girders. Master’s Thesis, Virginia Polytechnic Institute, Blacksburg, VA, USA, 2010. [Google Scholar]
- Harries, K.A.; Zeno, G.; Shahrooz, B. Toward an Improved Understanding of Shear-Friction Behavior. ACI Struct. J. 2012, 109, 835–844. [Google Scholar]
- Shaw, D.; Sneed, L.H. Interface Shear Transfer of Lightweight-Aggregate Concretes Cast at Different Times. PCI J. 2014, 59, 130–144. [Google Scholar] [CrossRef]
- Rahal, K.N.; Al-Khaleefi, A.L. Shear-Friction Behavior of Recycled and Natural Aggregate Concrete–An Experimental Investigation. ACI Struct. J. 2015, 112, 725–733. [Google Scholar] [CrossRef]
- Rahal, K.N.; Khaleefi, A.L.; Al-Sanee, A. An Experimental Investigation of Shear-Transfer Strength of Normal and High Strength Self Compacting Concrete. Eng. Struct. 2016, 109, 16–25. [Google Scholar] [CrossRef]
- Sneed, L.H.; Krc, K.; Wermager, S.; Meinheit, D. Interface Shear Transfer of Lightweight-Aggregate Concretes. PCI J. 2016, 61, 38–55. [Google Scholar] [CrossRef]
- Waseem, S.A.; Singh, B. Shear Transfer Strength of Normal and High-Strength Recycled Aggregate Concrete–An Experimental Investigation. Constr. Build. Mater. 2016, 125, 29–40. [Google Scholar] [CrossRef]
- Xiao, J.; Sun, C.; Lange, D.A. Effect of Joint Interface Conditions on Shear Transfer Behavior of Recycled Aggregate Concrete. Constr. Build. Mater. 2016, 105, 343–355. [Google Scholar] [CrossRef]
- Barbosa, A.R.; Trejo, D.; Nielson, D. Effect of High-Strength Reinforcement Steel on Shear Friction Behavior. J. Bridge Eng. 2017, 22, 04017038. [Google Scholar] [CrossRef]
- Ahmad, S.; Bhargava, P.; Chourasia, A. Shear Transfer Strength of Uncracked Interfaces: A Simple Analytical Model. Constr. Build. Mater. 2018, 192, 366–380. [Google Scholar] [CrossRef]
- Valikhani, A.; Jahromi, A.J.; Mantawy, I.M.; Azizinamini, A. Effect of Mechanical Connectors on Interface Shear Strength between Concrete Substrates and UHPC: Experimental and Numerical Studies and Proposed Design Equation. Constr. Build. Mater. 2021, 267, 120587. [Google Scholar] [CrossRef]
- Loov, R.E.; Patnaik, A.K. Horizontal Shear Strength of Composite Concrete Beams with a Rough Interface. PCI J. 1994, 39, 48–69. [Google Scholar] [CrossRef]


| Contact Surface Condition | μ | vn,max (MPa) |
|---|---|---|
| Concrete placed monolithically | 1.4λ | For normal-weight concrete (monolithic or roughened), least of For all other cases, lesser of |
| Concrete placed against hardened concrete that is clean and intentionally roughened to a full amplitude of approximately 6 mm | 1.0λ | |
| Concrete placed against hardened concrete that is clean and not intentionally roughened | 0.6λ | |
| Concrete anchored to as-rolled structural steel by headed studs or by reinforcing bars where all steel in contact with concrete is clean and free of paint | 0.7λ |
| Contact Surface Condition | μ | μe,max | vn,max (Psi) |
|---|---|---|---|
| Concrete placed monolithically | 1.4λ | 3.4 | 0.3λfc′ < 1000 |
| Concrete to hardened concrete, with roughened surface | 1.0λ | 2.9 | 0.25λfc′ < 1000 |
| Concrete placed against hardened concrete not intentionally roughened | 0.6λ | n/a | 0.2λfc′ < 800 |
| Concrete to steel | 0.7λ | n/a | 0.2λfc′ < 800 |
| Interface Type | c (MPa) | μ | K1 | K2 (MPa) |
|---|---|---|---|---|
| Concrete placed monolithically | ||||
| For normal-weight concrete | 2.8 | 1.4 | 0.25 | 10.3 |
| For lightweight concrete | 1.7 | 1 | 0.25 | 6.9 |
| Cast-in-place concrete slab on clean concrete girder surfaces, with surface roughened to an amplitude of 6 mm | ||||
| For normal-weight concrete | 1.9 | 1 | 0.3 | 12.4 |
| For lightweight concrete | 1.9 | 1 | 0.3 | 9 |
| Concrete placed against a clean concrete surface, with surface intentionally roughened to an amplitude of 6 mm | ||||
| For normal-weight concrete | 1.7 | 1 | 0.25 | 10.3 |
| For lightweight concrete | 1.7 | 1 | 0.25 | 6.9 |
| Concrete placed against a clean concrete surface, but not intentionally roughened | 0.52 | 0.6 | 0.2 | 5.5 |
| Concrete anchored to as-rolled structural steel by headed studs or by reinforcing bars where all steel in contact with concrete is clean and free of paint | 0.17 | 0.7 | 0.2 | 5.5 |
| Contact Surface Condition | c (MPa) | μ |
|---|---|---|
| Concrete placed monolithically | 1 | 1.4 |
| Concrete placed against a clean concrete surface, with surface intentionally roughened to an amplitude of 5 mm | 0.5 | 1 |
| Concrete placed against a clean concrete surface, but not intentionally roughened | 0.25 | 0.6 |
| Concrete anchored to as-rolled structural steel by headed studs or by reinforcing bars | 0 | 0.6 |
| Surface Roughness | c | μ |
|---|---|---|
| Very smooth | 0.025 to 0.1 | 0.5 |
| Smooth | 0.2 | 0.6 |
| Rough | 0.4 | 0.7 |
| Very rough | 0.5 | 0.9 |
| Surface Roughness | cr | k1 | k2 | βc | μ | |
|---|---|---|---|---|---|---|
| fck ≥ 20 | fck ≥ 35 | |||||
| Very rough Rt ≥ 3.0 mm | 0.2 | 0.5 | 0.9 | 0.5 | 0.8 | 1.0 |
| Rough Rt ≥ 1.5 mm | 0.1 | 0.5 | 0.9 | 0.5 | 0.7 | |
| Smooth | 0 | 0.5 | 1.1 | 0.4 | 0.6 | |
| Very smooth | 0 | 0 | 1.5 | 0.3 | 0.5 | |
| Researchers | Year | Interface Type | Concrete Type | Number of Specimens | fc′ (MPa) | ρfy (MPa) |
|---|---|---|---|---|---|---|
| Hofbeck et al. [22] | 1969 | M-U M-P | NW NW | 13 19 | 26.48 to 31.10 16.44 to 29.92 | 0.00 to 9.23 1.54 to 9.23 |
| Mattock et al. [8] | 1975 | M-U M-P | NW NW | 2 2 | 27.82 to 27.99 26.58 to 29.10 | 3.81 to 5.65 3.74 to 5.43 |
| Mattock [9] | 1976 | M-P J-R J-S | NW NW NW | 8 14 18 | 40.13 to 42.23 17.20 to 41.75 40.16 to 42.61 | 1.57 to 13.29 1.56 to 10.87 1.45 to 10.33 |
| Mattock et al. [10] | 1976 | M-U M-U M-U M-P M-P M-P | NW SLW ALW NW SLW ALW | 7 7 14 6 18 14 | 26.89 to 28.82 25.79 to 29.30 26.75 to 30.48 26.89 to 28.82 13.79 to 41.34 26.75 to 30.48 | 0.00 to 9.59 0.00 to 9.43 0.00 to 9.52 1.54 to 9.10 1.50 to 9.43 1.51 to 9.68 |
| Hoff [23] | 1993 | M-P | SLW | 18 | 57.16 to 75.98 | 1.94 to 3.94 |
| Kahn and Mitchell [24] | 2002 | M-U M-P J-R J-S | NW NW NW NW | 19 19 10 2 | 46.92 to 123.81 46.92 to 113.60 80.91 to 104.93 83.11 to 98.78 | 1.52 to 6.07 1.52 to 6.07 1.52 to 6.07 1.52 to 3.03 |
| Mansur et al. [25] | 2008 | M-P | NW | 19 | 40.20 to 106.40 | 1.68 to 10.83 |
| Aziz [26] | 2010 | M-U | NW | 4 | 24 | 0.00 to 3.22 |
| Scott [27] | 2010 | J-R J-R | NW SLW | 3 6 | 42.40 39.51 | 2.00 2.00 |
| Harries et al. [28] | 2012 | J-R | NW | 8 | 33.99 | 1.65 to 2.90 |
| Shaw and Sneed [29] | 2014 | J-R J-R J-R J-S J-S J-S | NW SLW ALW NW SLW ALW | 6 6 6 6 6 6 | 33.51 to 52.06 31.58 to 49.64 41.92 to 54.08 33.51 to 52.06 31.58 to 49.64 41.92 to 54.08 | 5.38 5.38 5.38 5.38 5.38 5.38 |
| Rahal and Al-Khaleefi [30] | 2015 | M-U | NW | 9 | 34.09 to 41.40 | 0.00 to 7.88 |
| Rahal et al. [31] | 2016 | M-U | NW | 15 | 34.96 to 81.20 | 0.93 to 7.88 |
| Sneed et al. [32] | 2016 | M-U M-U M-U M-P M-P M-P J-R J-R J-S J-S | NW SLW ALW NW SLW ALW SLW ALW SLW ALW | 2 2 2 2 2 2 12 4 14 4 | 33.37 32.89 32.41 33.37 32.89 32.41 31.99 to 38.41 30.20 to 30.75 31.37 to 38.41 30.20 to 30.75 | 5.38 5.38 5.38 5.38 5.38 5.38 3.72 to 9.10 5.38 3.72 to 9.10 5.38 |
| Waseem and Singh [33] | 2016 | M-U | NW | 48 | 30.24 to 73.60 | 0.00 to 5.28 |
| Xiao et al. [34] | 2016 | M-U | NW | 19 | 23.43 to 33.03 | 3.63 |
| Barbosa et al. [35] | 2017 | J-R | NW | 20 | 28.2 | 1.72 to 2.67 |
| Ahmad et al. [36] | 2018 | M-U | NW | 12 | 40 | 0.00 to 6.65 |
| Valikhani et al. [37] | 2021 | M-U | NW | 3 | 47 | 0.00 |
| Total | 1969 to 2021 | M-U, M-P, J-R, J-S | NW, SLW, ALW | 458 | 13.79 to 123.81 | 0 to 13.29 |
| Codes | Statistics | Monolithic Uncracked | Monolithic Precracked | Roughened | Smooth |
|---|---|---|---|---|---|
| AASHTO LRFD | Average Maximum Minimum STD COV (%) | 1.65 3.45 1.03 0.53 31.87 | 1.08 1.73 0.61 0.21 19.29 | 1.49 3.66 1.00 0.47 31.75 | 1.57 2.84 0.80 0.54 34.10 |
| CSA-S6 | Average Maximum Minimum STD COV (%) | 3.18 11.41 1.39 2.14 67.31 | 1.59 2.91 0.84 0.40 24.85 | 2.44 6.91 1.64 0.77 31.60 | 2.32 4.21 1.02 0.89 38.64 |
| PCI | Average Maximum Minimum STD COV (%) | 2.35 4.09 1.37 0.70 29.60 | 1.54 2.74 0.72 0.37 23.74 | 2.08 4.31 1.26 0.57 27.60 | 2.54 5.34 1.07 0.99 39.13 |
| ACI 318-19 | Average Maximum Minimum STD COV (%) | 2.94 8.86 1.70 1.28 43.39 | 1.86 3.42 1.13 0.42 22.49 | 2.86 9.18 1.80 1.03 35.99 | 2.54 5.34 1.07 0.99 39.13 |
| Eurocode 2 | Average Maximum Minimum STD COV (%) | n/a | n/a | 1.62 3.60 1.11 0.44 27.08 | 1.46 2.57 0.74 0.50 33.99 |
| Fib MC 2010 | Average Maximum Minimum STD COV (%) | n/a | n/a | 2.09 4.48 1.25 0.51 24.49 | 1.60 2.73 0.77 0.52 32.45 |
| Codes | AASHTO LRFD | CSA-S6 | PCI | ACI 318-19 | PROPOSAL |
|---|---|---|---|---|---|
| Average | 1.65 | 3.18 | 2.35 | 2.94 | 1.42 |
| Maximum | 3.45 | 11.41 | 4.09 | 8.86 | 2.32 |
| Minimum | 1.03 | 1.39 | 1.37 | 1.70 | 1.00 |
| STD | 0.53 | 2.14 | 0.70 | 1.28 | 0.27 |
| COV (%) | 31.87 | 67.31 | 29.60 | 43.39 | 18.87 |
Disclaimer/Publisher’s Note: The statements, opinions and data contained in all publications are solely those of the individual author(s) and contributor(s) and not of MDPI and/or the editor(s). MDPI and/or the editor(s) disclaim responsibility for any injury to people or property resulting from any ideas, methods, instructions or products referred to in the content. |
© 2023 by the authors. Licensee MDPI, Basel, Switzerland. This article is an open access article distributed under the terms and conditions of the Creative Commons Attribution (CC BY) license (https://creativecommons.org/licenses/by/4.0/).
Share and Cite
Diep, H.T.; Choi, B.H. Shear Transfer Resistance with Different Interface Conditions: Evaluation of Design Provisions and Proposed Equation. Appl. Sci. 2023, 13, 8203. https://doi.org/10.3390/app13148203
Diep HT, Choi BH. Shear Transfer Resistance with Different Interface Conditions: Evaluation of Design Provisions and Proposed Equation. Applied Sciences. 2023; 13(14):8203. https://doi.org/10.3390/app13148203
Chicago/Turabian StyleDiep, Hung Thanh, and Byung H. Choi. 2023. "Shear Transfer Resistance with Different Interface Conditions: Evaluation of Design Provisions and Proposed Equation" Applied Sciences 13, no. 14: 8203. https://doi.org/10.3390/app13148203
APA StyleDiep, H. T., & Choi, B. H. (2023). Shear Transfer Resistance with Different Interface Conditions: Evaluation of Design Provisions and Proposed Equation. Applied Sciences, 13(14), 8203. https://doi.org/10.3390/app13148203