Article

A High-Sensitivity Cesium Atomic Magnetometer Based on A Cesium Spectral Lamp

1
Aerospace Information Research Institute, Chinese Academy of Sciences, No.9 Dengzhuang South Road, Haidian District, Beijing 100094, China
2
School of Electronic, Electrical and Communication Engineering, University of the Chinese Academy of Sciences, Beijing 100049, China
3
Department of Physics, University of Basel, 4056 Basel, Switzerland
4
Beijing National Laboratory for Condensed Matter Physics, Institute of Physics, Chinese Academy of Sciences, No.8, 3rd South Street, Zhongguancun, Haidian District, Beijing 100190, China
5
School of Physical Sciences, University of Chinese Academy of Sciences, No.19(A) Yuquan Road, Shijingshan District, Beijing 100049, China
6
Songshan Lake Materials Laboratory, Dongguan 523808, China
*
Authors to whom correspondence should be addressed.
Appl. Sci. 2023, 13(14), 8225; https://doi.org/10.3390/app13148225
Submission received: 3 June 2023 / Revised: 5 July 2023 / Accepted: 13 July 2023 / Published: 15 July 2023

Abstract

:
Based on a low-noise cesium spectral lamp, a high-sensitivity self-oscillating cesium atomic magnetometer with a wide operating temperature range has been developed, solving problems with existing sensors such as a limited operating temperature range and difficult startup at low temperatures. The temperature feedback mechanism is used to make adjustments to any fluctuations in the cesium lamp’s excitation source in real time, improving the magnetometer’s stability and operating temperature range. Herein, the design and optimization of the cesium atomic magnetometer are presented, and a prototype of the magnetometer is described. The quantum limit sensitivity of the cesium atomic magnetometer is estimated by evaluating the intrinsic relaxation rate in the geomagnetic field. A test demonstrates that the cesium atomic magnetometer’s sensitivity in the geomagnetic background is around 140   f T / H z at 1 Hz at room temperature, and the operating temperature range is from −50 °C to 70 °C, surpassing most of the commercial products of its kind in terms of sensitivity and operating temperature range.

1. Introduction

Atomic magnetometers, which are based on the principles of Larmor precession of spin-polarized atomic vapor and optically detected magnetic resonance, are quantum precision measurement sensors for measuring weak magnetic fields [1]. In addition to various vibrant application fields such as magnetoencaphelography [2] and frontier fundamental physics [3,4], they are also regarded as the most sensitive scalar magnetometers for geomagnetic measurements [5,6]. They have some advantages such as high sensitivity for low-frequency fields, high absolute accuracy, high stability, and resistance to platform orientation effects. Currently, they serve as the primary sensors in scalar magnetic exploration systems for applications such as underwater target detection [7,8], unexploded ordnance detection [9], and airborne geological exploration [10]. In 1962, the first atomic magnetometer was developed by A. Bloom based on alkali metal elements using the optically detected magnetic resonance method [11]. Since then, atomic magnetometers exploiting numerous schemes have been the subject of extensive research and applications. In 2014, Geometrics Inc. launched a cesium optically pumped magnetometer (G-824A) with a sensitivity of   0.6   p T / H z and an operation temperature range of −30 °C to 50 °C [12]. In 2017, Quspin Inc. released a chip-scale atomic magnetometer (QTFM), based on a non-magnetic vertical-cavity surface-emitting laser (VCSEL) and micro-electromechanical system (MEMS) atomic vapor cell. It achieved a sensitivity of approximately 1   p T / H z and a power consumption below 3 W [13]. In 2020, a cesium atomic magnetometer with a sensitivity of 0.6   p T / H z   was also reported by Liu et al. [14]. The G-824A and QTFM represent two technological directions in the current development of atomic magnetometers for geomagnetic applications. The former aims for higher sensitivity to improve the detection capability of the sensor and its exploration system, while the latter focuses on low power-consumption and miniaturization to meet the application requirements of unmanned platform magnetic detection systems. Both directions have extensive application prospects in different scenarios. More recently, two types of atomic magnetometers exploiting new schemes have been demonstrated under the geomagnetic environment [15,16]. Conducting research on high-sensitivity atomic magnetometer technology and improving its engineering applicability are of significant importance in enhancing the detection capability of magnetic survey systems, especially in challenging environments [17,18].
In response to the temperature and sensitivity requirements for outdoor applications of geomagnetic surveys, a high-sensitivity self-oscillating cesium atomic magnetometer based on a cesium spectral lamp with a wide operating temperature range (−50 °C to 70 °C) is proposed and demonstrated in this paper. By introducing a temperature feedback mechanism, fluctuations in the excitation frequency and output power of the cesium lamp caused by temperature variations are substantially reduced, thereby resolving the issue of slow startup or the inability to operate at low temperatures. In respect of assessing the fundamental quantum limit sensitivity of the cesium magnetometer, the intrinsic relaxation rates in the Earth’s magnetic field are evaluated. Moreover, the optimized cell temperature and feedback magnetic field amplitude are selected to improve the magnetometer’s sensitivity. The design, simulation, and integration of the atomic magnetometer are conducted in this study, and the performance of the prototype is tested. The testing results indicate that the magnetometric sensitivity approaches 140   f T / H z at 1 Hz, a factor of ~1.5 above the photon-shot noise limit, confirming the technological advancement and applicability of this sensor for magnetic anomaly detection applications. Compared to the published work [12,14], the cesium atomic magnetometer could have a wider operating temperature range and a higher sensitivity.

2. Design and Construction of Cesium Atomic Magnetometer

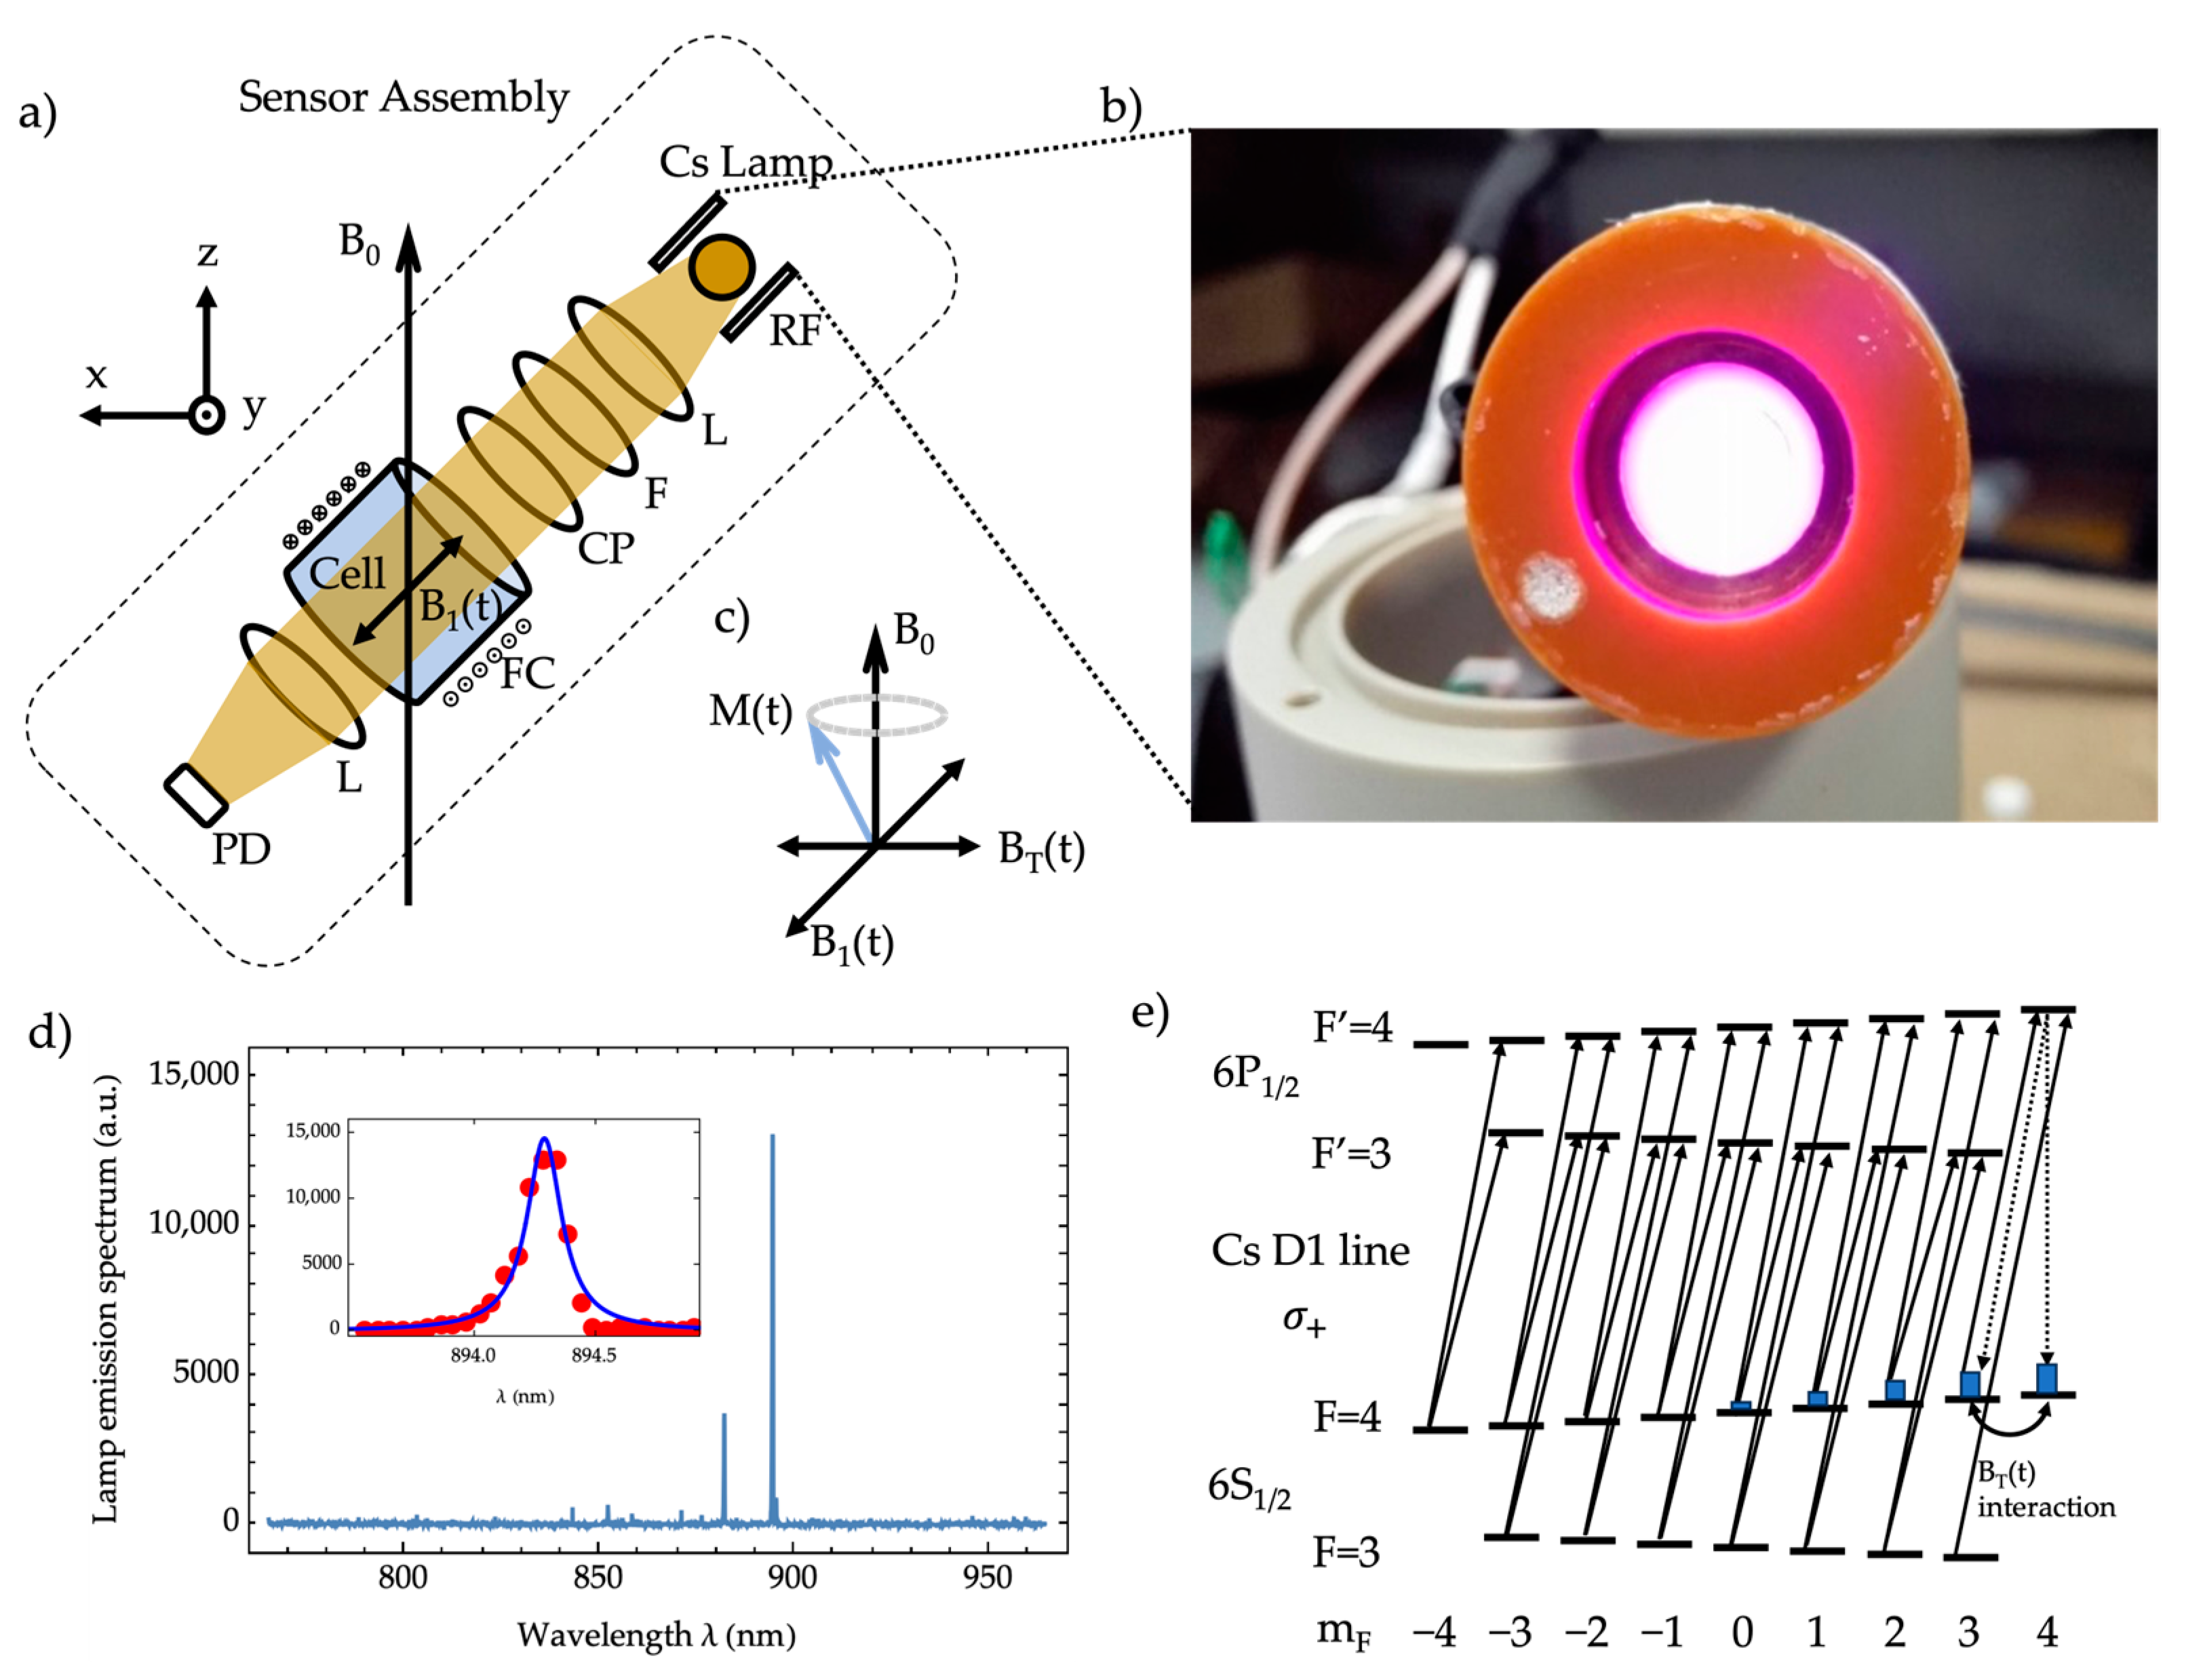
2.1. Sensor Assembly

As depicted in Figure 1a, the sensor assembly mainly consists of the following modules: the cesium spectral lamp (Figure 1b), optical components, an absorption vapor cell containing 133Cs atomic vapor and buffer gas, and a photodetector (PD). Figure 1c illustrates the working principle of the M x -type cesium atomic magnetometer [5]. The light emitted by the cesium spectral lamp is collimated, filtered, and polarized to form a circularly polarized light beam. The main spectral line after the filter is the Cs D1 line (Figure 1d). It polarizes the cesium atomic ensemble in the absorption vapor cell along the light propagation direction by optical pumping, resulting in a macroscopic polarization vector of cesium atomic magnetic moments ( M 0 ). As shown in Figure 1e, the circularly polarized light from the lamp can pump both hyperfine energy levels of the ground-state Cs atoms, thanks to the broad linewidth of the main emission line of the lamp. In the presence of an external magnetic field B 0 that is not parallel to the light propagation direction, the macroscopic polarization vector M ( t ) precesses along the direction of B 0 at the Larmor frequency ω L = γ C s B 0 , where γ C s = 2 π × 3.5   H z / n T is the gyromagnetic ratio of 133Cs. At this point, if a transverse oscillating magnetic field B T ( t ) is applied perpendicular to the direction of B 0 , changing the frequency of the transverse field across the Larmor frequency will alter the magnitude and precession process of the polarization vector in the steady state. In the meantime, the precessing atomic polarization vector alternates the absorption coefficient of the atomic vapor at the transverse field oscillating frequency, thus modulating the output light at the same frequency. When the transverse field oscillating frequency matches the Larmor frequency, the modulated absorption coefficient reaches a minimum (“magnetic resonance”), resulting in a maximum amplitude of the modulated light signal, which can be detected by the photodetector. The whole process is called optically detected magnetic resonance. By adjusting the oscillating frequency of B T ( t ) through a feedback loop, the magnetic resonance condition can be maintained and the Larmor frequency can be tracked continuously, as well as the external magnetic field of interest ( B 0 50   μ T for the Earth’s magnetic field). Choosing the direction of B 0 as the quantization axis ( z -axis), the optical Larmor signal is essentially due to the oscillating x -axis component of the macroscopic vector ( M x ( t ) ); therefore, this atomic magnetometer is conventionally called M x -type magnetometer. The transverse magnetic field ( B T ( t ) ) is the component of the feedback magnetic field ( B 1 ( t ) ) along the x -axis, which is generated by the feedback coil and along the light beam direction in the current configuration [11].

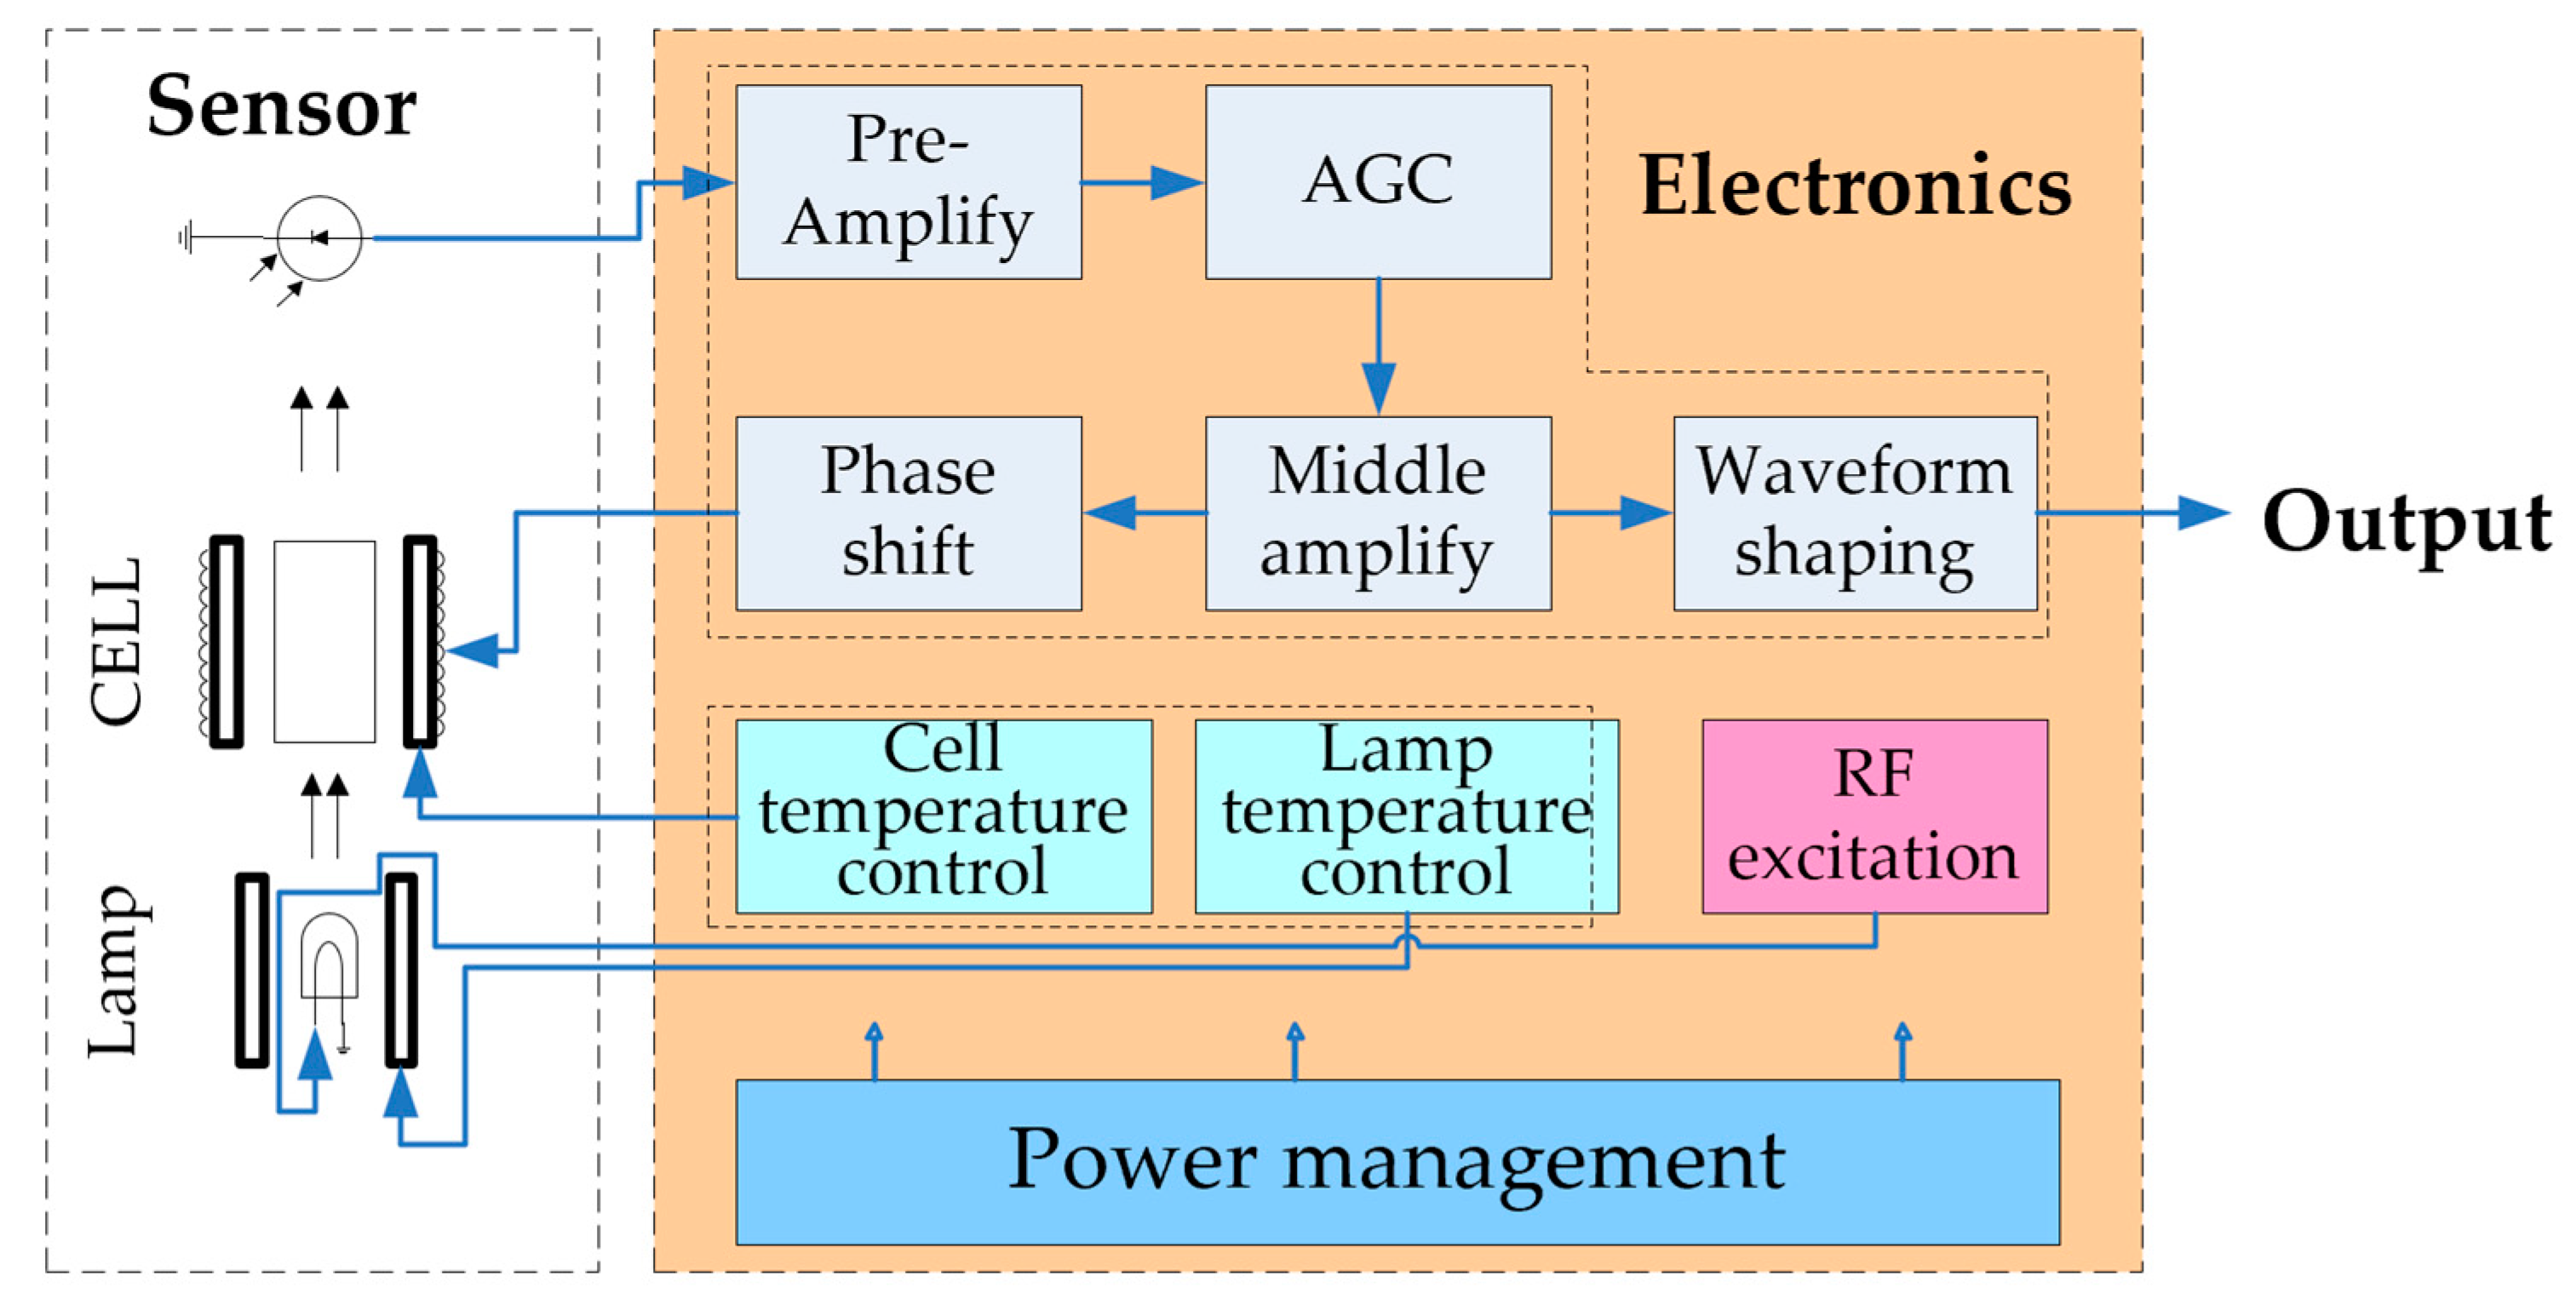
2.2. Electronic Unit

The electronic unit components provide various functions for the sensor including temperature control, lamp RF excitation, and signal processing. They also transmit the Larmor frequency data to the frequency counting unit. The schematic diagram of the electronic unit is illustrated in Figure 2 and the details are described as follows.
(1) RF Excitation Circuit
The cesium spectrum lamp is excited by a ~170 MHz RF signal from a discrete RF excitation circuit module. The current commercial atomic magnetometers, especially those based on alkali metal vapor cells, have a limited working temperature range of approximately −20 °C to 60 °C. However, when the ambient temperature falls below −20 °C, the sensor exhibits slow startup or even fails to function properly. The fundamental reason for this issue is the inability of the light source to operate at low temperatures. To address the temperature adaptability problem, a temperature feedback mechanism is introduced to improve the stability of maintaining the output RF power, particularly under different temperature conditions. In the circuit design, a thermistor is incorporated, as shown in Figure 3, in parallel with the voltage-divider resistors that control the frequency of the voltage-controlled oscillator and the power of the power amplifier. By controlling the voltage across the thermistor, which is in parallel with the control resistors, the output frequency and output power can be dynamically adjusted to compensate for the temperature variations. This ensures the stability of the RF excitation circuit output under different temperature conditions. Through a coaxial connection, the exciting coil of the lamp is connected to the RF excitation module, and an LC parallel resonance is used to inject energy into the lamp cell.
(2) Temperature Control Circuit
The temperature control circuit consists of two modules, one for controlling the temperature of the cesium spectral lamp and the other for the cesium vapor cell. The design scheme for both modules is the same. To avoid interference with magnetic field measurements, an AC heating method is employed. An AC heating signal with a frequency of 10 kHz is generated by a signal generator and driven by an audio power amplifier to heat the four twisted wires inside the sensor. The temperature detection circuit is responsible for monitoring the heating temperature, and the temperature control circuit implements the PI control. It adjusts the output power of the audio power amplifier by changing the amplitude of the signal generator, thereby controlling the temperatures of the lamp and the cell separately to the setting points. It is important to note that no thermistor is utilized to measure the cell’s temperature directly, while the heating temperature is controlled using the electric bridge principle and the property that the resistance value of the heating wire changes with temperature.
(3) Signal Processing Circuit
To meet the requirements of motion platforms with a fast response speed, the self-oscillating magnetometer scheme is adopted in this work. The Larmor signal from the photodetector is firstly amplified by a preamplifier and then stabilized using automatic gain control (AGC) to maintain a constant amplitude. It is then further amplified in an intermediate stage before being fed into the feedback coil inside the sensor through a 90° phase shift circuit, generating the feedback magnetic field with the Larmor frequency. Self-oscillation is automatically achieved through a positive feedback process. Simultaneously, the intermediate stage output signal is shaped into a square wave through a comparator and fed into a frequency measurement module, resulting in the corresponding values of the external magnetic field. This self-oscillating technique ensures a rapid response and accurate measurement of the magnetic field while maintaining stability.

3. Evaluation of the Intrinsic Spin Relaxation and Magnetometer’s Fundamental Quantum Limit Sensitivity

The quantum spin projection noise of the involved cesium ensemble ultimately determines the sensitivity of the cesium magnetometer and can be calculated as a function of the atomic number and intrinsic transverse relaxation rate for a specific measurement duration [1]. Even though it has been widely evaluated in some modern magnetometer configurations (for example, spin-exchange-relaxation-free magnetometer and comagnetometer, etc.), there remains a lack of effort on this topic for conventional Mx magnetometers working in geomagnetic applications. Moreover, to properly analyze and quantify various intrinsic spin relaxation processes is always the first step for the implementation of an atomic magnetometer. Because the working conditions of each sensor and the specific application characteristics of magnetometers are different, the intrinsic spin relaxation process needs to be specifically analyzed [19,20]. In this work, Helium-4 (He) is used as the buffer gas to localize the cesium atoms, and the dimension of the cylindrical cell is Φ25 mm × L 25 mm (Φ is the diameter of the bottom surface and L is the length). We briefly calculate the total intrinsic relaxation rate of the cesium vapor over a practical parameter space (cell heating temperature range: 30–70 ; He pressure range: 20 Torr to 200 Torr), considering all types of spin relaxation processes. A separate experimental measurement is performed to verify the calculation. Moreover, for Earth magnetic field measurement, the quadratic Zeeman effect of cesium vapor is found to be the main broadening mechanism over the current cell parameter range and used to estimate the quantum limit sensitivity.
First of all, the intrinsic spin depolarization rate (longitudinal relaxation rate) can be described as follows [21],
Γ 1 = 1 T 1 = 1 q R C s H e S D + R C s C s S D + R C s w a l l
where R C s H e S D , R C s C s S D , and R C s w a l l are electron spin-destruction rates due to collisions between Cs and He, between Cs atoms and the wall collisions, and q is the nuclear slowing-down factor, accounting for the remaining nuclear spin polarizations after collisions [21].
The Cs-He electron spin-destruction rate (or electron randomization rate) is typically much smaller than the normal collision rate between Cs and He. Thus, the spins of the cesium can be preserved during the multiple normal collisions with He and the movement of cesium atoms towards cell walls slows down dramatically. The very few electron randomization collisions can be characterized by an electron spin-destruction collision cross-section σ C s H e S D = 2.43 × 10 23 c m 2 [22] and calculated as
R C s H e S D = n H e σ C s H e S D v ¯ C s H e r e l
where n H e is the number density of He and v ¯ C s H e r e l is the relative velocity between Cs and He.
Similarly, the Cs-Cs spin destruction rate between Cs-Cs collisions can be modeled and characterized as
R C s C s S D = n C s σ C s C s S D v ¯ C s C s r e l  
where n C s is the number density of Cs, v ¯ C s C s r e l is the relative velocity between Cs atoms, and σ C s C s S D = 2.03 × 10 16 c m 2 [23] is the spin-destruction collision cross-section.
The wall collision rate of Cs atoms during the diffusive motion in the He buffer gas is approximately given by
R C s w a l l = 2.405 r 2 + π L 2 D
where the diffusion coefficient D is calculated via the same quantity D 0 = 0.27   c m 2 / s [24] at P 0 = 1   a t m and T 0 = 0   ,
D = D 0 P 0 P T T 0 3 2
P is the He pressure scaled to T 0 and T is the cell working temperature.
The nuclear slowing-down factor q 22 is estimated considering small spin polarizations [21] in typical conditions of the current work. It describes the fact that the Cs-He and Cs-Cs electron randomization collisions don’t fully destroy the nuclear spin polarization; thus, the total atomic spins cannot be fully randomized. The wall collisions can destroy the total atomic spins. The intrinsic longitudinal relaxation is shown in the Figure 4.
The magnetometer is based on the Larmor precession of the transverse component of the total polarization vector of the atomic ensemble. The intrinsic transverse relaxation rate ( Γ 2 ) refers to the physical processes that affect the decay of the transverse component of the total polarization vector, taking into account other factors in addition to the intrinsic longitudinal relaxation rate. Assuming a homogeneous magnetic field, Γ 2 is primarily influenced by electron spin-exchange collision relaxations between cesium atoms,
Γ 2 = 1 T 2 = 1 T 1 + 1 q S E R C s C s S E
where 1 q S E 0.22 is the estimated spin broadening coefficient under a given external magnetic field when ω L R C s C s S E [21]. The spin exchange collision rate is
R C s C s S E = n C s σ C s C s S E v ¯ C s C s r e l
where σ C s C s S E = 2.18 × 10 14   c m 2 [25] is the spin-exchange collision cross-section. Note that the maximum spin exchange rate in the given temperature range is approximately R C s C s S E 2 π × 247   H z , which is much smaller than the Larmor frequency over the whole work.
Taking into account all the processes above, the intrinsic transverse relaxation rate was solved for different temperatures and buffer gas pressures, as shown in Figure 5a. To measure the intrinsic transverse relaxation of our cesium vapor cell with 60 Torr buffer gas at 46 cell temperature, we used the free induction decay method (FID) [26] to obtain Γ 2 / ( 2 π ) values for various light powers and extrapolate to zero light power (no optical power broadening). The result is shown in Figure 5b. Note that the experiment was performed under B 0 = 1   μ T ; thus, the condition ω L R C s C s S E was well satisfied. From the plot we can see that the fitted Γ 2,0 / ( 2 π ) = 13.15 ± 4.8   H z , matching the calculated value on the left plot.
As for Cs magnetometers operating in the Earth’s magnetic field, the quadratic Zeeman effect should be considered [27]. In an external magnetic field of 50 µT, the cesium atoms in the F4 level exhibit eight equidistant Zeeman sublevels, with a spacing of
ϵ B 2 = 2.6716 n H z n T 2 50000 n T 2 = 6.7   H z
Obviously, within the given parameter range, the intrinsic transverse relaxation rates are comparable with the quadratic Zeeman broadenings ( 8 ϵ B 2 = 53.6   H z ). We define the “total intrinsic transverse relaxation rate” in the Earth’s magnetic field as
Γ 2 t o t = 1 T 2 t o t = Γ 2 + 8 × 2 π ϵ B 2
The theoretical quantum limit of the sensitivity for a magnetometer is derived from the uncertainty principle that governs the measurement process [1]. It is also known as the atomic spin projection noise (SPN), and the formula is given by:
δ B S P N = 1 γ C s 1 N C s v a p o r T 2 t o t Δ t
where Δ t = 0.5   s is the measurement time to achieve the magnetometer sensitivity with a bandwidth of 1 Hz, and N C s v a p o r is the total cesium atomic number within the volume of an effective cylinder of ϕ22 mm × L 25 mm, where ϕ22 mm is the diameter of the collimated beam from the lamp.
As can be seen from Figure 6, the quantum limit sensitivity due to atomic spin projection noise when considering the quadratic Zeeman effect is generally at the level of 1   f T / H z .

4. Optimization Processes for Improving the Magnetometer’s Sensitivity

4.1. Factors Affecting Magnetometer’s Sensitivity

Practically speaking, the magnetometer’s sensitivity is defined as the minimum change in the magnetic field that can be measured by the magnetometer system. For an open-loop M x -type atomic magnetometers, the sensitivity δ B can be estimated using the following expression [28]:
δ B = 2 π γ C s Δ ν S / N
where Δ ν represents the magnetic resonance linewidth (half width at half maximum), S denotes the amplitude of the oscillating signal, and N represents the noise spectral density. It can be seen from Formula (11) that there are three routines to improve atomic sensitivity:
(1) Reducing the magnetic resonance linewidth ( Δ ν ): The magnetic resonance linewidth is fundamentally determined by the intrinsic transverse relaxation rate that was discussed in the last section ( Γ 2 t o t ), which increases with the temperature due to the spin-exchange collision effect. During the operation of the M x -type magnetometer, the operating linewidth is additionally broadened by the finite optical power and feedback magnetic field amplitude. The former can be understood in terms of the pumping process due to the continuous-wave (cw) pump/probe beam, which acts like a decay term on both longitudinal and transverse atomic polarization, thus leading to a larger relaxation rate until saturation. The latter is considered as the feedback magnetic field broadening effect for a typical radio-optical spectroscopy experiment [6]. Since these two factors are inevitable and monotonically increase the linewidth, one should consider other processes to determine the optimal parameters for the light power and feedback magnetic field.
(2) Increasing the amplitude of the Larmor signal: The signal amplitude at the Larmor frequency is perhaps the most complicated variable that depends on nearly all of the factors involved, including (a) cell temperature: a higher temperature results in more vapor phase atoms and a stronger signal, but also larger spin-exchange broadening, which reduces the signal amplitude; (b) buffer gas pressure: a larger buffer gas pressure results in larger collisional broadening, which decreases the initial on-resonant optical depth, thereby reducing the signal amplitude, and also introduces more buffer gas collisional relaxation (although in the current range it is not significant, see Figure 5), whereas a smaller buffer gas pressure causes the atomic vapor to experience more wall collisions, thereby also reducing the signal; (c) light power: larger light power generally produces a larger optical depth change, leading to a large signal amplitude until saturation occurs, while the entire pumping process is also not trivial to model [29]; (d) feedback magnetic field: a larger feedback magnetic field initially increases the signal amplitude, while feedback magnetic field saturation happens later [30].
(3) Reducing system noise: There are two sources of system noise: the first type is the photon shot noise of the optical source, and the other type comprises all kinds of technical noise, including fluctuations of the light power/frequency from the lamp, photodetector dark current noise, feedback resistor thermal noise, amplifier voltage-current noise, etc. The photon shot noise of the cesium spectral lamp is proportional to the amplitude of the DC optical current, which increases monotonically with the input light power until saturation. The other factors mentioned in (2) above generally do not influence the noise floor, except for technical imperfections like the fluctuations in the feedback magnetic field amplitude, as well as thermal noise when increasing the environmental temperature.

4.2. Optimization of Cesium Spectral Lamp

According to the characteristics of extreme temperature in winter and summer over China [31], the minimum and maximum surface temperatures are roughly −50 °C and 55 °C, respectively. Thus, the range −50 °C to 70 °C was chosen for investigating the cesium magnetometer’s performance, which could cover the operating temperature range of outdoor applications. Current commercial atomic magnetometers have a common problem that prevents them from working properly: when the ambient temperature is below −20 °C, the cesium lamp does not ignite due to the low output power of the RF excitation source and the low density of cesium atoms inside the lamp bulb. In this study, a temperature feedback mechanism was introduced to improve the stability of the cesium spectral lamp output. The improved prototype of the cesium spectral lamp is shown in Figure 1. The fluctuations in the RF excitation frequency, RF output power, and optical output power of the optimized cesium spectrum lamp are shown in Figure 7, Figure 8 and Figure 9, respectively, before and after the improvement. Prior to the improvement, as the ambient temperature changed from −50 °C to +70 °C, the output power increased but the RF excitation frequency declined. When the temperature fell below −20 °C, the cesium spectral lamp’s optical output power was less than 2 mW, resulting in insufficient pump light from the cesium D1 line [32] for the sensor to function. The RF frequency and power variation patterns with temperature are in agreement with the nominal specifications of voltage-controlled oscillators and power amplifiers. When the temperature deviates from room temperature, detuning between the RF excitation source and the cesium lamp occurs, which ultimately results in a reduction in output optical power. After the improvement, the fluctuations in RF excitation frequency and output power significantly decreased as the ambient temperature changed from −50 °C to +70 °C, and the optical output power remained steady at 3 mW or higher. Because the improved RF excitation circuit, as depicted in Figure 4, includes a temperature feedback mechanism, the resistance value of the thermistor varies with temperature, which affects the voltage division of the voltage-controlled oscillator and power amplifier. The change in voltage division alters the frequency and power of the RF excitation, and its change trend is opposite to the effect of temperature on frequency and power; in other words, the thermistor functions as negative feedback to the temperature effect. Thus, the frequency and power stability of RF excitation could be improved, thereby enhancing the stability of the output power of cesium lamps. The fractional fluctuation was used to evaluate the stability of the Cs lamp; this is defined as standard deviation/mean value ×100%. Table 1 compares each output parameter’s fractional fluctuations before and after the improvement. Within the designated operating temperature range of −50 °C to +70 °C, the fractional fluctuations of the RF excitation frequency increased from 0.80% to 0.07%, the RF output power improved from 61.97% to 2.05%, and the optical output power improved from 42.92% to 14.68% These enhancements indicate a substantial improvement in the output performance of the cesium spectral lamp, which promises a more rigid and stable operational status when confronting a variety of unpredictable geomagnetic survey scenarios.
In addition, we show the measured noise floor of the detected signal (with the optimal optical power) near the Larmor frequency in Figure 10, which is primarily dominated by the photon shot noise of the output optical power from the cesium spectral lamp constructed in this study. A commercial spectrum analyzer (HF2LI) was used and the resolution bandwidth was set to 1 Hz, where the Larmor signal value was distorted in this mode. N 90   n V / H z is the system noise floor and is used to estimate the magnetometer’s sensitivity in the last section. The photon shot-noise level around the Larmor frequency was estimated to be N s n 76   n V / H z according to the DC photon current and feedback circuits. The reason that the system noise floor is slightly higher than the photon shot-noise level could be the power fluctuations of the lamp light, and the possibly associated frequency jump due to the light shift effect, which is similar to the case in atomic clocks [33].

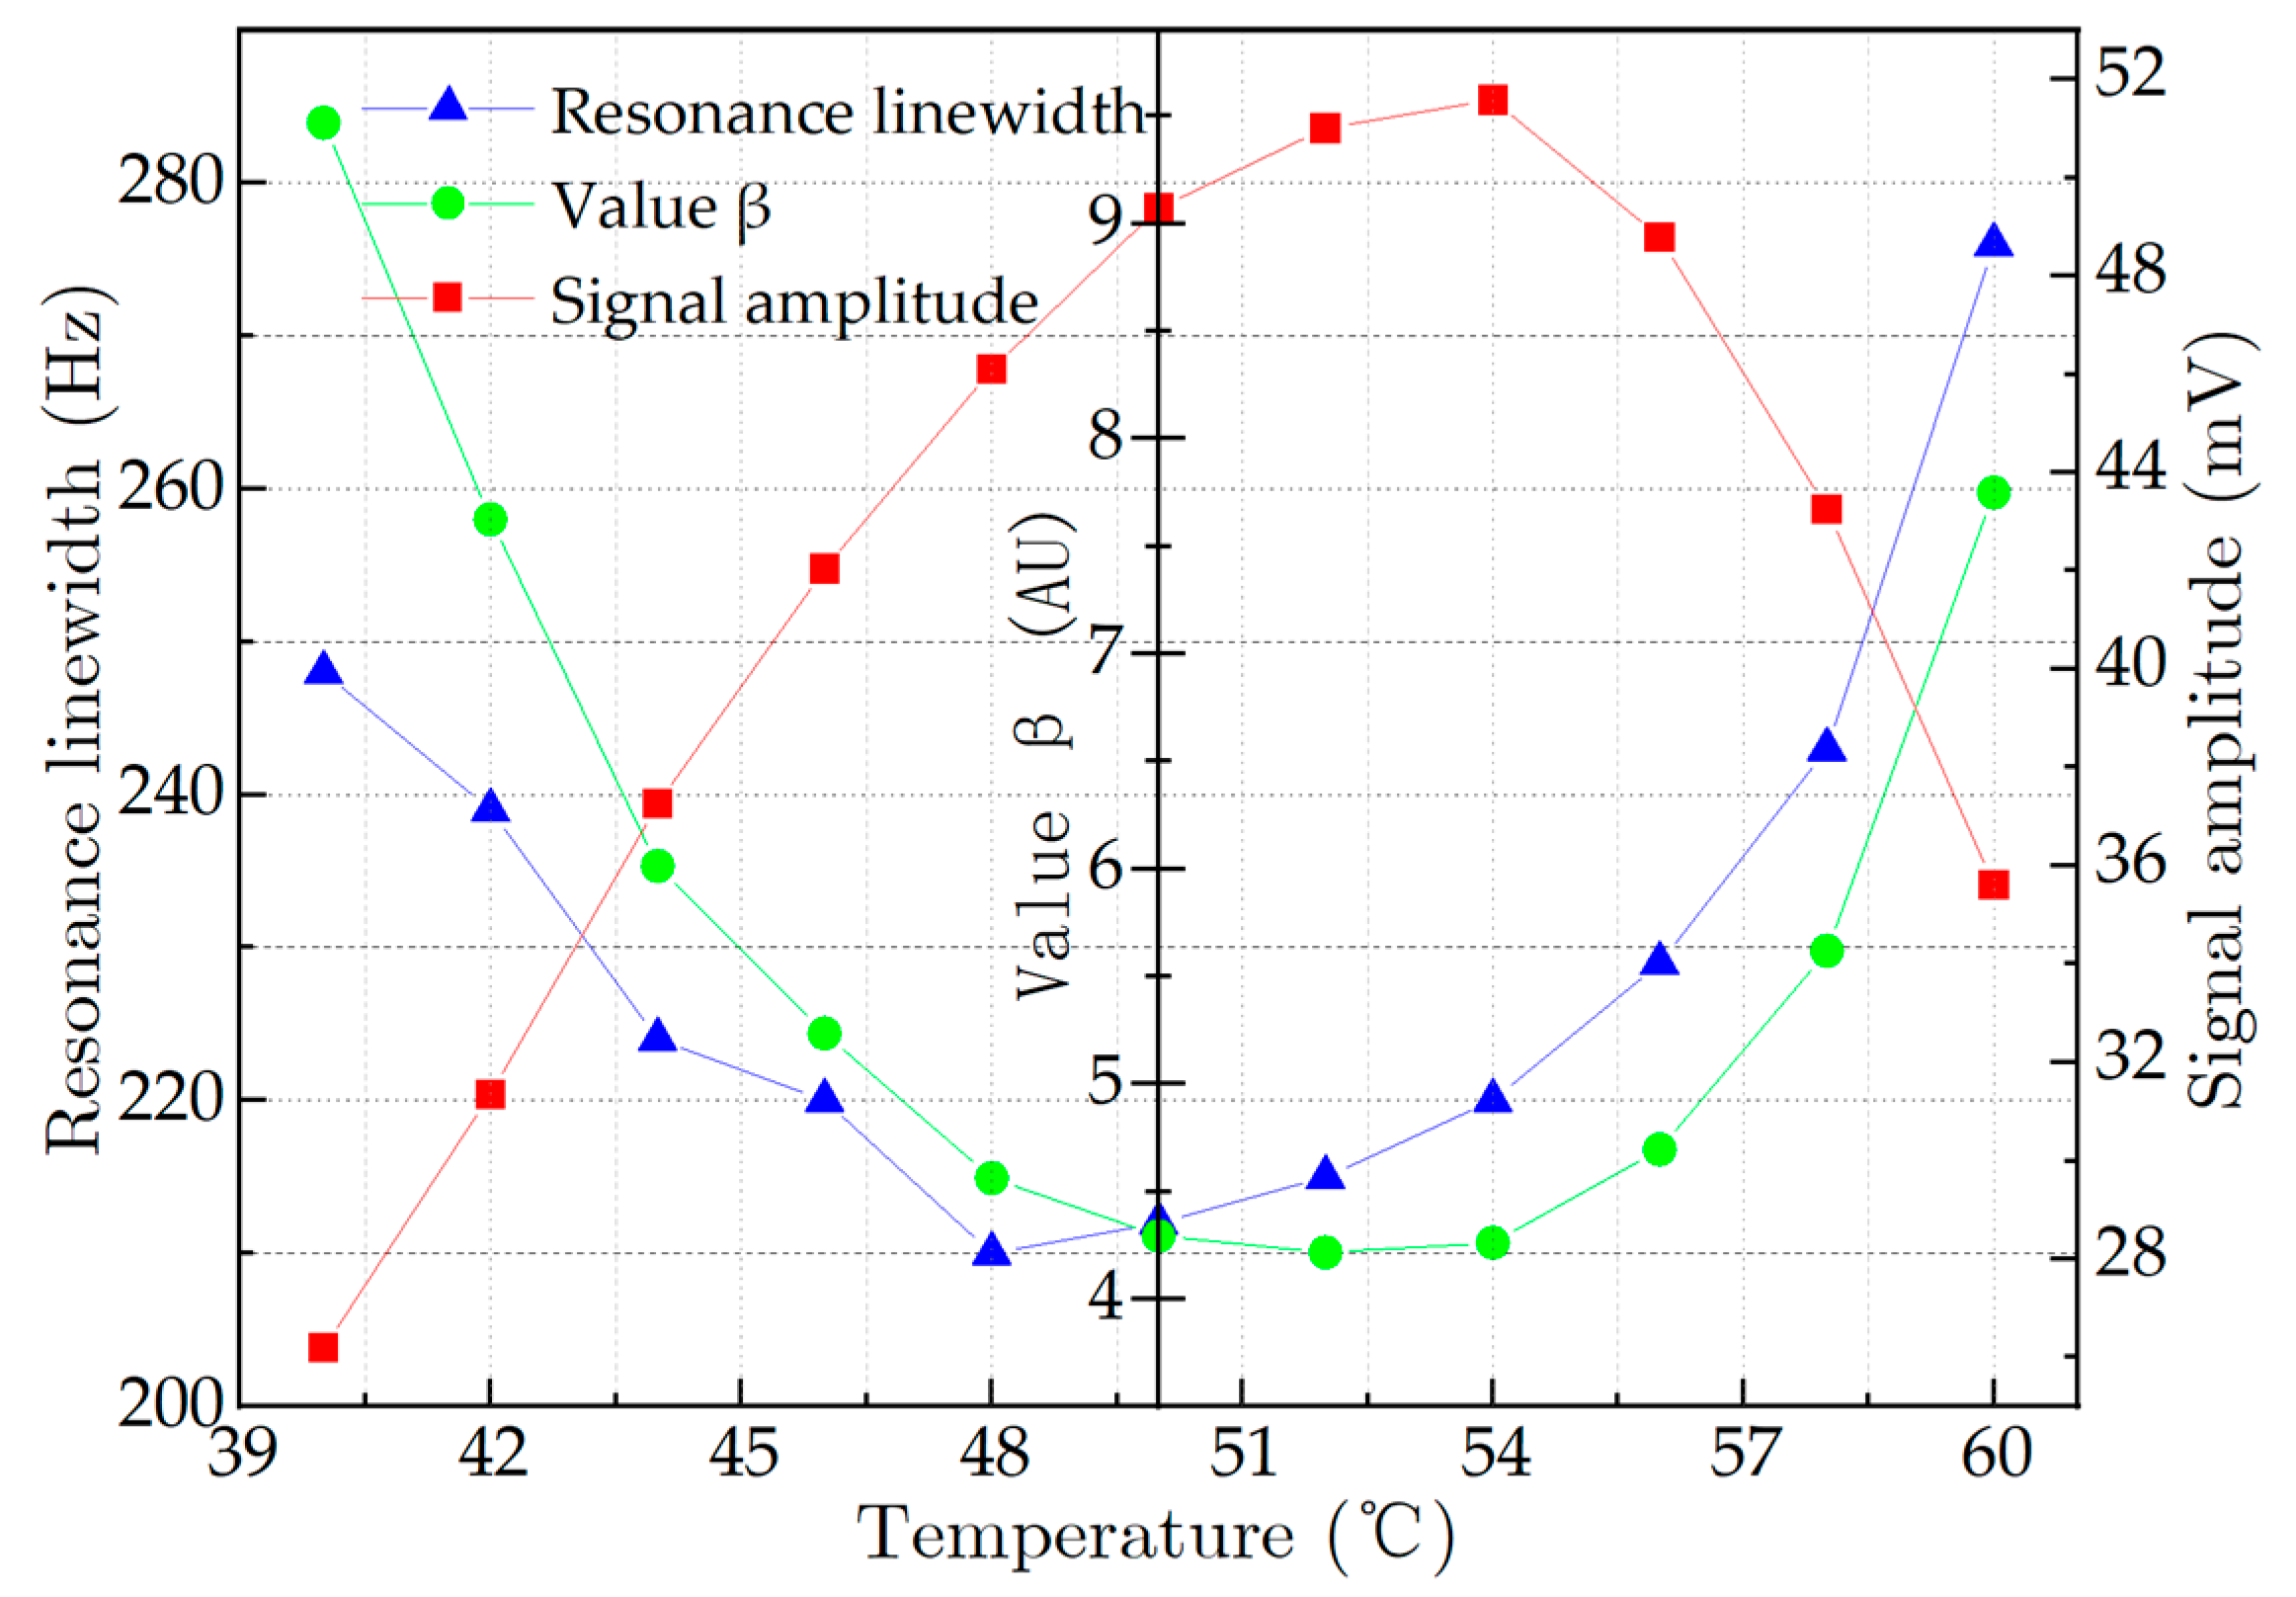
4.3. Optimization of Magnetic Resonance Linewidth and Signal Amplitude

Optimization of the sensor operating parameters was conducted in order to improve the sensitivity of the atomic magnetometer, with a focus on the impact of the input optical power, feedback magnetic field strength, and cell heating temperature. In fact, the tuning range of the output optical power from the cesium spectral lamp is relatively narrow when investigating the variations in magnetic resonance linewidth and signal amplitude. Moreover, based on a separate check, attenuating the optical power before the vapor cell deteriorates the sensitivity performance for all temperatures and feedback magnetic field strengths. Thus, we set the output power of the lamp after the improvement as the optimal optical power, a parameter that remained constant throughout the subsequent optimization process.
Considering that the effect of the operating temperature on the magnetic resonance linewidth and signal amplitude is in opposite directions, let β = Δ ν / S , where Δ ν represents the magnetic resonance linewidth and S represents the signal amplitude. The magnitude of β was used in this study to assess the sensitivity of the cesium atomic magnetometers. A greater β value implies that the sensor is less sensitive, while a smaller value suggests that the sensor is more sensitive.
As shown in Figure 11, the relationships between the magnetic resonance linewidth, signal amplitude, and β value with respect to the cell heating temperature are presented with a constant feedback magnetic field of roughly 13 nT. Within the temperature scanning range, all three parameters exhibit optimal values. However, the optimal operating points are not the same. The magnetic resonance linewidth reaches its optimum value at approximately 48 °C, the signal amplitude achieves its optimum value at around 54 °C, while the β value has its optimal value at 52 °C. We thus conclude that the sensor achieves its optimal sensitivity at a temperature of 52 °C at the current feedback magnetic field, with a linewidth of 215 Hz and signal amplitude of 51.00 mV.
Figure 12 shows the variations in magnetic resonance linewidth, signal amplitude, and β value of the atomic sensor under different feedback magnetic field amplitudes, while keeping the operating temperature constantly at 52 °C. It can be observed that both the magnetic resonance linewidth and signal amplitude increase with the increasing feedback magnetic field amplitude, as discussed in Section 4.1. In conclusion, the β value reaches its minimum when the feedback magnetic field amplitude is roughly 15.81 nT, and the sensor achieves its estimated optimal sensitivity of 100.3   f T / H z .

5. Magnetometer Testing

The sensitivity of the Cs atomic magnetometer prototype based on a Cesium spectral lamp was tested under B 0 = 50   μ T , generated from a uniform magnetic field generator (LC-CPBT-W7) inside a 6-layer magnetic shielding, as shown in Figure 13. The cell temperature and the feedback magnetic field were set as the optimized values as discussed above. Since the ambient magnetic noise was greater than the sensor’s intrinsic noise, a parallel measurement was conducted using two separate sensors to evaluate the intrinsic sensitivity of a single magnetometer. By performing autocorrelation processing, the environmental noise can be effectively subtracted, allowing the noise level evaluation of each sensor to be tested. The two sensor heads were placed in the uniform area of the magnetic field generator, and the electronic units were positioned outside of the shielding. The base line of the two sensor heads was 10 cm.
The test results are shown in Figure 14, where the red and blue lines represent the square root of the power spectral density (transit to magnetometric sensitivity) of Sensor 1 and Sensor 2, respectively. The black line represents the performance of a single sensor after autocorrelation processing between two sensors. It can be shown that the sensor’s working sensitivity is around 140   f T / H z at 1 Hz. This is higher by a factor of ~1.4 than the estimated performance using the measured system noise level. The reasons could be the gradient field fluctuations between the testing sensor heads, the noise of the frequency counting units, or imperfections during the autocorrelation calculation. The system-noise level determined sensitivity is only 10% higher than the shot-noise limited performance, revealing a high-level performance of the whole system, where the optical power fluctuations and other technical noise can nearly be neglected. Overall, the demonstrated sensitivity is higher than the photon-shot noise limited sensitivity by ~1.5. The quantum limit sensitivity is too far to reach and new working schemes are under development. The sensitivity performance against various buffer gas pressures is under investigation.

6. Conclusions

In response to the demand for geomagnetic measurements under challenging environments, a high-sensitivity cesium atomic magnetometer with a wide operating temperature range was developed in this study. The quantum limit sensitivity of the cesium atomic magnetometer was estimated by calculating the relaxation rate and quadratic Zeeman effect in detail. After improving the cesium lamp module, the output performance of the light source showed advanced stability and rigidness for operating temperatures of −50 °C to +70 °C. Under a background magnetic field of 50 μT at room temperature, the measured sensitivity of the cesium atomic magnetometer reached 140   f T / H z at 1 Hz in an optimized working condition, surpassing the performance of the current leading commercial product.

Author Contributions

Conceptualization, Y.-T.L., L.-S.L., W.-H.Z., W.-M.L. and X.-J.Z.; methodology, Y.-T.L. and Y.-Q.S.; formal analysis, T.-F.Z.; writing—original draft preparation, Y.-T.L.; writing—review and editing, Y.-Q.S., T.Z. and T.-F.Z.; supervision, X.-J.Z.; funding acquisition, W.-H.Z. All authors have read and agreed to the published version of the manuscript.

Funding

This research was funded by the National Key R&D Program of China, grant number 2021YFB3900202, 2021YFA1400900, 2021YFA0718300, and 2021YFA1402100, the NSFC under grant numbers 61835013, 12174461, and 12234012, and the Science and Disruptive Technology Research Pilot Fund of the Aerospace Information Research Institute, grant number E1Z21003.

Institutional Review Board Statement

Not applicable.

Informed Consent Statement

Not applicable.

Data Availability Statement

The data is unavailable due to privacy.

Acknowledgments

The authors acknowledge Antoine Weis, Zoran D. Grujić, and Victor Lebedev from the University of Fribourg in Switzerland for their insightful discussions and invaluable help in characterizing the cesium atomic vapor cell.

Conflicts of Interest

The authors declare no conflict of interest.

References

  1. Budker, D.; Romalis, M. Optical Magnetometry. Nat. Phys. 2007, 3, 227–234. [Google Scholar] [CrossRef] [Green Version]
  2. Boto, E.; Holmes, N.; Leggett, J.; Roberts, G.; Shah, V.; Meyer, S.S.; Muñoz, L.D.; Mullinger, K.J.; Tierney, T.M.; Bestmann, S.; et al. Moving Magnetoencephalography towards Real-World Applications with a Wearable System. Nature 2018, 555, 657–661. [Google Scholar] [CrossRef] [Green Version]
  3. Afach, S.; Budker, D.; DeCamp, G.; Dumont, V.; Grujić, Z.D.; Guo, H.; Kimball, D.F.J.; Kornack, T.W.; Lebedev, V.; Li, W.; et al. Characterization of the Global Network of Optical Magnetometers to Search for Exotic Physics (GNOME). Phys. Dark Universe 2018, 22, 162–180. [Google Scholar] [CrossRef]
  4. Abel, C.; Afach, S.; Ayres, N.J.; Baker, C.A.; Ban, G.; Bison, G.; Bodek, K.; Bondar, V.; Burghoff, M.; Chanel, E.; et al. Measurement of the Permanent Electric Dipole Moment of the Neutron. Phys. Rev. Lett. 2020, 124, 081803. [Google Scholar] [CrossRef] [Green Version]
  5. Alexandrov, E.B. Recent Progress in Optically Pumped Magnetometers. Phys. Scr. 2003, 2003, 27. [Google Scholar] [CrossRef]
  6. Aleksandrov, E.B.; Vershovskii, A.K. Modern Radio-Optical Methods in Quantum Magnetometry. Phys. Uspekhi 2009, 52, 573–601. [Google Scholar] [CrossRef] [Green Version]
  7. Feng, Y.; Zhang, Q.; Zheng, Y.; Qu, X.; Wu, F.; Fang, G. An Improved Aeromagnetic Compensation Method Robust to Geomagnetic Gradient. Appl. Sci. 2022, 12, 1490. [Google Scholar] [CrossRef]
  8. Chen, L.; Zhu, W.; Wu, P.; Fei, C.; Fang, G. Magnetic Anomaly Detection Algorithm Based on Fractal Features in Geomagnetic Background. J. Electron. Sci. Technol. 2019, 41, 332–340. [Google Scholar] [CrossRef]
  9. Zheng, Y.; Li, S.; Xing, K.; Zhang, X. A Novel Noise Reduction Method of UAV Magnetic Survey Data Based on CEEMDAN, Permutation Entropy, Correlation Coefficient and Wavelet Threshold Denoising. Entropy 2021, 23, 1309. [Google Scholar] [CrossRef]
  10. Mamouch, Y.; Attou, A.; Miftah, A.; Ouchchen, M.; Dadi, B.; Moussaid, A.; Et-tayea, Y.; El Azmi, M.; Boualoul, M. Aeromagnetic Data of the Kelâat M’Gouna Inlier (Jbel Saghro, Eastern Anti-Atlas, Morocco): Geotectonic and Mining Implications. J. Afr. Earth Sci. 2023, 197, 104744. [Google Scholar] [CrossRef]
  11. Bloom, A.L. Principles of Operation of the Rubidium Vapor Magnetometer. Appl. Opt. 1962, 1, 61–68. [Google Scholar] [CrossRef]
  12. Geometrics, Inc. G-824A Cesium Magnetometer Operation Manual. Available online: https://www.geometrics.com/wp-content/uploads/2018/10/824AManual_rev8.pdf (accessed on 30 June 2023).
  13. Quspin, Inc. QTFM. Available online: https://quspin.com/qtfm/ (accessed on 30 June 2023).
  14. Liu, L.; Lu, Y.; Zhuang, X.; Zhang, Q.; Fang, G. Noise Analysis in Pre-Amplifier Circuits Associated to Highly Sensitive Optically-Pumped Magnetometers for Geomagnetic Applications. Appl. Sci. 2020, 10, 7172. [Google Scholar] [CrossRef]
  15. Limes, M.E.; Foley, E.L.; Kornack, T.W.; Caliga, S.; McBride, S.; Braun, A.; Lee, W.; Lucivero, V.G.; Romalis, M.V. Portable Magnetometry for Detection of Biomagnetism in Ambient Environments. Phys. Rev. Appl. 2020, 14, 011002. [Google Scholar] [CrossRef]
  16. Oelsner, G.; IJsselsteijn, R.; Scholtes, T.; Krüger, A.; Schultze, V.; Seyffert, G.; Werner, G.; Jäger, M.; Chwala, A.; Stolz, R. Integrated Optically Pumped Magnetometer for Measurements within Earth’s Magnetic Field. Phys. Rev. Appl. 2022, 17, 024034. [Google Scholar] [CrossRef]
  17. Sutter, J.U.; Lewis, O.; Robinson, C.; McMahon, A.; Boyce, R.; Bragg, R.; Macrae, A.; Orton, J.; Shah, V.; Ingleby, S.J.; et al. Recording the Heart Beat of Cattle Using a Gradiometer System of Optically Pumped Magnetometers. Comput. Electron. Agric. 2020, 177, 105651. [Google Scholar] [CrossRef]
  18. Fu, K.-M.C.; Iwata, G.Z.; Wickenbrock, A.; Budker, D. Sensitive Magnetometry in Challenging Environments. AVS Quantum Sci. 2020, 2, 044702. [Google Scholar] [CrossRef]
  19. Liu, J.; Jing, D.-Y.; Wang, L.; Li, Y.; Quan, W.; Fang, J.; Liu, W.-M. The Polarization and the Fundamental Sensitivity of 39K (133Cs)-85Rb-4He Hybrid Optical Pumping Spin Exchange Relaxation Free Atomic Magnetometers. Sci. Rep. 2017, 7, 6776. [Google Scholar] [CrossRef] [Green Version]
  20. Liu, J.; Jing, D.-Y.; Zhuang, L.; Quan, W.; Fang, J.; Liu, W.-M. Polarization and Fundamental Sensitivity of 39K (133Cs)–85Rb–21Ne Co-Magnetometers. Chin. Phys. B 2020, 29, 043206. [Google Scholar] [CrossRef]
  21. Seltzer, S.J. Developments in Alkali-Metal Atomic Magnetometry. Ph.D. Thesis, Princeton University, Princeton, NJ, USA, 2008. [Google Scholar]
  22. Franz, F.A.; Sooriamoorthi, C.E. Spin relaxation within the 62P1/2 and 62S1/2 states of cesium measured by white-light optical pumping. Phys. Rev. A 1974, 10, 126–140. [Google Scholar] [CrossRef]
  23. Bhaskar, N.D.; Pietras, J.; Camparo, J.; Happer, W.; Liran, J. Spin Destruction in Collisions between Cesium Atoms. Phys. Rev. Lett. 1980, 44, 930–933. [Google Scholar] [CrossRef]
  24. Ishikawa, K.; Anraku, Y.; Takahashi, Y.; Yabuzaki, T. Optical Magnetic-Resonance Imaging of Laser-Polarized Cs Atoms. J. Opt. Soc. Am. B 1999, 16, 31–37. [Google Scholar] [CrossRef]
  25. Beverini, N.; Minguzzi, P.; Strumia, F. Foreign-Gas-Induced Cesium Hyperfine Relaxation. Phys. Rev. A 1971, 4, 550–555. [Google Scholar] [CrossRef]
  26. Grujić, Z.D.; Koss, P.A.; Bison, G.; Weis, A. A Sensitive and Accurate Atomic Magnetometer Based on Free Spin Precession. Eur. Phys. J. D 2015, 69, 135. [Google Scholar] [CrossRef]
  27. Groeger, S.; Pazgalev, A.S.; Weis, A. Comparison of Discharge Lamp and Laser Pumped Cesium Magnetometers. Appl. Phys. B 2005, 80, 645–654. [Google Scholar] [CrossRef] [Green Version]
  28. Jimenez-Martinez, R.; Griffith, W.C.; Wang, Y.-J.; Knappe, S.; Kitching, J.; Smith, K.; Prouty, M.D. Sensitivity Comparison of Mx and Frequency-Modulated Bell–Bloom Cs Magnetometers in a Microfabricated Cell. IEEE Trans. Instrum. Meas. 2010, 59, 372–378. [Google Scholar] [CrossRef]
  29. Shi, Y.; Scholtes, T.; Grujić, Z.D.; Lebedev, V.; Dolgovskiy, V.; Weis, A. Quantitative Study of Optical Pumping in the Presence of Spin-Exchange Relaxation. Phys. Rev. A 2018, 97, 013419. [Google Scholar] [CrossRef] [Green Version]
  30. Weis, A.; Bison, G.; Grujić, Z.D. Magnetic Resonance Based Atomic Magnetometers. In High Sensitivity Magnetometers; Grosz, A., Haji-Sheikh, M., Mukhopadhyay, S., Eds.; Smart Sensors, Measurement and Instrumentation Series; Springer: Cham, Switzerland, 2017; pp. 361–424. ISBN 978-3-319-34070-8. [Google Scholar] [CrossRef]
  31. Ren, C.; Duan, M.; Zhi, X. Characteristics of extreme surface air temperature in winter and summer over China under different climate backgrounds. Trans. Atmos. Sci. 2017, 40, 803–813. [Google Scholar]
  32. Steck, D.A. Cesium D Line Data. Available online: http://steck.us/alkalidata (accessed on 21 November 2019).
  33. Formichella, V.; Camparo, J.; Tavella, P. Mitigation of Lamplight-Induced Frequency Jumps in Space Rubidium Clocks. IEEE Trans. Ultrason. Ferroelectr. Freq. Control 2018, 65, 911–918. [Google Scholar] [CrossRef] [PubMed]
Figure 1. The sensor assembly of the cesium magnetometer. (a) Schematic of the sensor assembly; RF excitation (RF), lens (L), filter (F), circular polarizer (CP), feedback coil (FC), photodetector (PD). (b) Close-up of the working Cs lamp. (c) Larmor precession. (d) Emission spectrum of the Cs lamp after the filter, where the inset shows an enlarged plot of the main emitting line around the Cs D1 line (894.33 nm, in the air). The full-width-half-maximum (FWHM) linewidth is ~0.35 nm (~130 GHz) by a Lorentzian fit. The D2 line (852 nm) has been significantly filtered. (e) Energy levels of Cs illustrating optical pumping, Zeeman splittings, and transverse magnetic field interactions.
Applsci 13 08225 g001
Figure 2. Schematic diagram of the electronic unit.
Applsci 13 08225 g002
Figure 3. Temperature feedback mechanism of cesium lamp.
Applsci 13 08225 g003
Figure 4. The calculated intrinsic longitudinal relaxation rate.
Applsci 13 08225 g004
Figure 5. (a) Calculated intrinsic transverse relaxation rate; (b) measured transverse relaxation rate as a function of light power.
Applsci 13 08225 g005
Figure 6. (a) Total intrinsic transverse relaxation rate considering the quadratic Zeeman effect; (b) fundamental quantum limit sensitivity based on Γ 2 t o t .
Applsci 13 08225 g006
Figure 7. Comparison of RF frequency variation for cesium lamp.
Applsci 13 08225 g007
Figure 8. Comparison of RF output power variation for cesium lamp.
Applsci 13 08225 g008
Figure 9. Comparison of optical output variation of cesium lamp.
Applsci 13 08225 g009
Figure 10. System noise of the detected signal, with the photon-shot noise N s n from the power of the lamp as the dominating source.
Applsci 13 08225 g010
Figure 11. Resonance linewidth and signal amplitude dependences on temperature.
Applsci 13 08225 g011
Figure 12. Resonance linewidth and signal amplitude dependences on feedback magnetic field.
Applsci 13 08225 g012
Figure 13. Configuration of cesium magnetometer sensitivity testing.
Applsci 13 08225 g013
Figure 14. Measured sensitivity of the cesium atomic magnetometer under B 0 = 50   μ T . Intrinsic sensitivity estimated by the measured system noise floor: 100.3   f T / H z . Intrinsic sensitivity estimated by the photon-shot noise: 91.5   f T / H z . Fundamental quantum limited noise estimated. The measurement data were normalized to a 1 Hz bandwidth.
Applsci 13 08225 g014
Table 1. Comparison of the fractional fluctuations (standard deviation/mean value ×100%) over the temperature range [−50 °C, +70 °C] before and after the improvement of the cesium lamp.
StateRF Frequency RF Output Power Optical Power
Before Improvement0.80%61.97%42.92%
After Improvement0.07%2.05%14.68%
Disclaimer/Publisher’s Note: The statements, opinions and data contained in all publications are solely those of the individual author(s) and contributor(s) and not of MDPI and/or the editor(s). MDPI and/or the editor(s) disclaim responsibility for any injury to people or property resulting from any ideas, methods, instructions or products referred to in the content.

