Article

Root Dilaceration Using Deep Learning: A Diagnostic Approach

by
Berrin Çelik
1,* and
Mahmut Emin Çelik
2,3
1
Oral and Maxillofacial Radiology Department, Faculty of Dentistry, Ankara Yıldırım Beyazıt University, Ankara 06760, Turkey
2
Electrical Electronics Engineering Department, Faculty of Engineering, Gazi University, Ankara 06570, Turkey
3
Biomedical Calibration and Research Center (BIYOKAM), Gazi University Hospital, Gazi University, Ankara 06560, Turkey
*
Author to whom correspondence should be addressed.
Appl. Sci. 2023, 13(14), 8260; https://doi.org/10.3390/app13148260
Submission received: 13 June 2023 / Revised: 10 July 2023 / Accepted: 13 July 2023 / Published: 17 July 2023
(This article belongs to the Special Issue Artificial Intelligence Applied to Dentistry)

Abstract

:

Featured Application

The developed deep-learning-based computer-aided detection system serves as a powerful tool for the assessment of root dilaceration in dental panoramic radiographs.

Abstract

Understanding usual anatomical structures and unusual root formations is crucial for root canal treatment and surgical treatments. Root dilaceration is a tooth formation with sharp bends or curves, which causes dental treatments to fail, especially root canal treatments. The aim of the study was to apply recent deep learning models to develop an artificial intelligence-based computer-aided detection system for root dilaceration in panoramic radiographs. A total of 983 objects in 636 anonymized panoramic radiographs were initially labelled by an oral and maxillofacial radiologist and were then used to detect root dilacerations. A total of 19 state-of-the-art deep learning models with distinct backbones or feature extractors were used with the integration of alternative frameworks. Evaluation was carried out using Common Objects in Context (COCO) detection evaluation metrics, mean average precision (mAP), accuracy, precision, recall, F1 score and area under precision-recall curve (AUC). The duration of training was also noted for each model. Considering the detection performance of all models, mAP, accuracy, precision, recall, and F1 scores of up to 0.92, 0.72, 0.91, 0.87 and 0.83, respectively, were obtained. AUC were also analyzed to better understand where errors originated. It was seen that background confusion limited performance. The proposed system can facilitate root dilaceration assessment and alleviate the burden of clinicians, especially for endodontists and surgeons.

1. Introduction

Root dilaceration refers to an abnormality in tooth development, characterized by a deviation from the longitudinal axis, a sharp bend, or curvature in the tooth’s root [1]. Initially identified by Tomes in 1848, this anomaly is recognized as an irregular deviation of both the crown and roots [2]. The etiology of root dilacerations remains partially unknown, with no broadly acknowledged theory or supporting scientific evidence to explain their formation. However, several potential causes have been discussed in earlier studies, including trauma, genetics, spatial constraints, proximity to cysts, tumors, or unanatomical structures [1,3,4]. The most effective method for diagnosing root dilacerations is through radiographic examination.
A high degree of root curvature is significantly risky as it can lead to increased force and stress when occlusal forces are applied to the tooth, causing instability. Maintaining control over dental instruments during endodontic treatment becomes vitally important, particularly in the case of canal curvature. The occurrence of dilaceration is regarded as the key dental factor influencing the success of endodontic treatment. The extraordinary angulation of the root can lead to complications such as ledge, transport, zipping, and broken file [3,5,6]. Additionally, root resorption can occur during orthodontic treatment in cases involving dilacerated roots [7]. It is also noteworthy that dilaceration is the most common cause of eruption failure in permanent central incisors [8]. Consequently, it is essential to monitor root development in terms of angulation, position, and shape, and crucially, to diagnose any dilacerations prior to orthodontic, endodontic, and surgical treatments. The reported prevalence of root dilacerations fluctuates greatly across studies, with a range from 2.12% to 69.4% [9,10,11,12,13,14]. This variation arises due to differences in the criteria used to define root dilaceration, methodologies employed, and other influential factors such as trauma history, ethnicity, and gender [15,16,17]. Despite many studies, there remains no consensus on the definition of dilaceration for determining the prevalence or the specific location of the dilaceration. Chohayeb et al. defined dilaceration as apical deviations greater than 20 degrees from the normal axis of the tooth in the roots; whereas, Hamasha et al. and Malcic et al. and others considered the angle to be 90 degrees in the anterior or posterior plane [1,5,6,9]. Schneider et. al. classified dilacerations into mild (20–40 degrees), moderate (40–60 deg) and extreme (beyond 60 deg) according to the angle of the root [18].
Deep learning, an integral branch of artificial intelligence (AI), is characterized by its use of algorithms that can learn and improve from a vast array of input data. This capacity for learning enables computer systems to resolve complex problems more efficiently, making it a powerful tool in data-heavy fields. Transitioning to the realm of dentistry, the potential and practicality of deep learning becomes increasingly clear. In this context, deep learning has been successfully utilized to automate and refine a multitude of tasks [19,20,21,22,23,24,25]. Considering the time-consuming and complicated nature of recognizing all related signs of dental conditions, deep-learning-based detection approaches are needed to save clinicians’ time and improve their work quality performance.
In this work, we aim to develop a computer-aided decision support system to automatically detect root dilaceration in panoramic radiographs. A tooth was determined as having root dilaceration if there was an angulation or curvature of 20 degrees or more from the normal axis in the anterior or posterior plane. Anterior and posterior deviations were examined in PRs. A total of 19 different state-of-the-art deep-learning-based detection models were applied including Faster R-CNN, SSD, YOLO, and RetinaNet. Moreover, various backbones and feature extractors, such as ResNet-50, ResNet-101 and DarkNet53, were also employed together with the detectors. As an alternative to current detection frameworks, the Side-Aware Boundary Localization approach, cascaded networks, and Libra and Dynamic frameworks were also integrated to determine their effect on the detection results. Each model’s performance was evaluated using Common Objects in Context (COCO) detection evaluation metrics, mean average precision (mAP), accuracy, precision, recall, F1 score and precision-recall curve.

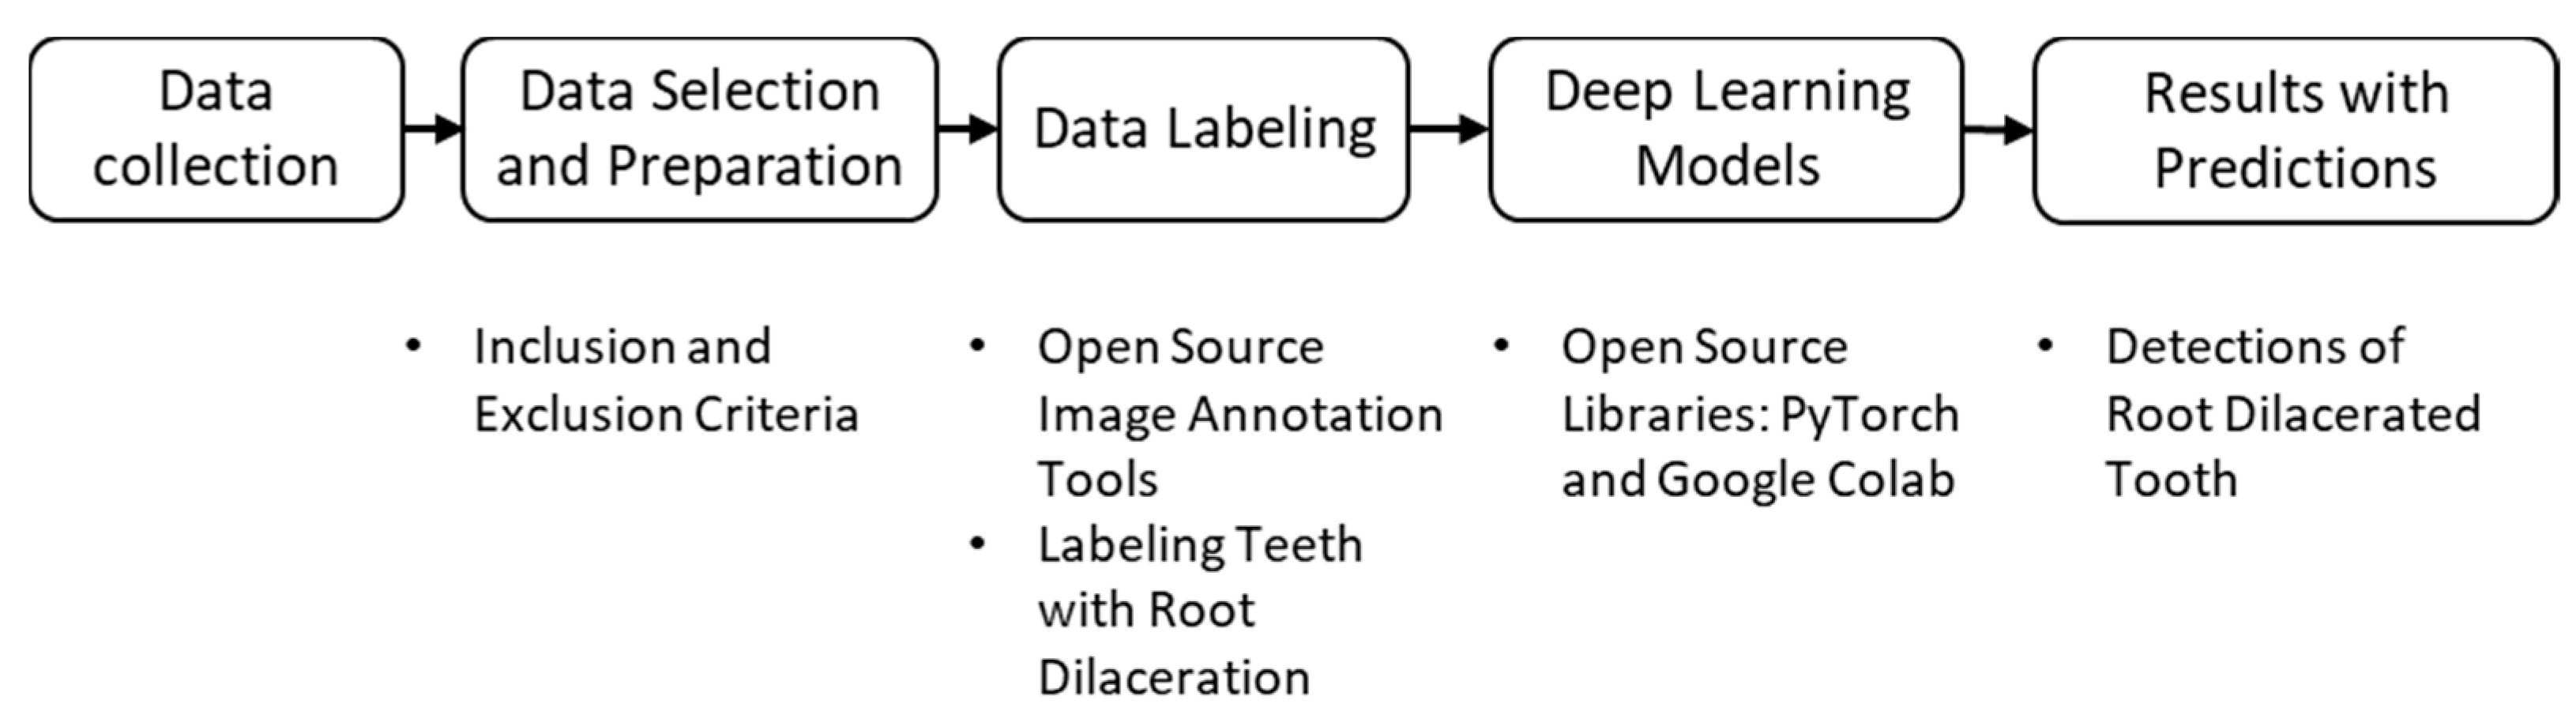
2. Materials and Methods

This study was carried out in accordance with the Helsinki Declaration standards. It was approved by the Ethical Review Board of University (approval number 2023-78). Digital PRs were taken from the same dental panoramic device, Planmeca oy, Helsinki, Finland. This is a retrospective and exploratory study that investigates the role of artificial intelligence in detecting root dilaceration. Figure 1 presents a step-by-step flowchart of the study.
PRs were randomly chosen from images taken between 2022 and 2023 from patients who were older than 18 years old. The inclusion criteria were the presence of root dilaceration and exclusion criteria were metallic artifacts, position-based distortions and incomplete root formations in the radiographs. Finally, 636 PRs with a total of 983 objects were selected. They were all anonymized to remove identifying information.
The only class defined was root dilaceration in PRs. After two weeks, all images were examined again by the radiologist to confirm the presence of root dilaceration. Before the labelling process, a calibration session was performed as a pilot on 48 PRs that were not included in this study. An oral and maxillofacial radiologist (B.Ç.) with more than 6 years of experience in the field labelled the images. The smallest rectangular boxes covering the dilacerated roots were defined as the ground truth. The data were labelled again by the same expert after two weeks, which confirmed consistency with the previous step. LabelMe, the open annotation tool, was used to prepare the annotations. Training, validation, and test folders were randomly created with ratios of 0.8, 0.1, and 0.1, respectively.
PyTorch and Google CoLab were mainly used to implement deep learning models regarding root dilaceration detection. Figure 2 shows PRs with root dilaceration as an example to show the inputs used for the proposed object detection solution. Before feeding into the deep learning models, data were pre-processed, which included typical operations such as resizing, flipping, normalizing and padding.

2.1. Object Detection and Detectors

This section briefly explains the object detection task and introduces the deep-learning-based detectors used in this work. The object detection task basically tries to find where object locations are, and which class object belongs to the images. Compared to traditional techniques using hand-crafted features, deep-learning-based approaches take advantage of hierarchical feature representation, high learning, and expressing capability and joint optimization of classification and localization in a multitask learning approach thanks to a hierarchical multistage deep structure. The two types of deep-learning-based generic object detection frameworks are region proposal-based techniques and regression/classification-based techniques. The former technique generates region proposals and later classifies each proposal into object classes whereas the latter approximates object locations directly without choosing interested parts. R-CNN, Fast R-CNN, and Faster R-CNN are region proposal-based models; on the other hand, YOLO, SSD, and RetinaNet are regression-based methods.
There are 19 state-of-the-art deep learning detection models including two-stage and one-stage detectors. Faster RCNN and RCNN are two-stage techniques that need a backbone as a feature extractor whereas SSD, YOLO, and RetinaNet perform detection in a single-step. ResNet-50 and ResNet-101 and DarkNet-53 CNNs are used as a backbone for detectors. In addition to detectors, models with new frameworks or approaches to improve existing performance were also used. The training batch size was 8. The stochastic gradient descent (SGD) optimization algorithm was used with a learning rate of 0.01, momentum of 0.9 and weight decay of 0.0001. A step learning rate scheduler was used as the optimizer. Models were evaluated on mean average precision, accuracy, precision and recall metrics. Outputs were analyzed using precision-recall curves for the best performing models.
The Cascade R-CNN model was developed from improvements on the Faster R-CNN model [26]. It outperforms Faster R-CNN in object detection and Mask R-CNN in the segmentation task. In this study, a ResNet101 backbone was used for this model.
Faster R-CNN was obtained with the improvements on the Fast R-CNN model [27]. It combines the Region Proposal Network (RPN) and Fast R-CNN for object detection. A ResNet101 backbone was used for this model.
RetinaNet is a one-stage object detector developed by Lin et al. [28]. It is a single network including a backbone and two task-specific subnetworks. It uses a focal loss function for class imbalances. ResNet50 was used for this model.
YOLOv3 is an another one-stage model [29]. It has been updated based on the previous version with its feature extractor that has skip connections and three prediction heads that are each used for image processing at different spatial compressions.
The SSD (Single Shot MultiBox Detector) model is a one-stage deep learning model developed by Liu et al. [30]. The significant improvement is the speed that is provided by removing bounding box proposals and the feature resampling stage.
RegNetX is a convolutional network design space with simple, regular models that parametrize populations of networks. RegNetX was implemented with Faster R-CNN.
Libra R-CNN is an object detection model focused on the training process [31]. It is a simple and effective approach for balancing datasets by integrating IoU sampling, a feature pyramid, and L1 loss. ResNeXt-101-FPN was used as a backbone.
Deformable convolutional networks, also known as deformable ConvNets, is a deep learning model created by Dai et al. [32]. This model can augment the spatial sampling locations in the modules with additional offsets and learn the offsets from the target tasks, without additional supervision.
DetetoRS is a deep learning model created by Qiao et al. [33]. It provides a new mechanism in the backbone design. This model uses Recursive Feature Pyramid and Switchable Atrous Convolution. ResNet50 was used as backbone.
Dynamic R-CNN is a two-stage object detection model [34]. It addresses dynamic training procedures to mitigate inconsistency problems between the fixed settings by adjusting the shape of regression loss function and the label assignment criteria automatically. ResNet50 was used as a backbone.
NAS-FPN is a deep learning model developed by Ghiasi et al. [35]. It proposes a new feature pyramid architecture to overcome the large search space of pyramidal architectures. This model uses a combination of scalable search space and a neural architecture search algorithm instead of manually designing architectures for pyramidal representations.
Grid R-CNN is a novel object detection model which adopts a grid-guided localization mechanism for accurate object detection [36]. It gives better average precision on the COCO benchmark compared to Faster R-CNN with a ResNet50 backbone and FPN architecture. Resnext101 was used as a backbone.
The Hybrid Task Cascade (HTC) model was created by modifying the Cascade Mask R-CNN model designed by Chen et al. [37]. It takes advantage of a powerful cascade architecture. Faster RCNN with weight standardization was presented by Qiao et. al. [38].
FreeAnchor is an approach that updates the hand-crafted anchor assignment to free anchor matching by formulating detector training as a maximum likelihood estimation (MLE) procedure [39]. It allows objects to match anchors in a flexible manner. ResNet50 was used as a backbone.
FCOS (Fully Convolutional One-Stage Object Detector) is an object detection model created by Tian et al. [40]. Most state-of-the-art object detectors rely on pre-defined anchor boxes, but this model is anchor-box free, as well as proposal free. The elimination of anchor boxes eliminates complicated computations. ResNet50 was used as a backbone.
Adaptive Training Sample Selection (ATSS) is a method of automatically selecting positive and negative samples based on the statistical properties of the object [41]. This method fills the gap between anchor-based (Faster R-CNN, YOLOv3 etc.) and anchor-free detection (FCOS, FoveaBox etc.). ResNet101 was used as a backbone.
FoveaBox, like FCOS, is a completely anchor-free object detection model [42]. This model directly learns the object’s existing possibility and the bounding box coordinates without an anchor reference by predicting category-sensitive semantic maps for the object’s existing possibility.
Side-Aware Boundary Localization (SABL) is an approach developed by Wang et al. [43]. It proposes a two-step localization scheme, which first predicts a range of movement through bucket prediction and then pinpoints the precise position within the predicted bucket.
We used a transfer learning concept in this work. Detectors that were pre-trained on the COCO (Common Objects in Context) dataset were employed. Transfer learning refers to leveraging feature representations from pre-trained models. Pre-trained models were usually trained on a sufficient amount of data that was a standard benchmark for computer vision applications. It allows the use of the weights of the pre-trained models while initializing the weights for a new application, dental images in our case. Practically, transferring information from previously learned tasks for the learning of new tasks has the potential to significantly improve performance.

2.2. Evaluation Criteria

Object detection tasks are mainly evaluated by mean average precision (mAP), which is a standard metric used to assess performances of object detection models in computer vision. Many object detection algorithms and benchmark challenges use it to evaluate models, for instance, detectors such as Faster R-CNN, YOLO, SSD, and MobileNet. On the other hand, Pascal, VOC and COCO challenges utilize mAP.
Calculation of mAP is related to Intersection over Union (IOU). IOU refers to the overlap of the predicted bounding box and the ground truth. Values close to 1 show how close the predicted bounding box is to the ground truth.
I o U = a r e a ( g r o u n d   t r u t h p r e d i c t e d ) a r e a ( g r o u n d   t r u t h p r e d i c t e d )
IOU is primarily used for a confusion matrix that is a table listing predictions and ground truths for each class. It gives classifier performance with four values: true posi-tive, true negative, false positive, and false negative. Evaluation metrics such as accuracy, precision, recall and F1 score are calculated using a confusion matrix, as presented in Table 1. Accuracy defines the number of correct predictions over all the predictions. Precision measures how correct the positive predictions made are. Recall, or sensitivity, measures how correct true positives are over all predictions. F1 score measures how correct the model finds true positives over all predictions. It takes precision and recall together and outputs a single metric that is more sensitive to a lower value, which makes it an optimal confidence metric.
Object detection tasks make use of IOU to calculate precision in such a way that if an object has a higher IOU with respect to ground truth than the IOU-threshold, mostly 0.5, it is then classified as a true positive. Mean average precision (mAP), on the other hand, refers to the average of average precision (AP) of each class. AP is calculated by the area under precision-recall curve with distinct IOU thresholds as shown in Table 2.
Some of the Common Objects in Context (COCO) metrics appear in the precision-recall curve so that area under curve (AUC) is provided for different metrics as a figure legend. Briefly, C75 and C50 indicate an AUC for IOU of 0.75 and 0.5, respectively. Loc cites AUC ignoring localization errors. Sim, Oth and FN show AUC while removing super-category class confusions, class confusions and all remaining errors, respectively.

3. Results

The performance evaluation process of the models can be analyzed in two different parts. Detection performance is evaluated by mean average precision (mAP) and classification is assessed by accuracy, precision, recall, and F1 score that were calculated by the Intersection over Union of 0.5 for detection. Additionally, COCO metrics in addition to precision-recall curve, AUC and loss graphs were also provided. Table 3 presents root dilaceration detection results using Faster R-CNN, R-CNN, SSD, YOLOv3, RetinaNet, anchor-free models and models with alternative frameworks applied to our dataset.
The detection performance of the models was analyzed by mAP that varied between 0.68 and 0.92. Except SSD, all other models successfully detected root dilacerations with a success rate higher than 0.83. The best two models were FreeAnchor Resnet50 and Cascade RCNN Resnet101 with 0.92 and 0.9. Accuracy varied between 0.48 and 0.72, and the best accuracy was provided by the Cascade RCNN Resnet101 and RetinaNet Resnet50 models with 0.72. Precision varied between 0.66 and 0.91. Faster RCNN Resnet101, Libra RCNN Resnext101 and FreeAnchor Resnet50 showed the highest precision with 0.91. Recall varied between 0.59 and 0.87. Faster RCNN with weight standardization (WS) and batch-channel normalization (BCN) and RegNetx provided the highest recall with 0.87 and 0.86. F1 score varied between 0.65 and 0.83. Cascade RCNN Resnet101 and RetinaNet Resnet50 were superior to the others with 0.83. The training time for each model is also given in Table 1. Libra RCNN Resnext101 had the longest training time whereas RetinaNet Resnet50 was trained at the earliest. Figure 3 illustrates model predictions for root dilacerations with predicted bounding boxes and labels.
Two models were chosen for further analysis of the results, Cascade RCNN with ResNet101 as a backbone and RetinaNet with ResNet50. Precision-recall curve and training-validation losses were presented.
The precision-recall curve is very useful to better understand where a corresponding model needs to be improved, in other words, in which step it fails. Detection failures were categorized into four classes, namely, object localization errors, class-based confusions, and false-positives caused by background and missing detections as shown in Figure 4. It was seen that the AUC values while IOU was equal to 0.5 were 0.839 and 0.887 for Cascade RCNN and RetinaNet, respectively. They became 0.853 for Cascade RCNN and stayed the same for RetinaNet when localization errors were corrected. Removal of class confusions did not change the AUC for either of the models. It was seen that background confusion limited the performance of the models. The AUC would have been 0.891 and 0.96 when background confusions were removed.

4. Discussion

As one of the most frequently used imaging modalities in routine dentistry, panoramic radiographs scan a wider range of dental structures with relatively low radiation, which makes them an essential tool for diagnosis in clinics [44,45]. Considering complex oral structures, busy working conditions, and lack of time, deep-learning-based computer-aided detection systems can advance the quality of daily routines and treatment planning by providing instant image analysis for clinicians. In this context, we applied state-of-the-art deep learning models to detect root dilaceration in panoramic radiographs.
To the best of our knowledge, this is the first and most comprehensive study on detecting root dilaceration directly using deep learning. There is no other study that can directly be compared with this work. Previous studies are mostly based on evaluating the prevalence of root dilaceration using different types of radiographs, including panoramic radiographs, periapical radiographs and cone-beam computed tomography images, and case reports on treatment management. Very limited previous studies that were indirectly related to root dilaceration using artificial intelligence were also discussed as shown in Table 4.
Lee et al. used artificial intelligence to detect 17 fine-grained dental anomalies using 23,000 panoramic radiographs [46]. R-CNN and Detectron-2 were used for detection. Root dilaceration was mentioned in the supernumerary tooth section of dental anomalies category but was not specifically examined. Supernumerary teeth were shown to be one of the causes of root dilaceration. Precision, sensitivity (recall) and specificity for supernumerary tooth detection values were 0.32, 0.62 and 0.97, respectively. Compared to this study, the proposed work provides superior results: detected root dilacerations with a varying mAP of between 0.68 and 0.92. Precision and recall values were between 0.66 and 0.91 and 0.59 and 0.87, respectively.
Welk J. used machine learning to predict canine eruption and some other anomalies in panoramic radiographs [47]. When mentioning the high incidence of maxillary canine impaction and common etiologic aspects, root dilaceration was shown to be a localized factor. The final results reported that the sensitivity (recall), specificity, F1 score, and accuracy values were 0.479, 0.592, 0.28 and 0.572, respectively. Compared to the presented findings, the proposed deep learning models showed better performance.
Software for accurate detection and assessment of root dilaceration holds great relevance to the clinic due to its potential impact on improving patient outcomes and treatment planning in dentistry. By applying deep learning techniques to panoramic radiographs taken during routine imaging examinations, clinicians can benefit in several ways:
  • Early Detection: Deep learning models can identify root dilacerations at an early stage even if the patient is not there for a root dilaceration-related case, which allows clinicians to promptly intervene and implement appropriate treatment strategies. Early detection may prevent further complications, such as tooth impaction, misalignment, or delayed eruption;
  • Accurate Diagnosis: Deep learning algorithms can aid in accurately diagnosing root dilacerations with high performance. This can reduce the risk of misinterpretation or missed diagnoses, ensuring that patients receive timely and accurate treatment;
  • Treatment Planning: The detection of root dilacerations through deep learning can significantly influence treatment planning decisions. Clinicians can better anticipate the complexity and challenges associated with these conditions, leading to more informed treatment plans, including orthodontic interventions, surgical approaches, or alternative treatment options.
  • Enhanced Patient Care: By leveraging deep learning technology, clinicians can deliver more personalized and tailored care to patients with root dilacerations. This can lead to improved patient satisfaction, reduced treatment time, and enhanced treatment outcomes.
Ultimately, it will provide increased efficiency and improved accuracy in dental healthcare.
There are several limitations of this study that can positively affect the proposed results. The first limitation is the sample size. Considering the exclusion criteria, more data could increase the models’ performances. Data augmentation techniques were not used because it was thought that the orientation of the image and the aspect ratio inherent in the PRs were unique for the detection of root dilaceration. On the other hand, this work was performed using panoramic images. They were routinely used during the first examination thanks to the wide range of scanning areas with very low radiation compared to 3D imaging modalities. If needed, 3D imaging modalities could also be used for further examinations to identify root dilaceration clinically. As a future perspective, there needs to be more collaboration between dental researchers, AI specialists, and ethicists to develop efficient, reliable, and ethical tools. Moreover, the creation of large, diverse, and high-quality datasets for training AI models should be prioritized, alongside robust data security and privacy measures. Lastly, further efforts should be made to integrate AI applications into dental practice management software to improve workflow efficiency. In the future, it is planned that models can be further improved with multi-centered large balanced datasets. Also, results will be compared with human observations on different levels.

5. Conclusions

The present work demonstrates that deep learning models can be effectively used as a computer-assisted tool to automatically identify root dilacerations in panoramic radiographs.

Author Contributions

B.Ç.: conceptualization, data collection, preparation, writing—original draft preparation; M.E.Ç.: building deep learning models, writing—original draft preparation. Both authors contributed to the article and approved the submitted version. All authors have read and agreed to the published version of the manuscript.

Funding

This research received no external funding.

Institutional Review Board Statement

This study was carried out by the Helsinki Declaration standards. It was approved by the Ethical Review Board of the Gazi University (approval number 2023-78).

Informed Consent Statement

Not applicable.

Data Availability Statement

The data supporting this study’s findings are not available and accessible due to ethical issues, and patients’ and institutions’ data protection policies.

Conflicts of Interest

The authors declare no conflict of interest.

References

  1. Ahmed, H.M.A.; Dummer, P.M.H. A new system for classifying tooth, root and canal anomalies. Int. Endod. J. 2018, 51, 389–404. [Google Scholar] [CrossRef] [PubMed] [Green Version]
  2. Tomes, J. A Course of Lectures on Dental Physiology and Surgery, Delivered at the Middlesex Hospital School. Am. J. Dent. Sci. 1848, 8, 120–147. [Google Scholar] [PubMed]
  3. Jafarzadeh, H.; Abbott, P.V. Dilaceration: Review of an endodontic challenge. J. Endod. 2007, 33, 1025–1030. [Google Scholar] [CrossRef] [PubMed]
  4. Topouzelis, N.; Tsaousoglou, P.; Pisoka, V.; Zouloumis, L. Dilaceration of maxillary central incisor: A literature review. Dent. Traumatol. 2010, 26, 335–341. [Google Scholar] [CrossRef] [PubMed]
  5. Chohayeb, A.A. Dilaceration of Permanent Upper Lateral Incisors—Frequency, Direction, and Endodontic Treatment Implications. Oral Surg. Oral Med. Oral Pathol. 1983, 55, 519–520. [Google Scholar] [CrossRef] [PubMed]
  6. Hamasha, A.A.; Al-Khateeb, T.; Darwazeh, A. Prevalence of dilaceration in Jordanian adults. Int. Endod. J. 2002, 35, 910–912. [Google Scholar] [CrossRef]
  7. Tanaka, E.; Hasegawa, T.; Hanaoka, K.; Yoneno, K.; Matsumoto, E.; Dalla-Bona, D.; Yamano, E.; Suekawa, Y.; Watanabe, M.; Tanne, K. Severe crowding and a dilacerated maxillary central incisor in an adolescent. Angle Orthod. 2006, 76, 510–518. [Google Scholar]
  8. Caeiro-Villasenin, L.; Serna-Munoz, C.; Perez-Silva, A.; Vicente-Hernandez, A.; Poza-Pascual, A.; Ortiz-Ruiz, A.J. Developmental Dental Defects in Permanent Teeth Resulting from Trauma in Primary Dentition: A Systematic Review. Int. J. Environ. Res. Public Health 2022, 19, 754. [Google Scholar] [CrossRef]
  9. Malcic, A.; Jukic Krmek, S.; Brzovic, V.; Miletic, I.; Pelivan, I.; Anic, I. Prevalence of root dilaceration in adult dental patients in Croatia. Oral Surg. Oral Med. Oral Pathol. Oral Radiol. Endodontol. 2006, 102, 104–109. [Google Scholar] [CrossRef]
  10. Ledesma-Montes, C.; Hernandez-Guerrero, J.; Jimenez-Farfan, M. Frequency of dilaceration in a mexican school-based population. J. Clin. Exp. Dent. 2018, 10, e665–e667. [Google Scholar] [CrossRef]
  11. Gurbuz, O.; Ersen, A.; Dikmen, B.; Gumustas, B.; Gundogar, M. The prevalence and distribution of the dental anomalies in the Turkish population. J. Anat. Soc. India 2019, 68, 46–51. [Google Scholar] [CrossRef]
  12. Haghanifar, S.; Moudi, E.; Abesi, F.; Kheirkhah, F.; Arbabzadegan, N.; Bijani, A. Radiographic Evaluation of Dental Anomaly Prevalence in a Selected Iranian Population. J. Dent. 2019, 20, 90–94. [Google Scholar] [CrossRef]
  13. Cao, D.; Shao, B.; Izadikhah, I.; Xie, L.; Wu, B.; Li, H.; Yan, B. Root dilaceration in maxillary impacted canines and adjacent teeth: A retrospective analysis of the difference between buccal and palatal impaction. Am. J. Orthod. Dentofac. Orthop. 2021, 159, 167–174. [Google Scholar] [CrossRef] [PubMed]
  14. Asheghi, B.; Sahebi, S.; Zangooei Booshehri, M.; Sheybanifard, F. Evaluation of Root Dilaceration by Cone Beam Computed Tomography in Iranian South Subpopulation: Permanent Molars. J. Dent. 2022, 23, 369–376. [Google Scholar] [CrossRef]
  15. Luke, A.M.; Kassem, R.K.; Dehghani, S.N.; Mathew, S.; Shetty, K.; Ali, I.K.; Pawar, A.M. Prevalence of Dental Developmental Anomalies in Patients Attending a Faculty of Dentistry in Ajman, United Arab Emirates. Pesqui. Bras. Odontopediatr. 2017, 17, 1–5. [Google Scholar] [CrossRef]
  16. Bilge, N.H.; Yesiltepe, S.; Agirman, K.T.; Caglayan, F.; Bilge, O.M. Investigation of prevalence of dental anomalies by using digital panoramic radiographs. Folia Morphol. 2018, 77, 323–328. [Google Scholar] [CrossRef] [Green Version]
  17. Goswami, M.; Bhardwaj, S.; Grewal, N. Prevalence of Shape-related Developmental Dental Anomalies in India: A Retrospective Study. Int. J. Clin. Pediatr. Dent. 2020, 13, 407–411. [Google Scholar] [CrossRef]
  18. Schneider, S.W. A comparison of canal preparations in straight and curved root canals. Oral Surg. Oral Med. Oral Pathol. 1971, 32, 271–275. [Google Scholar] [CrossRef]
  19. Chen, H.; Zhang, K.L.; Lyu, P.J.; Li, H.; Zhang, L.D.; Wu, J.; Lee, C.H. A deep learning approach to automatic teeth detection and numbering based on object detection in dental periapical films. Sci. Rep. 2019, 9, 3840. [Google Scholar] [CrossRef] [Green Version]
  20. Hiraiwa, T.; Ariji, Y.; Fukuda, M.; Kise, Y.; Nakata, K.; Katsumata, A.; Fujita, H.; Ariji, E. A deep-learning artificial intelligence system for assessment of root morphology of the mandibular first molar on panoramic radiography. Dentomaxillofac. Radiol. 2019, 48, 20180218. [Google Scholar] [CrossRef]
  21. Tuzoff, D.V.; Tuzova, L.N.; Bornstein, M.M.; Krasnov, A.S.; Kharchenko, M.A.; Nikolenko, S.I.; Sveshnikov, M.M.; Bednenko, G.B. Tooth detection and numbering in panoramic radiographs using convolutional neural networks. Dentomaxillofac. Radiol. 2019, 48, 20180051. [Google Scholar] [CrossRef]
  22. Chang, H.J.; Lee, S.J.; Yong, T.H.; Shin, N.Y.; Jang, B.G.; Kim, J.E.; Huh, K.H.; Lee, S.S.; Heo, M.S.; Choi, S.C.; et al. Deep Learning Hybrid Method to Automatically Diagnose Periodontal Bone Loss and Stage Periodontitis. Sci. Rep. 2020, 10, 7531. [Google Scholar] [CrossRef]
  23. Carrillo-Perez, F.; Pecho, O.E.; Morales, J.C.; Paravina, R.D.; Della Bona, A.; Ghinea, R.; Pulgar, R.; Perez, M.D.; Herrera, L.J. Applications of artificial intelligence in dentistry: A comprehensive review. J. Esthet. Restor. Dent. 2022, 34, 259–280. [Google Scholar] [CrossRef]
  24. Celik, B.; Celik, M.E. Automated detection of dental restorations using deep learning on panoramic radiographs. Dentomaxillofac. Radiol. 2022, 51, 20220244. [Google Scholar] [CrossRef] [PubMed]
  25. Celik, M.E. Deep Learning Based Detection Tool for Impacted Mandibular Third Molar Teeth. Diagnostics 2022, 12, 942. [Google Scholar] [CrossRef]
  26. Cai, Z.W.; Vasconcelos, N. Cascade R-CNN: Delving into High Quality Object Detection. In Proceedings of the 2018 IEEE/CVF Conference on Computer Vision and Pattern Recognition (CVPR), Salt Lake City, UT, USA, 18–23 June 2018; pp. 6154–6162. [Google Scholar] [CrossRef] [Green Version]
  27. Ren, S.Q.; He, K.M.; Girshick, R.; Sun, J. Faster R-CNN: Towards Real-Time Object Detection with Region Proposal Networks. In Proceedings of the Advances in Neural Information Processing Systems 28: Annual Conference on Neural Information Processing Systems 2015, Montreal, QC, Canada, 7–12 December 2015. [Google Scholar]
  28. Lin, T.Y.; Goyal, P.; Girshick, R.; He, K.M.; Dollar, P. Focal Loss for Dense Object Detection. In Proceedings of the IEEE International Conference on Computer Vision (ICCV), Venice, Italy, 22–29 October 2017; pp. 2999–3007. [Google Scholar] [CrossRef] [Green Version]
  29. Joseph Redmon, A.F. YOLOv3: An Incremental Improvement. arXiv 2018, arXiv:1804.02767. [Google Scholar]
  30. Liu, W.; Anguelov, D.; Erhan, D.; Szegedy, C.; Reed, S.; Fu, C.Y.; Berg, A.C. SSD: Single Shot MultiBox Detector. Lect. Notes Comput. Sci. 2016, 9905, 21–37. [Google Scholar] [CrossRef] [Green Version]
  31. Pang, J.M.; Chen, K.; Shi, J.P.; Feng, H.J.; Ouyang, W.L.; Lin, D.H. Libra R-CNN: Towards Balanced Learning for Object Detection. In Proceedings of the 2019 IEEE/CVF Conference on Computer Vision and Pattern Recognition (CVPR 2019), Long Beach, CA, USA, 15–20 June 2019; pp. 821–830. [Google Scholar] [CrossRef] [Green Version]
  32. Dai, J.F.; Qi, H.Z.; Xiong, Y.W.; Li, Y.; Zhang, G.D.; Hu, H.; Wei, Y.C. Deformable Convolutional Networks. In Proceedings of the IEEE International Conference on Computer Vision, Venice, Italy, 22 October 2017; pp. 764–773. [Google Scholar] [CrossRef] [Green Version]
  33. Qiao, S.Y.; Chen, L.C.; Yuille, A. DetectoRS: Detecting Objects with Recursive Feature Pyramid and Switchable Atrous Convolution. In Proceedings of the 2021 IEEE/CVF Conference on Computer Vision and Pattern Recognition, CVPR 2021, Nashville, TN, USA, 20–25 June 2021; pp. 10208–10219. [Google Scholar] [CrossRef]
  34. Zhang, H.; Chang, H.; Ma, B.; Wang, N.; Chen, X. Dynamic R-CNN: Towards High Quality Object Detection via Dynamic Training. arXiv 2020, arXiv:2004.06002. [Google Scholar]
  35. Ghiasi, G.; Lin, T.Y.; Le, Q.V. NAS-FPN: Learning Scalable Feature Pyramid Architecture for Object Detection. In Proceedings of the 2019 IEEE/CVF Conference on Computer Vision and Pattern Recognition (CVPR 2019), Long Beach, CA, USA, 15–20 June 2019; pp. 7029–7038. [Google Scholar] [CrossRef] [Green Version]
  36. Lu, X.; Li, B.Y.; Yue, Y.X.; Li, Q.Q.; Yan, J.J. Grid R-CNN. In Proceedings of the 2019 IEEE/CVF Conference on Computer Vision and Pattern Recognition (CVPR 2019), Long Beach, CA, USA, 15–20 June 2019; pp. 7355–7364. [Google Scholar] [CrossRef]
  37. Chen, K.; Pang, J.M.; Wang, J.Q.; Xiong, Y.; Li, X.X.; Sun, S.Y.; Feng, W.S.; Liu, Z.W.; Shi, J.P.; Ouyang, W.L.; et al. Hybrid Task Cascade for Instance Segmentation. In Proceedings of the 2019 IEEE/CVF Conference on Computer Vision and Pattern Recognition (CVPR 2019), Long Beach, CA, USA, 15–20 June 2019; pp. 4969–4978. [Google Scholar] [CrossRef] [Green Version]
  38. Qiao, S.; Wang, H.; Liu, C.; Shen, W.; Yuille, A. Micro-Batch Training with Batch-Channel Normalization and Weight Standardization. arXiv 2020, arXiv:1903.10520. [Google Scholar]
  39. Zhang, X.S.; Wan, F.; Liu, C.; Ji, R.R.; Ye, Q.X. FreeAnchor: Learning to Match Anchors for Visual Object Detection. In Proceedings of the Advances in Neural Information Processing Systems 32 (Nips 2019), Vancouver, BC, Canada, 8–14 December 2019; Volume 32. [Google Scholar]
  40. Tian, Z.; Shen, C.H.; Chen, H.; He, T. FCOS: Fully Convolutional One-Stage Object Detection. In Proceedings of the 2019 IEEE/CVF International Conference on Computer Vision (ICCV 2019), Seoul, Republic of Korea, 27–28 October 2019; pp. 9626–9635. [Google Scholar] [CrossRef] [Green Version]
  41. Zhang, S.; Chi, C.; Yao, Y.; Lei, Z.; Li, S.Z. Bridging the Gap Between Anchor-based and Anchor-free Detection via Adaptive Training Sample Selection. arXiv 2020, arXiv:1912.02424. [Google Scholar]
  42. Kong, T.; Sun, F.C.; Liu, H.P.; Jiang, Y.N.; Li, L.; Shi, J.B. FoveaBox: Beyound Anchor-Based Object Detection. IEEE Trans. Image Process. 2020, 29, 7389–7398. [Google Scholar] [CrossRef]
  43. Wang, J.; Zhang, W.; Cao, Y.; Chen, K.; Pang, J.; Gong, T.; Shi, J.; Loy, C.C.; Lin, D. Side-Aware Boundary Localization for More Precise Object Detection. arXiv 2020, arXiv:1912.04260. [Google Scholar]
  44. Nardi, C.; Talamonti, C.; Pallotta, S.; Saletti, P.; Calistri, L.; Cordopatri, C.; Colagrande, S. Head and neck effective dose and quantitative assessment of image quality: A study to compare cone beam CT and multislice spiral CT. Dentomaxillofac. Radiol. 2017, 46, 20170030. [Google Scholar] [CrossRef] [PubMed]
  45. Nardi, C.; Calistri, L.; Grazzini, G.; Desideri, I.; Lorini, C.; Occhipinti, M.; Mungai, F.; Colagrande, S. Is Panoramic Radiography an Accurate Imaging Technique for the Detection of Endodontically Treated Asymptomatic Apical Periodontitis? J. Endod. 2018, 44, 1500–1508. [Google Scholar] [CrossRef]
  46. Lee, S.; Kim, D.; Jeong, H.G. Detecting 17 fine-grained dental anomalies from panoramic dental radiography using artificial intelligence. Sci. Rep. 2022, 12, 5172. [Google Scholar] [CrossRef]
  47. Welk, J. Prediction of Canine Eruption Problems and Other Developmental Anomalies in Panoramic Radiographs Using Machine Learning. Master’s Thesis, The University of Iowa, Iowa City, IA, USA, 2021. [Google Scholar]
Figure 1. Flowchart of the study. Collected data were refined according to criteria, then labelled and fed into deep learning models, resulting in their predictions in detecting root dilacerations.
Applsci 13 08260 g001
Figure 2. Example PRs with root dilacerations. Red rectangular boxes indicate dilacerated roots that were also used as ground truths. Arrows show dilacerated roots.
Applsci 13 08260 g002aApplsci 13 08260 g002b
Figure 3. Example of test process of root dilaceration detection. Model outputs/predictions are shown in rectangular boxes with corresponding labels.
Applsci 13 08260 g003aApplsci 13 08260 g003b
Figure 4. Precision-recall curve and loss figures for two chosen models with overall high performance. ((a) for Cascade RCNN and (b) for RetinaNet). The Precision-recall curve visualizes classification performance and loss figures show how the models optimize loss.
Applsci 13 08260 g004aApplsci 13 08260 g004b
Table 1. Calculation of precision, recall, accuracy and F1 score based on confusion matrix.
Precision T r u e   P o s i t i v e T r u e   P o s i t i v e   +   F a l s e   P o s i t i v e
Recall (sensitivity) T r u e   P o s i t i v e T r u e   P o s i t i v e   +   F a l s e   N e g a t i v e
Accuracy T r u e   P o s i t i v e   +   T r u e   N e g a t i v e A l l   p r e d i c t i o n s
F1 Score 2     T r u e   P o s i t i v e 2     T r u e   P o s i t i v e   +   F a l s e   P o s i t i v e   +   F a l s e   N e g a t i v e
Table 2. Equations for average precision and mean average precision.
Average PrecisionMean Average Precision for n-Classes
A P t h r e s h o l d = 0 1 p x d x m A P t h r e s h o l d = 1 n i = 1 n A P i
Table 3. Detection results of deep learning models for the presence of root dilaceration. mAP refers mAP when IOU is 0.5. A, P and R stand for accuracy, precision and recall, respectively. T-Time refers to how long it takes to train each model.
Detector—BackbonemAPAPRF1 ScoreT-Time
Cascade RCNN Resnet1010.90.720.830.840.835 h-28 m
Faster RCNN Resnet1010.840.620.910.660.774 h-11 m
RetinaNet Resnet500.890.720.90.780.832 h-54 m
Yolov3 DarkNet530.870.630.720.820.772 h-38 m
SSD0.680.480.660.650.653 h-31 m
RegNetx0.850.690.770.860.824 h-15 m
Libra RCNN Resnext1010.870.670.910.720.8016 h-02 m
Deformable CNs0.830.620.760.770.768 h-52 m
DetectoRS Resnet500.830.640.830.740.7813 h-55 m
Dynamic RCNN Resnet500.870.70.830.810.823 h-13 m
NAS FPN0.850.690.880.760.812 h-32 m
Grid RCNN Resnext1010.830.640.770.790.7812 h-33 m
HTC RCNN Resnext1010.890.670.790.810.8011 h-00 m
Faster RCNN with WS BCN0.850.640.710.870.783 h-47 m
FreeAnchor Resnet500.920.560.910.590.723 h-7 m
FCOS Resnet50 Caffe0.890.620.720.810.767 h-31 m
ATSS Resnet1010.920.660.810.780.87 h-14 m
FoveaBox0.890.690.880.760.814 h-36 m
SABL0.880.630.840.710.777 h-00 m
Table 4. Comparisons with previous studies. Task indicates what kind of application was performed among classification, detection and segmentation. Metrics shows what kind of evaluation metrics were reported in the corresponding studies.
AuthorTaskType of ImageModelData SizeMetrics
Lee et al.Detection—dental anomalyPanoramicFaster RCNN23,000Precision: between 42–74%
Sensitivity: between 27–100%
Specificity: between 89–99%
WelkClassification—dental anomalyPanoramicResNet-18
VGG11
ResNet-50
VGG16
Inception v2
Inception v3
1964Sensitivity (recall): 0.47
Specificity: 0.59
F1 score: 0.28
Accuracy: 0.57
This workDetectionPanoramic19 Deep Learning Models636mAP
Accuracy
Precision
Recall
F1 Score
Time Duration
Disclaimer/Publisher’s Note: The statements, opinions and data contained in all publications are solely those of the individual author(s) and contributor(s) and not of MDPI and/or the editor(s). MDPI and/or the editor(s) disclaim responsibility for any injury to people or property resulting from any ideas, methods, instructions or products referred to in the content.

