4.1. Change the Law of Secondary Lining Strain
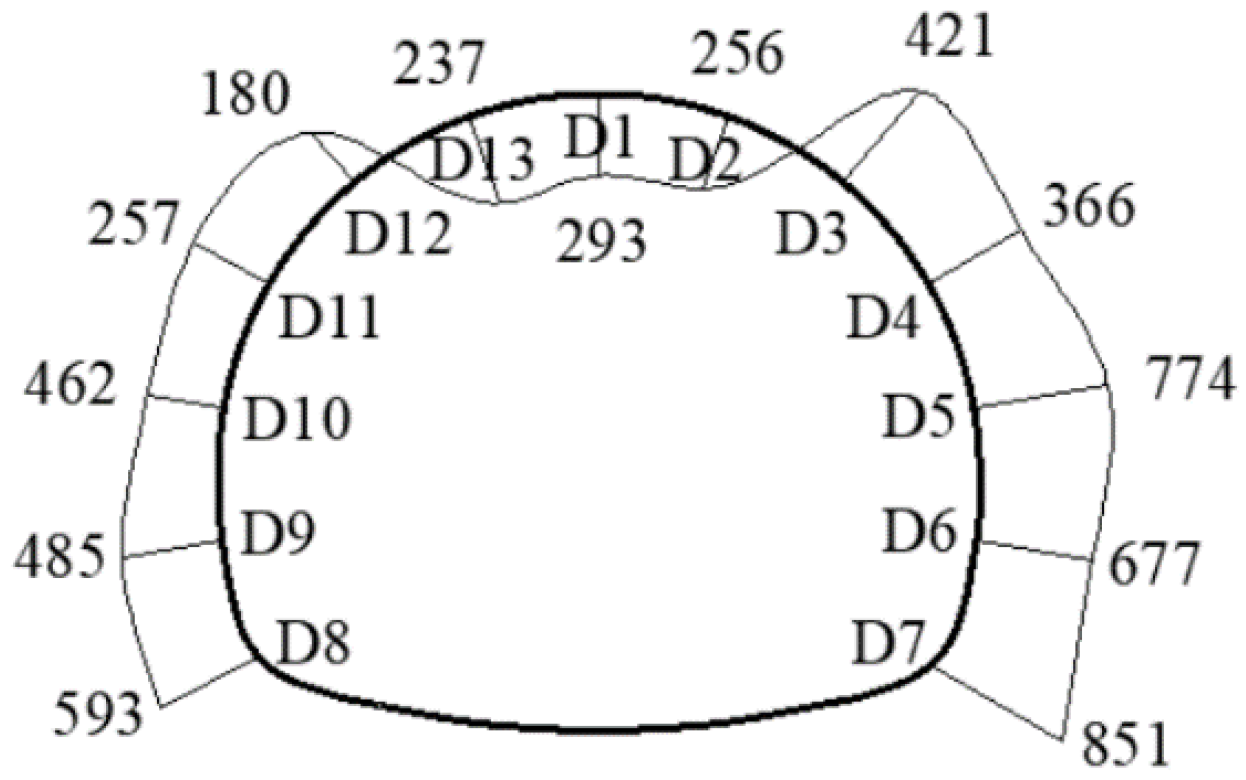
After the monitoring was completed, the monitoring results showed that the strain growth curves at different positions of the secondary lining structure were quite different. To highlight the internal force variation characteristics of the arch, arch shoulder, arch foot, and inverted arch of the tunnel, the monitoring data were sorted out and analyzed in three areas, and seven representative cross-sections were selected from the three areas after data sorting for analysis. The selected seven measuring points were 1, 4, 11, 5, 10, 7, and 8, which, respectively, represent the vault, arch shoulder, arch wall, and arch foot.
Figure 4 and
Figure 5, respectively, show the strain changes with time at each measuring point on the outside and inside of the section. In
Figure 9 and
Figure 10, the positive values of the ordinate represent tension, and the negative value represents compression.
Table 2 summarizes the tension and compression conditions at different monitoring points at the beginning and end of the monitoring period, as well as the final monitoring value at each point. The analysis results are as follows.
(1) In terms of tension and compression, the comprehensive analysis of
Figure 9 and
Figure 10, and
Table 2 shows that the outer side of the vault area was under compression and the inner side was under tension, and N1 had a maximum tensile strain of 488 με during the monitoring period. The outer side of the arch shoulder area was always in a state of compression, and the inner side was in a state of tension at the initial stage of monitoring, and quickly changed to a state of compression as time passed. The outer side of the arched waist area was under compression at the initial stage of monitoring, and then gradually transformed into tension over time, while the inner side was always under compression.
The tension and compression conditions of the left and right measuring points at the arch foot were different. Measuring point 7 at the arch foot was under compression both inside and outside at the initial stage of monitoring, and in the later stage of monitoring, measuring point 7 was under tension on the outside and compression on the inside. During the monitoring period, the maximum compressive strain of 657 με was observed at N7, and point 8 was compressed both medially and laterally during the monitoring period. According to the data, the stress of the steel bar at the W8 position remained unchanged, and it was judged that the sensor was damaged. The reason for this may have been the stress concentration at the arch foot position. Its pressure value was too large; therefore, the sensor here was damaged.
The cross-section of the arch shoulder area was under full-section compression, which can give full play to the compressive capacity of the concrete. Compared with other areas, this area is safer and played a role in load transmission in the overall secondary lining structure.
During the monitoring of the position of the arch waist and arch toe of the tunnel, the final stress is in a state of compression on the inside and tension on the outside, and the value of the compressive strain on the inside was very large. The results showed that the lower structure of the tunnel was subjected to a large vertical load transmitted by the upper part, but because the lateral pressure of the surrounding rock on the tunnel structure was small, the tunnel structure was in a state of extrusion deformation at the side wall. Thus, the outer reinforcement shows tensile stress.
(2) In terms of strain changes, the strain of the outer side of the vault W1 was always in a state of development with a gradually decreasing growth rate. In the first three months of monitoring, the strain value reached 84% of the final monitoring value. However, within the monitoring time range, the strain curve had not stabilized, indicating that the surrounding rock pressure at the vault position was still developing. The strain on the inner side of the vault, N1, exhibited three developmental stages over time: the early load-bearing stage (1 d–50 d), the rapid development stage (50 d–90 d), and the slow development stage (90 d–). In the early load-bearing stage, the strain value of N1 is very small, and the growth rate changes little over time. As time progresses, the strain curve undergoes a sudden change, entering the rapid development stage. As can be seen in
Figure 5, the strain value at the point of sudden change when N1 enters the rapid growth stage is approximately 50 με. In the later stages of monitoring, the strain curve enters the slow development stage, with the strain value gradually increasing over time, but the rate of increase is very small. According to the obvious three-stage development of the steel bar strain curve in the tension area of the vault position, it can be known that the concrete and steel bars in the secondary lining tension area in the early bearing stage are under tension together, and the tensile strain of the steel bar is approximately equal to the tensile strain of the concrete at this time, the strain growth at this stage is relatively slow; as the external load gradually increases, the tensile strain also gradually increases. When the tensile strain value of the steel bar exceeds the ultimate tensile strain of the concrete, the concrete will crack, and the concrete in the tension zone will no longer be Under tensile stress, the sudden change point of the curve is the ultimate tensile strain of concrete. After the strain enters the rapid development stage, the stress in the tension area is borne by the steel bars, and the height of concrete cracks becomes larger and larger; after entering the slow growth stage, the surrounding rock pressure on the vault position will increase slowly, and the strain of the steel bars in the tension area will increase It also gradually decreases, and the cracking of concrete will not develop further.
The change in the strain value of the outer side of the arch shoulder W4 and W11 was characterized by rapid growth in the early load-bearing stage. The rapid growth stage lasted for about a month, and then it tended to stabilize. The final strain value of the outer rebar remained around 65 με, which was very small compared to the stress values of N4 and N11. The rate of strain increases on the inner side of the arch shoulder and gradually decreased with the passage of time, and the strain could reach 75% of the maximum value in the first 90 days of monitoring. The strain value tended to stabilize in the later stage of monitoring. According to the strain values of the inner and outer steel bars, it can be seen that the stress state of the arch shoulder area section was in full section compression, which could fully utilize the compressive capacity of concrete.
The increase in the strain of the inner rebar at the waist and foot of the arch gradually decreased over time, but the strain curve did not stabilize within the monitoring time range, similar to the change pattern at the top of the arch, indicating that the surrounding rock pressure is still in the development stage. With the change of time, the state of the rebar strain at different positions was relatively complex, and the state was mainly affected by the self-weight of concrete, surrounding rock pressure, load of formwork trolley, and shrinkage creep of concrete. In the later stage, with the increase of surrounding rock pressure, the surrounding rock pressure became the dominant load, and the change rules of rebar strain at each section gradually tended to be unified.
4.4. Safety Evaluation of the Secondary Lining
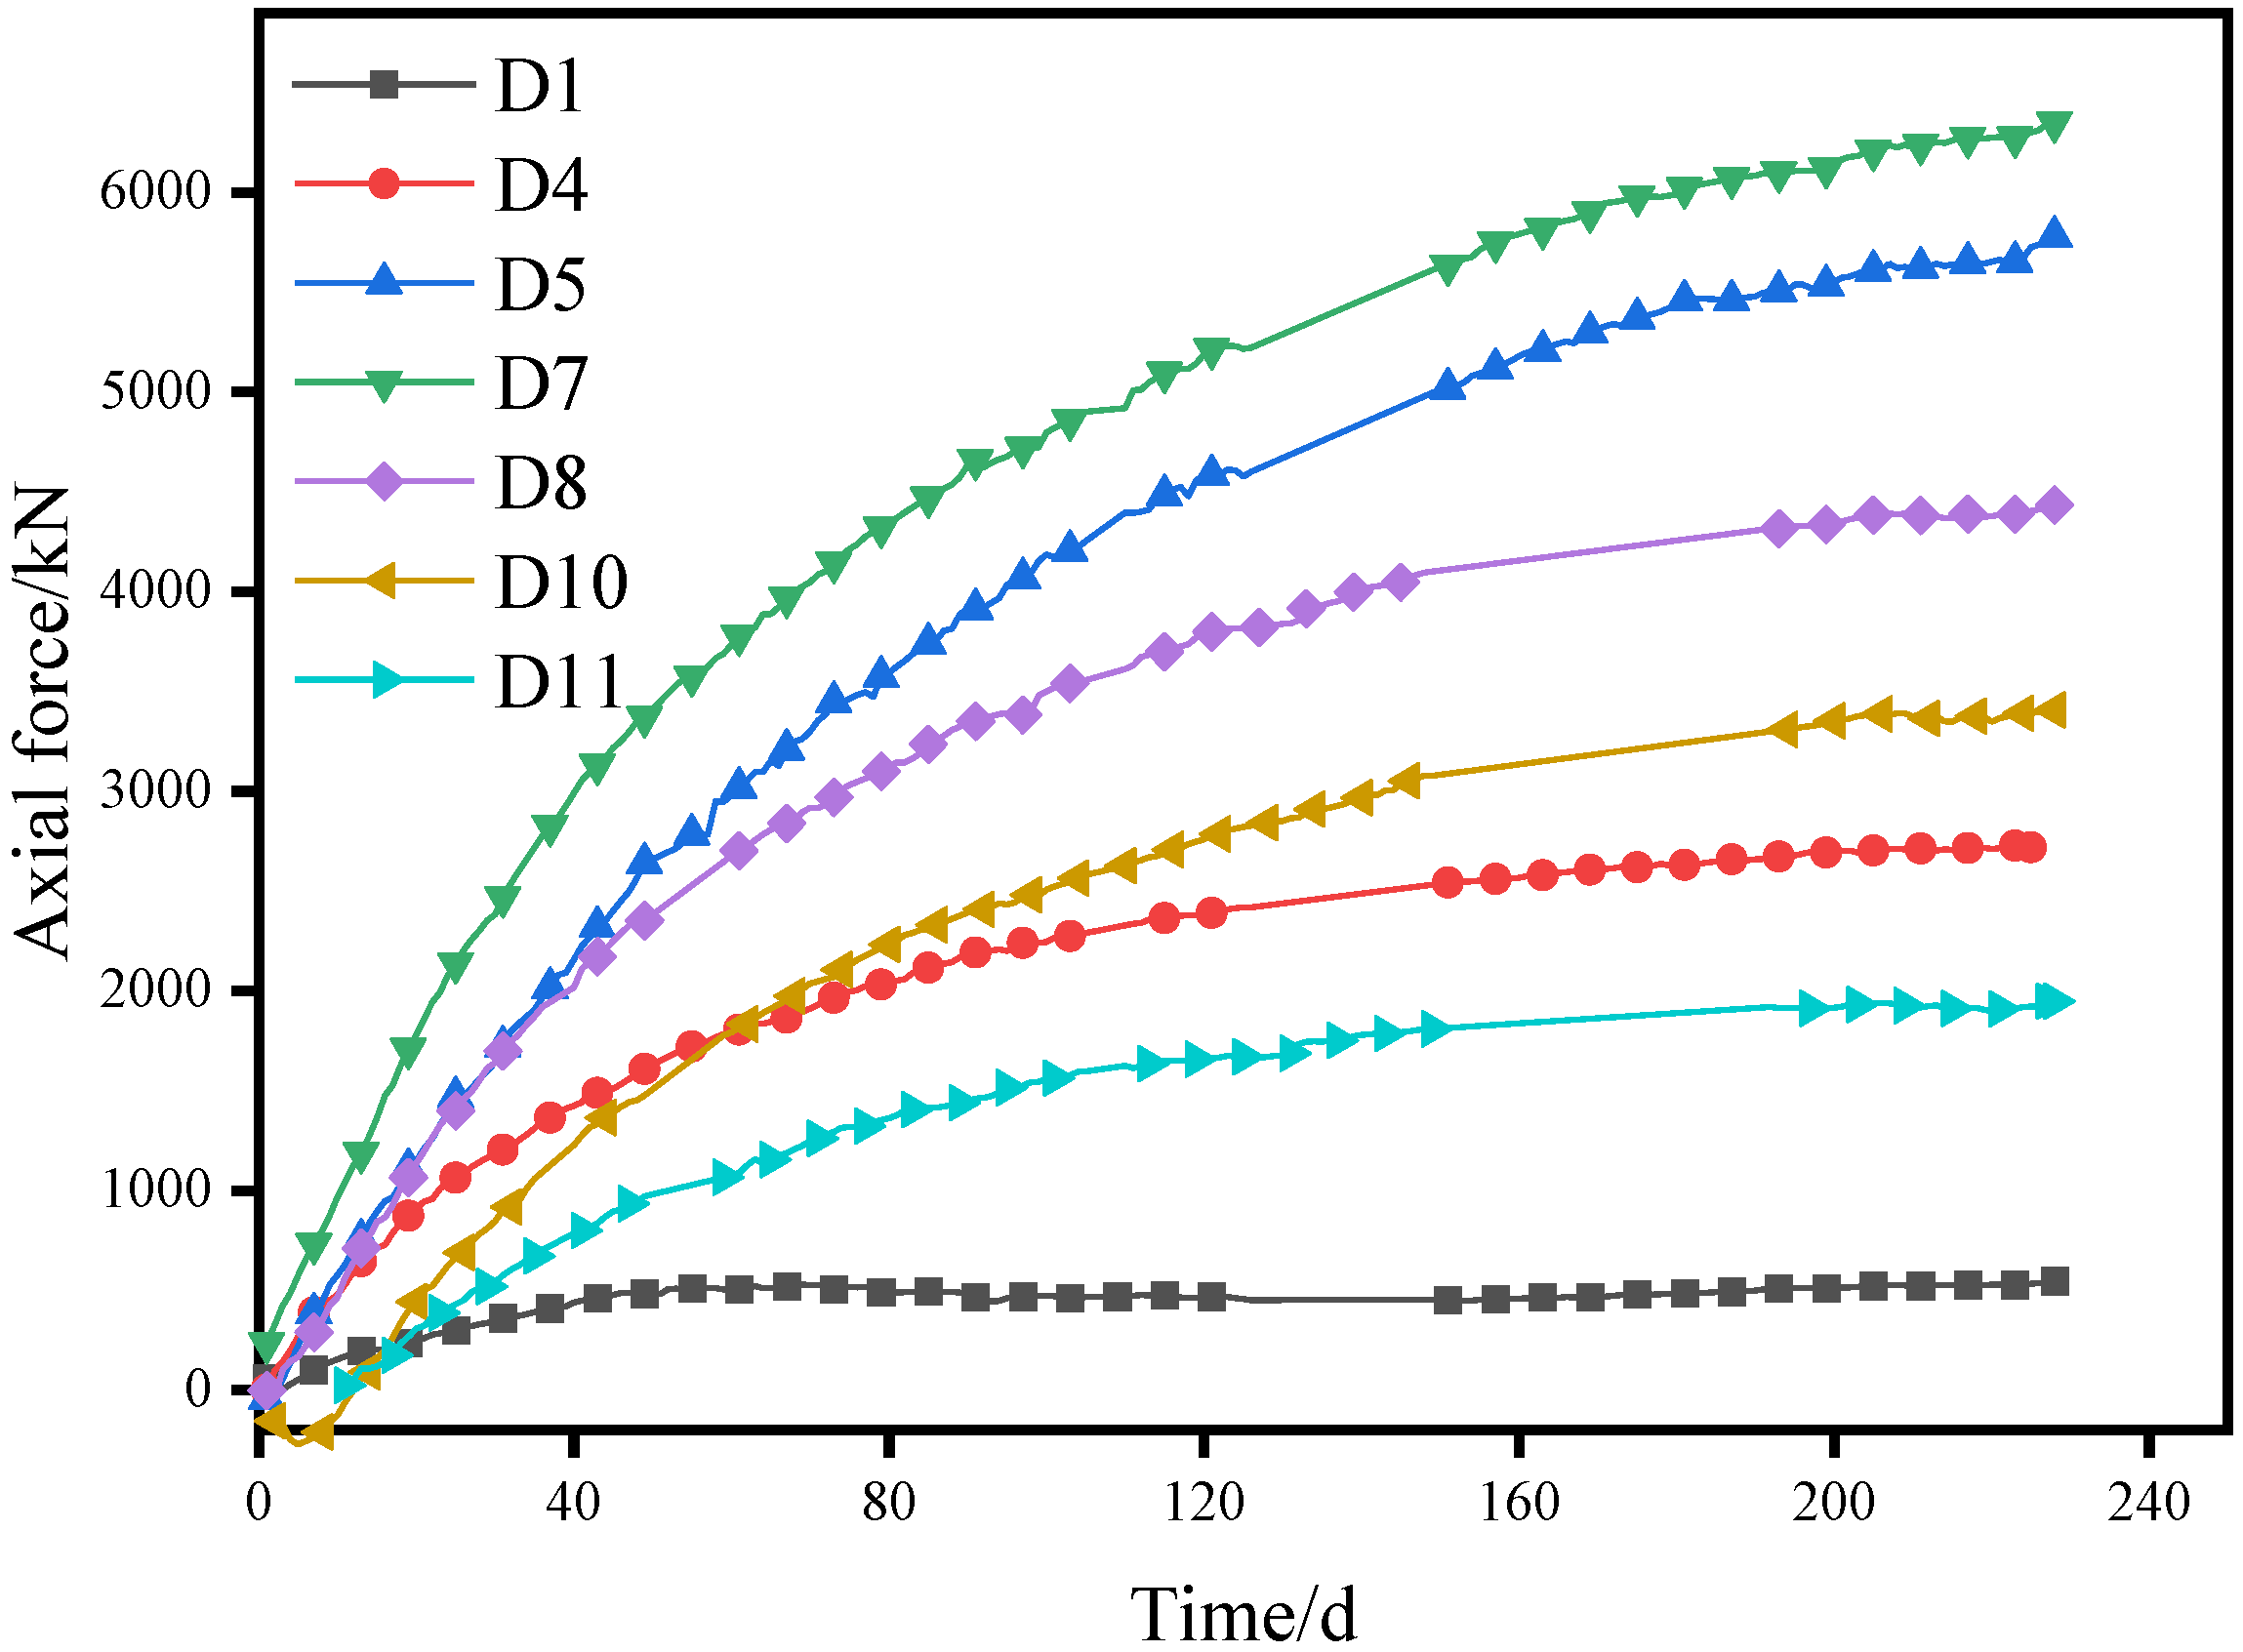
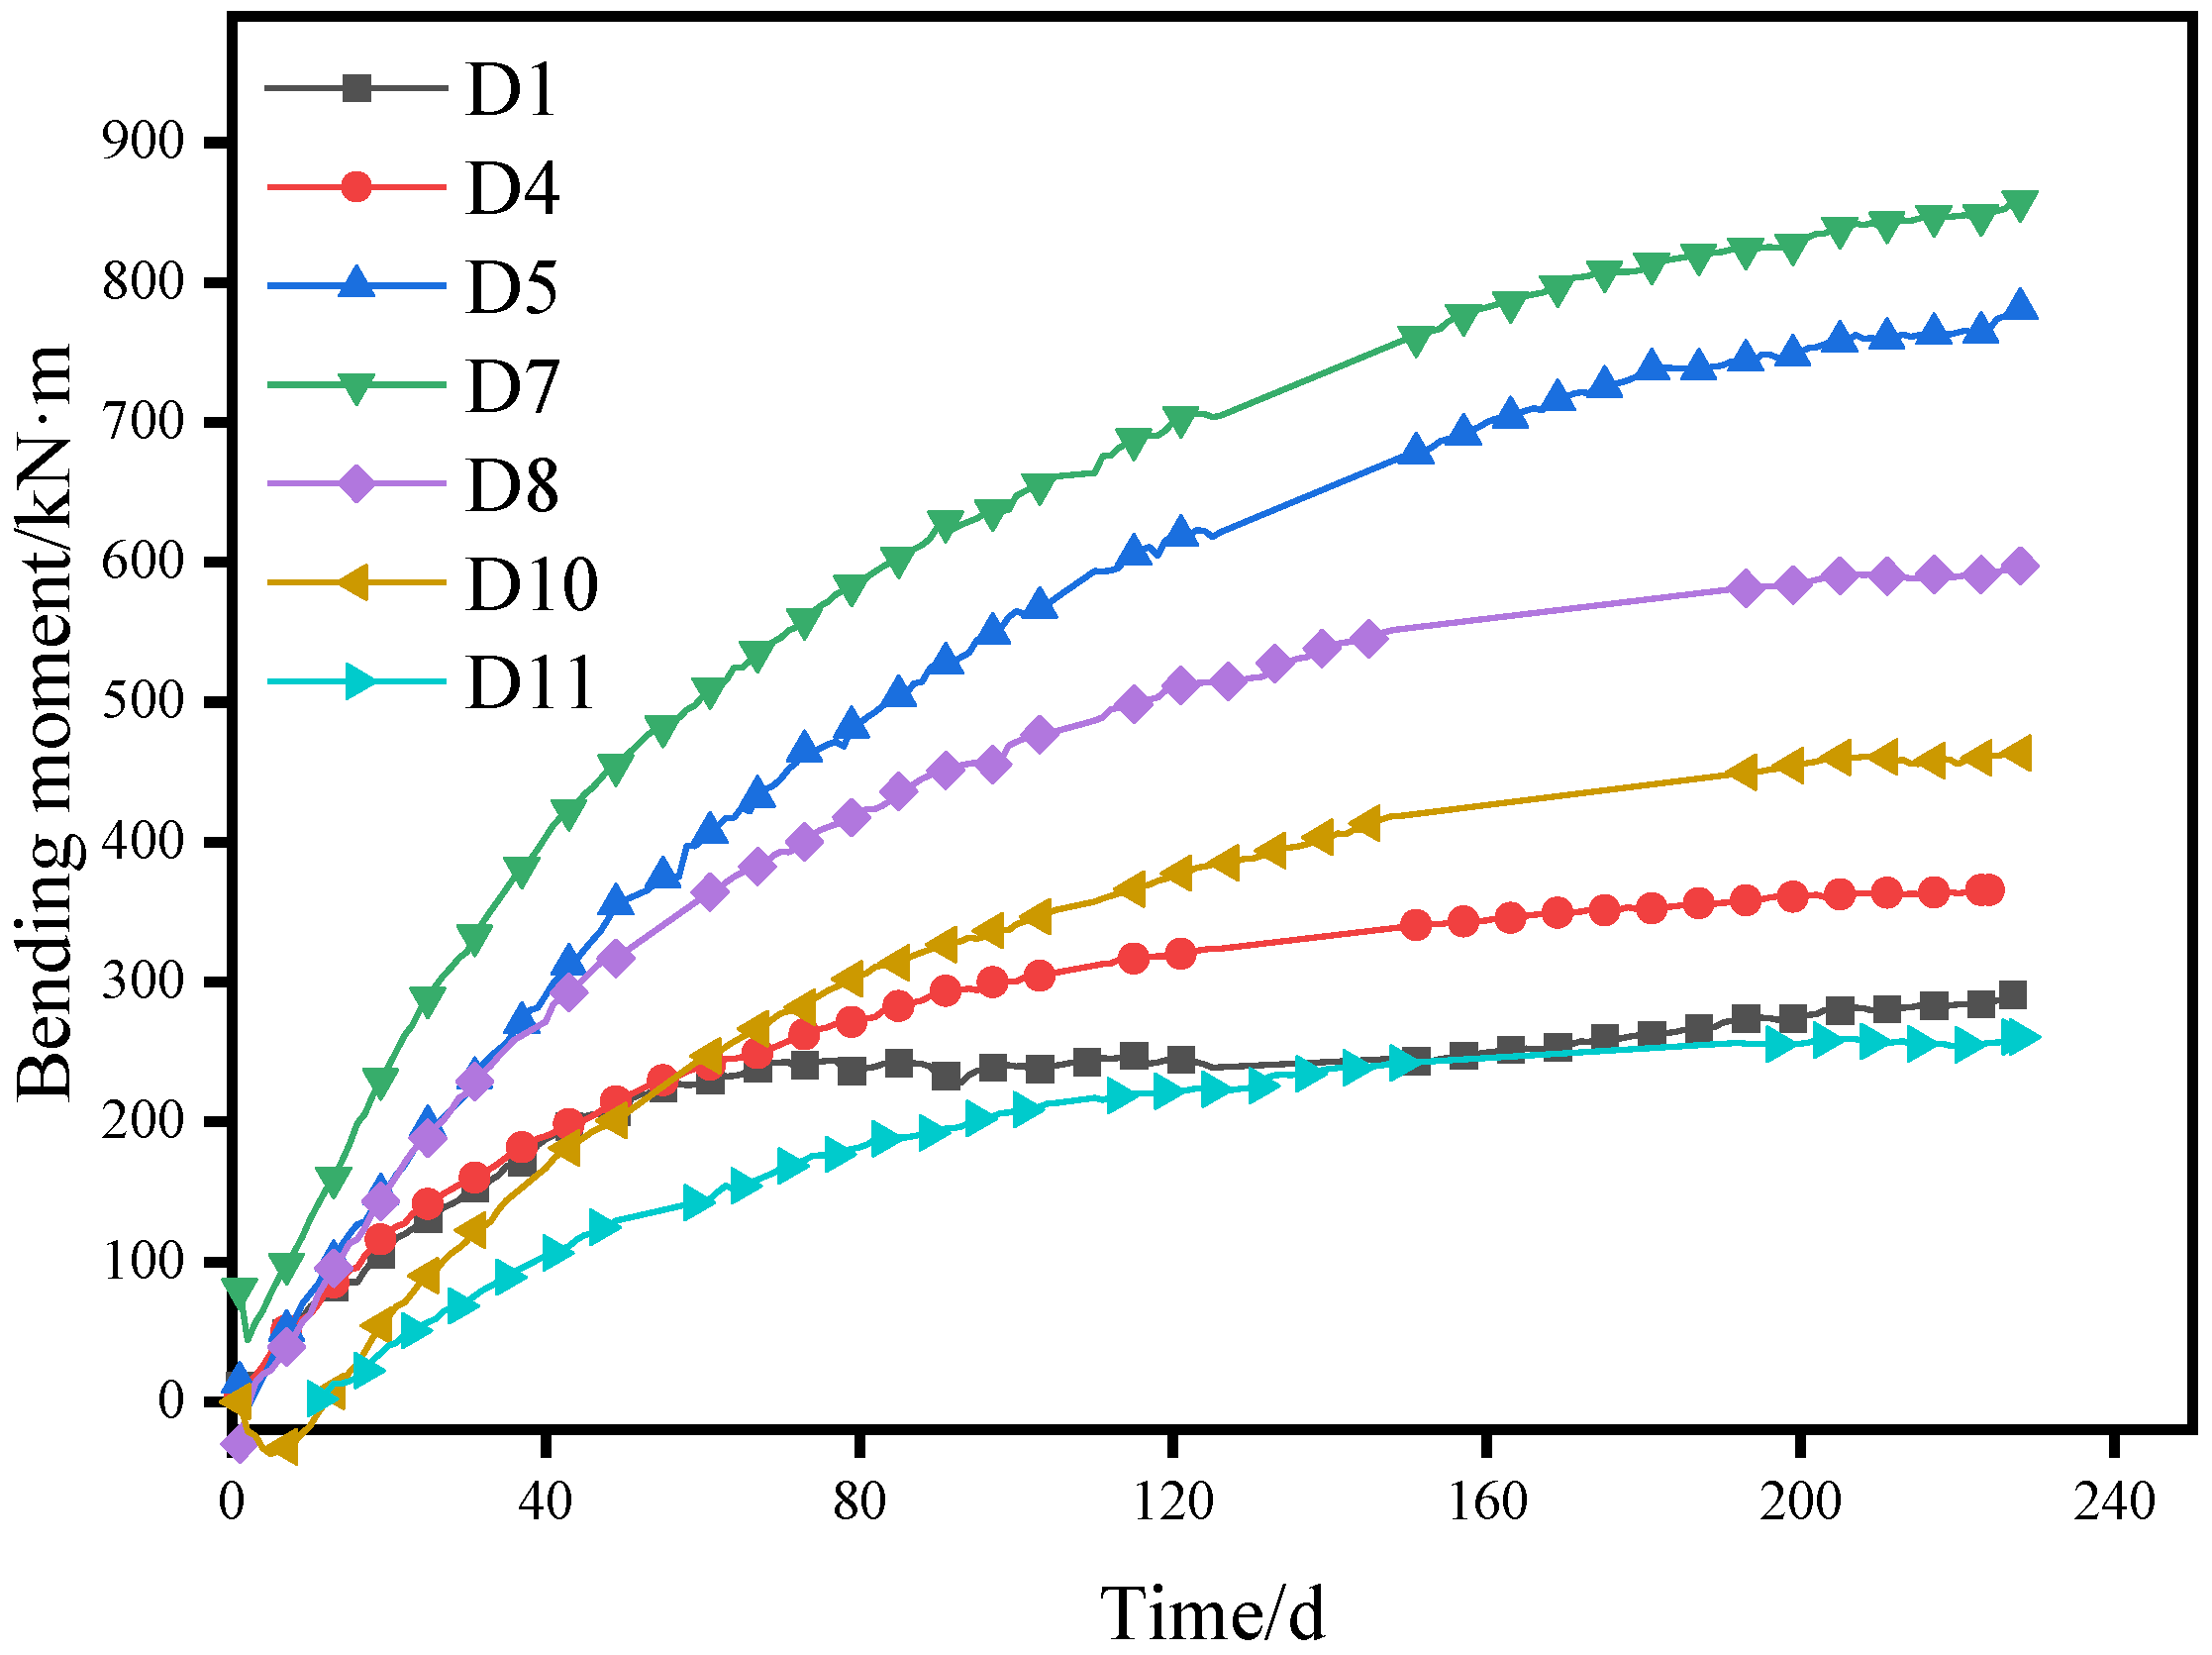
Based on the bending moment axial force data obtained above, we can calculate the safety factor of the secondary lining structure of the tunnel according to the safety factor calculation method introduced above. Through the safety factor, we can determine the dangerous area on the secondary lining section. At the same time, a reasonable evaluation of the long-term safety of the secondary lining can be further carried out according to the development of the safety factor, as well as a more accurate evaluation of whether the secondary lining is in a safe state.
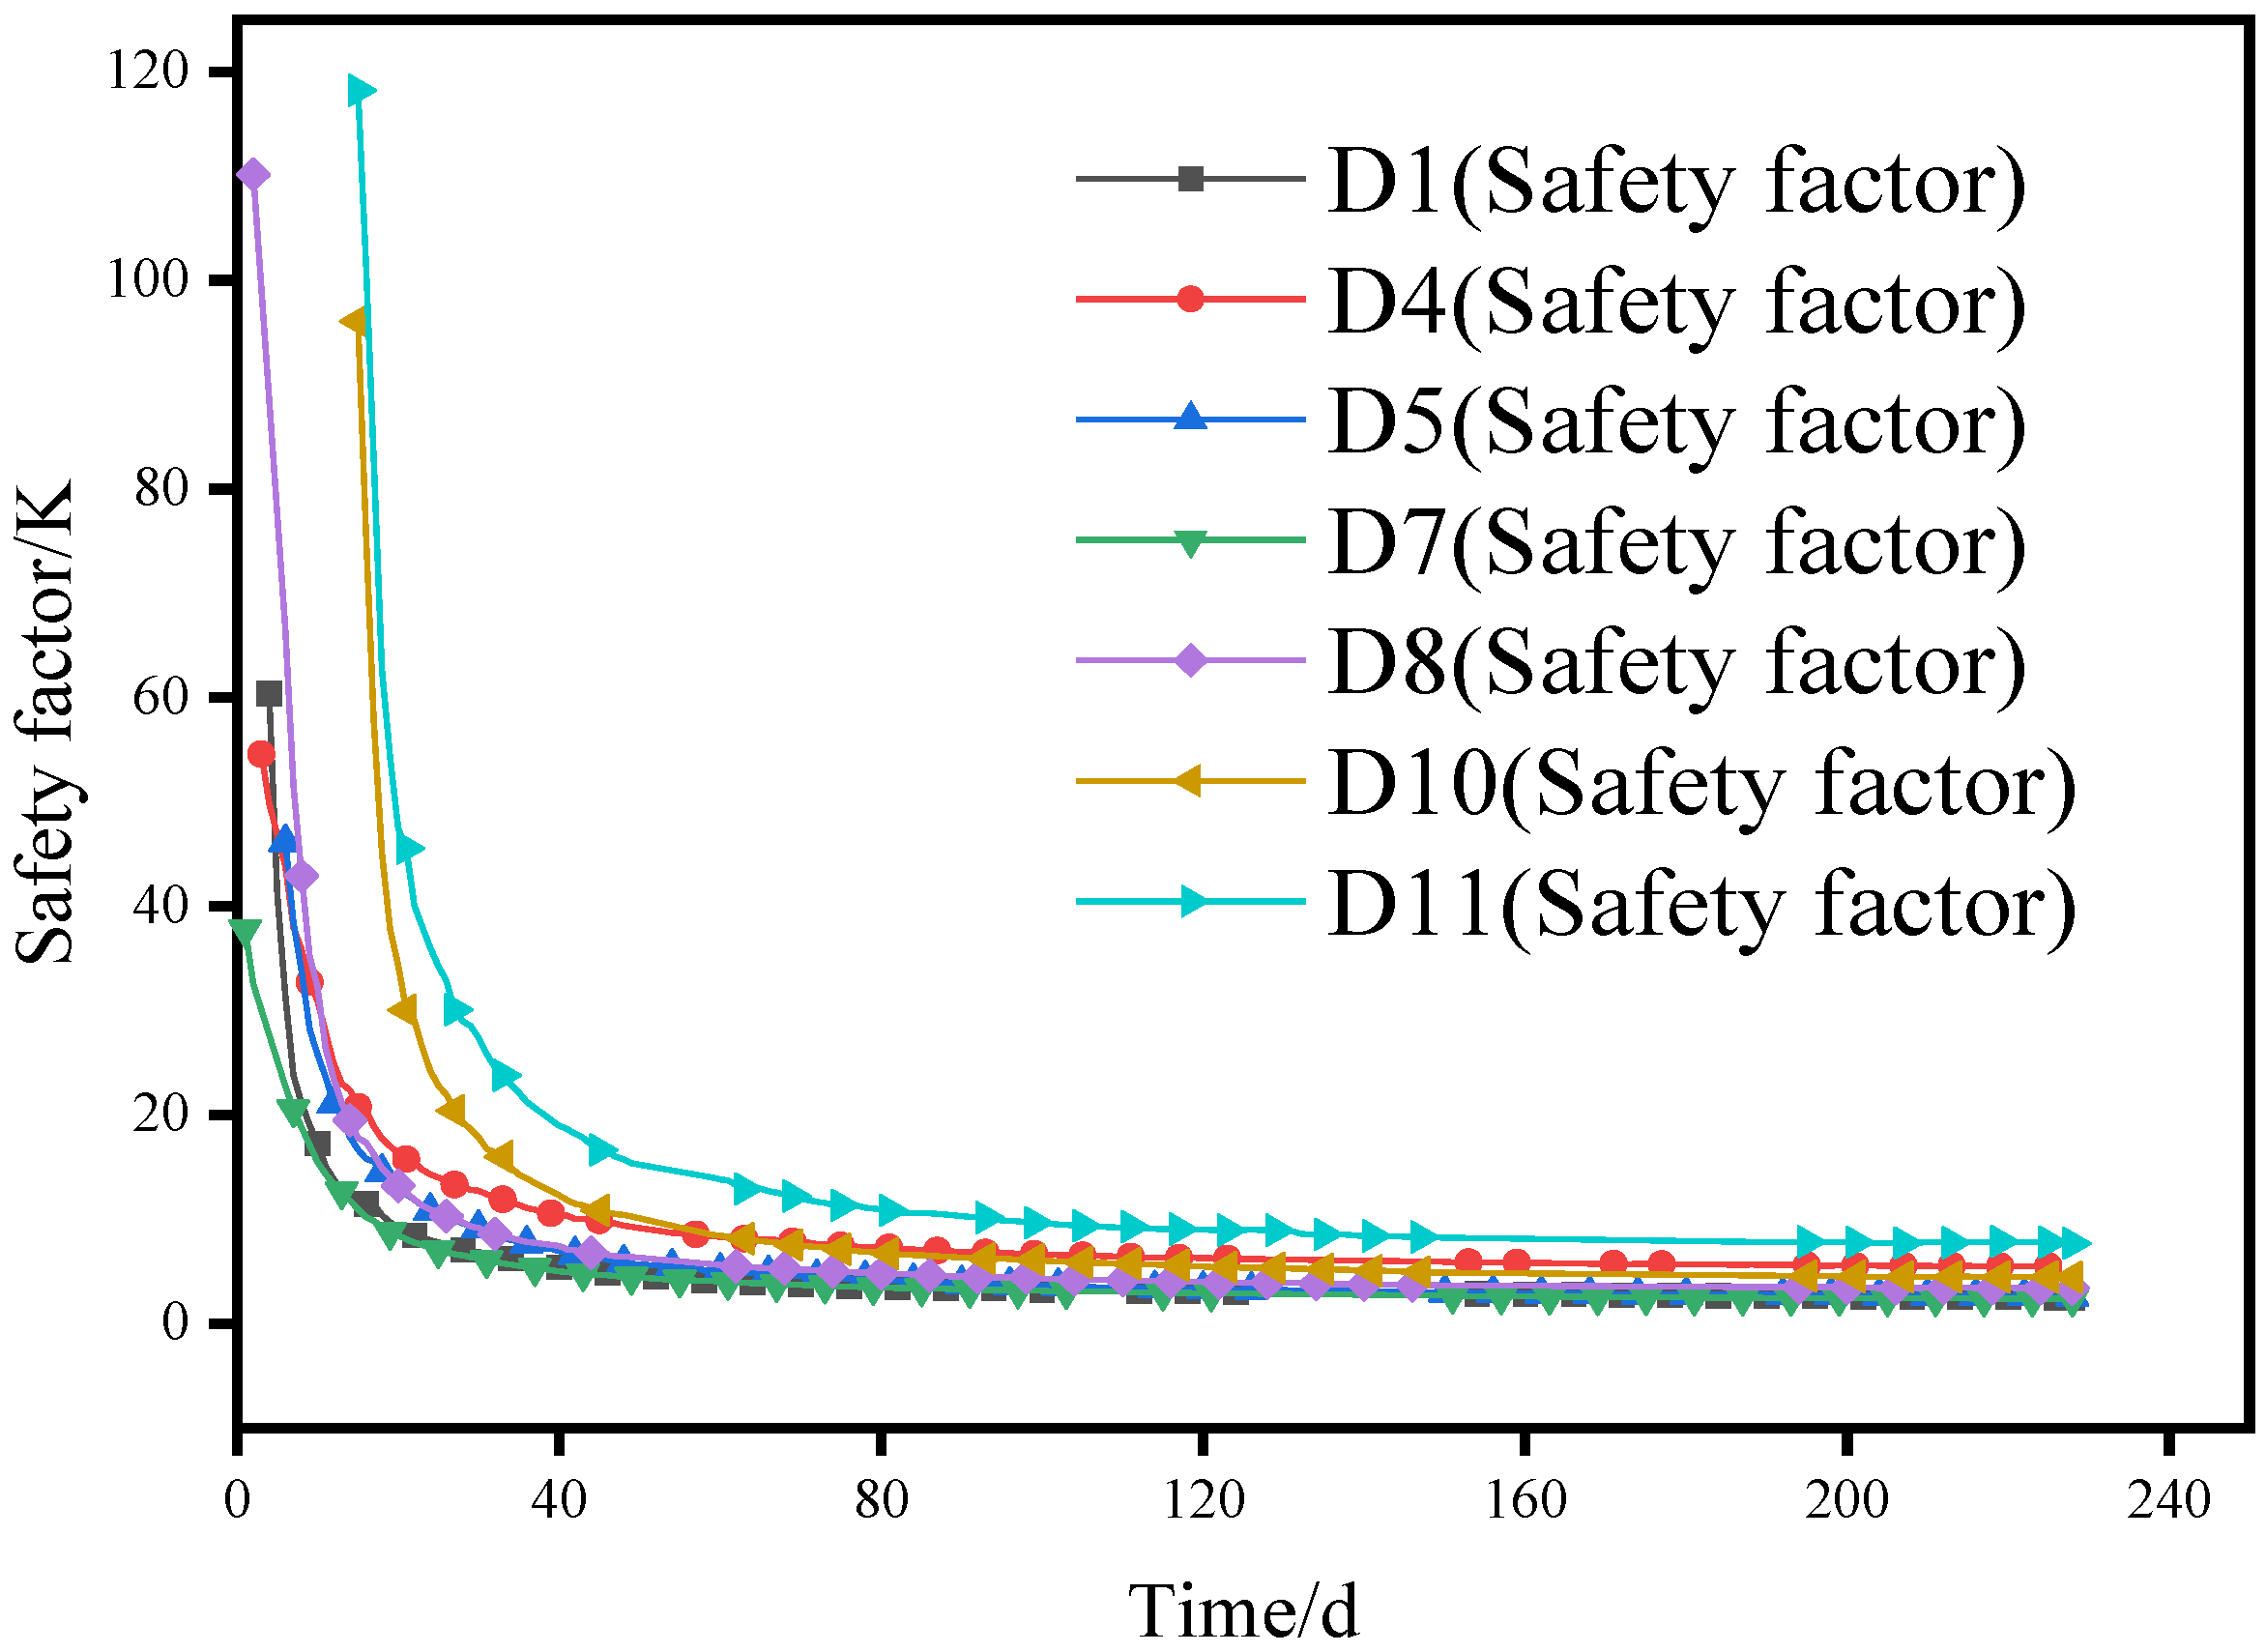
It was found through a calculation that the structure in the vault area was in a state of large eccentric compression. Therefore, the safe state of the section was mainly controlled by the yield limit tensile stress of the steel bars in the tension area. Equation (7) was used to calculate the value of the safety factor. The sections in the arch shoulder area and the arch foot area were in a small eccentric compression state, and the safe state of the section was mainly controlled by the ultimate compressive strength value of the concrete in the compression area. Therefore, Equation (9) is used to calculate the safety of the section in the area coefficient. The safety factor at different time points of the seven measuring points selected above during the monitoring period was calculated, and the change curve concerning time was drawn, as shown in
Figure 17.
As shown in
Figure 17, the safety factor of seven representative measuring points in the entire section of the secondary lining structure changed with time. The safety factor value of the curve in the figure decreased rapidly from the maximum value at the beginning of monitoring in a short period. The vault area was in a state of large eccentric compression, with a safety factor limit value of 2.4, and the rest of the sections are in a small eccentric compression state, with a safety factor limit value of 2.0.
According to the calculated value of the safety factor, it can be seen that the safety factor value of the measuring point D11 at the arch shoulder was the largest, and the safety factor was still 7.68 at the end of the monitoring, which is still far higher than the limit value of the safety factor of 2.0. The safety factor of D1 and D7 were small, and the safety factors at the end were 2.49 and 2.37, which are closer to the critical value of the safety factor. Therefore, it is necessary to focus on the secondary lining safety inspection at the end of the monitoring period. During the monitoring period, the safety factor value of each section is always decreasing, and the values all approach the limit value of the safety factor required by the code. However, within the time frame of the structural monitoring for all cross-sections, the safety degree of the structure is within the range required by the code, indicating that the structure was still in a safe state during the monitoring stage.
4.5. Regression Analysis
By combining the development trend of the internal force curve in the tunnel and the change trend of the safety factor, it can be seen that the internal force of the tunnel structure was still increasing, and the safety factor of the structure was still changing. Therefore, in the later stage of tunnel structure operation, it was impossible to determine whether the safety factor of the secondary lining structure was still within the limit range specified by the regulations. Further research and analysis on the long-term safety of tunnel structures are needed. The reliability of the regression analysis of loess tunnel surrounding rock deformation prediction in reference [
17] was combined with the development trend of the safety factor scatter plot. The fitting function selected for safety factor
is:
where:
is the safety factor;
is the time;
,
,
,
,
are coefficients.
This article used Origin software for the regression analysis and prediction. Regression analysis was performed on the safety factor data of the seven selected measurement points. The calculation results of the safety factor fitting function of each measurement point are shown in
Table 4.
From the regression analysis results, it can be seen that the exponential function fit well with the results of different measurement points, and the correlation coefficients were all above 0.99, which proves that the change law of the safety factor conforms to the exponential function law. Since the exponential function is a bounded function, it is possible to make a reasonable prediction of the final value of the safety factor based on this function, and then evaluate the future safety of the tunnel based on whether the final predicted value is less than the critical safety factor value.
The two dangerous areas mentioned above were the vault measurement point 1 and the arch foot measurement point 7, and the final predicted values of their corresponding regression equations were 2.83421 and 2.36814, respectively. Their final predicted values were all greater than the critical safety factor value 2 of the corresponding area, which meets the tunnel safety standards. Therefore, we can reasonably predict that the Yulinzi Tunnel will still be in a safe state in the future.


