A New Approach for Predicting the Rheological Properties of Oil-Based Drilling Fluids under High Temperature and High Pressure Based on a Parameter-Free Method
Abstract
:1. Introduction
2. Rheology Experiment on Oil-Based Mud
2.1. Experimental Equipment
2.2. Experimental Design
2.3. Experimental Result
3. Model Establishment
3.1. Model Building
3.2. Examples of Shear Stress Prediction
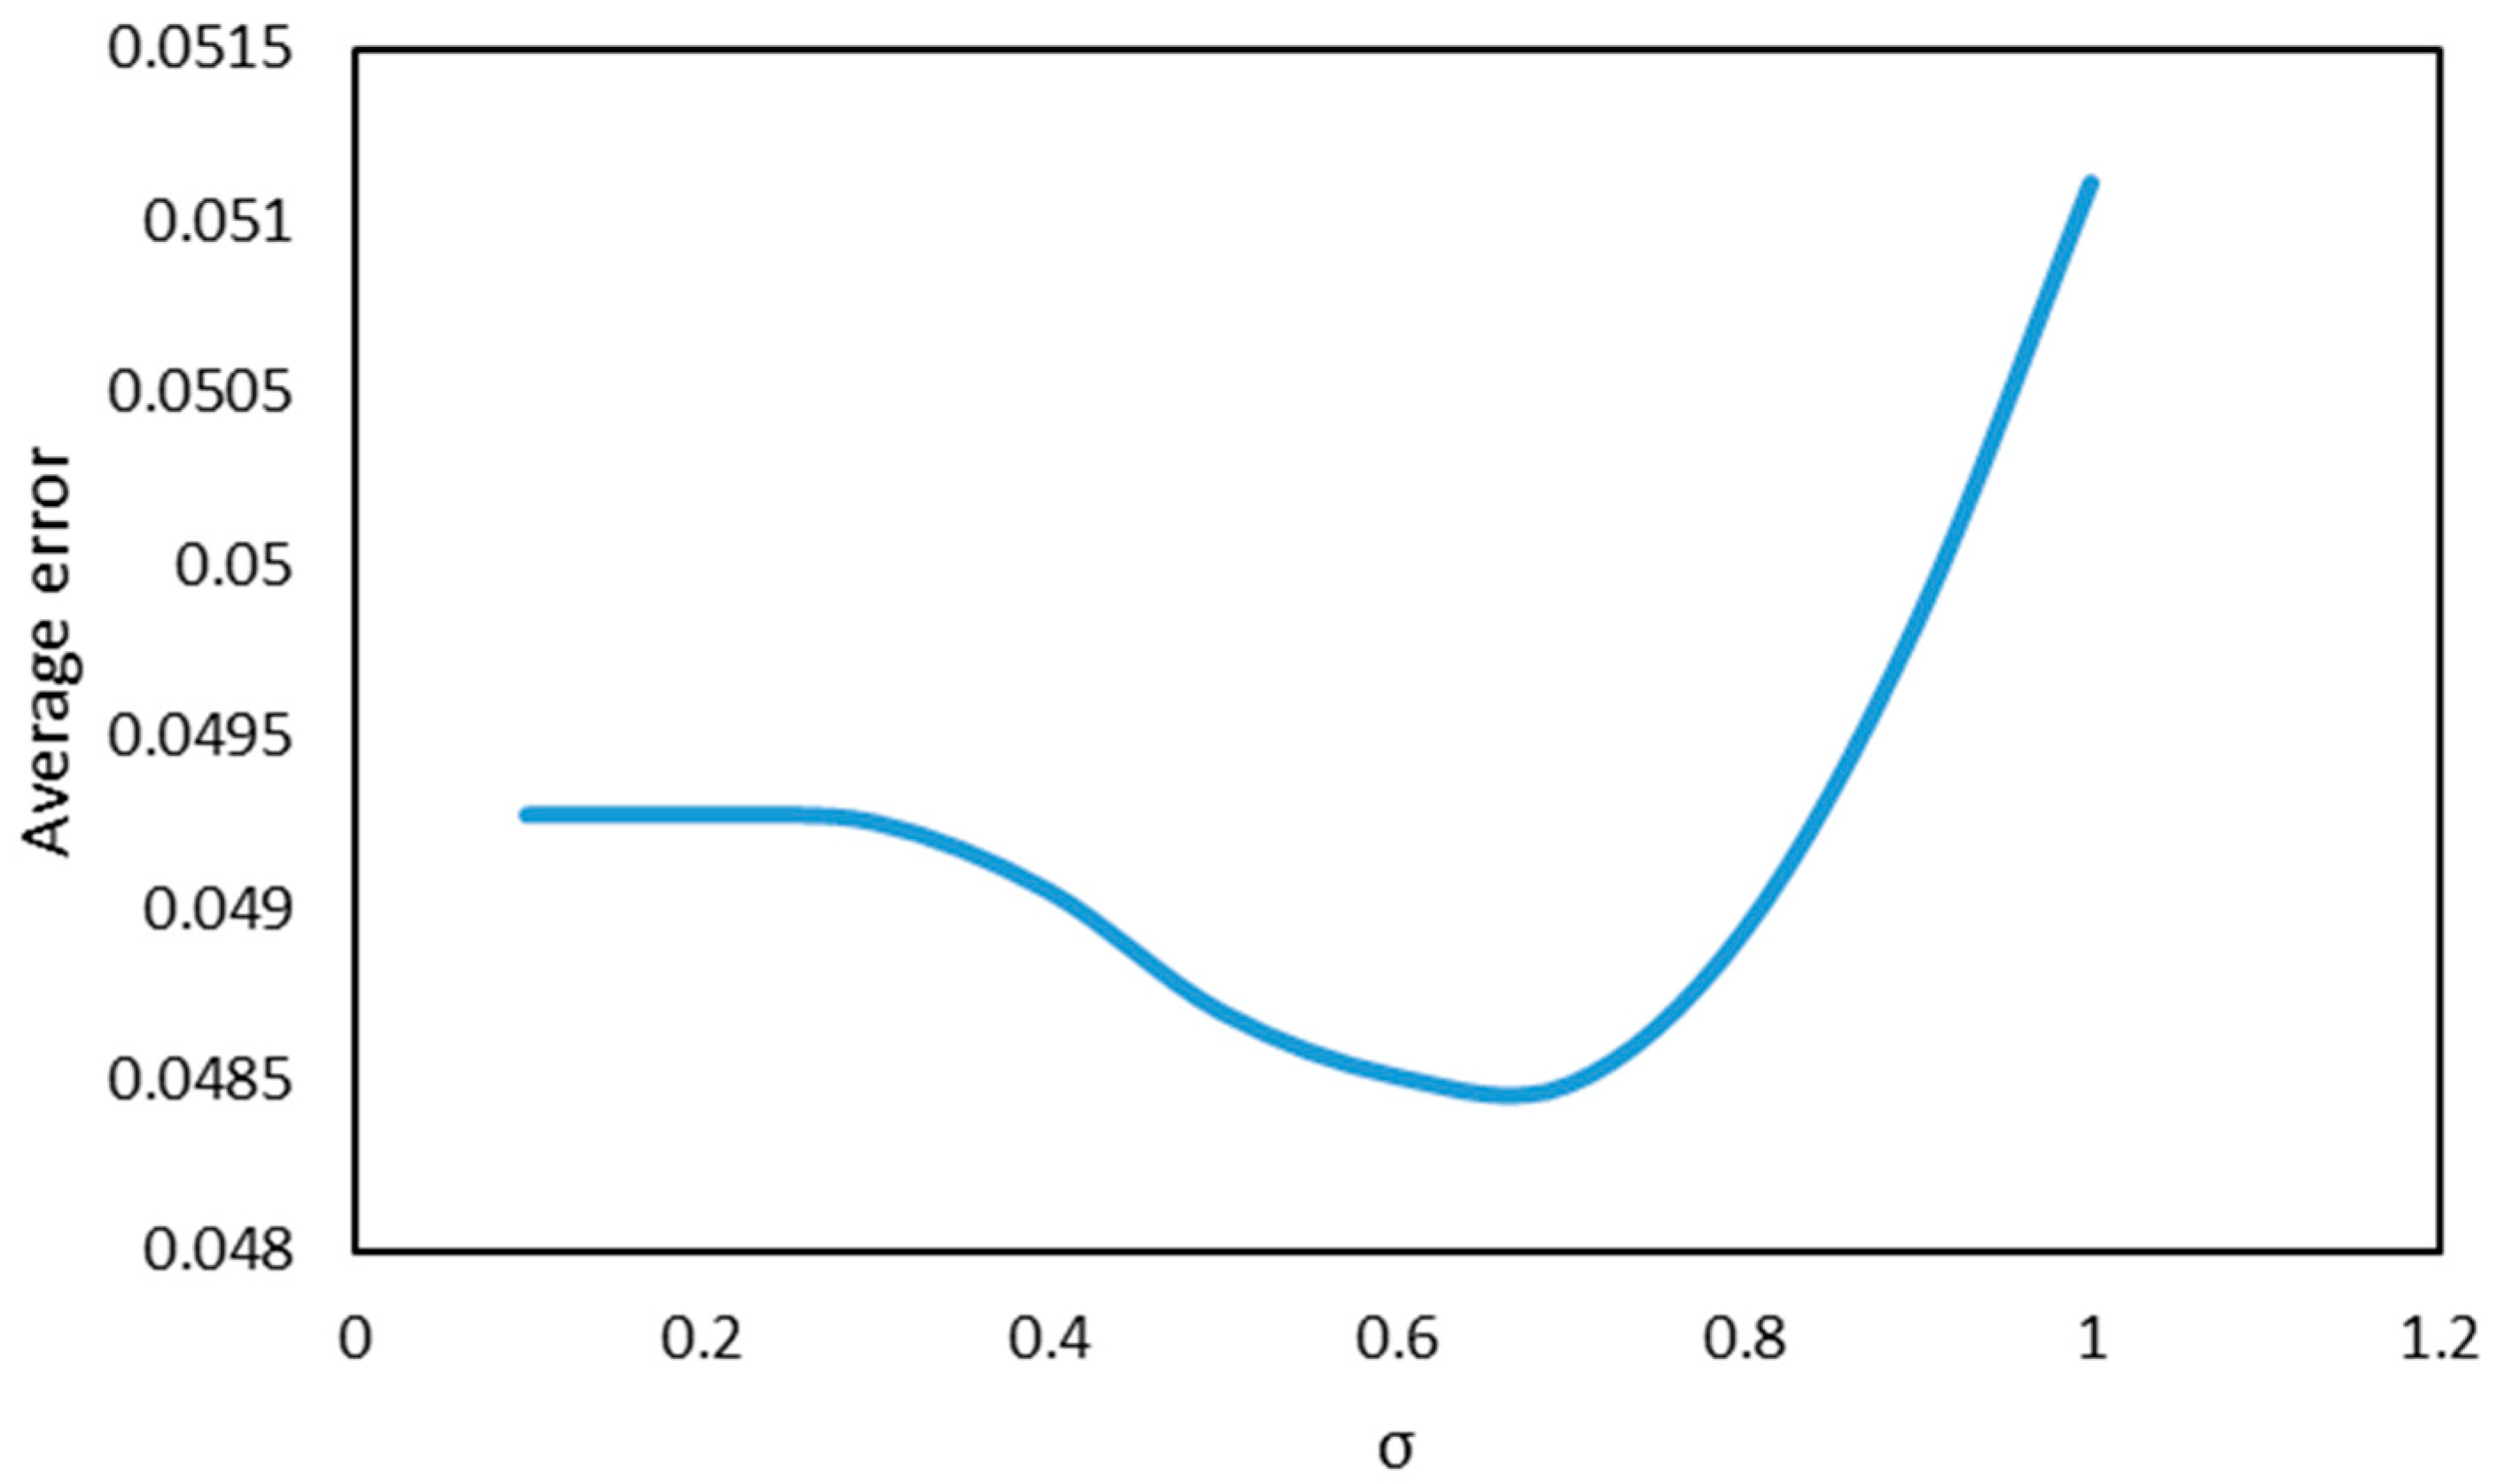
3.3. Parameter Determination
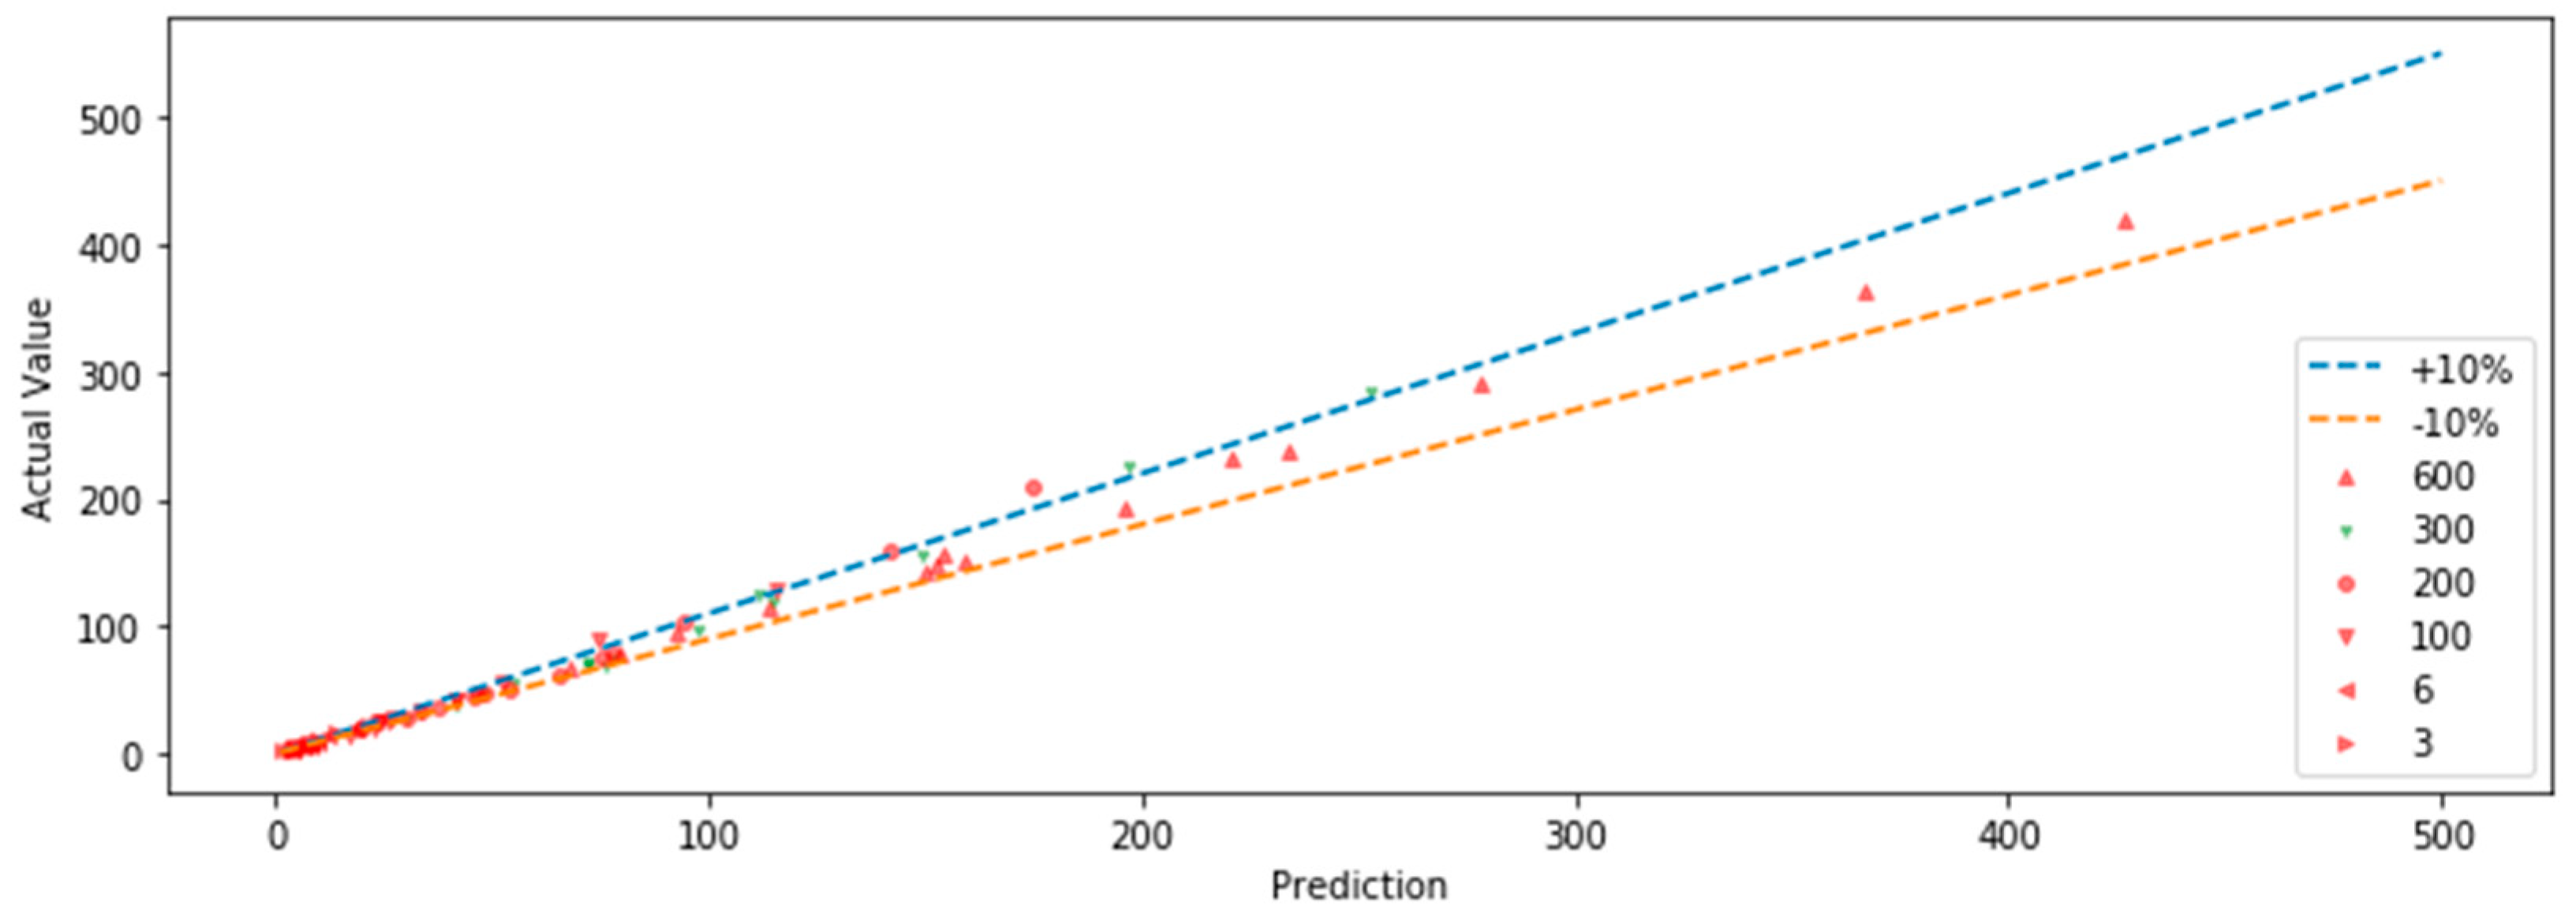
3.4. Rheological Prediction
- (1)
- (Measure or collect the six-speed viscometer data of the drilling fluid that need to be predicted;
- (2)
- Determine the temperature and pressure that need to be predicted;
- (3)
- Calculate the weight matrix of 3 rpm, 6 rpm, 100 rpm, 200 rpm, 300 rpm, and 600 rpm under the specified temperature and pressure conditions based on Formula (5);
- (4)
- Calculate coefficient matrices of 3 rpm, 6 rpm, 100 rpm, 200 rpm, 300 rpm, and 600 rpm under specified temperature and pressure conditions based on Formula (4);
- (5)
- Calculate the readings of 3 rpm, 6 rpm, 100 rpm, 200 rpm, 300 rpm, and 600 rpm under the specified temperature and pressure conditions based on Formula (3);
- (6)
- Based on Formulas (1) and (2), convert the rotational speed and reading into shear rate and shear stress;
- (7)
- Based on the predicted results, the rheological parameters and corresponding errors of rheological models, such as the Bingham model, power law model, and H-B model, are calculated using the regression method;
- (8)
- By comparing the errors, select the rheological model with the smallest error as the rheological model under the temperature and pressure.
3.5. Example of Rheological Prediction
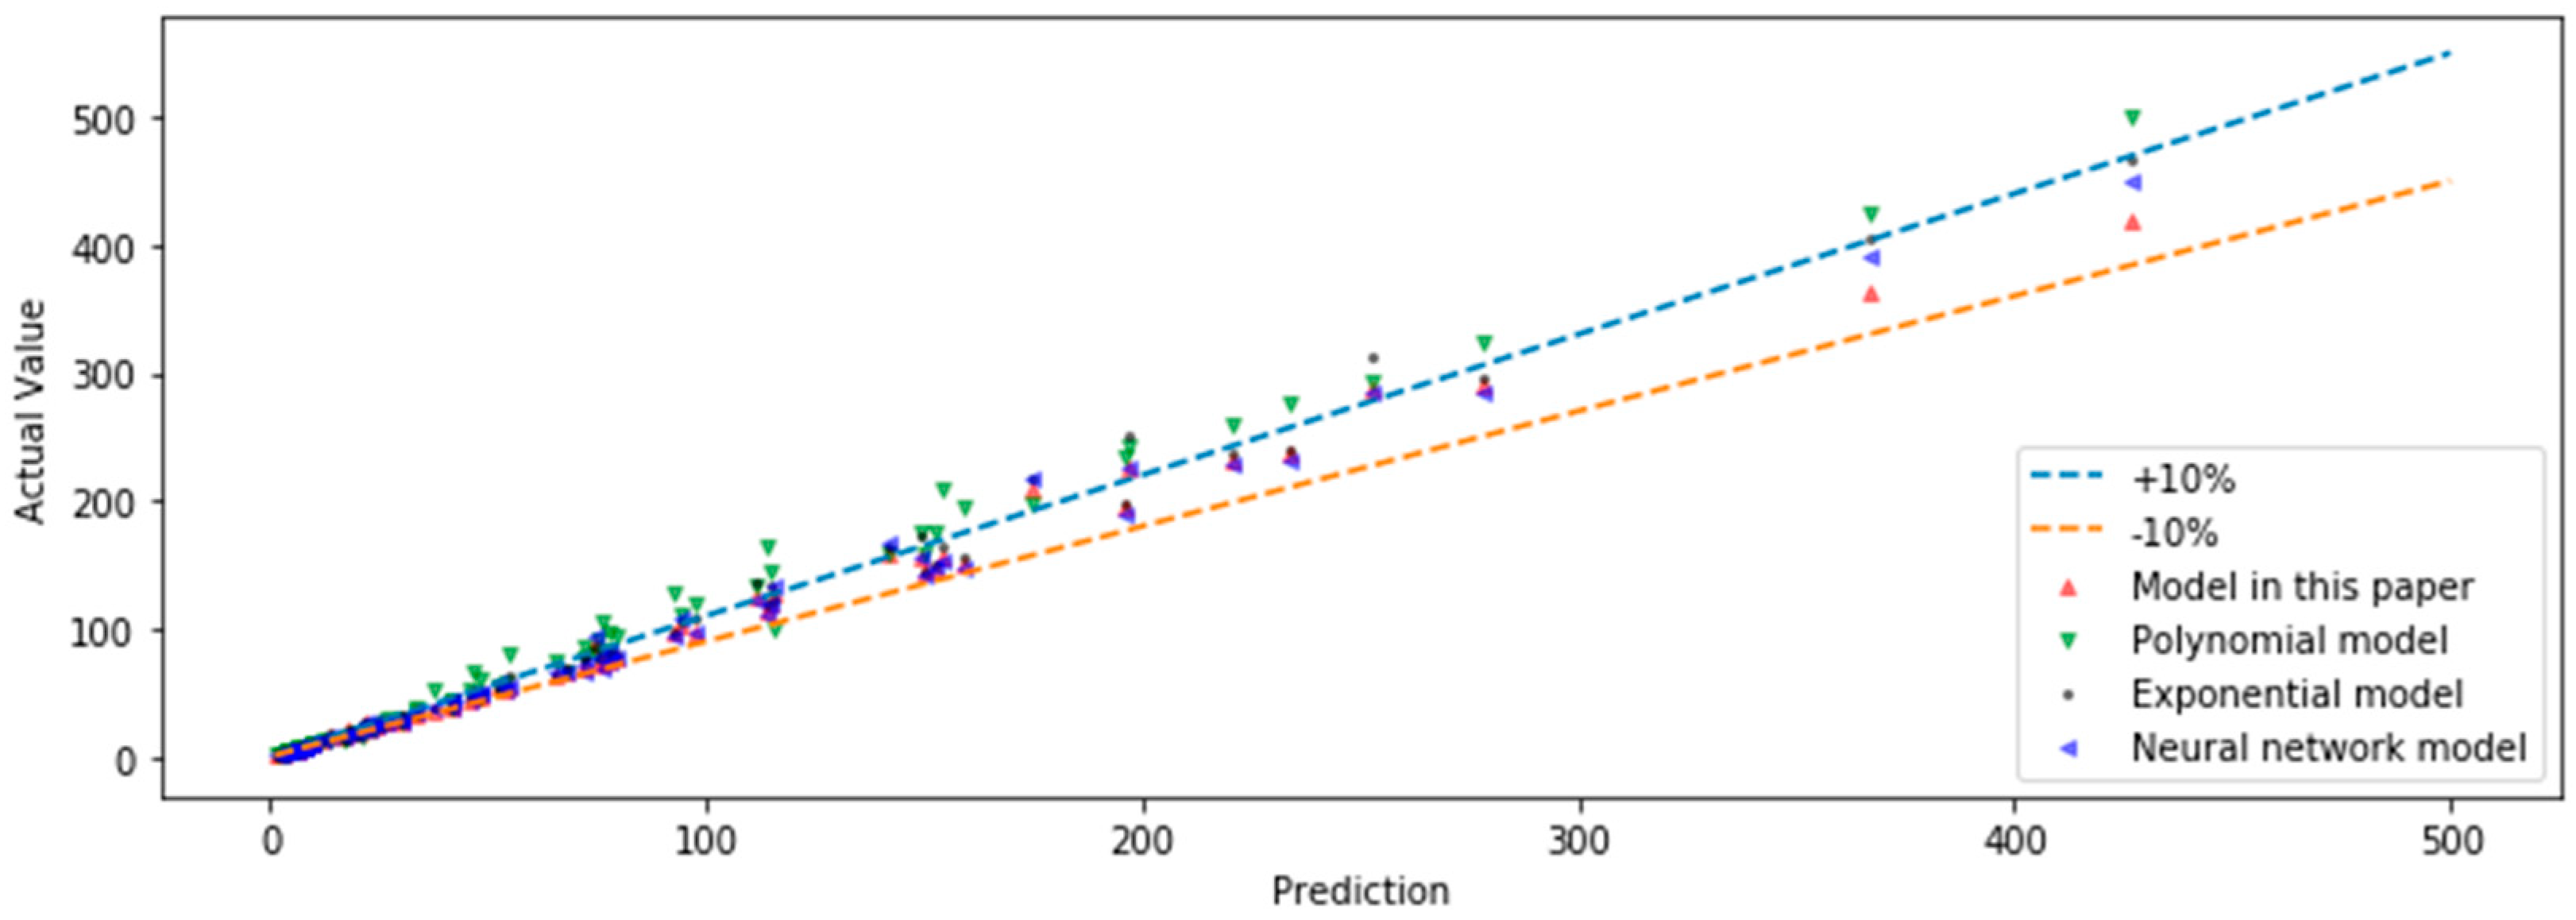
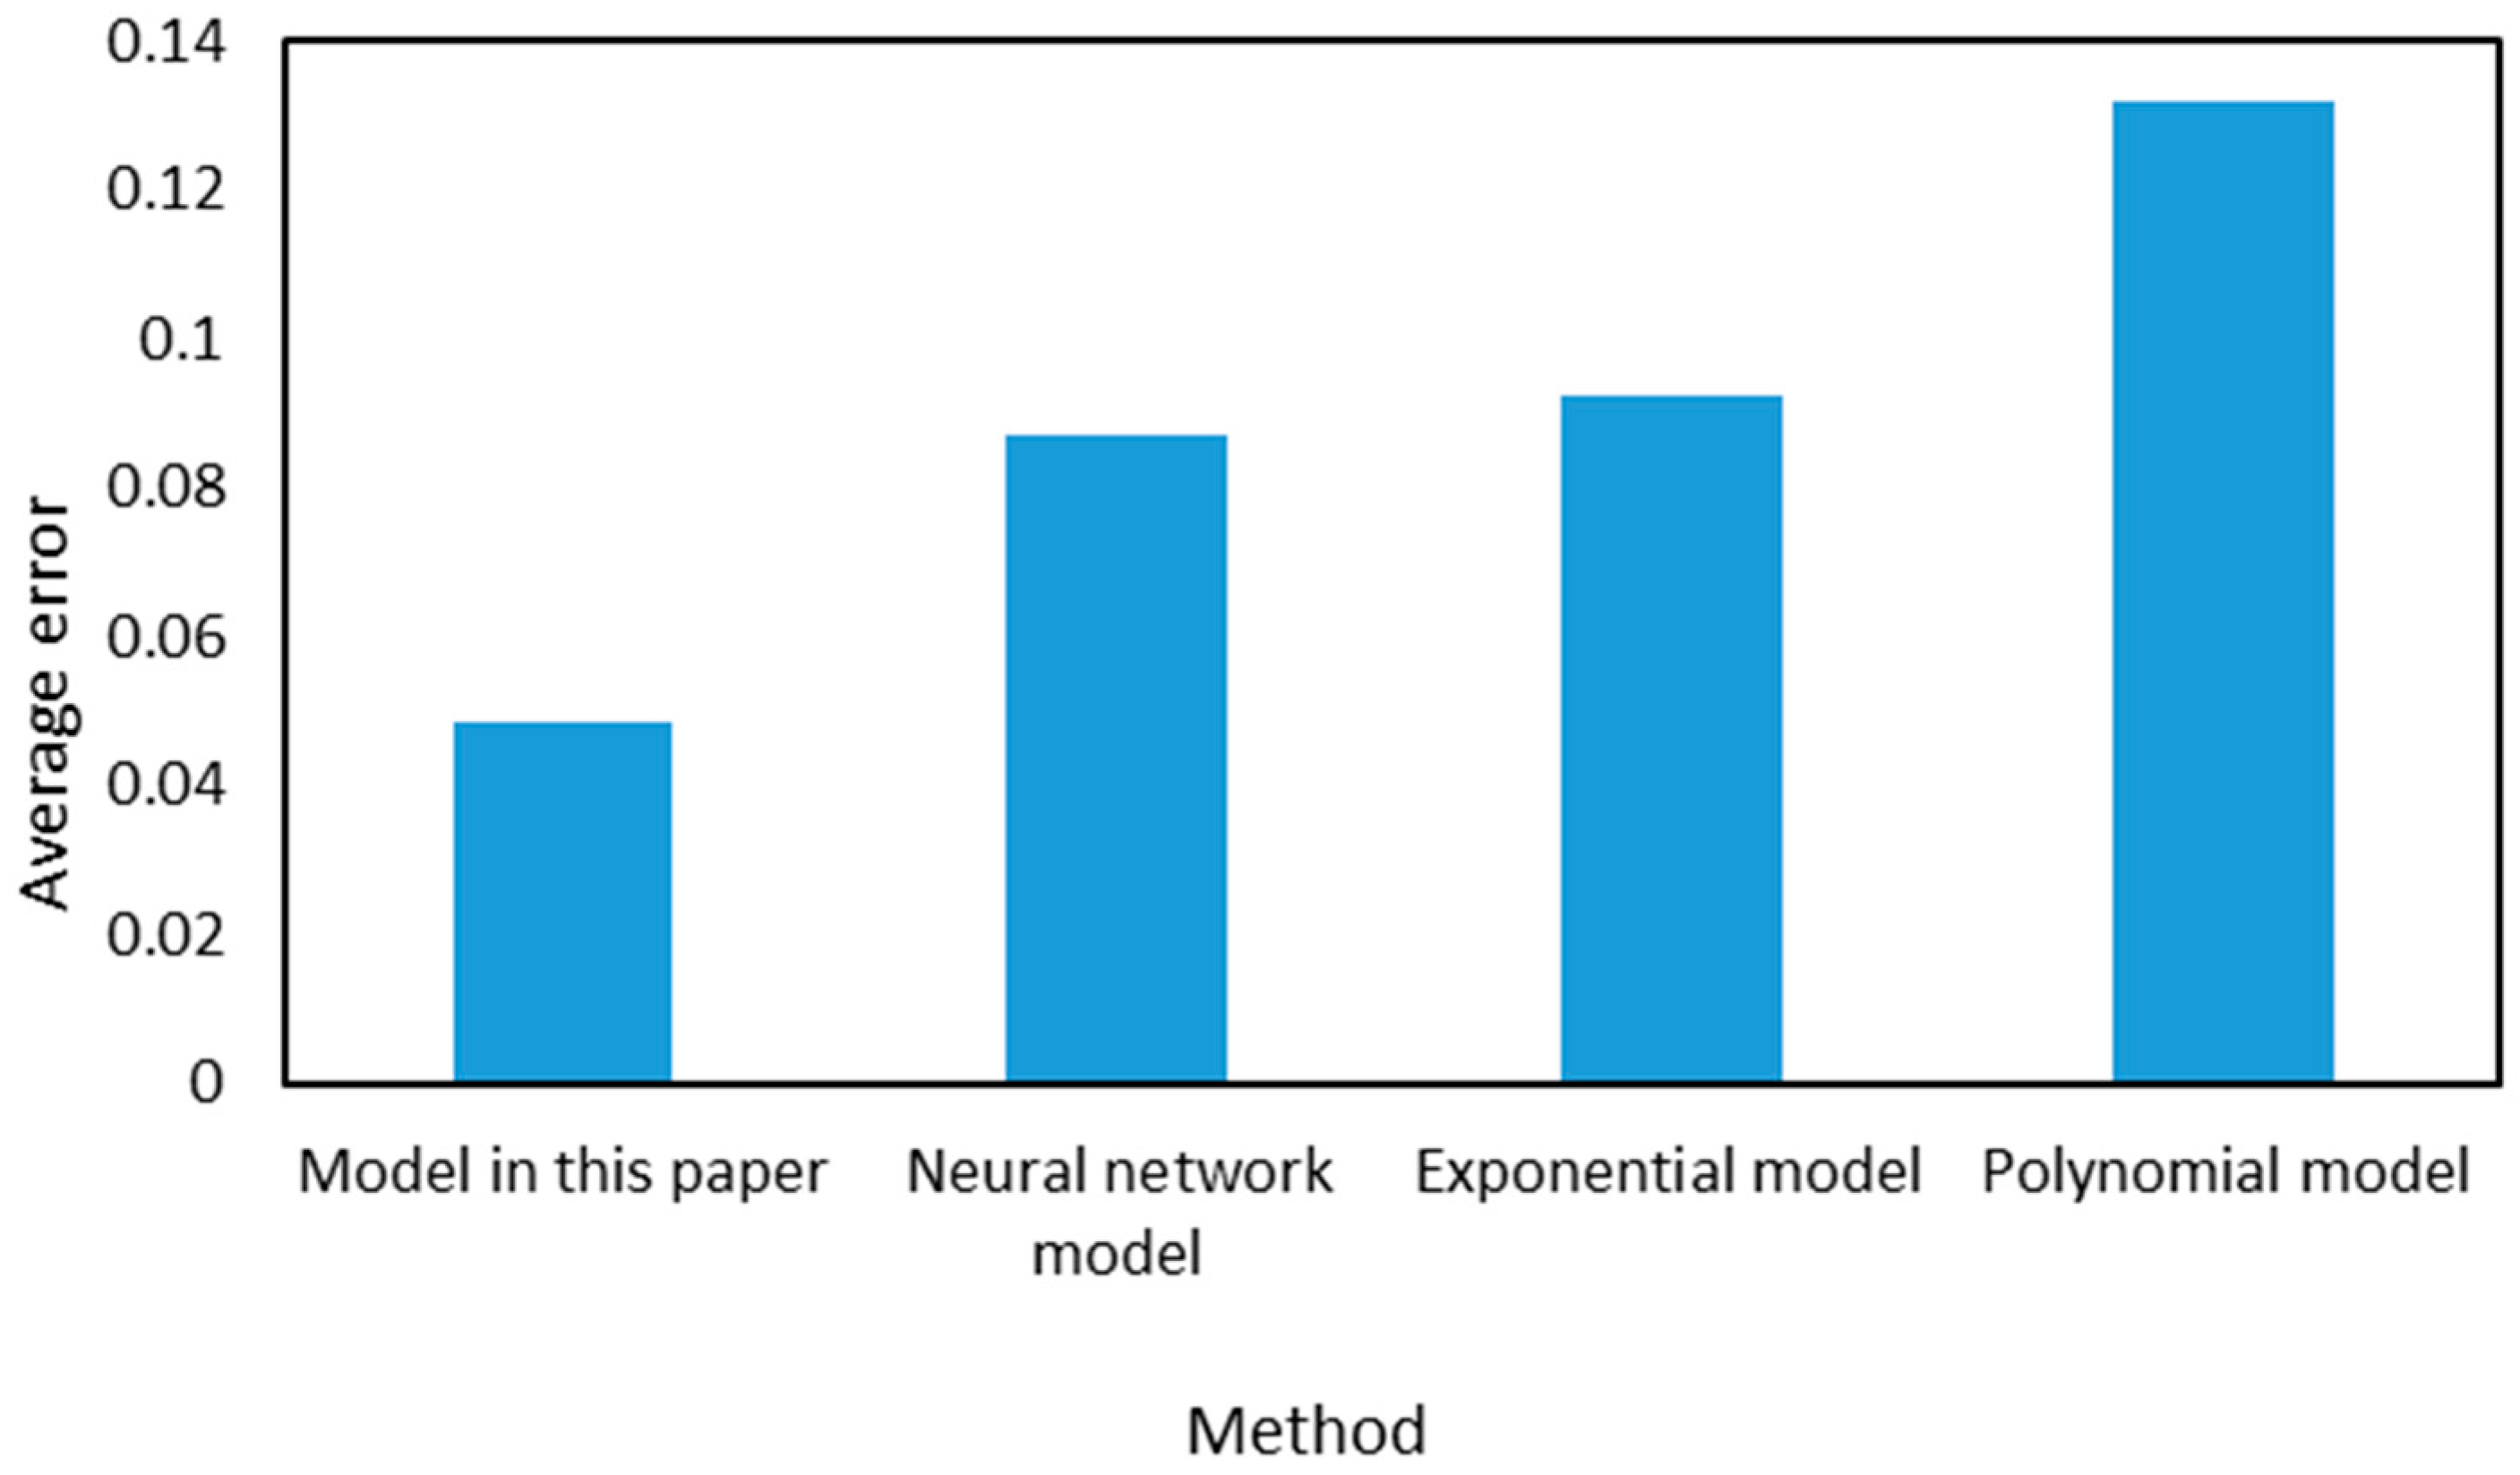
4. Model Comparison
5. Model Application
6. Conclusions
- (1)
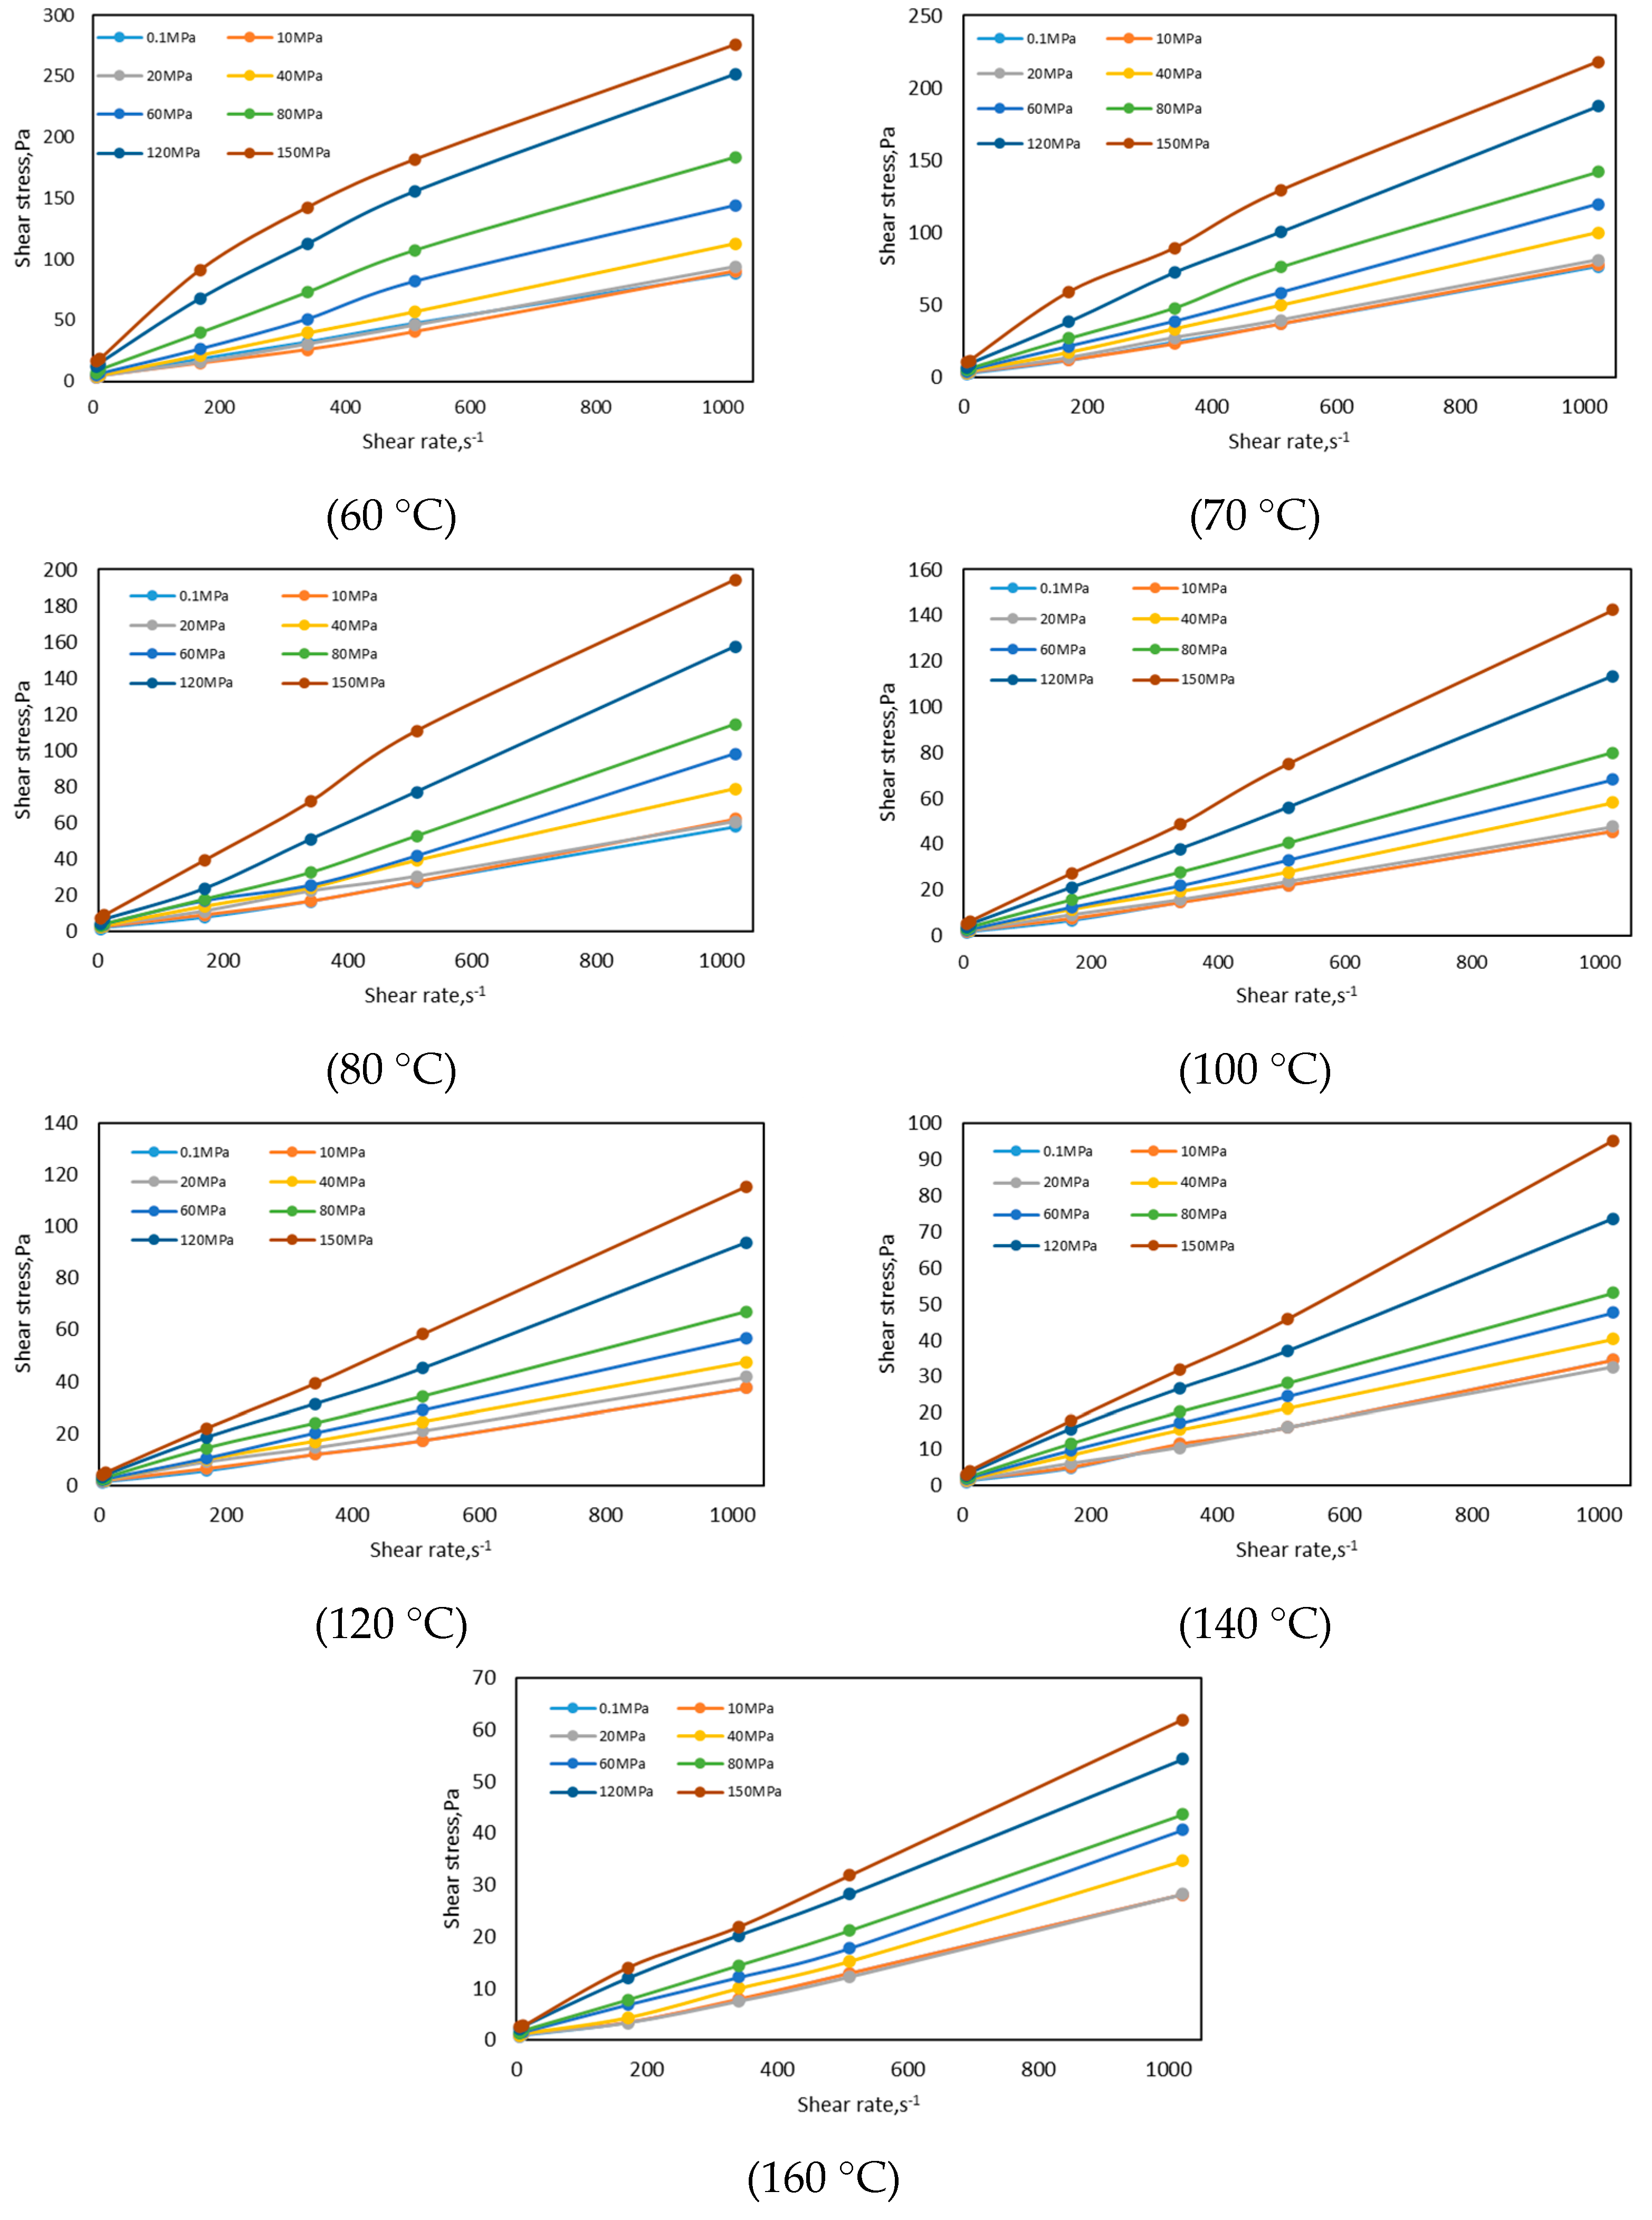
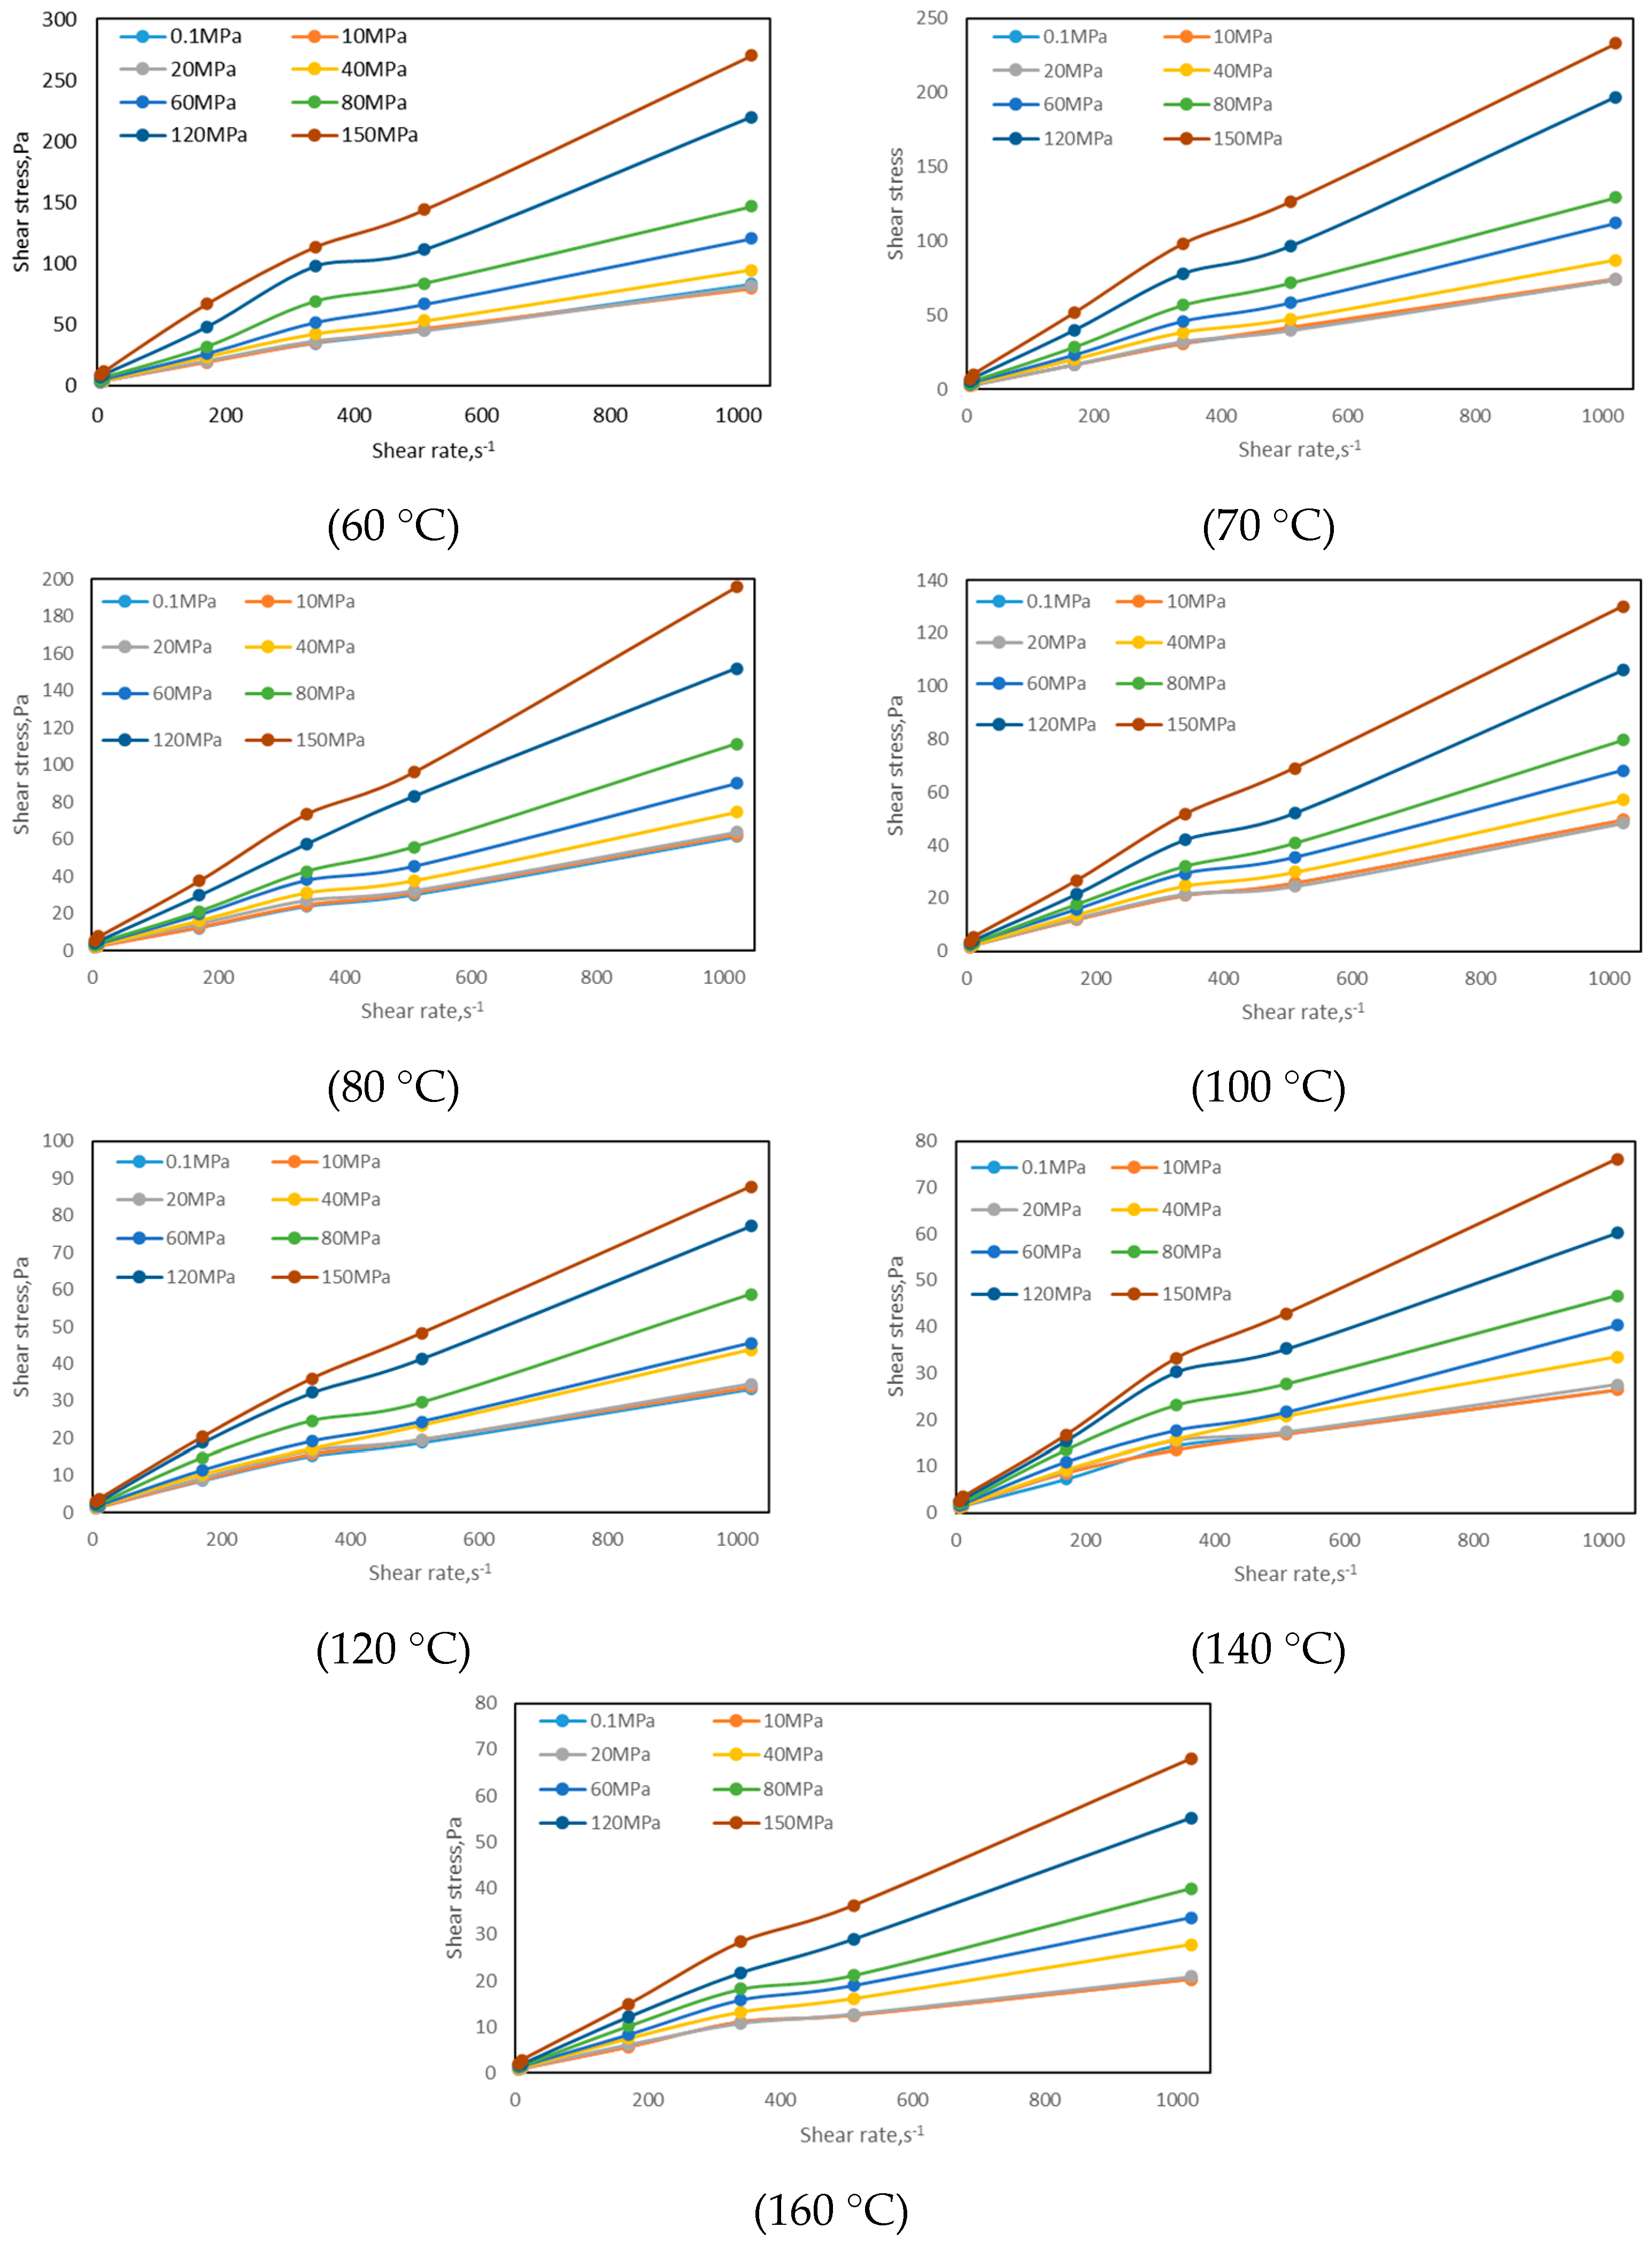
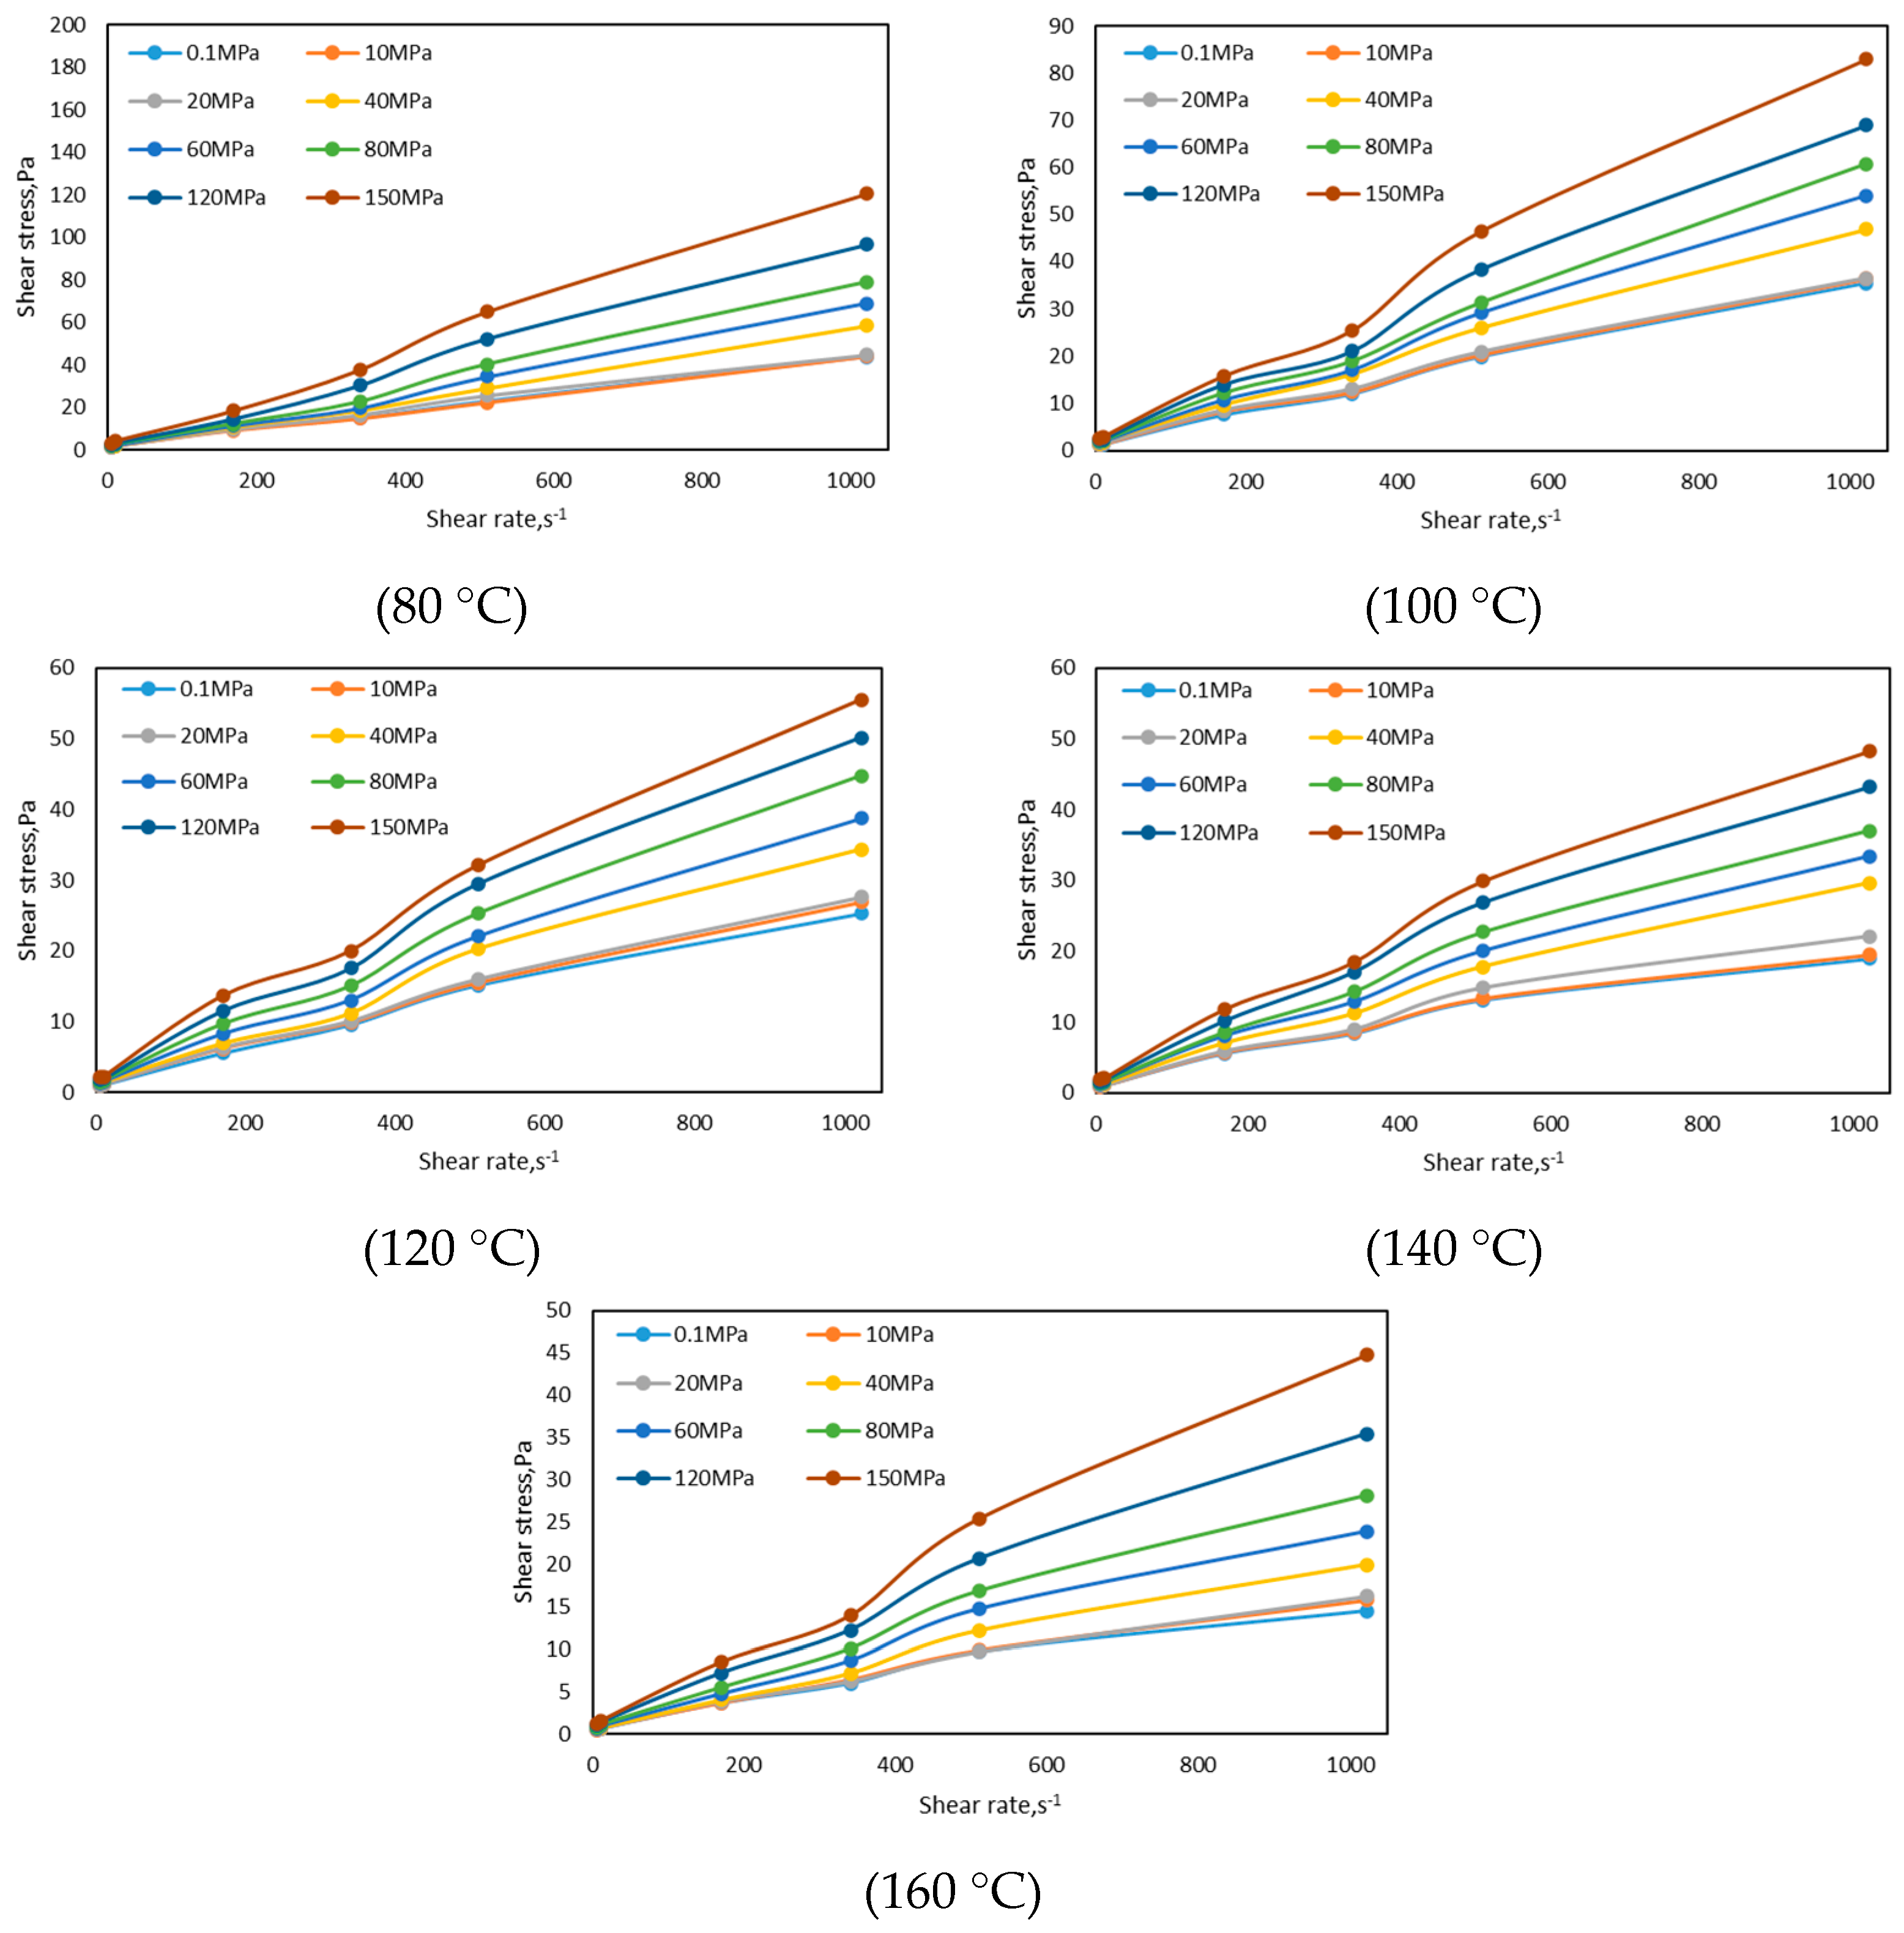
- The rheological properties of oil-based drilling fluid used in three wells in an oilfield in Xinjiang were measured via conducting experiments, and the variation law of drilling fluid under high temperature and high pressure was analyzed. When the temperature is lower than 100 °C, the shear stress decreases faster, and when the temperature is higher than 100 °C, the shear stress decreases gradually. As the pressure increases, the shear stress increases gradually. When the pressure is lower than 80 MPa, the shear stress increases more slowly, and when the pressure is higher than 80 MPa, the shear stress increases faster.
- (2)
- This paper presents a method for directly predicting the readings of a six-speed viscometer and then optimizing the rheological model. The model reduces errors caused by prioritizing rheological models in traditional prediction methods. At the same time, in view of the fact that different drilling fluids conform to different regression functions, this paper adopts a parameter-free method for regression prediction, which expands the scope of the application of the model.
- (3)
- The error between the shear stress and the measured value of different methods at certain shear rates was compared, and the results show that the model established in this paper had the best prediction effect and the smallest model error. This paper improves the prediction effect of oil-based drilling fluid rheology and provides theoretical support for accurate drilling hydraulic calculation.
Author Contributions
Funding
Institutional Review Board Statement
Data Availability Statement
Conflicts of Interest
Appendix A
| Temperature, °C | Shear Rate, 1/s | Pressure, MPa | |||||||
|---|---|---|---|---|---|---|---|---|---|
| 0.1 | 10 | 20 | 40 | 60 | 80 | 120 | 150 | ||
| 60 | 1021.92 | 88.71471 | 90.57475 | 93.88092 | 112.7777 | 144.04068 | 183.45922 | 251.6675 | 276.02176 |
| 510.96 | 47.28794 | 40.56829 | 45.8878 | 56.97139 | 81.82132 | 107.01362 | 155.18048 | 181.73715 | |
| 340.64 | 31.96305 | 25.89237 | 30.39939 | 39.57695 | 51.12044 | 72.72552 | 112.25137 | 142.57411 | |
| 170.32 | 18.07407 | 14.72702 | 15.71325 | 21.45689 | 26.73552 | 39.65871 | 67.48266 | 91.40257 | |
| 10.2192 | 4.07267 | 4.40482 | 4.36394 | 5.03846 | 6.51014 | 9.25932 | 14.29267 | 18.15583 | |
| 5.1096 | 3.2704 | 3.36749 | 3.53101 | 3.8836 | 4.83917 | 7.17955 | 12.21801 | 16.54618 | |
| 70 | 1021.92 | 76.55291 | 77.88151 | 81.18257 | 100.06402 | 119.48202 | 142.03756 | 187.4859 | 218.03348 |
| 510.96 | 36.91975 | 36.88909 | 39.58717 | 49.59766 | 58.4073 | 76.20032 | 100.44727 | 129.07349 | |
| 340.64 | 24.60976 | 23.1994 | 27.36916 | 33.4194 | 38.60605 | 47.97779 | 72.5109 | 89.29214 | |
| 170.32 | 11.87564 | 12.29977 | 13.48018 | 17.00608 | 21.31381 | 26.9297 | 38.19725 | 58.93363 | |
| 10.2192 | 3.13243 | 3.94492 | 3.92448 | 4.25663 | 4.91582 | 6.11156 | 9.23377 | 11.36975 | |
| 5.1096 | 2.15131 | 2.8105 | 3.03023 | 3.08133 | 3.85805 | 4.87494 | 6.91383 | 10.66968 | |
| 80 | 1021.92 | 57.92185 | 62.15293 | 60.66592 | 78.72466 | 98.19376 | 114.6173 | 157.44421 | 194.22599 |
| 510.96 | 27.33339 | 27.56845 | 30.38406 | 39.08128 | 41.63117 | 52.79141 | 77.12012 | 110.887 | |
| 340.64 | 16.6075 | 16.83234 | 22.25916 | 23.94035 | 25.27406 | 32.49449 | 50.75763 | 71.83638 | |
| 170.32 | 7.77742 | 9.22866 | 11.13469 | 13.66414 | 16.68926 | 17.77258 | 23.46512 | 39.41854 | |
| 10.2192 | 2.11554 | 2.86671 | 3.19375 | 3.05067 | 3.7814 | 4.1391 | 6.46415 | 9.1469 | |
| 5.1096 | 1.41036 | 2.11043 | 2.5039 | 2.47324 | 3.02001 | 3.2193 | 4.24641 | 7.13867 | |
| 100 | 1021.92 | 45.55565 | 45.57098 | 47.53833 | 58.05471 | 68.11119 | 79.96639 | 113.36024 | 142.24707 |
| 510.96 | 22.04965 | 22.04965 | 23.66952 | 27.86483 | 33.08214 | 40.33323 | 55.98516 | 75.02502 | |
| 340.64 | 14.56861 | 14.56861 | 15.6877 | 19.30558 | 21.84014 | 27.48669 | 37.78845 | 48.45302 | |
| 170.32 | 6.70943 | 7.63434 | 9.13157 | 11.51794 | 12.51439 | 15.4322 | 20.92545 | 27.19542 | |
| 10.2192 | 1.85493 | 2.47835 | 2.2484 | 2.45791 | 2.77984 | 3.50035 | 4.81362 | 6.16777 | |
| 5.1096 | 1.21618 | 1.74762 | 2.05422 | 2.08488 | 2.26373 | 2.79517 | 3.78651 | 4.92093 | |
| 120 | 1021.92 | 37.52784 | 37.57894 | 41.85601 | 47.48212 | 56.86919 | 67.02787 | 93.74806 | 115.26116 |
| 510.96 | 17.41488 | 17.41488 | 21.08897 | 24.59443 | 28.99925 | 34.29832 | 45.08042 | 58.22334 | |
| 340.64 | 12.06471 | 12.06471 | 14.58394 | 17.05718 | 20.24582 | 23.98123 | 31.26809 | 39.13238 | |
| 170.32 | 5.74364 | 6.67366 | 9.11624 | 10.16379 | 10.61347 | 14.50218 | 18.48798 | 22.1263 | |
| 10.2192 | 1.53811 | 2.05422 | 1.95202 | 2.17175 | 2.58055 | 3.05578 | 3.98069 | 4.98225 | |
| 5.1096 | 1.04244 | 1.52278 | 1.76806 | 1.8396 | 1.92136 | 2.62654 | 3.34705 | 4.00624 | |
| 140 | 1021.92 | 34.5947 | 34.6458 | 32.63246 | 40.39966 | 47.68141 | 53.01114 | 73.48691 | 95.15331 |
| 510.96 | 16.15271 | 16.15271 | 16.01474 | 21.4109 | 24.6302 | 28.23275 | 37.03217 | 45.90313 | |
| 340.64 | 11.47706 | 11.57926 | 10.50105 | 15.42709 | 17.21048 | 20.3378 | 26.63332 | 31.85574 | |
| 170.32 | 4.91582 | 5.24286 | 6.14222 | 8.53881 | 9.79076 | 11.67635 | 15.59572 | 17.885 | |
| 10.2192 | 1.46146 | 1.97246 | 1.50745 | 1.96224 | 2.19219 | 2.59077 | 3.39304 | 4.05734 | |
| 5.1096 | 0.88914 | 1.20085 | 1.3797 | 1.54322 | 1.77317 | 2.11554 | 2.82583 | 3.23974 | |
| 160 | 1021.92 | 28.08456 | 28.13566 | 28.24808 | 34.6458 | 40.66538 | 43.65473 | 54.35507 | 61.93831 |
| 510.96 | 12.90275 | 12.90275 | 12.22823 | 15.24313 | 17.78791 | 21.20139 | 28.18165 | 31.8353 | |
| 340.64 | 7.78764 | 7.9205 | 7.50659 | 10.00027 | 12.14136 | 14.43575 | 20.17428 | 21.90146 | |
| 170.32 | 3.42881 | 3.42881 | 3.3215 | 4.32306 | 6.84229 | 7.77231 | 11.90119 | 14.03206 | |
| 10.2192 | 0.99134 | 1.34904 | 1.07821 | 1.27239 | 1.54833 | 1.8396 | 2.57033 | 2.79006 | |
| 5.1096 | 0.61831 | 0.78183 | 0.74606 | 0.78183 | 1.23662 | 1.40525 | 2.15642 | 2.53967 | |
| Temperature, °C | Shear Rate, 1/s | Pressure, MPa | |||||||
|---|---|---|---|---|---|---|---|---|---|
| 0.1 | 10 | 20 | 40 | 60 | 80 | 120 | 150 | ||
| 60 | 1021.92 | 83.19591 | 79.58825 | 81.46873 | 94.64742 | 120.53468 | 146.54969 | 219.97017 | 270.03795 |
| 510.96 | 45.31548 | 46.73095 | 45.04465 | 53.0418 | 66.64462 | 83.84999 | 111.38267 | 143.84139 | |
| 340.64 | 34.78888 | 35.38675 | 36.61826 | 42.5152 | 51.77963 | 69.20473 | 97.88205 | 113.45733 | |
| 170.32 | 19.34646 | 18.907 | 20.16917 | 23.80238 | 26.12232 | 31.8864 | 47.94202 | 66.66506 | |
| 10.2192 | 3.56678 | 3.6281 | 3.75585 | 4.35883 | 5.30929 | 6.68388 | 9.26954 | 11.63547 | |
| 5.1096 | 2.7083 | 2.64698 | 2.82072 | 3.33172 | 3.96025 | 4.76763 | 6.70432 | 9.32575 | |
| 70 | 1021.92 | 74.23808 | 74.42715 | 74.28407 | 87.30435 | 112.15939 | 129.52317 | 196.88319 | 233.18974 |
| 510.96 | 41.12528 | 41.96843 | 40.06751 | 47.47701 | 58.50439 | 71.88237 | 96.52279 | 126.73311 | |
| 340.64 | 31.14034 | 31.23232 | 32.58136 | 38.55495 | 45.98489 | 56.74655 | 77.80997 | 98.28574 | |
| 170.32 | 16.83234 | 16.80168 | 17.07251 | 20.37357 | 23.2505 | 28.5138 | 39.77113 | 51.85628 | |
| 10.2192 | 3.19375 | 3.20397 | 3.34194 | 3.95514 | 4.71653 | 5.48303 | 7.36862 | 10.08203 | |
| 5.1096 | 2.35571 | 2.3506 | 2.38637 | 2.85138 | 3.5259 | 4.26174 | 5.56479 | 7.25109 | |
| 80 | 1021.92 | 61.30978 | 62.36755 | 63.7217 | 74.73886 | 90.01265 | 111.32646 | 152.03272 | 196.05537 |
| 510.96 | 30.05702 | 31.39584 | 32.27476 | 37.93153 | 45.62719 | 55.84719 | 83.30322 | 96.40015 | |
| 340.64 | 23.8126 | 24.76817 | 27.00124 | 31.33963 | 38.08483 | 42.6685 | 57.63569 | 73.76285 | |
| 170.32 | 12.26911 | 12.80566 | 14.38465 | 16.21914 | 19.55597 | 21.08386 | 29.88839 | 37.73735 | |
| 10.2192 | 2.66231 | 2.53967 | 2.76962 | 3.21419 | 3.90404 | 4.12377 | 5.45748 | 7.5628 | |
| 5.1096 | 2.02356 | 1.7885 | 2.01334 | 2.26884 | 2.9638 | 3.15287 | 4.17998 | 5.27863 | |
| 100 | 1021.92 | 49.52612 | 49.52612 | 48.36104 | 57.14513 | 68.24916 | 79.55759 | 106.10915 | 129.98307 |
| 510.96 | 25.7033 | 25.7033 | 24.51267 | 29.93438 | 35.35609 | 40.7778 | 52.15777 | 69.05654 | |
| 340.64 | 21.03276 | 21.03276 | 21.59486 | 24.75284 | 29.32629 | 32.10613 | 42.1064 | 51.68254 | |
| 170.32 | 11.83987 | 11.83987 | 12.35087 | 13.7459 | 15.59572 | 17.6295 | 21.40068 | 26.45958 | |
| 10.2192 | 2.15642 | 2.15642 | 2.21263 | 2.53967 | 3.00979 | 3.10177 | 3.99091 | 5.29907 | |
| 5.1096 | 1.65564 | 1.65564 | 1.72718 | 1.92136 | 2.36593 | 2.63676 | 2.99446 | 3.69964 | |
| 120 | 1021.92 | 33.20478 | 33.71067 | 34.49761 | 43.75693 | 45.51477 | 58.70368 | 77.15078 | 87.66205 |
| 510.96 | 18.82013 | 19.62751 | 19.48954 | 23.38847 | 24.40536 | 29.60223 | 41.39611 | 48.2384 | |
| 340.64 | 15.2789 | 15.81545 | 16.64838 | 17.19004 | 19.15228 | 24.71707 | 32.24921 | 36.03061 | |
| 170.32 | 8.687 | 8.90673 | 9.13668 | 10.30687 | 11.3953 | 14.82411 | 18.75881 | 20.26626 | |
| 10.2192 | 1.56877 | 1.61987 | 1.70674 | 1.76295 | 1.96224 | 2.38637 | 3.05578 | 3.69453 | |
| 5.1096 | 1.21618 | 1.24684 | 1.2775 | 1.44102 | 1.72718 | 2.06444 | 2.46302 | 2.91781 | |
| 140 | 1021.92 | 26.43403 | 26.48513 | 27.53268 | 33.4705 | 40.30768 | 46.69007 | 60.26223 | 76.14411 |
| 510.96 | 16.96009 | 16.97031 | 17.3229 | 20.7466 | 21.58975 | 27.6962 | 35.24878 | 42.90356 | |
| 340.64 | 14.39998 | 13.5415 | 15.55995 | 15.82056 | 17.69082 | 23.13297 | 30.24609 | 33.24566 | |
| 170.32 | 7.27153 | 8.62057 | 9.01915 | 9.30531 | 10.92007 | 13.56194 | 15.40154 | 16.70459 | |
| 10.2192 | 1.47679 | 1.38992 | 1.59432 | 1.62498 | 1.81405 | 2.23307 | 2.86671 | 3.40837 | |
| 5.1096 | 1.01689 | 1.20596 | 1.26217 | 1.30305 | 1.65564 | 2.02867 | 2.44769 | 2.64187 | |
| 160 | 1021.92 | 20.26115 | 20.31225 | 20.951 | 27.79329 | 33.61869 | 39.98064 | 55.17778 | 68.06009 |
| 510.96 | 12.59104 | 12.59104 | 12.8261 | 16.16293 | 18.97343 | 21.18095 | 28.9737 | 36.27589 | |
| 340.64 | 11.14491 | 11.14491 | 10.79743 | 13.28089 | 15.84611 | 18.21204 | 21.7175 | 28.37583 | |
| 170.32 | 5.75897 | 5.75897 | 6.09623 | 7.54747 | 8.35485 | 10.21489 | 12.14647 | 14.8701 | |
| 10.2192 | 1.14464 | 1.14464 | 1.10887 | 1.36437 | 1.62498 | 1.75784 | 2.05933 | 2.90759 | |
| 5.1096 | 0.80738 | 0.80738 | 0.85337 | 1.05777 | 1.26728 | 1.52789 | 1.70163 | 2.07977 | |
| Temperature, °C | Shear Rate, 1/s | Pressure, MPa | |||||||
|---|---|---|---|---|---|---|---|---|---|
| 0.1 | 10 | 20 | 40 | 60 | 80 | 120 | 150 | ||
| 60 | 1021.92 | 59.47529 | 63.42021 | 65.35179 | 80.80443 | 98.47481 | 116.508 | 142.89604 | 172.19167 |
| 510.96 | 35.07504 | 36.88398 | 38.39143 | 45.82137 | 56.75166 | 61.18714 | 75.39805 | 96.67609 | |
| 340.64 | 21.8197 | 23.61842 | 23.72573 | 27.72175 | 34.05304 | 35.82621 | 43.53209 | 55.80631 | |
| 170.32 | 12.43774 | 13.39331 | 14.02695 | 16.09139 | 18.94788 | 20.03631 | 23.29649 | 29.04013 | |
| 10.2192 | 2.47835 | 2.68275 | 2.69297 | 3.14776 | 3.86827 | 4.06756 | 4.94137 | 6.3364 | |
| 5.1096 | 1.95713 | 2.11043 | 2.20752 | 2.53456 | 2.98424 | 3.15287 | 3.66898 | 4.57345 | |
| 70 | 1021.92 | 49.99113 | 50.45614 | 51.17665 | 64.57507 | 81.38697 | 97.06445 | 115.73128 | 144.02024 |
| 510.96 | 27.22097 | 26.42381 | 29.2292 | 34.4414 | 40.55807 | 46.37325 | 61.70325 | 75.51047 | |
| 340.64 | 17.15938 | 16.85278 | 18.69238 | 20.75682 | 24.90103 | 26.50557 | 33.75666 | 46.00533 | |
| 170.32 | 10.95584 | 10.70034 | 10.77699 | 12.74945 | 14.53284 | 15.82056 | 17.09295 | 21.86058 | |
| 10.2192 | 1.94691 | 1.91114 | 2.12065 | 2.35571 | 2.82583 | 3.00979 | 3.8325 | 5.22242 | |
| 5.1096 | 1.72718 | 1.6863 | 1.69652 | 2.00823 | 2.28928 | 2.48857 | 2.84116 | 3.43903 | |
| 80 | 1021.92 | 43.77737 | 44.09419 | 44.76871 | 58.44307 | 69.05143 | 79.04659 | 96.84472 | 120.51424 |
| 510.96 | 22.81615 | 22.22339 | 25.53467 | 29.04013 | 34.40563 | 40.23614 | 52.32129 | 65.01964 | |
| 340.64 | 14.80878 | 14.69636 | 16.39288 | 18.67705 | 19.68883 | 22.63219 | 30.3023 | 37.78334 | |
| 170.32 | 9.37174 | 9.13668 | 9.64257 | 10.81276 | 11.47195 | 12.25889 | 14.43064 | 18.56974 | |
| 10.2192 | 1.68119 | 1.67097 | 1.86004 | 2.12065 | 2.23818 | 2.57033 | 3.13243 | 4.2924 | |
| 5.1096 | 1.47679 | 1.44102 | 1.51767 | 1.70163 | 1.80383 | 1.93158 | 2.58055 | 2.92292 | |
| 100 | 1021.92 | 35.40719 | 36.3832 | 36.61315 | 46.93024 | 54.07913 | 60.69147 | 68.92879 | 82.8842 |
| 510.96 | 19.89323 | 20.31736 | 20.93056 | 25.96391 | 29.1781 | 31.28853 | 38.37099 | 46.41413 | |
| 340.64 | 12.03916 | 12.43263 | 13.07138 | 16.13738 | 17.07762 | 18.91722 | 21.02765 | 25.42225 | |
| 170.32 | 7.6139 | 8.38551 | 8.58991 | 9.65279 | 10.77699 | 12.2129 | 13.97585 | 15.78479 | |
| 10.2192 | 1.36948 | 1.41036 | 1.4819 | 1.83449 | 1.9418 | 2.1462 | 2.38637 | 2.88715 | |
| 5.1096 | 1.20085 | 1.2264 | 1.35415 | 1.51767 | 1.69652 | 1.92136 | 2.20241 | 2.48346 | |
| 120 | 1021.92 | 25.28939 | 26.86327 | 27.63999 | 34.29832 | 38.76446 | 44.72783 | 50.11888 | 55.45883 |
| 510.96 | 15.18181 | 15.51396 | 16.02496 | 20.28159 | 22.10075 | 25.27917 | 29.50003 | 32.11124 | |
| 340.64 | 9.58125 | 9.86741 | 10.09225 | 11.19601 | 13.04072 | 15.03873 | 17.56307 | 20.02098 | |
| 170.32 | 5.58523 | 6.20865 | 6.35684 | 6.97004 | 8.26287 | 9.68856 | 11.5997 | 13.72035 | |
| 10.2192 | 1.08843 | 1.11909 | 1.14464 | 1.47168 | 1.4819 | 1.70674 | 1.9929 | 2.27395 | |
| 5.1096 | 0.87892 | 0.97601 | 1.00156 | 1.25195 | 1.30305 | 1.52278 | 1.82427 | 2.16153 | |
| 140 | 1021.92 | 18.89678 | 19.50998 | 22.04965 | 29.59201 | 33.39385 | 36.97596 | 43.18461 | 48.22307 |
| 510.96 | 13.05094 | 13.33199 | 14.78834 | 17.79302 | 20.01587 | 22.66285 | 26.84794 | 29.86795 | |
| 340.64 | 8.32419 | 8.57969 | 8.93228 | 11.19601 | 12.84143 | 14.27223 | 17.04185 | 18.45221 | |
| 170.32 | 5.54435 | 5.74875 | 5.91227 | 7.07224 | 8.09424 | 8.6359 | 10.16379 | 11.86031 | |
| 10.2192 | 0.94535 | 0.97601 | 1.01178 | 1.27239 | 1.45635 | 1.61987 | 1.78339 | 2.0951 | |
| 5.1096 | 0.87381 | 0.90447 | 0.93002 | 1.11398 | 1.27239 | 1.35926 | 1.59943 | 1.86515 | |
| 160 | 1021.92 | 14.48685 | 15.82567 | 16.27024 | 19.95966 | 23.93013 | 28.11522 | 35.44807 | 44.7636 |
| 510.96 | 9.74988 | 9.93895 | 9.7601 | 12.24356 | 14.80367 | 16.863 | 20.71083 | 25.4478 | |
| 340.64 | 6.01958 | 6.45904 | 6.27508 | 7.22554 | 8.71255 | 10.09736 | 12.25889 | 13.98607 | |
| 170.32 | 3.70475 | 3.74563 | 3.92448 | 4.09822 | 4.81873 | 5.53924 | 7.22554 | 8.55414 | |
| 10.2192 | 0.68474 | 0.73073 | 0.71029 | 0.82271 | 0.99134 | 1.14464 | 1.38992 | 1.58921 | |
| 5.1096 | 0.58254 | 0.58765 | 0.61831 | 0.64386 | 0.75628 | 0.87381 | 1.13953 | 1.34904 | |
References
- Ansari, M.; Turney, D.E.; Morris, J.; Banerjee, S. Investigations of rheology and a link to microstructure of oil-based drilling fluids. J. Pet. Sci. Eng. 2021, 196, 108031. [Google Scholar] [CrossRef]
- Jia, X.; Zhao, X.; Chen, B.; Egwu, S.B.; Huang, Z. Polyanionic cellulose/hydrophilic monomer copolymer grafted silica nanocomposites as HTHP drilling fluid-loss control agent for water-based drilling fluids. Appl. Surf. Sci. 2022, 578, 152089. [Google Scholar] [CrossRef]
- Srini-Vasan, S.A.C.G. The Effect of Temperature on the Flow Properties of Clay-Water Drilling Muds. J. Pet. Technol. 1958, 10, 59–60. [Google Scholar] [CrossRef]
- Annis, M.R. High-Temperature Flow Properties of Water-Base Drilling Fluids. J. Pet. Technol. 1967, 19, 1074–1080. [Google Scholar] [CrossRef]
- McMordie, W.C.B.R. The Effect of Temperature and Pressure on the Viscosity of Oil-Base Muds. J. Pet. Technol. 1975, 27, 884–886. [Google Scholar] [CrossRef]
- Politte, M.D. Invert Oil Mud Rheology as a Function of Temperature. In Proceedings of the SPE/IADC Drilling Conference, New Orleans, LA, USA, 5–8 March 1985. [Google Scholar]
- Yan, J. Rheological properties of mineral oil mud and conventional water-in-oil emulsion mud under high temperature and pressure. J. Pet. Univ. (Nat. Sci. Ed.) 1989, 5, 18–29. [Google Scholar]
- Yan, J. A mathematical model for predicting the apparent viscosity of water-in-oil emulsion mud. J. Pet. Univ. (Nat. Sci. Ed.) 1990, 1, 9–15. [Google Scholar]
- Zhao, S.; Yan, J.; Shu, Y. Prediction model of rheological parameters of oil-based drilling fluid at high temperature and high pressure. J. Pet. 2009, 30, 603–606. [Google Scholar]
- Zhao, H.; Xue, Y.; Li, G. Study on the rheology of high-temperature water-based drilling fluid at ultra-high temperature and pressure. Pet. Drill. Technol. 2009, 37, 5–9. [Google Scholar]
- Wang, F.; Wang, R.; Liu, J. Research on the high-temperature and high-pressure rheological properties of high-density water-based drilling fluid. J. Pet. 2010, 31, 306–310. [Google Scholar]
- Gokdemir, M.G.; Erkekol, S.; Dogan, H.A. Investigation of High Pressure Effect on Drilling Fluid Rheology; American Society of Mechanical Engineers (ASME): Trondheim, Norway, 2017. [Google Scholar]
- Fakoya, M.F.; Ahmed, R.M. A generalized model for apparent viscosity of oil-based muds. J. Pet. Sci. Eng. 2018, 165, 777–785. [Google Scholar] [CrossRef]
- Anawe, P.A.L.; Folayan, J.A. Data analyses on temperature-dependent behaviour of water based drilling fluid rheological models. Data Brief 2018, 21, 289–298. [Google Scholar] [CrossRef] [PubMed]
- Vivas, C.; Salehi, S. Rheological investigation of effect of high temperature on geothermal drilling fluids additives and lost circulation materials. Geothermics 2021, 96, 102219. [Google Scholar] [CrossRef]
- Agwu, O.E.; Akpabio, J.U.; Ekpenyong, M.E.; Inyang, U.G.; Asuquo, D.E.; Eyoh, I.J.; Adeoye, O.S. A critical review of drilling mud rheological models. J. Pet. Sci. Eng. 2021, 203, 108659. [Google Scholar] [CrossRef]
- Agwu, O.E.; Akpabio, J.U.; Ekpenyong, M.E.; Inyang, U.G.; Asuquo, D.E.; Eyoh, I.J.; Adeoye, O.S. A comprehensive review of laboratory, field and modelling studies on drilling mud rheology in high temperature high pressure (HTHP) conditions. J. Nat. Gas Sci. Eng. 2021, 94, 104046. [Google Scholar] [CrossRef]
- Alade, O.; Mahmoud, M.; Al-Nakhli, A. Rheological studies and numerical investigation of barite sag potential of drilling fluids with thermochemical fluid additive using computational fluid dynamics (CFD). J. Pet. Sci. Eng. 2023, 220, 111179. [Google Scholar] [CrossRef]

| Equipment Parameters | Parameter Range |
|---|---|
| Rotating speed | 0–600 rpm |
| Temperature | Room temperature–600 °F |
| Pressure | atm–30,000 psi |
| Viscosity | 0.5–5,000,000 cP |
| Sampling Well | Mud Type | Mud Density | Mud Oil-Water Ratio |
|---|---|---|---|
| Well Hu 6 | Diesel-based | 1.97 | 85/15 |
| Well Tianan 1 | white oil base | 2.26 | 89/11 |
| Well Tianwan 1 | white oil base | 2.18 | 90/10 |
| Matrix | Matrix Meaning | Dimensions |
|---|---|---|
| independent variable | (3, 1) | |
| coefficient matrix | (3, 1) | |
| dependent variable | (1, 1) | |
| experimental condition | (42, 3) | |
| weight coefficient | (42, 42) | |
| experimental measurement results | (42, 1) |
| _Measured | |||
|---|---|---|---|
| 1 | 70 | 40 | 100.064 |
| 1 | 60 | 0.1 | 173.61 | 3.17 × 10⁻⁸ |
| 1 | 60 | 10 | 177.25 | 3.70 × 10⁻⁵ |
| 1 | 60 | 20 | 183.72 | 6.08 × 10⁻³ |
| 1 | 60 | 60 | 281.88 | 6.08 × 10⁻³ |
| 1 | 60 | 80 | 359.02 | 2.93 × 10⁻⁸ |
| 1 | 60 | 120 | 492.5 | 1.57 × 10⁻²⁹ |
| 1 | 60 | 150 | 540.16 | 8.61 × 10−55 |
| 1 | 80 | 0.1 | 113.35 | 3.17 × 10⁻⁸ |
| 1 | 80 | 10 | 121.63 | 3.70 × 10⁻⁵ |
| 1 | 80 | 20 | 118.72 | 6.08 × 10⁻³ |
| 1 | 80 | 60 | 192.16 | 6.08 × 10⁻³ |
| 1 | 80 | 80 | 224.3 | 2.93 × 10⁻⁸ |
| 1 | 80 | 120 | 308.11 | 1.57 × 10⁻²⁹ |
| 1 | 80 | 150 | 380.09 | 8.61 × 10−55 |
| 1 | 100 | 0.1 | 89.15 | 9.05 × 10⁻¹² |
| 1 | 100 | 10 | 89.18 | 1.05 × 10⁻⁸ |
| 1 | 100 | 20 | 93.03 | 1.73 × 10⁻⁶ |
| 1 | 100 | 60 | 133.29 | 1.73 × 10⁻⁶ |
| 1 | 100 | 80 | 156.49 | 8.34 × 10⁻¹² |
| 1 | 100 | 120 | 221.84 | 4.46 × 10⁻³³ |
| 1 | 100 | 150 | 278.37 | 2.45 × 10−58 |
| 1 | 120 | 0.1 | 73.44 | 7.34 × 10⁻¹⁹ |
| 1 | 120 | 10 | 73.54 | 8.56 × 10⁻¹⁶ |
| 1 | 120 | 20 | 81.91 | 1.41 × 10⁻¹³ |
| 1 | 120 | 60 | 111.29 | 1.41 × 10⁻¹³ |
| 1 | 120 | 80 | 131.17 | 6.77 × 10⁻¹⁹ |
| 1 | 120 | 120 | 183.46 | 3.62 × 10−40 |
| 1 | 120 | 150 | 225.56 | 1.99 × 10−65 |
| 1 | 140 | 0.1 | 67.7 | 1.70 × 10⁻²⁹ |
| 1 | 140 | 10 | 67.8 | 1.98 × 10⁻²⁶ |
| 1 | 140 | 20 | 63.86 | 3.26 × 10⁻²⁴ |
| 1 | 140 | 60 | 93.31 | 3.26 × 10⁻²⁴ |
| 1 | 140 | 80 | 103.74 | 1.57 × 10⁻²⁹ |
| 1 | 140 | 120 | 143.81 | 8.38 × 10−51 |
| 1 | 140 | 150 | 186.21 | 4.60 × 10−76 |
| 1 | 160 | 0.1 | 54.96 | 1.12 × 10−43 |
| 1 | 160 | 10 | 55.06 | 1.31 × 10−40 |
| 1 | 160 | 20 | 55.28 | 2.15 × 10−38 |
| 1 | 160 | 60 | 79.58 | 2.15 × 10−38 |
| 1 | 160 | 80 | 85.43 | 1.03 × 10−43 |
| 1 | 160 | 120 | 106.37 | 5.52 × 10−65 |
| 1 | 160 | 150 | 121.21 | 3.03 × 10−90 |
| 378.99 | −3.863 | 2.140 | 99.228 |
| Shear Rate, s−1 | Shear Stress, Pa | Measured Shear Stress, Pa |
|---|---|---|
| 1021.92 | 99.228 | 100.064 |
| 510.96 | 49.939 | 49.598 |
| 340.64 | 32.259 | 33.419 |
| 170.32 | 17.571 | 17.006 |
| 10.2192 | 4.463 | 4.257 |
| 5.1096 | 3.473 | 3.081 |
| Rheological Model | Functional Form | Rheological Parameters | Deviation, Pa |
|---|---|---|---|
| Bingham model | 0.986 | ||
| Power-law model | 2.068 | ||
| H-B model | 0.385 | ||
| Ross model | 0.986 | ||
| Carson model | 1.752 | ||
| Four parameter model | 0.985 |
| Well Section | Top Depth, m | Bottom Depth, m | Outer Diameter, mm | Inner Diameter, mm |
|---|---|---|---|---|
| Casing | 0 | 5460 | 273.1 | 245.4 |
| Open Hole | 5460 | 6880 | 241.3 | — |
| Component | Section Length, m | Inner Diameter, mm | Outer Diameter, mm |
|---|---|---|---|
| Drill pipe | 2200.5 | 129.5 | 149.2 |
| Drill pipe | 4362.6 | 101.6 | 149.2 |
| Weighted drill pipe | 85.4 | 76.2 | 127 |
| Adapter | 0.5 | 72 | 158 |
| Drill collar | 27.4 | 57.2 | 158.8 |
| Flexible joint | 3.4 | 75 | 118 |
| Jar | 4.4 | 138 | 158 |
| Drill collar | 184.7 | 57.2 | 158.8 |
| Spiral stabilizer | 1.4 | 159 | 212 |
| Drill collar | 9.4 | 57.2 | 158.8 |
| Bit | 0.3 | — | 241.3 |
| Flow Rate, L/s | Standpipe Pressure, MPa | Casing Pressure, MPa |
|---|---|---|
| 28 | 32 | 0 |
| The Method Established in This Article, g/cm3 | Traditional Method, g/cm3 | PWD, g/cm3 | |
|---|---|---|---|
| ECD | 2.19 | 2.15 | 2.20 |
Disclaimer/Publisher’s Note: The statements, opinions and data contained in all publications are solely those of the individual author(s) and contributor(s) and not of MDPI and/or the editor(s). MDPI and/or the editor(s) disclaim responsibility for any injury to people or property resulting from any ideas, methods, instructions or products referred to in the content. |
© 2023 by the authors. Licensee MDPI, Basel, Switzerland. This article is an open access article distributed under the terms and conditions of the Creative Commons Attribution (CC BY) license (https://creativecommons.org/licenses/by/4.0/).
Share and Cite
Ye, Y.; Fan, H.; Liu, Y. A New Approach for Predicting the Rheological Properties of Oil-Based Drilling Fluids under High Temperature and High Pressure Based on a Parameter-Free Method. Appl. Sci. 2023, 13, 8592. https://doi.org/10.3390/app13158592
Ye Y, Fan H, Liu Y. A New Approach for Predicting the Rheological Properties of Oil-Based Drilling Fluids under High Temperature and High Pressure Based on a Parameter-Free Method. Applied Sciences. 2023; 13(15):8592. https://doi.org/10.3390/app13158592
Chicago/Turabian StyleYe, Yuguang, Honghai Fan, and Yuhan Liu. 2023. "A New Approach for Predicting the Rheological Properties of Oil-Based Drilling Fluids under High Temperature and High Pressure Based on a Parameter-Free Method" Applied Sciences 13, no. 15: 8592. https://doi.org/10.3390/app13158592
APA StyleYe, Y., Fan, H., & Liu, Y. (2023). A New Approach for Predicting the Rheological Properties of Oil-Based Drilling Fluids under High Temperature and High Pressure Based on a Parameter-Free Method. Applied Sciences, 13(15), 8592. https://doi.org/10.3390/app13158592


