Article

EEM Fluorescence Spectroscopy Coupled with HPLC-DAD Analysis for the Characterization of Bud Derivative Dietary Supplements: A Preliminary Introduction to GEMMAPP, the Free Data-Repository from the FINNOVER Project

1
Department of Pharmacy, University of Genoa, Viale Cembrano 4, 16148 Genoa, Italy
2
National Center for the Development of New Technologies in Agriculture (Agritech), 80121 Napoli, Italy
3
Department of Agriculture, Forestry and Food Science, University of Torino, Largo Braccini 2, Grugliasco, 10095 Turin, Italy
4
Geal Pharma, Strada Rivà 20, Bricherasio, 10060 Turin, Italy
5
ERREEFFE, Via Acquarone, 16125 Genoa, Italy
6
National Biodiversity Future Center (NBFC), 90133 Palermo, Italy
*
Author to whom correspondence should be addressed.
Appl. Sci. 2023, 13(15), 8679; https://doi.org/10.3390/app13158679
Submission received: 9 June 2023 / Revised: 13 July 2023 / Accepted: 25 July 2023 / Published: 27 July 2023
(This article belongs to the Special Issue State-of-the-Art of Food Science and Technology in Italy)

Abstract

:
Bud derivatives (BDs) represent a category of botanicals obtained by macerating the meristematic tissues (buds or young sprouts) of plants; widely used since ancient times in complementary medicine, they remain poorly investigated to date. In this study, a contribution is made toward the identification of the correct “a posteriori” attribution of the botanical species in commercial BDs, which is very important for ensuring the quality and safety of these natural products. Excitation–emission matrix (EEM) fluorescence spectroscopy proved to be a rapid, non-destructive and low-cost analytical instrument for providing a preliminary qualitative characterization of the BDs, allowing for the identification of specific spectral regions related to flavonol compounds and cinnamic and benzoic acids, in agreement with the targeted chromatographic analysis (HPLC-DAD), which completely defined a phytochemical profile for each BD considered. This information will be implemented in the first web application for the recognition of vegetable buds, named GEMMAPP, which was designed by the Authors and is proposed as a tool and future scientific data repository for providing information about the main, typical BDs of the France–Italy Alcotra territory.

1. Introduction

This research takes place in the context of a European cooperative project (2017–2021) between France and Italy called FINNOVER (“Innovative strategies for the development of cross-border green supply chains”) [1]. The main target of this project is the implementation of new green chain productions that exploit the biodiversity of the Alcotra territory. One of the production chains followed in the FINNOVER project concerns bud derivatives (BDs), which are commercialized in the European community as plant food supplements and represent a new category of natural herbal products [2].
BDs are produced by macerating the fresh meristematic tissues of both trees and herbaceous plants (buds or young sprouts) according to the traditional maceration procedure of the eighth edition of the European Pharmacopeia [3], which involves the use of a mixture of food-grade solvents, i.e., glycerol and ethanol, thus producing glyceric macerates. Nowadays, despite the fact that these products are still poorly investigated, BDs are widely used for homeopathy and phytotherapy [4,5]. Their use has led to the birth of so-called “Gemmotherapy”, an emerging branch of complementary medicine which is rapidly expanding in the market [6]. No health claims are approved to date by the European Food Safety Authority (EFSA), but a long history of their use as dietary supplements for human health has been reported in traditional medicine [2]. Moreover, pharmacognostic findings have been achieved for some of these botanicals to support their roles as adjuvants in several diseases; in vitro and in vivo biological studies are in fact available in the scientific literature [2,7,8,9].
As their production remains a “niche” area, there is the need to develop quality controls for BDs to ensure the correct identification of the botanical sources and their contents for the safety of both the consumers and the individuals who work in this field. Indeed, buds are often spontaneously collected in a very limited period of the year in late winter, corresponding to the germination period of the plant (balsamic period) in which the plant lacks its distinctive traits. For this reason, the attribution of the botanical species can sometimes be difficult if not carried out by expert collectors. In a previous work, Turrini et al. (2020) proposed a simple and non-destructive approach to identifying these botanicals based on tbe UV-Visible untargeted spectroscopic fingerprints of the extracts coupled with chemometrics [2].
In the present work, commercial BDs of six different plant species, i.e., Castanea sativa (CS), Corylus avellana (CA), Ribes nigrum (RN), Fraxinus excelsior (FE), Ficus carica (FC) and Quercus petraea (QP), which turned out to be among the species richest in antioxidant compounds, especially phenolic acids and flavonoids, have been investigated.
All the plant species described above are characterized by high contents of bioactive compounds with antioxidant activities that are mainly responsible for their beneficial properties. Most of these compounds, such as the many groups of polyphenols, aromatic amino acids and water- or lipid-soluble vitamins and pigments, are present in the aromatic rings of their chemical structures, π-conjugated systems and functional groups like phenols, carboxyls, hydroxyls and thiols. For this reason, they show intrinsic fluorescent properties (autofluorescence) and can be analyzed via molecular fluorescence spectroscopy [10]. In recent decades, interest in the application of non-destructive fluorescence spectroscopic techniques in the study of several foodstuffs (i.e., milk and its derivatives, wine, vegetable oils, juices, cereals and honey, etc.) and vegetable extracts has increased exponentially [11].
In the present work, this analytical method was used for the first time for the characterization of BDs, and it was chosen due to its numerous advantages, such as its high degree of sensitivity, ease of use and minimal sample preparation requirements; moreover, it represents a fast, non-destructive and low-cost analytical instrument [12]. The aim of this work was to determine a three-dimensional “fingerprint” for each of these natural products to differentiate them from each other, considering their composition in fluorophore substances. For this purpose, the multidimensional analytical method of using excitation–emission fluorescence matrices (EEMs), which provide more spectral information and a higher degree of selectivity with respect to first-order fluorescence signals [13], was applied. EEMs, which are also known as total fluorescence spectra, represent the emission intensity as a function of both excitation and emission wavelengths and provide overall comprehensive characteristics of samples that are determined via both absorption and fluorescence properties [13]. The obtained spectroscopic results were then confirmed via the application of a targeted analytical strategy (HPLC-DAD) to the same samples to fully define a phytochemical profile for each considered BD.
Furthermore, a web application named GEMMAPP (http://www.gemmapp.it, accessed on 20 May 2023) was designed by the Authors and has been proposed as new data repository and tool for providing scientific knowledge about some BDs typical of the France–Italy Alcotra territory [14].

2. Materials and Methods
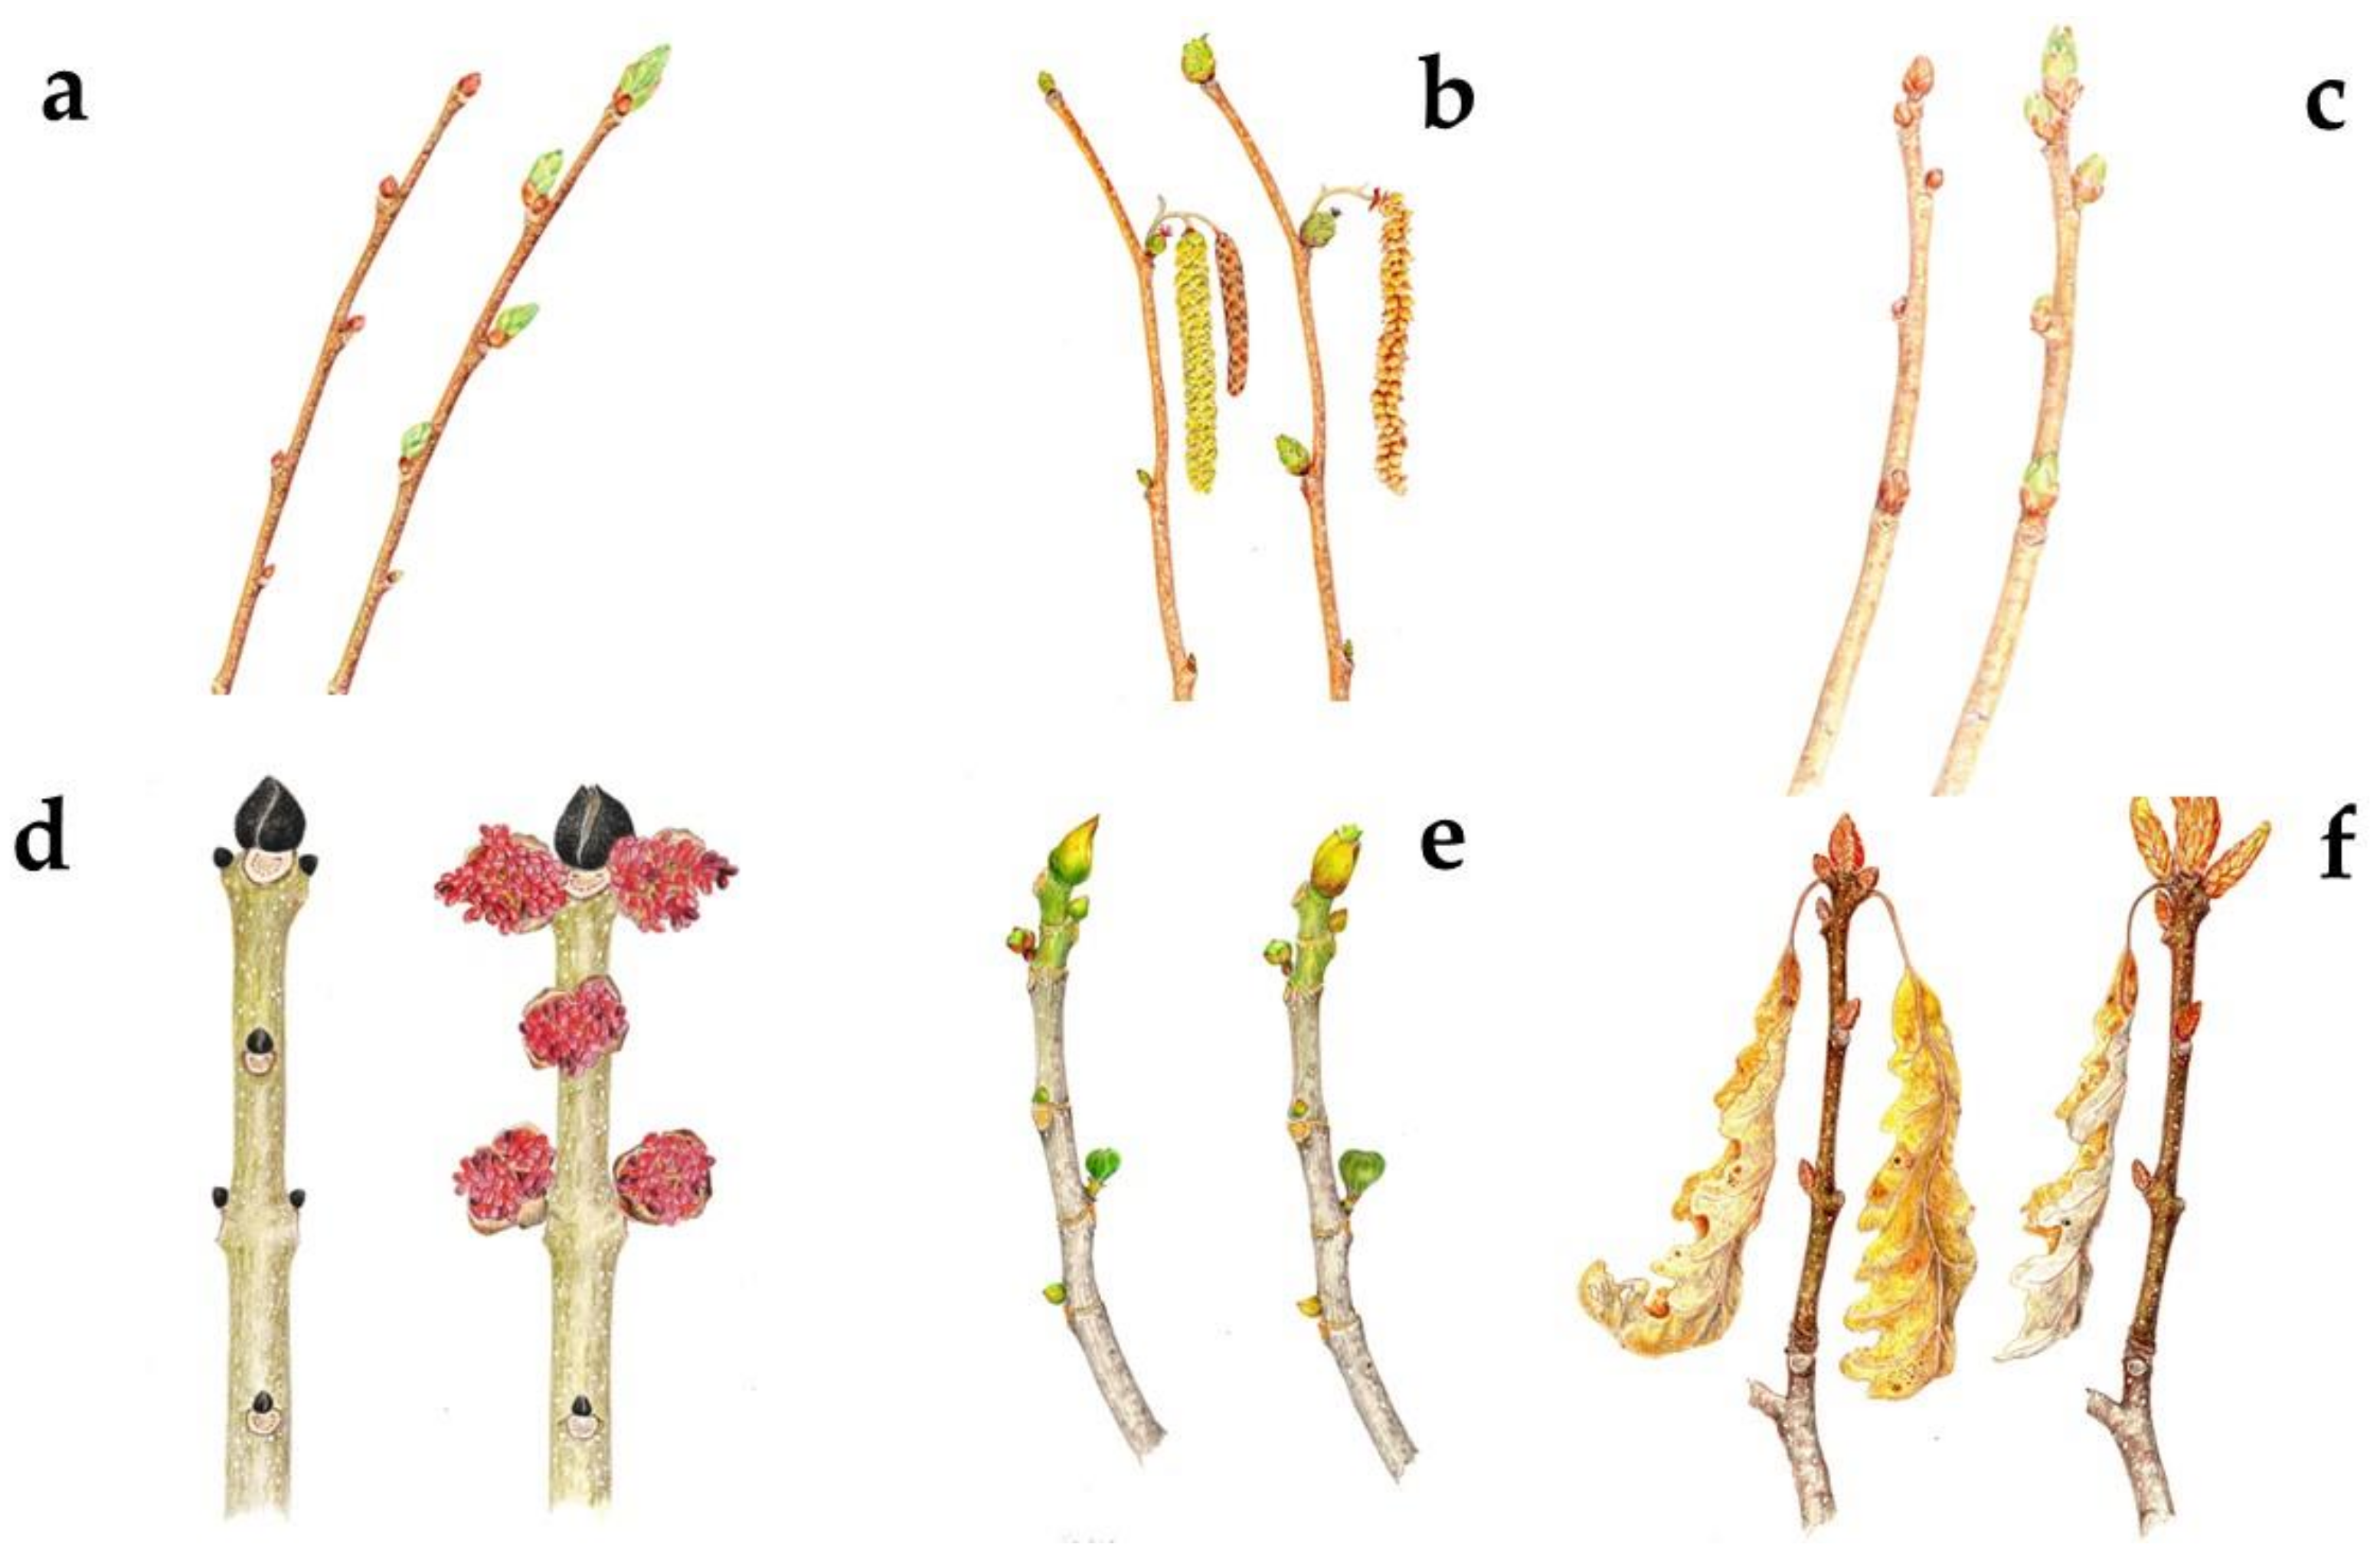
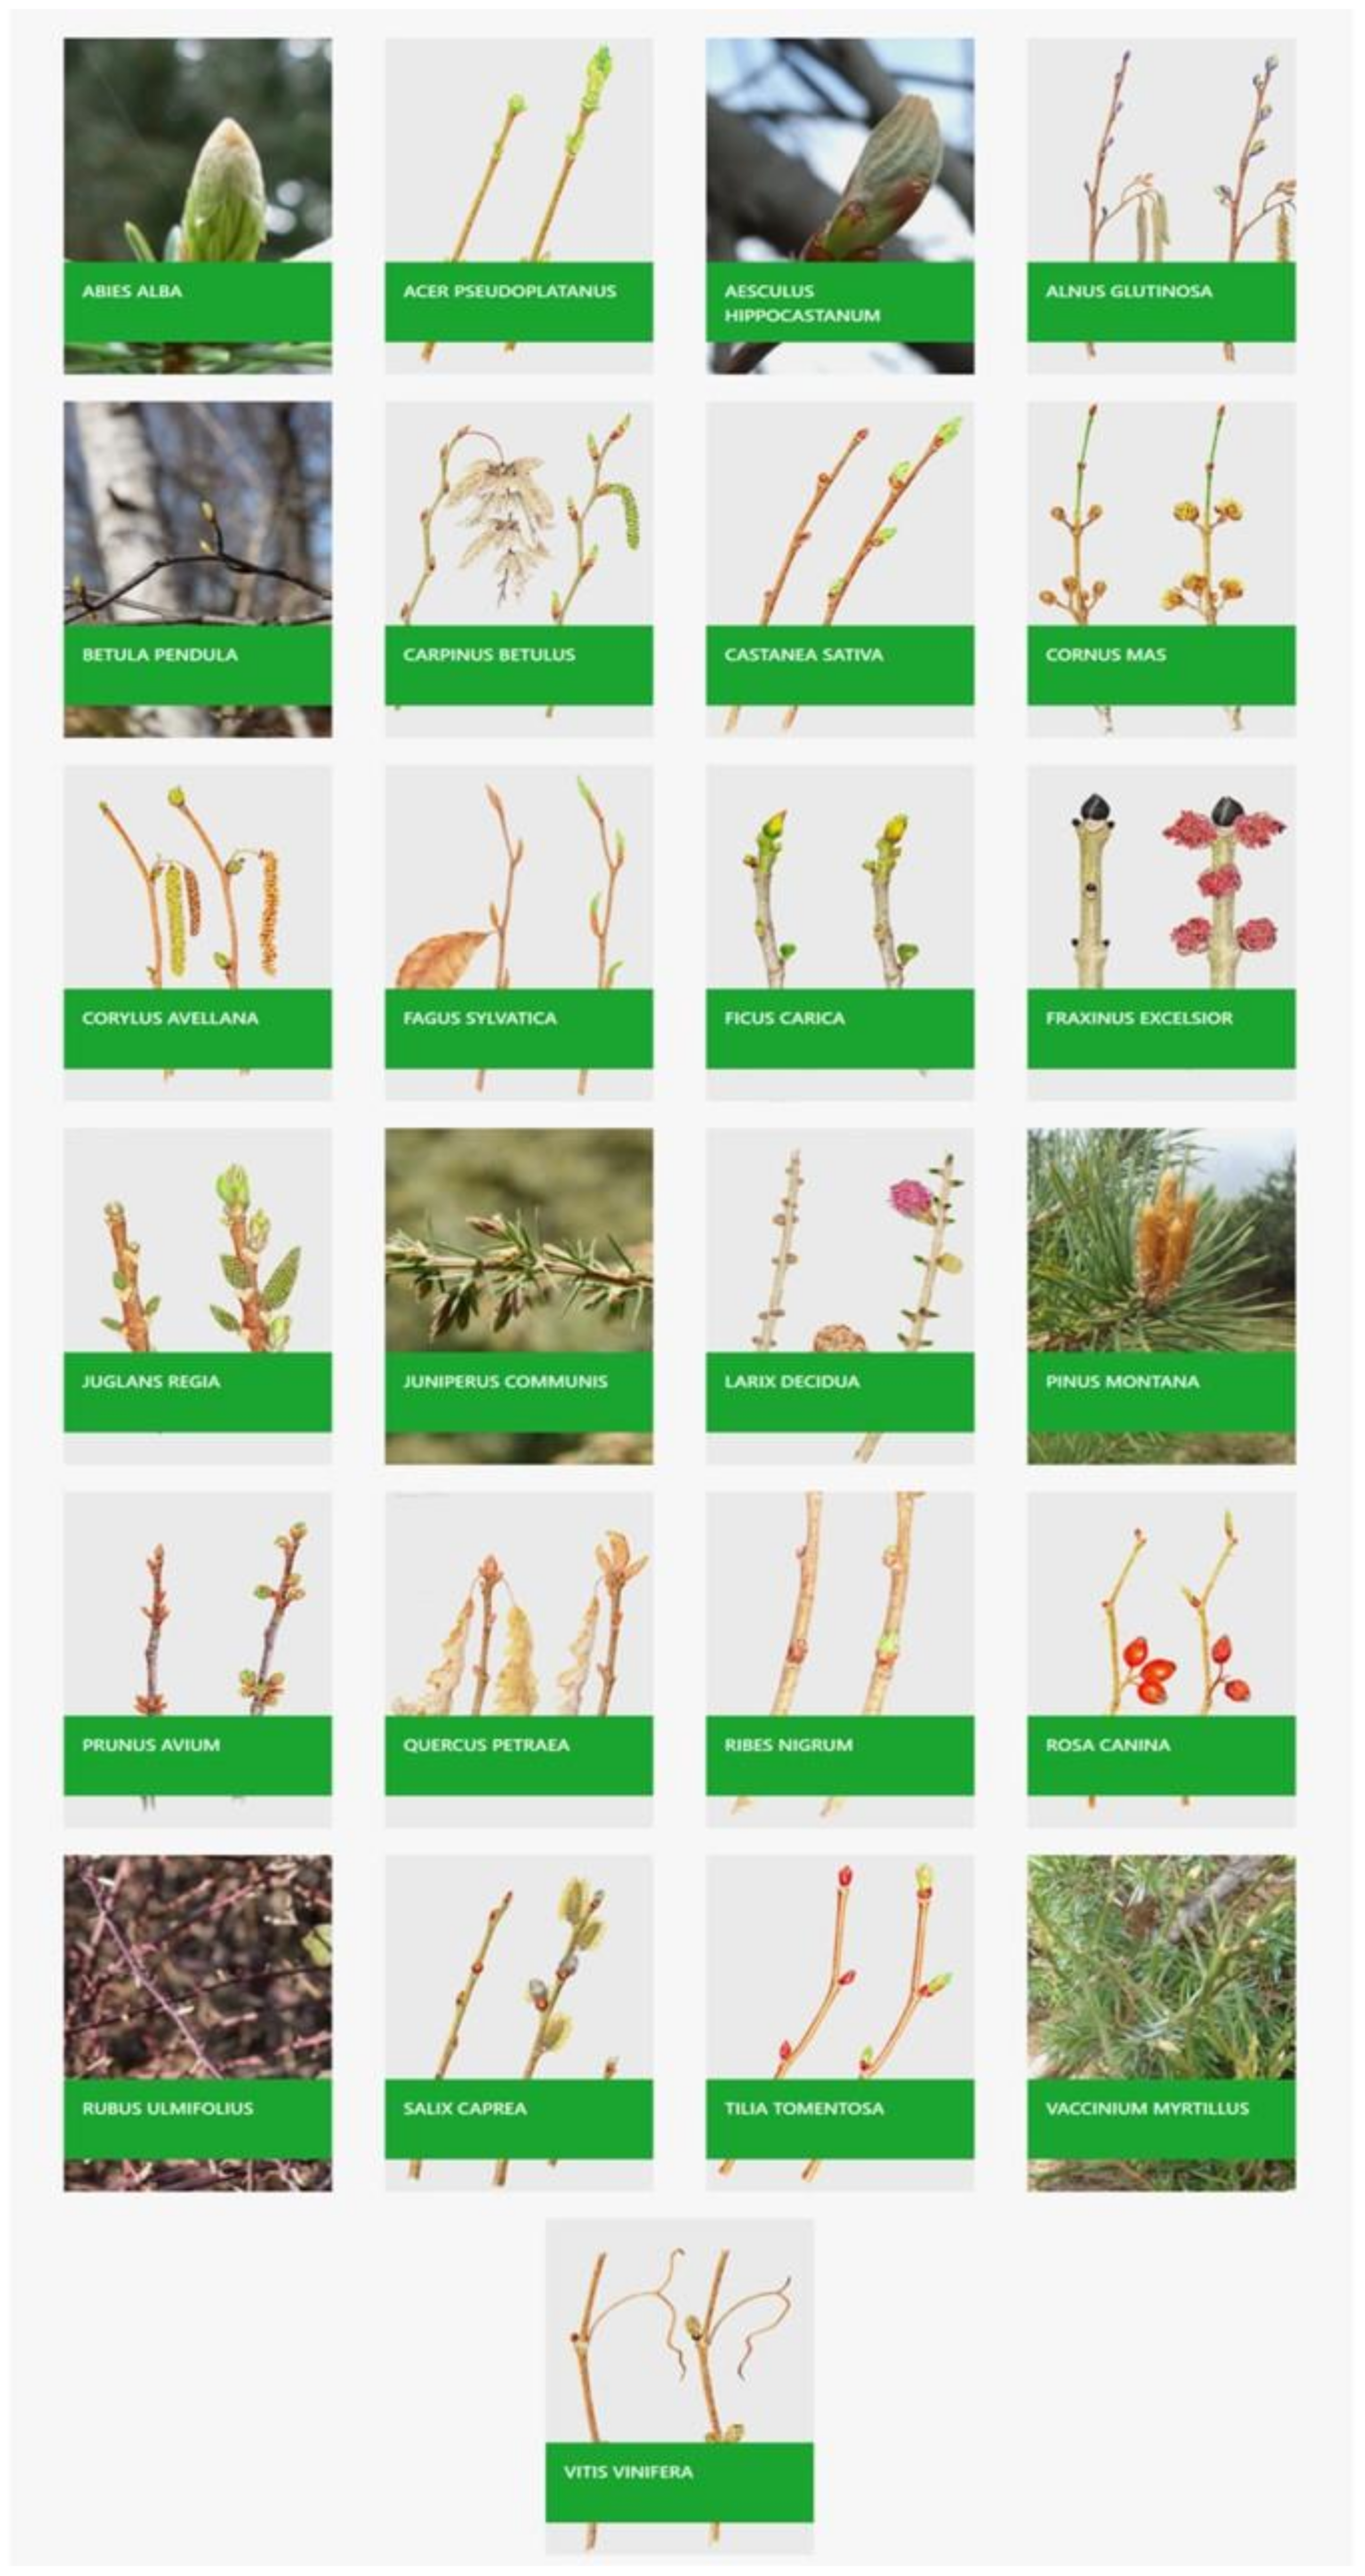
2.1. Plant Material

Buds were collected from plants spontaneously grown in the valleys of Chisone, Pellice, Germanasca, Bronda and Varaita (Turin, Italy) and authenticated by a professional botanist. The BDs were purchased from Geal Pharma (Bricherasio, Turin), an Italian commercial company that produces glyceric macerates and hydroalcoholic solutions from various plant materials (botanicals) located in the Piedmont region. In particular, Castanea sativa buds were collected from the specific sites of Bobbio Pellice, Bricherasio, Perrero, Pagno and Brondello; Corylus avellana buds were collected from Pagno, Bricherasio and Prarostino; Quercus petraea buds were collected in Bricherasio; and Ribes nigrum and Ficus carica buds were collected in Pagno and Brondello, while the sampling sites for the Fraxinus excelsior buds were Paesana, Pagno, Angrogna, Bricherasio, San Germano Chisone and Massello (Figure 1). The geolocalization coordinates, botanical description of each species investigated and some naturalistic botanical illustrations provided by a professional expert in representations of local flora and fauna (Figure 2) are reported in GEMMAPP, which is the first digital application for the recognition of buds and one of the products of the Finnover project [14].

2.2. Chemicals

All chemicals employed for the preparation of the BDs and for the subsequent analysis were of HPLC grade. They were supplied by VWR International S.r.l (Milan, Italy) and Sigma-Aldrich (St. Louis, MO, USA). The purity of the standards used for the HPLC analysis of the BDs is reported in Supplementary Materials (Table S1).

2.3. Bud Derivative Manufacturing

Glyceric macerates (GCs) were prepared from the fresh buds in accordance with the detailed monograph “Homeopathic preparations” in the French Pharmacopoeia (8th edition, 1965) [3]. Particularly, BDs were obtained via traditional cold maceration, starting from the fresh raw material according to the official experimental conditions reported in the French Pharmacopoeia and reproduced in Table 1.
After 21 days of cold maceration, the obtained extracts were filtered using filter papers (Whatman, hardened, ashless circles with diameters of 185 mm), manually pressed, and after 2 days of decanting, they were filtered again. Then BDs were stored in the dark at room temperature (25 ± 1 °C) and under a normal atmosphere (N.A.) until they were analyzed. Before the spectrofluorimetric analysis, the GCs were diluted 1:100, using pure EtOH as solvent instead of their extraction mixture (EtOH:glycerol, 50:50 w/w) to avoid the interference of glycerol with the fluorescence signal. For each of the 6 botanical species investigated in this research study, the BDs analyzed came from different batches and were obtained from different collections from spontaneous growths. The corresponding analytical data were then averaged.

2.4. The Chromatographic Characterization of BDs

In this research, a fingerprint strategy for the phytochemical characterization of BDs was applied using HPLC–DAD protocols. Different polyphenolic groups were considered: the phenolic acids included cinnamic and benzoic acids, catechins and flavonols. The quantitative determination of phenolics was defined using the external standard method. A high-performance liquid chromatograph coupled to an UV-Vis diode array detector (Agilent Technologies, Santa Clara, CA, USA) was used for the chromatographic fingerprint. Four methods were utilized to separate the phenolic compounds on a Kinetex C18 column (4.6 × 150 mm, 5 μm, Phenomenex, Torrance, CA, USA). Several mobile phases were used for phenolic quantification, and UV spectra were recorded at different wavelengths, based on previously validated HPLC methods [4,10], with some modifications. The methods are reported in the Supplementary Materials (Table S1).
Molecules were identified in the BDs via the comparison and combination of their UV spectra and retention times with authentic standards under the same HPLC conditions. All the samples were characterized in triplicate, and the results were reported as mean values ± standard deviations.

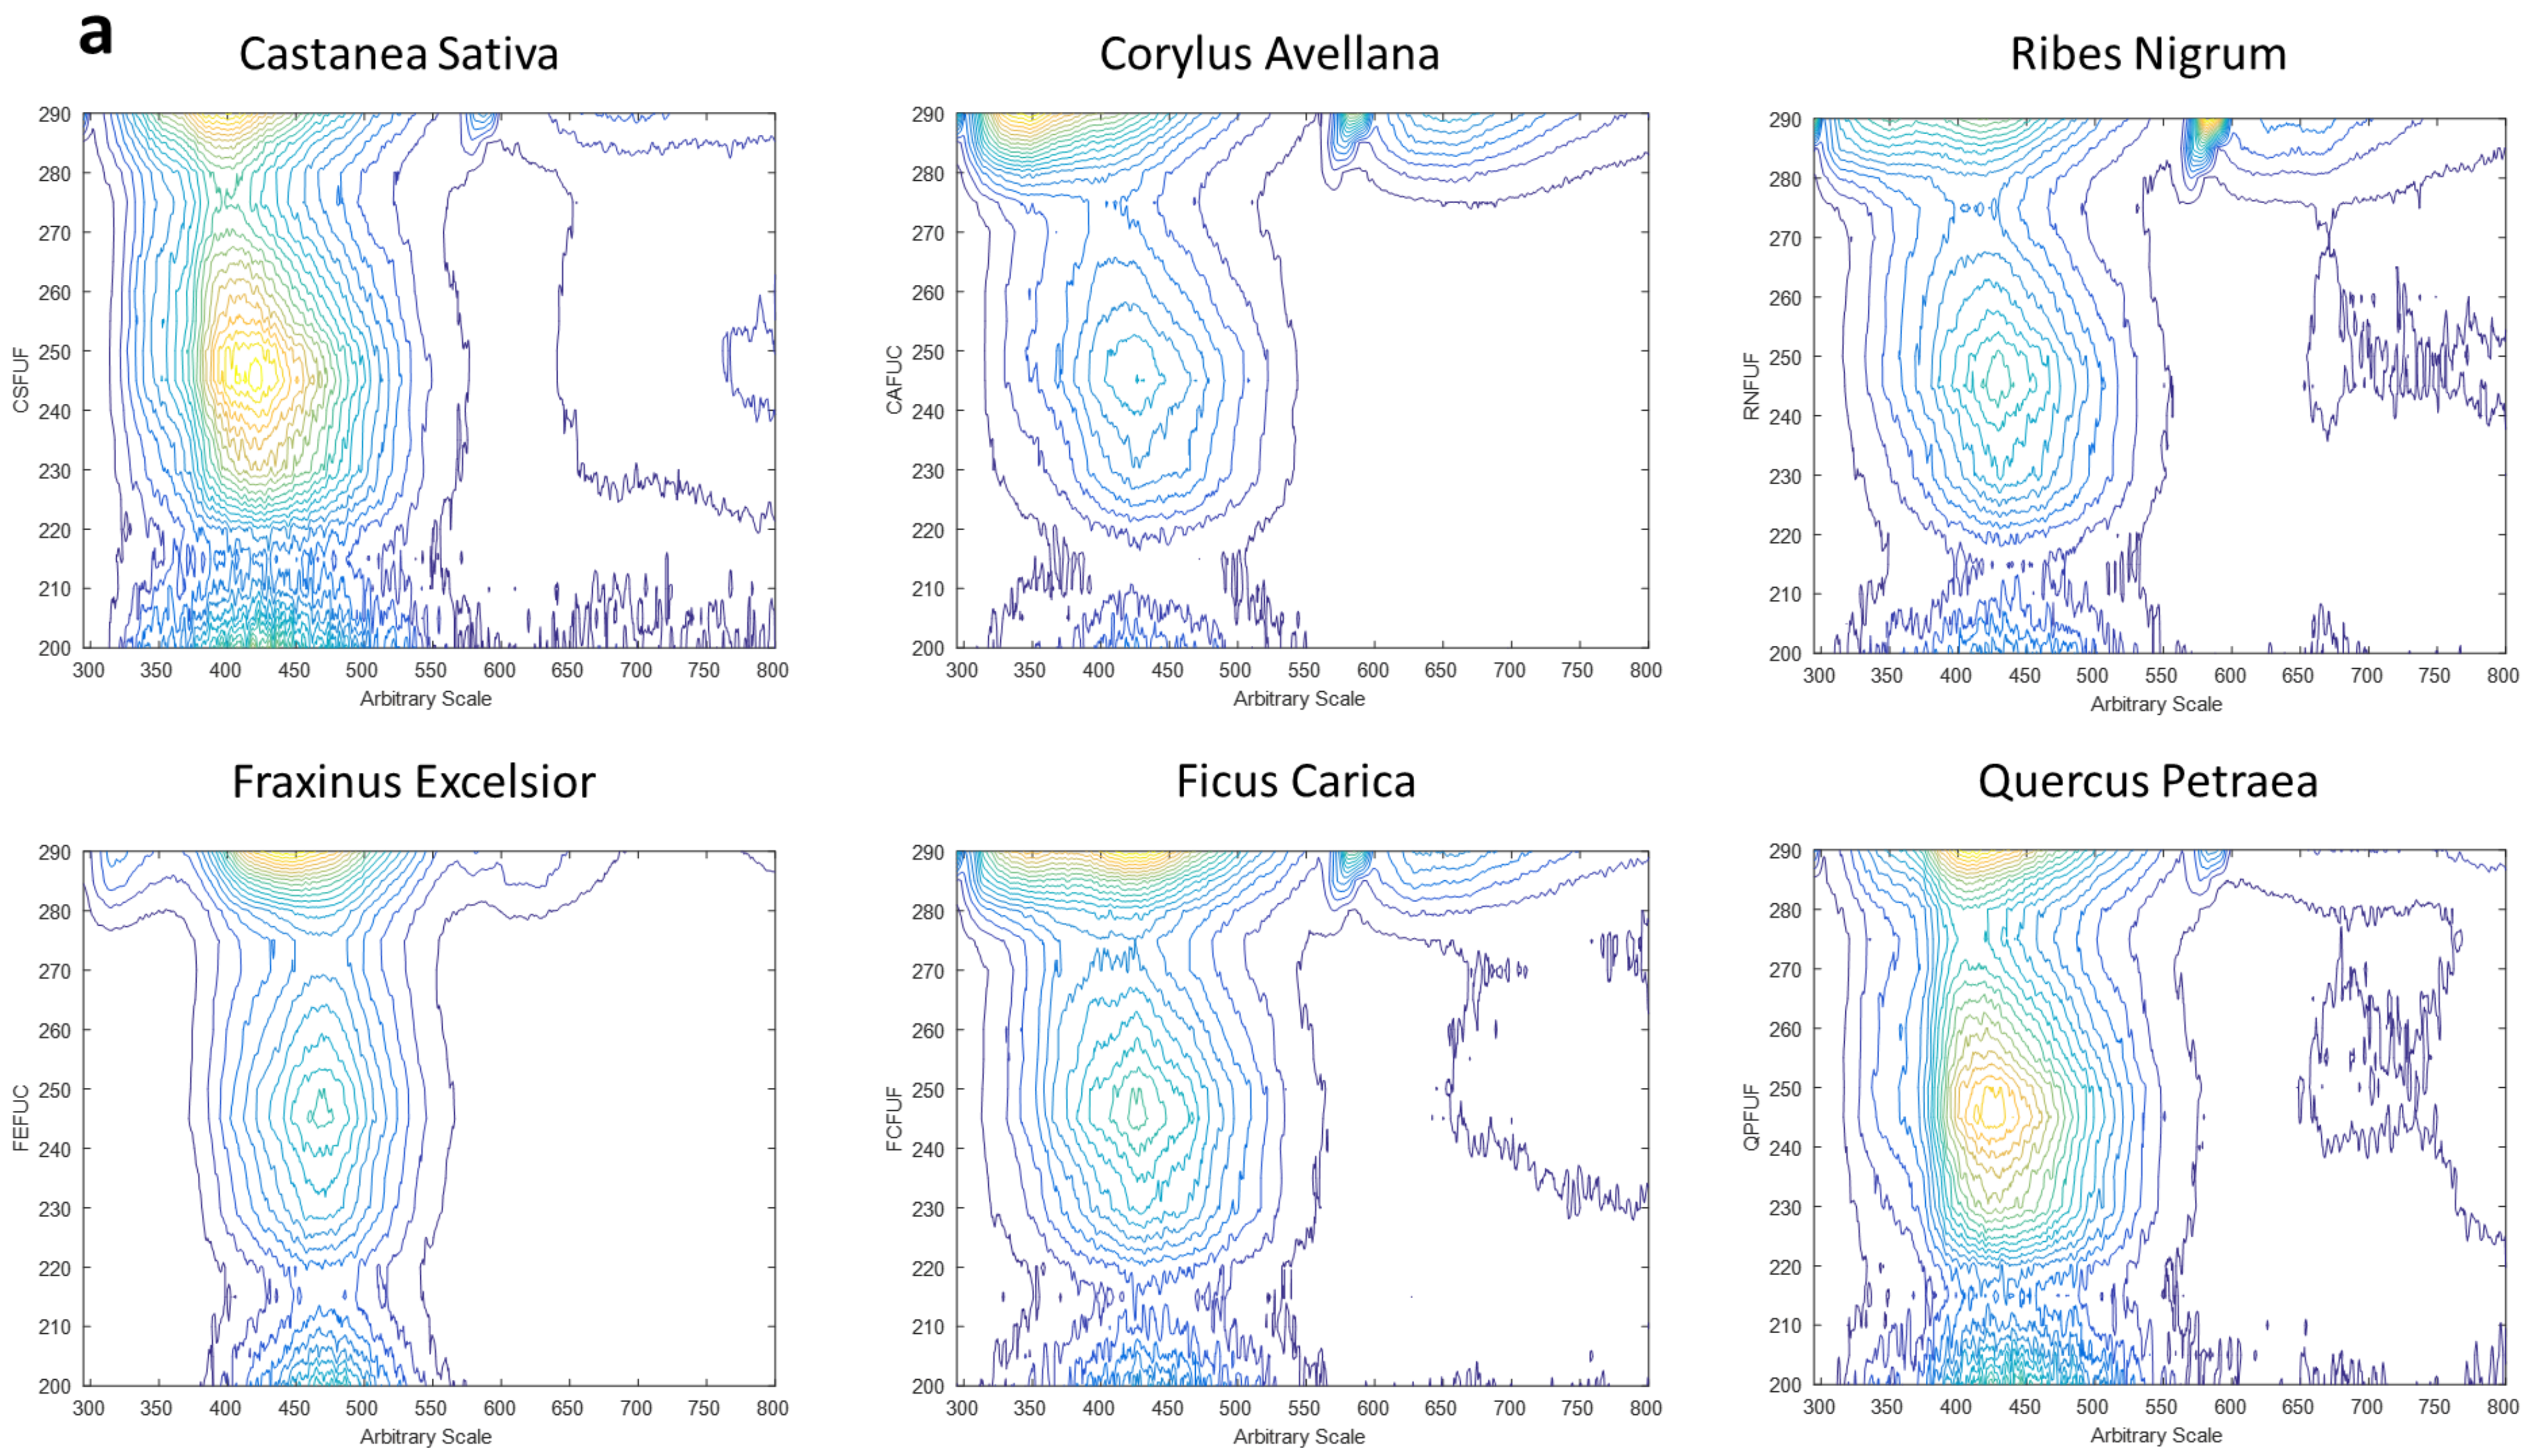
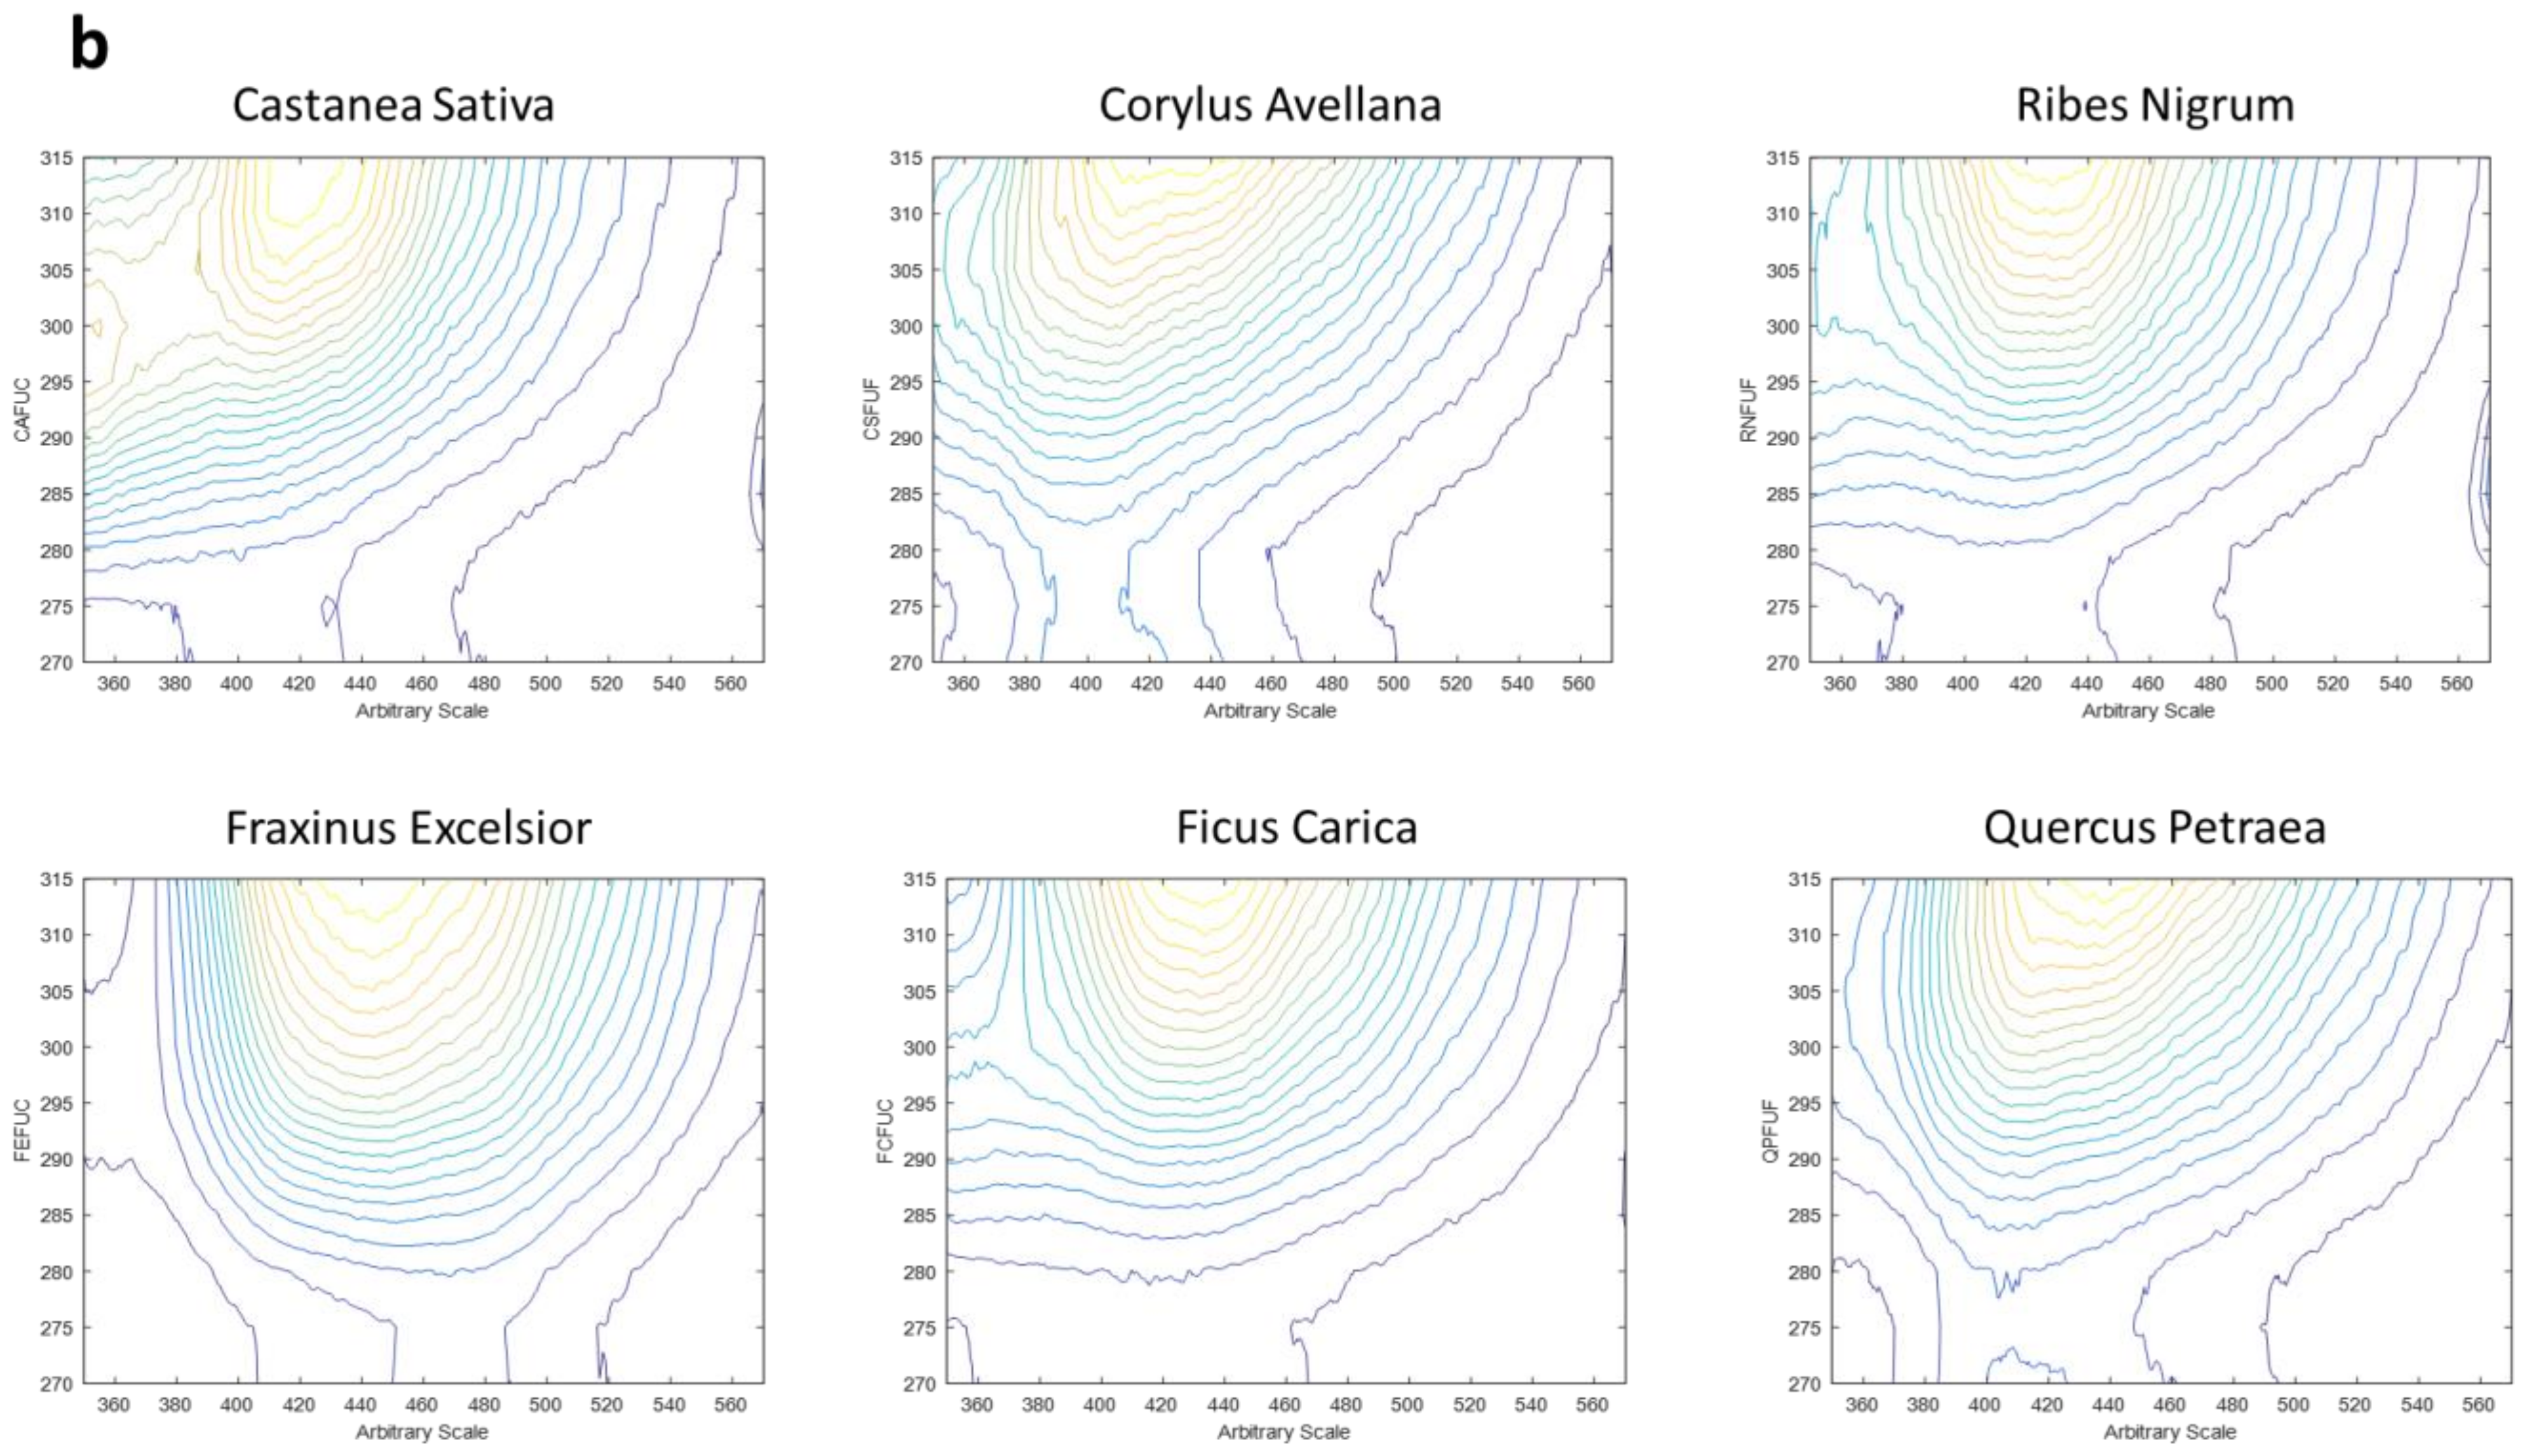
2.5. Three-Dimensional Fluorescence Spectroscopy

The excitation–emission fluorescence matrix (EEM) measurements were obtained at room temperature on a Perkin-Elmer LS 55 Luminescence Spectrometer (Waltham, MA, USA) equipped with a Xenon discharge lamp. A 10 mm optical glass quartz SUPRASIL® cell with volume of 3.5 mL was used. EEMs were recorded, using right-angled geometry, in two different ranges:
  • Range 1, which takes almost the entire emission spectrum, presents emission wave-lengths from 295 to 800 nm (each 0.5 nm) and excitation wavelengths from 200 to 290 nm (each 5 nm).
  • Range 2, which shows a smaller part of the emission spectrum but allows for the investigation of a different excitation range, presents emission wavelengths from 350 to 570 nm (each 0.5 nm) and excitation wavelengths from 270 to 315 nm (each 5 nm).
In both cases, the excitation monochromator slit width was set to 5 nm, while the emission monochromator slit width was set to 10 nm and the scan speed was 1000 nm/min. The spectrometer was interfaced to a computer for controlling the instrumental parameters, recording the spectra and processing the data. The fluorescent signals were registered by the BioLight (BL) Luminescence Systems Spectroscopy Software (FL Winlab, PerkinElmer). All spectra were recorded in triplicate and then averaged.

3. Results and Discussion

As shown in Figure 1, during the balsamic period of the plant, in which the spontaneous collection of fresh buds took place, the plants are often devoid of their distinctive characteristics. Therefore, having useful tools to identify the correct “a posteriori” attribution of the botanical species in commercial BDs is very important for ensuring product quality and safety.

3.1. The Chromatographic Characterization of BDs

Table 2 shows the contents of the main bioactive compounds by their chromatographic fingerprints, which were obtainable under routine conditions and at low costs.
The differences among the six investigated species can be summarized as follows, in accordance with previous similar studies [2,15,16]:
-
FE is very rich in phenolics and cinnamic acids (more than 40% of total phenolics, as shown in Figure 2) and in chlorogenic acid (489.94 ± 0.79 mg/100 g FW), followed by ferulic acid (295.28 ± 0.68 mg/100 g FW); it is also rich in catechins, especially epicatechin (270.51 ± 0.89 mg/100 g FW), and flavonols, especially hyperoside (242.26 ± 0.89 mg/100 g FW), and benzoic acids, especially ellagic acid (214.49 ± 0.69 mg/100 g FW), as shown in Figure 2. Fraxinus excelsior L. (FE) has been widely used in traditional medicine due to several claimed beneficial health effects including antioxidant, anti-inflammatory, anti-rheumatic and anti-pyretic activities [17]. Several findings from in vivo studies showed that the FE extract has hypoglycemic and anti-hyperlipidemic activities, providing anti-diabetic and anti-obesity effects [18,19].
-
QP is particularly rich in ellagic acid (231.56 ± 0.65 mg/100 g FW), catechins (especially epicatechin, 199.92 ± 0.46 mg/100 g FW) and quercitrin (188.45 ± 0.79 mg/100 g FW). The glyceric macerate of Quercus petraea L. (QP) is employed to regularize the action of the intestinal system, to counteract the state of asthenia and to fight against oxidative stress, helping to protect and preserve the well-being of the human organism [20].
-
CA is rich in ellagic acid (193.53 + 2.22 mg/100 g FW), quercetin (171.25 + 14.28 mg/100 g FW) and to a lesser extent, in catechins (about 100 mg/100 g FW), while cinnamic acids (less than 2%) are only represented by caffeic acid in trace amounts (<3 mg/100 g FW), as shown in Figure 2. Corylus avellana L. (CA), the common hazel plant, has been known since ancient times for its astringent and antiedema properties, vasoprotective activity and mild antimicrobial effect: in fact, it was used in traditional medicine for the treatment of edema, hemorrhoids, varicose veins and phlebitis [21]. Nowadays, its characteristic compounds, cyclic diarylheptanoids, are receiving increasing interest due to their remarkable health effects, including anti-inflammatory, anti-emetic, anti-influenza and estrogenic actions [22].
-
CS is characterized by high amounts of flavonols (e.g., quercetin and quercitrin, with about 30 mg/100 g FW) and benzoic acids (e.g., ellagic and gallic acids, with about 50–90 mg/100 g FW), followed by catechins, especially epicatechin (31.02 + 0.17 mg/100 g FW), as shown in Figure 2. Cinnamic acids were quantified in small amounts (less than 15 mg/100 g FW). Castanea sativa Miller (CS) is one of the most widely used herbal medicines thanks to its health-promoting activities, which are due to its high contents of bioactive compounds (polyphenols, organic acids, terpenes and vitamins) [6]. In fact, CS presents antioxidant and curative properties against both cardiovascular and urinary diseases (especially recurrent cystitis), and it is well known for its positive effects on stagnant and vascular fluids [23].
-
FC showed high values of catechins (75.79 + 1.04 mg/100 g FW for catechin and 191.56 + 1.13 mg/100 g FW for epicatechin), flavonols (e.g., quercitrin and hyperoside, with values of about 60–130 mg/100 g FW), and phenolic acids (e.g., coumaric and ellagic acids, with values of about 60 mg/100 g FW). Ficus carica L. (FC) was used in traditional medicine to cure various disorders such as gastrointestinal (dysentery, constipation, colic, ulcers and loss of appetite) and respiratory (coughs, sore throats and bronchial problems) thanks to its anti-inflammatory, antioxidant, antipyretic, antidiabetic, anthelmintic, antimicrobial and anti-carcinogenic activities [24].
-
RN presented a good quercetin and quercitrin contents (about 30–50 mg/100 g FW), ellagic acid (about 70 mg/100 g FW) and catechins (about 60–100 mg/100 g FW). Cinnamic acids were identified in amounts of about 5–20 mg/100 g FW. Ribes nigrum L. (RN) buds are used in medicinal preparations as anti-inflammatory agents for the treatment of dermal diseases, such as eczema and psoriasis, and for the healing of wounds [25,26]. R. nigrum BDs contain high polyphenol contents, especially cate-chins and phenolic acids, and are endowed with antioxidant and anti-inflammatory activities which have been proven to play an important role in the human health in the prevention of several chronic diseases [16,27].
Specific bioactive compounds can be used collectively as representative standards of an extract in quantification, as performed in this study. Bioactive substances (phenolics) were selected, comparing the BD’s health-promoting properties and the most important antioxidant molecules in the literature with important roles in the positive effects on the human organism. Chromatography offers a very powerful separation ability, such that the complex chemical components in plant extracts can be separated into many relatively simple sub-fractions. The most important technique used for the characterization of plant extracts is to measure the concentration of one or very few markers or active components (“marker approach”) [28]. This approach is far from satisfactory, as the biological activity is due to more than one or two single chemical compounds. The “multi-marker approach” used in this research is the natural extension of the “marker approach”. It uses many, or even all, of the identified substances (the chemical profile of the considered sample) to represent the whole sample [29,30,31]. This approach is applied to many complex systems (e.g., herbs, herbal preparations, food supplements and foodstuffs). It is impossible to consider all the bioactive substances that may be included in the extracts due to the very high number of potential molecules; thanks to the multi-marker approach, the composition is approximated to the most important compounds with biological activities (demonstrated in the literature). The higher the number of markers, the smaller the approximation will be. In this case, four phenolic classes (13 markers) were selected for the evaluation.
Even if chromatographic fingerprints have proved to be very useful in discriminating among the BDs derived from the six considered different species [5,32], they are neither rapid nor non-destructive. However, spectroscopic techniques offer simple, rapid and non-destructive means of analyzing samples while providing quite similar information in terms of the rapid screening of different vegetable species [33].

3.2. Three-Dimensional Fluorescence Spectroscopy

Fluorescence spectroscopy has shown great potential for the characterization of food products because they contain many fluorescent molecules (fluorophores) whose emissions can be considered characteristic fingerprints of specific food samples [34,35]. In this study, fluorescence spectroscopy was applied to this category of herbal food supplements (botanicals), and the observed changes in intrinsic fluorescence were studied via plotting the fluorescence values as images (with intensity represented via color coding) of two-dimensional fluorescence excitation–emission landscapes, in which the characteristic circular patterns were used to identify regions that could be attributed to specific fluorophores. Figure 3 shows the contour plots of the six different species for each spectral range (Figure 3a,b) that were evaluated in the spectroscopic analysis. To provide a meaningful qualitative evaluation of the fluorescence data, both the ranges used for recording the fluorescence spectra are considered in the discussion.
According to the literature, it is important to consider that the emission maxima of many different phenolic compounds can be observed in approximately the same spectral region. However, thanks to the combination of the information obtained via both the spectral ranges considered, it is possible to observe two different spectral regions as a result of the fluorescent properties of BDs. Excitation in the more energetic wavelength of 250 nm results in an emission between 400 and 440 nm, while excitation at wavelengths longer than 300 nm results in an emission between 420 and 450 nm [36]. The first spectral region reported in Figure 3a is ascribable to phenolic acids and cinnamic-like and benzoic-like acids, which present maximum emissions between 400–440 nm. This peak, which was detectable in all the samples analyzed, has higher intensity values in CS and QP fluorescence emission spectra that are also rich in ellagic and gallic acids according to their chromatographic characterizations. As reported by Casale et al. [37] for green tea samples, at 270/420 nm, it is also possible to study the contents of catechins, which contribute to the generation of this broad peak. However, the second spectral range (Figure 3b) allows one to better characterize the emissions relating to other flavonol compounds, especially quercitrin and quercetin, which present excitation/emission maxima at 310/430 nm, as reported by Milosavljević et al. [38]. This characteristic peak has been observed in all six species of BDs, with higher intensities in the QP, CA, FE and FC samples, confirming the outcomes of the quantitative analysis (data are shown in the Supplementary Materials, Figure S1).

3.3. GEMMAPP

GEMMAPP, one of the products of the Finnover project, is the first digital application for the recognition of vegetable buds. The goal of this webAPP is to provide professionals with a repository of scientific information and technical data on BDs, which represent an increasingly interesting but still little-studied plant matrix.
The webAPP, which is currently presented in Italian as one of the languages of the Alcotra territory but will soon also be available in other languages, can be freely consulted (http://www.gemmapp.it, accessed on 20 May 2023) by common people and professionals, providing descriptions of the main tree species at the base of the most commercial BDs. Twenty-five botanical species are described in the webAPP, as reported in Figure 4. In particular, for each species, agronomic, environmental, biological and chemical data are reported.
The framework of GEMMAPP is schematized in Figure 5.
Different levels can be consulted for each species: the first level presents the botanical characterization, namely, information relating to geographical distribution and habitat, size and habit, the characteristics and peculiarities of buds, elements of recognition and phenological stage at the time of collection, etc. (Figure 6a). The second level shows a gallery of pictures of buds at the correct phenological stage to help the collector properly identify them at the time of collection. In addition, in this section, there are also some naturalistic botanical illustrations which were created by a professional expert in representations of local flora and fauna (Figure 6b).
Figure 6c shows the geolocation coordinates of the main bud-collecting sites within the Alcotra territory, which includes for Italy the Valle d’Aosta Region, the Provinces of Torino and Cuneo (Piemonte Region) and the Province of Imperia (Liguria Region), while for France, the Departments of Haute-Savoie and Savoie (Auvergne-Rhone-Alpes Region) and the Departments of Hautes-Alpes, Alpes de Haute-Provence and Alpes-Maritimes (Provence-Alpes-Côte d’Azur Region) are represented.
The last level of the webApp, which is ready to be implemented, has the purpose of collecting all the scientific data obtained not from the starting vegetable matrix (buds) but from the BDs, namely, the finished products. Untargeted spectroscopic analyses (UV-Visible and 2D/3D Fluorescence, FT-IR) targeted chromatographic data and biological test results will be inserted to provide an overview of the Finnover project results.

4. Conclusions

The aim of this study was to propose a method for accurately identifying the botanical species in commercial bud derivatives (BDs) in order to ensure their quality and safety. It is important to highlight that many commercial products derived from vegetable buds use plant material obtained from spontaneous harvests. This can lead to the false identification of the botanical species to which the material belongs and the consequent placement =of non-conforming products on the market, which may sometimes even potentially dangerous for the consumer. The development of rapid and easy-to-use methods for self-monitoring for the producing companies constitutes an important step forward to ensure the authenticity of these supplements. However, the applicability of rapid, non-destructive analytical methods (i.e., spectroscopic methods) requires a preliminary study to ensure their efficiency and validity in providing data that are as useful the data obtained via official methods (i.e., chromatographic methods).
The researchers applied a fingerprint strategy, using high-performance liquid chromatography with diode array detection (HPLC-DAD) protocols for the phytochemical characterization of the BDs. Additionally, they used emission fluorescence spectroscopy to provide a preliminary qualitative characterization of the samples.
The results showed that the proposed fluorimetric method was a rapid, non-destructive and cost-effective tool for identifying specific spectral regions related to the bioactive compounds (i.e., flavonols and cinnamic and benzoic acids). These findings were consistent with the outcomes of the targeted chromatographic analysis (HPLC-DAD), which provided a comprehensive phytochemical profile for each BD.
In the future, further research will be needed to validate these preliminary results obtained with six botanical species. Additionally, expanding the dataset will allow for the application of more advanced multivariate approaches for both qualitative and quantitative characterizations of the phenolic profiles of different botanical species.
The data obtained from this research can be included in the GEMMAPP database, along with other published data, to provide a comprehensive overview of BDs and buds. These natural products are increasingly used, but the research in this field is still limited. By adding more data to the database, researchers can gain a better understanding of these products and ensure their quality and safety in the market.

Supplementary Materials

The following supporting information can be downloaded at: https://www.mdpi.com/article/10.3390/app13158679/s1, Table S1: Conditions of the HPLC methods used for the chromatographic analysis; Figure S1: 3D EEM excitation–emission spectra.

Author Contributions

Conceptualization, R.B., G.L.B., A.P., F.T., D.D., M.G. (Massimo Grilli) and M.G. (Maddalena Guido); formal analysis, F.T., E.M. and D.D.; investigation, F.T., D.D., F.G. and E.M.; resources, T.F.; writing—original draft preparation, F.T., E.M. and D.D.; writing—review and editing, R.B., G.L.B., A.P., M.G. (Maddalena Guido) and M.G. (Massimo Grilli); supervision, R.B., A.P., G.L.B. and M.G. (Massimo Grilli); funding acquisition, R.B., G.L.B. and A.P. All authors have read and agreed to the published version of the manuscript.

Funding

This research was funded by a European Union project called FINNOVER (n◦ 1198), http://www.interreg-finnover.com/, accessed on 20 May 2023. This work was also supported by the Project National Center for the Development of New Technologies in Agriculture (Agritech), funded under the National Recovery and Resilience Plan (NRRP), Mission 4 Component 2 Investment 1.4—Call for tender No. 3138 of 16 December 2021, rectified by Decree n. 3175 of 18 December 2021 of the Italian Ministry of University and Research, funded by the European Union, NextGenerationEU, Project code_CN 00000022, Concession Decree No. 1032 of 17 June 2022, adopted by the Italian Ministry of University and Research, CUP B63D21015240004.

Institutional Review Board Statement

Not applicable.

Informed Consent Statement

Not applicable.

Data Availability Statement

Data sharing is not applicable to this article.

Conflicts of Interest

The authors declare no conflict of interest.

References

  1. FINNOVER Interreg Alcotra Project 2017–2020. Available online: http://www.interreg-finnover.com/ (accessed on 2 April 2021).
  2. Turrini, F.; Donno, D.; Beccaro, G.L.; Pittaluga, A.; Grilli, M.; Zunin, P.; Boggia, R. Bud-derivatives, a novel source of polyphenols and how different extraction processes affect their composition. Foods 2020, 9, 1343. [Google Scholar] [CrossRef] [PubMed]
  3. Pharmacopée Française. Codex Medicamentarius Gallicus, Codex Français: Monographie, Préparations Homéopathiques; Ordre National des Pharmaciens: Paris, France, 1965. Available online: http://ansm.sante.fr/Mediatheque/Publications/Pharmacopee-francaise-Plan-Preambule-index (accessed on 21 March 2023).
  4. Donno, D.; Mellano, M.G.; Cerutti, A.K.; Beccaro, G.L. Biomolecules and Natural Medicine Preparations: Analysis of New Sources of Bioactive Compounds from Ribes and Rubus spp. Buds. Pharmaceuticals 2016, 9, 7. [Google Scholar] [CrossRef] [PubMed] [Green Version]
  5. Donno, D.; Beccaro, G.L.; Cerutti, A.K.; Mellano, M.G.; Bounous, G. Bud Extracts as New Phytochemical Source for Herbal Preparations-Quality Control and Standardization by Analytical Fingerprint. In Phytochemicals—Isolation, Characterisation and Role in Human Health, 1st ed.; Rao, A.V., Rao, L.G., Eds.; InTech: Rijeka, Croatia, 2015; pp. 187–218. [Google Scholar]
  6. Turrini, F.; Donno, D.; Boggia, R.; Beccaro, G.L.; Zunin, P.; Leardi, R.; Pittaluga, A.M. An innovative green extraction and re-use strategy to valorize food supplement by-products: Castanea sativa bud preparations as case study. Food Res. Int. 2019, 115, 276–282. [Google Scholar] [CrossRef] [PubMed]
  7. Allio, A.; Calorio, C.; Franchino, C.; Gavello, D.; Carbone, E.; Marcantoni, A. Bud extracts from Tilia tomentosa Moench inhibit hippocampal neuronal firing through GABAA and benzodiazepine receptors activation. J. Ethnopharmacol. 2015, 172, 288–296. [Google Scholar] [CrossRef]
  8. Calorio, C.; Donno, D.; Franchino, C.; Carabelli, V.; Marcantoni, A. Bud extracts from Salix caprea L. inhibit voltage gated calcium channels and catecholamines secretion in mouse chromaffin cells. Phytomedicine 2017, 36, 168–175. [Google Scholar] [CrossRef]
  9. Turrini, F.; Vallarino, G.; Cisani, F.; Donno, D.; Beccaro, G.L.; Zunin, P.; Boggia, R.; Pittaluga, A.; Grilli, M. Use of an Animal Model to Evaluate Anxiolytic Effects of Dietary Supplementation with Tilia tomentosa Moench Bud Extracts. Nutrients 2020, 12, 3328. [Google Scholar] [CrossRef]
  10. Lakowicz, J.R. Principles of Fluorescence Spectroscopy, 3rd ed.; Kluwer Academic/Plenum: New York, NY, USA, 2007; pp. 63–94. [Google Scholar]
  11. Barbieri, D.; Gabriele, M.; Summa, M.; Colosimo, R.; Leonardi, D.; Domenici, V.; Pucci, L. Antioxidant, Nutraceutical Properties, and Fluorescence Spectral Profiles of Bee Pollen Samples from Different Botanical Origins. Antioxidants 2020, 9, 1001. [Google Scholar] [CrossRef]
  12. Sádecká, J.; Jakubíková, M. Varietal classification of white wines by fluorescence spectroscopy. J. Food Sci. Technol. 2020, 57, 2545–2553. [Google Scholar] [CrossRef] [PubMed]
  13. Sikorska, E.; Nowak, P.; Pawlak-Lemańska, K.; Sikorski, M. Characterization and Classification of Direct and Commercial Strawberry Beverages Using Absorbance–Transmission and Fluorescence Excitation–Emission Matrix Technique. Foods 2022, 11, 2143. [Google Scholar] [CrossRef]
  14. GEMMAPP. Available online: http://www.gemmapp.it/ (accessed on 20 March 2023).
  15. Donno, D.; Turrini, F.; Boggia, R.; Guido, M.; Gamba, G.; Mellano, M.G.; Riondato, I.; Beccaro, G.L. Sustainable Extraction and Use of Natural Bioactive Compounds from the Waste Management Process of Castanea spp. Bud-Derivatives: The FINNOVER Project. Sustainability 2020, 12, 10640. [Google Scholar] [CrossRef]
  16. Turrini, F.; Donno, D.; Beccaro, G.L.; Zunin, P.; Pittaluga, A.; Boggia, R. Pulsed Ultrasound-Assisted Extraction as an Alternative Method to Conventional Maceration for the Extraction of the Polyphenolic Fraction of Ribes nigrum Buds: A New Category of Food Supplements Proposed by The FINNOVER Project. Foods 2019, 8, 466. [Google Scholar] [PubMed] [Green Version]
  17. Naderi, M.; Torbati, M.; Azadmard-Damirchi, S.; Asnaashari, S.; Savage, G.P. Common ash (Fraxinus excelsior L.) seeds as a new vegetable oil source. LWT 2020, 131, 109811. [Google Scholar] [CrossRef]
  18. Ibarra, A.; Bai, N.; He, K.; Bily, A.; Cases, J.; Roller, M.; Sang, S. Fraxinus excelsior seed extract FraxiPureTM limits weight gains and hyperglycemia in high-fat diet-induced obese mice. Phytomedicine 2011, 18, 479–485. [Google Scholar] [CrossRef]
  19. Visen, P.; Saraswat, B.; Visen, A.; Roller, M.; Bily, A.; Mermet, C.; He, K.; Bai, N.; Lemaire, B.; Lafay, S.; et al. Acute effects of Fraxinus excelsior L. seed extract on postprandial glycemia and insulin secretion on healthy volunteers. J. Ethnopharmacol. 2009, 126, 226–232. [Google Scholar] [CrossRef] [PubMed]
  20. Eaton, E.G.S.D.J.; Caudullo, G.; Oliveira, S.; De Rigo, D. Quercus robur and Quercus petraea in Europe: Distribution, habitat, usage and threats. In European Atlas of Forest Tree Species; Public Office of the European Union: Luxembourg, 2016; pp. 162–163. [Google Scholar]
  21. Cerulli, A.; Masullo, M.; Montoro, P.; Hošek, J.; Pizza, C.; Piacente, S. Metabolite profiling of ‘green’ extracts of Corylus avellana leaves by 1H NMR spectroscopy and multivariate statistical analysis. J. Pharm. Biomed. Anal. 2018, 160, 168–178. [Google Scholar] [CrossRef] [PubMed]
  22. Cerulli, A.; Lauro, G.; Masullo, M.; Cantone, V.; Olas, B.; Kontek, B.; Nazzaro, F.; Bifulco, G.; Piacente, S. Cyclic Diarylheptanoids from Corylus avellana Green Leafy Covers: Determination of Their Absolute Configurations and Evaluation of Their Antioxidant and Antimicrobial Activities. J. Nat. Prod. 2017, 80, 1703–1713. [Google Scholar] [CrossRef]
  23. Donno, D.; Beccaro, G.L.; Mellano, M.G.; Bonvegna, L.; Bounous, G. Castanea spp. buds as a phytochemical source for herbal preparations: Botanical fingerprint for nutraceutical identification and functional food standardization. J. Sci. Food Agric. 2014, 94, 2863–2873. [Google Scholar] [CrossRef] [PubMed]
  24. Barolo, M.I.; Ruiz Mostacero, N.; López, S.N. Ficus carica L. (Moraceae): An ancient source of food and health. Food Chem. 2014, 164, 119–127. [Google Scholar] [CrossRef]
  25. Dvaranauskaite, A.; Venskutonis, P.R.; Raynaud, C.; Talou, T.; Viškelis, P.; Dambrauskiene, E. Characterization of steam volatiles in the essential oil of black currant buds and the antioxidant properties of different bud extracts. J. Agric. Food Chem. 2008, 56, 3279–3286. [Google Scholar] [CrossRef] [PubMed]
  26. Tabart, J.; Franck, T.; Kevers, C.; Pincemail, J.; Serteyn, D.; Defraigne, J.O.; Dommes, J. Antioxidant and anti-inflammatory activities of Ribes nigrum extracts. Food Chem. 2012, 131, 1116–1122. [Google Scholar] [CrossRef]
  27. Donno, D.; Beccaro, G.L.; Mellano, M.G.; Cerutti, A.K.; Marconi, V.; Bounous, G. Botanicals in Ribes nigrum bud-preparations: An analytical fingerprinting to evaluate the bioactive contribution to total phytocomplex. Pharm. Biol. 2013, 51, 1282–1292. [Google Scholar] [CrossRef] [PubMed]
  28. Mok, D.K.W.; Chau, F.T. Chemical information of Chinese medicines: A challenge to chemist. Chemom. Intell. Lab. Syst. 2006, 82, 210–217. [Google Scholar] [CrossRef]
  29. Donno, D.; Mellano, M.G.; Gamba, G.; Riondato, I.; Beccaro, G.L. Analytical strategies for fingerprinting of antioxidants, nutritional substances, and bioactive compounds in foodstuffs based on high performance liquid chromatography–mass spectrometry: An overview. Foods 2020, 9, 1734. [Google Scholar] [CrossRef]
  30. Fan, X.-H.; Cheng, Y.-Y.; Ye, Z.-L.; Lin, R.-C.; Qian, Z.-Z. Multiple chromatographic fingerprinting and its application to the quality control of herbal medicines. Anal. Chim. Acta 2006, 555, 217–224. [Google Scholar] [CrossRef]
  31. Feng, X.; Kong, W.; Wei, J.; Ou-Yang, Z.; Yang, M. Hplc fingerprint analysis combined with chemometrics for pattern recognition of ginger. Pharm. Biol. 2014, 52, 362–367. [Google Scholar] [CrossRef] [PubMed]
  32. Donno, D.; Beccaro, G.L.; Carlen, C.; Ancay, A.; Cerutti, A.K.; Mellano, M.G.; Bounous, G. Analytical fingerprint and chemometrics as phytochemical composition control tools in food supplement analysis: Characterization of raspberry bud-preparations of different cultivars. J. Sci. Food Agric. 2016, 96, 3157–3168. [Google Scholar] [CrossRef] [PubMed]
  33. Boggia, R.; Turrini, F.; Anselmo, M.; Zunin, P.; Donno, D.; Beccaro, G.L. Feasibility of UV–VIS-Fluorescence Spectroscopy combined with pattern recognition techniques to authenticate a new category of plant food supplements. J. Food Sci. Technol. 2017, 54, 2422–2432. [Google Scholar] [CrossRef]
  34. Murphy, K.R.; Stedmon, C.A.; Graeber, D.; Bro, R. Fluorescence spectroscopy and multy-way techniques. PARAFAC. Anal. Methods 2013, 5, 6557–6566. [Google Scholar] [CrossRef] [Green Version]
  35. Włodarska, K.; Pawlak-Lemańska, K.; Khmelinskii, I.; Sikorska, E. Explorative study of apple juice fluorescence in relation to antioxidant properties. Food Chem. 2016, 210, 593–599. [Google Scholar] [CrossRef] [Green Version]
  36. Rodrıguez-Delgado, M.A.; Malovana, S.; Perez, J.P.; Borges, T.; Montelongo, F.G. Separation of phenolic compounds by high-performance liquid chromatography with absorbance and fluorimetric detection. J. Chromatogr. A 2001, 912, 249–257. [Google Scholar] [CrossRef]
  37. Casale, M.; Pasquini, B.; Hooshyari, M.; Orlandini, S.; Mustorgi, E.; Malegori, C.; Turrini, F.; Ortiz, M.C.; Sarabia, L.A.; Furlanetto, S. Combining excitation-emission matrix fluorescence spectroscopy, parallel factor analysis, cyclodextrin-modified micellar electrokinetic chromatography and partial least squares class-modelling for green tea characterization. J. Pharm. Biomed. Anal. 2018, 159, 311–317. [Google Scholar] [CrossRef] [PubMed]
  38. Milosavljević, D.M.; Mutavdžić, D.R.; Radotić, K.; Milivojević, J.M.; Maksimović, V.M.; Dragišić Maksimović, J.J. Phenolic profiling of 12 strawberry cultivars using different spectroscopic methods. J. Agric. Food Chem. 2020, 68, 4346–4354. [Google Scholar] [CrossRef] [PubMed]
Figure 1. The buds of the six BDs investigated in the present work: (a) Castanea sativa, (b) Corylus avellana, (c) Ribes nigrum, (d) Fraxinus excelsior, (e) Ficus carica and (f) Quercus petraea.
Applsci 13 08679 g001
Figure 2. The naturalistic botanical illustrations of buds investigated in the present work: (a) Castanea sativa, (b) Corylus avellana, (c) Ribes nigrum, (d) Fraxinus excelsior, (e) Ficus carica and (f) Quercus petraea.
Applsci 13 08679 g002
Figure 3. (a) BDs Excitation-Emission contour plots in Range 1 (emission wavelengths from 295 to 800 nm and excitation ones from 200. (b) BDs’ excitation–emission contour plots in Range 2 (emission wavelengths from 350 to 570 nm and excitation wavelengths from 270 to 315 nm).
Applsci 13 08679 g003aApplsci 13 08679 g003b
Figure 4. The 25 botanical species described in GEMMAPP.
Applsci 13 08679 g004
Figure 5. The framework of GEMMAPP.
Applsci 13 08679 g005
Figure 6. Botanical characterization, gallery and geolocation of the main collecting sites within the Alcotra territory of Ribes nigrum.
Applsci 13 08679 g006
Table 1. Experimental conditions of BDs production.
Experimental Conditions
Extraction solventMixture of glycerol and ethanol (95%) 50:50 w/w
Bud–solvent ratio1:20, dried weight (DW)
Time21 days of cold maceration
Table 2. Chromatographic characterization of BDs obtained from the six different botanical species (Castanea sativa, Corylus avellana, Ribes nigrum, Fraxinus excelsior, Ficus carica and Quercus petraea). The mean results are expressed as mg/100 g of fresh weight (FW).
Cinnamic Acids
Caffeic AcidChlorogenic AcidCoumaric AcidFerulic Acid
SpeciesID CodeMean ValueSDMean ValueSDMean ValueSDMean ValueSD
Corylus avellanaCA2.530.13n.d./n.d./n.d./
Castanea sativaCS1.610.0214.230.29n.d./4.340.22
Ficus caricaFCn.d./n.d./62.210.84n.d./
Fraxinus excelsiorFE43.810.80489.940.79n.d./295.280.68
Quercus petraeaQP5.080.65n.d./0.000.00n.d./
Ribes nigrumRN22.480.04n.d./5.210.15n.d./
Flavonols
HyperosideIsoquercitrinQuercetinQuercitrinRutin
SpeciesID CodeMean ValueSDMean ValueSDMean ValueSDMean ValueSDMean ValueSD
Corylus avellanaCAn.d./n.d./171.2514.2883.464.9879.502.14
Castanea sativaCS3.030.10n.d./30.640.2329.010.821.540.12
Ficus caricaFC63.670.94n.d./49.681.24128.341.0846.201.11
Fraxinus excelsiorFE242.260.89n.d./176.880.6379.931.000.000.00
Quercus petraeaQP7.280.81n.d./27.910.38188.450.790.000.00
Ribes nigrumRNn.d./n.d./49.530.4930.860.8517.250.22
Benzoic AcidsCatechins
Ellagic AcidGallic AcidCatechinEpicatechin
SpeciesID codeMean ValueSDMean ValueSDMean ValueSDMean ValueSD
Corylus avellanaCA193.532.2246.292.5448.532.8949.192.83
Castanea sativaCS48.950.1394.710.241.280.3231.020.17
Ficus caricaFC67.290.89n.d./75.791.04191.561.13
Fraxinus excelsiorFE214.490.69n.d./57.740.79270.510.89
Quercus petraeaQP231.560.6552.030.6494.830.39199.920.46
Ribes nigrumRN69.660.080.310.0995.880.2659.830.37
n.d. not detectable.
Disclaimer/Publisher’s Note: The statements, opinions and data contained in all publications are solely those of the individual author(s) and contributor(s) and not of MDPI and/or the editor(s). MDPI and/or the editor(s) disclaim responsibility for any injury to people or property resulting from any ideas, methods, instructions or products referred to in the content.

