Article

Sizing Optimization of a Photovoltaic Hybrid Energy Storage System Based on Long Time-Series Simulation Considering Battery Life

School of Microelectronics and Communication Engineering, Chongqing University, Chongqing 400044, China
*
Authors to whom correspondence should be addressed.
Appl. Sci. 2023, 13(15), 8693; https://doi.org/10.3390/app13158693
Submission received: 14 July 2023 / Revised: 25 July 2023 / Accepted: 26 July 2023 / Published: 27 July 2023
(This article belongs to the Section Applied Industrial Technologies)

Abstract

:
An energy storage system works in sync with a photovoltaic system to effectively alleviate the intermittency in the photovoltaic output. Owing to its high power density and long life, supercapacitors make the battery–supercapacitor hybrid energy storage system (HESS) a good solution. This study considers the particularity of annual illumination due to climate conditions in Harbin, China. A global optimal PV-HESS sizing method is proposed by constructing a PV-HESS operating cost model and taking the annual system operating cost as the objective function. To consider the effect of battery life degradation due to different charge and discharge rates and charge and discharge times, a semi-empirical model based on the Arrhenius model was used to quantify the battery life degradation. Based on the effects of different seasons and different photovoltaic panel sizes, batteries, and supercapacitors on the optimization results, four scenarios are proposed. The feasibility of the system configuration corresponding to the four scenarios is discussed, and an optimal sizing configuration of the system is obtained. The simulation results show that the proposed method can effectively balance the degradation of the ESS due to irregular charging and discharging and determine the minimum operating cost and a reasonable sizing configuration of the system.

1. Introduction

To alleviate the growing shortage of fossil fuels and environmental pollution, clean energy in the form of photovoltaics (PV) and wind energy has received much attention. As renewable energy sources, photovoltaics and wind energy can be distributed widely and cause no pollution; these have been rapidly developed in recent years. PV power is an important type of renewable energy. Compared with wind power generation, PV power is not affected by geographical factors, and its working characteristics have certain regularity [1,2,3,4]. The combined operation of PV and an energy storage system (ESS) can effectively alleviate the intermittency and instability in the PV output. Among the various energy storage components, lithium-ion batteries are widely used in PV-ESSs owing to their high energy density and fast response [5,6,7]. However, during their operation, because of frequent charging and discharging, along with the intermittent and unstable PV output, battery life degradation is accelerated, thus increasing the operating cost (OCT) of the system [8,9]. As a new type of energy storage device, a supercapacitor (SC) has excellent power density, cycle life, and charge and discharge rates. Therefore, it can effectively alleviate the power fluctuation in lithium-ion batteries and prolong the battery life [10]. The OCT of PV-ESS can be effectively reduced by appropriately determining the size of the lithium-ion batteries and SC, making sizing configuration an important aspect of the design.
In recent years, extensive studies have been conducted on the application of hybrid energy storage systems (HESSs) in the field of renewable energy. Wong et al. highlighted the importance of optimizing the size of ESSs to overcome the challenges in using them in distribution networks. A review was conducted on the optimal capacity allocation and control of ESS, and the advantages of different types of ESSs were discussed [11]. Bayram et al. proposed a sizing method for a user-shared ESS. The optimal size of the ESS was analyzed and a cost–benefit analysis was performed by randomly modeling the needs of each user. The results showed that a shared ESS can realize resource conservation [12]. Al-Ghussain et al. discussed the types of ESSs that can be applied to PV and wind energy systems. The simulation results showed that the type and size of the ESS significantly affect the economics of the system [13]. The above research demonstrated the advantages of jointly operating a renewable energy power generation system and an ESS in terms of the energy efficiency, cost-effectiveness, and system stability through different methods. Moreover, the importance of optimizing the size of the ESS was emphasized.
Han et al. applied a hybrid ESS to PV power generation and calculated the discharge depth of a battery using the rainflow-counting method. A quantitative model of the battery life was established based on the equivalent cycle life curve. An optimal capacity sizing model was established by analyzing the cost structure of the ESS, taking the minimum annual OCT of the system as the objective function and considering the volatility and confidence as constraints. Particle swarm optimization was used to optimize the model, reduce the OCT of the optical storage system, and improve its economic feasibility [14]. Abbassi and Wang et al. proposed a method for planning the optimal size of a multi-source power system. The wind–solar power supply system of a HESS system was modeled. Considering the reliability of the system, an energy management strategy based on discrete Fourier transform was proposed, and the energy utilization rate and power cost were taken as the objective functions [15,16]. Erdinc et al. proposed a method for optimizing the sizes of a PV system, wind and electric vehicle charging stations, and ESSs. The time characteristics of loads, such as of electric vehicles, were considered, and the actual load data were simulated. The mathematical model was transformed into a stochastic programming problem and solved. Alhaider et al. optimized the sizes of the ESS and PV unit of the system to minimize the system cost. To reduce the computational complexity, the problem was transformed into a mixed-integer linear programming problem, and a two-stage Benders decomposition strategy was used to solve the optimization problem [17,18]. Korjani et al. identified and clustered the characteristics of consumer groups based on online energy management tools and determined the working status of PV-ESS according to the established rules [19]. Koko studied the residential load effect of the system under different pricing strategies, thus establishing the optimal power flow model, and confirmed the optimal battery size by analyzing the systems with different battery sizes [20]. Abbassi et al. accurately modeled a PV-HESS system. The power output of each energy storage unit was controlled using frequency domain management and a hysteresis controller. They showed that configuring the SC can avoid the fast charging and discharging cycles of the battery and alleviate the battery life degradation [21]. Chen et al. proposed a size optimization method for a microgrid ESS based on a cost–benefit analysis. The feedforward neural network algorithm was used to predict the wind speed and illumination. Differences in the optimal size of the ESS were found under grid and off-grid connections [22]. In the above studies, different methods were used to solve the sizing problem of the ESS in a renewable energy system. The overview of related research streams is shown in Table 1.
By comparing and summarizing relevant studies, it should be noted that some re-search methods used, such as heuristic algorithms, cannot guarantee the optimal energy output between system components. In contrast, theoretically, the optimal capacity obtained by using globally optimal optimization algorithms is smaller because it can fully utilize the limited size of system components. However, some studies mostly focused on implementing new algorithms or modifying existing ones. The effects of energy management optimization and the combination of different components on the system were rarely studied. Meanwhile, relevant research rarely considers that the irregular charging and discharging of the ESS during system operation often leads to an accelerated degradation of its lifespan. Therefore, the output curve of the ESS should be controlled to reduce system costs and user anxiety. In addition, during the operation, because of the intermittent output of the PV system, the charge and discharge times and the charge and discharge rates of the battery vary irregularly, and it is difficult to quantify the battery degradation during operation. In most studies, the battery sharing cost was determined by calculating the battery purchase cost, and the battery degradation cost was determined using the equivalent model to find the equivalent life of the ESS. The former cannot optimize the battery cost by reflecting it in the objective function, and the battery life degradation due to the latter has a large error with respect to the actual situation. Moreover, in most studies, the effects of climate, seasons, and other factors on the overall system sizing were rarely considered. For a PV system, the amount of electricity generated in summer and winter and the amount of electricity generated on cloudy and sunny days are different. Therefore, it is often unreasonable to calculate the size based on only a few days of illumination.
Hence, this paper proposes a PV-HESS system sizing method that considers the power difference and system economy. First, the power generated by PV panels of different sizes was obtained by determining the change in the light intensity in one year in Harbin, China. Second, considering the composition of the components in the system, four different scenarios were set, and their optimal capacity configurations were calculated separately. Among them, considering the effects of irregular charging and discharging on the life of the energy storage battery during the operation of PV-ESS, a semi-empirical model based on the Arrhenius model was developed to quantify the battery life degradation. A dynamic programming algorithm was used to solve the optimal charging and discharging problem of the ESS with different sizing configurations in each scenario and obtain the minimum OCT. Finally, the minimum operating costs (MOCTs) of different sizing configurations were compared, and the effects of the various components were analyzed to obtain an optimal capacity configuration for the system. In summary, the main contributions of this study are as follows:
  • − By modeling the components contained in the system and performing differential deformation on the Arrhenius model, the dynamic degradation of lithium-ion batteries was quantified.
  • − Based on the related research, three typical algorithms were designed, their performance was compared, and a system size optimization framework was proposed.
  • − The feasibility of applying various system components was analyzed based on the four proposed system configurations and system operating cost models.
The paper is organized as follows. 
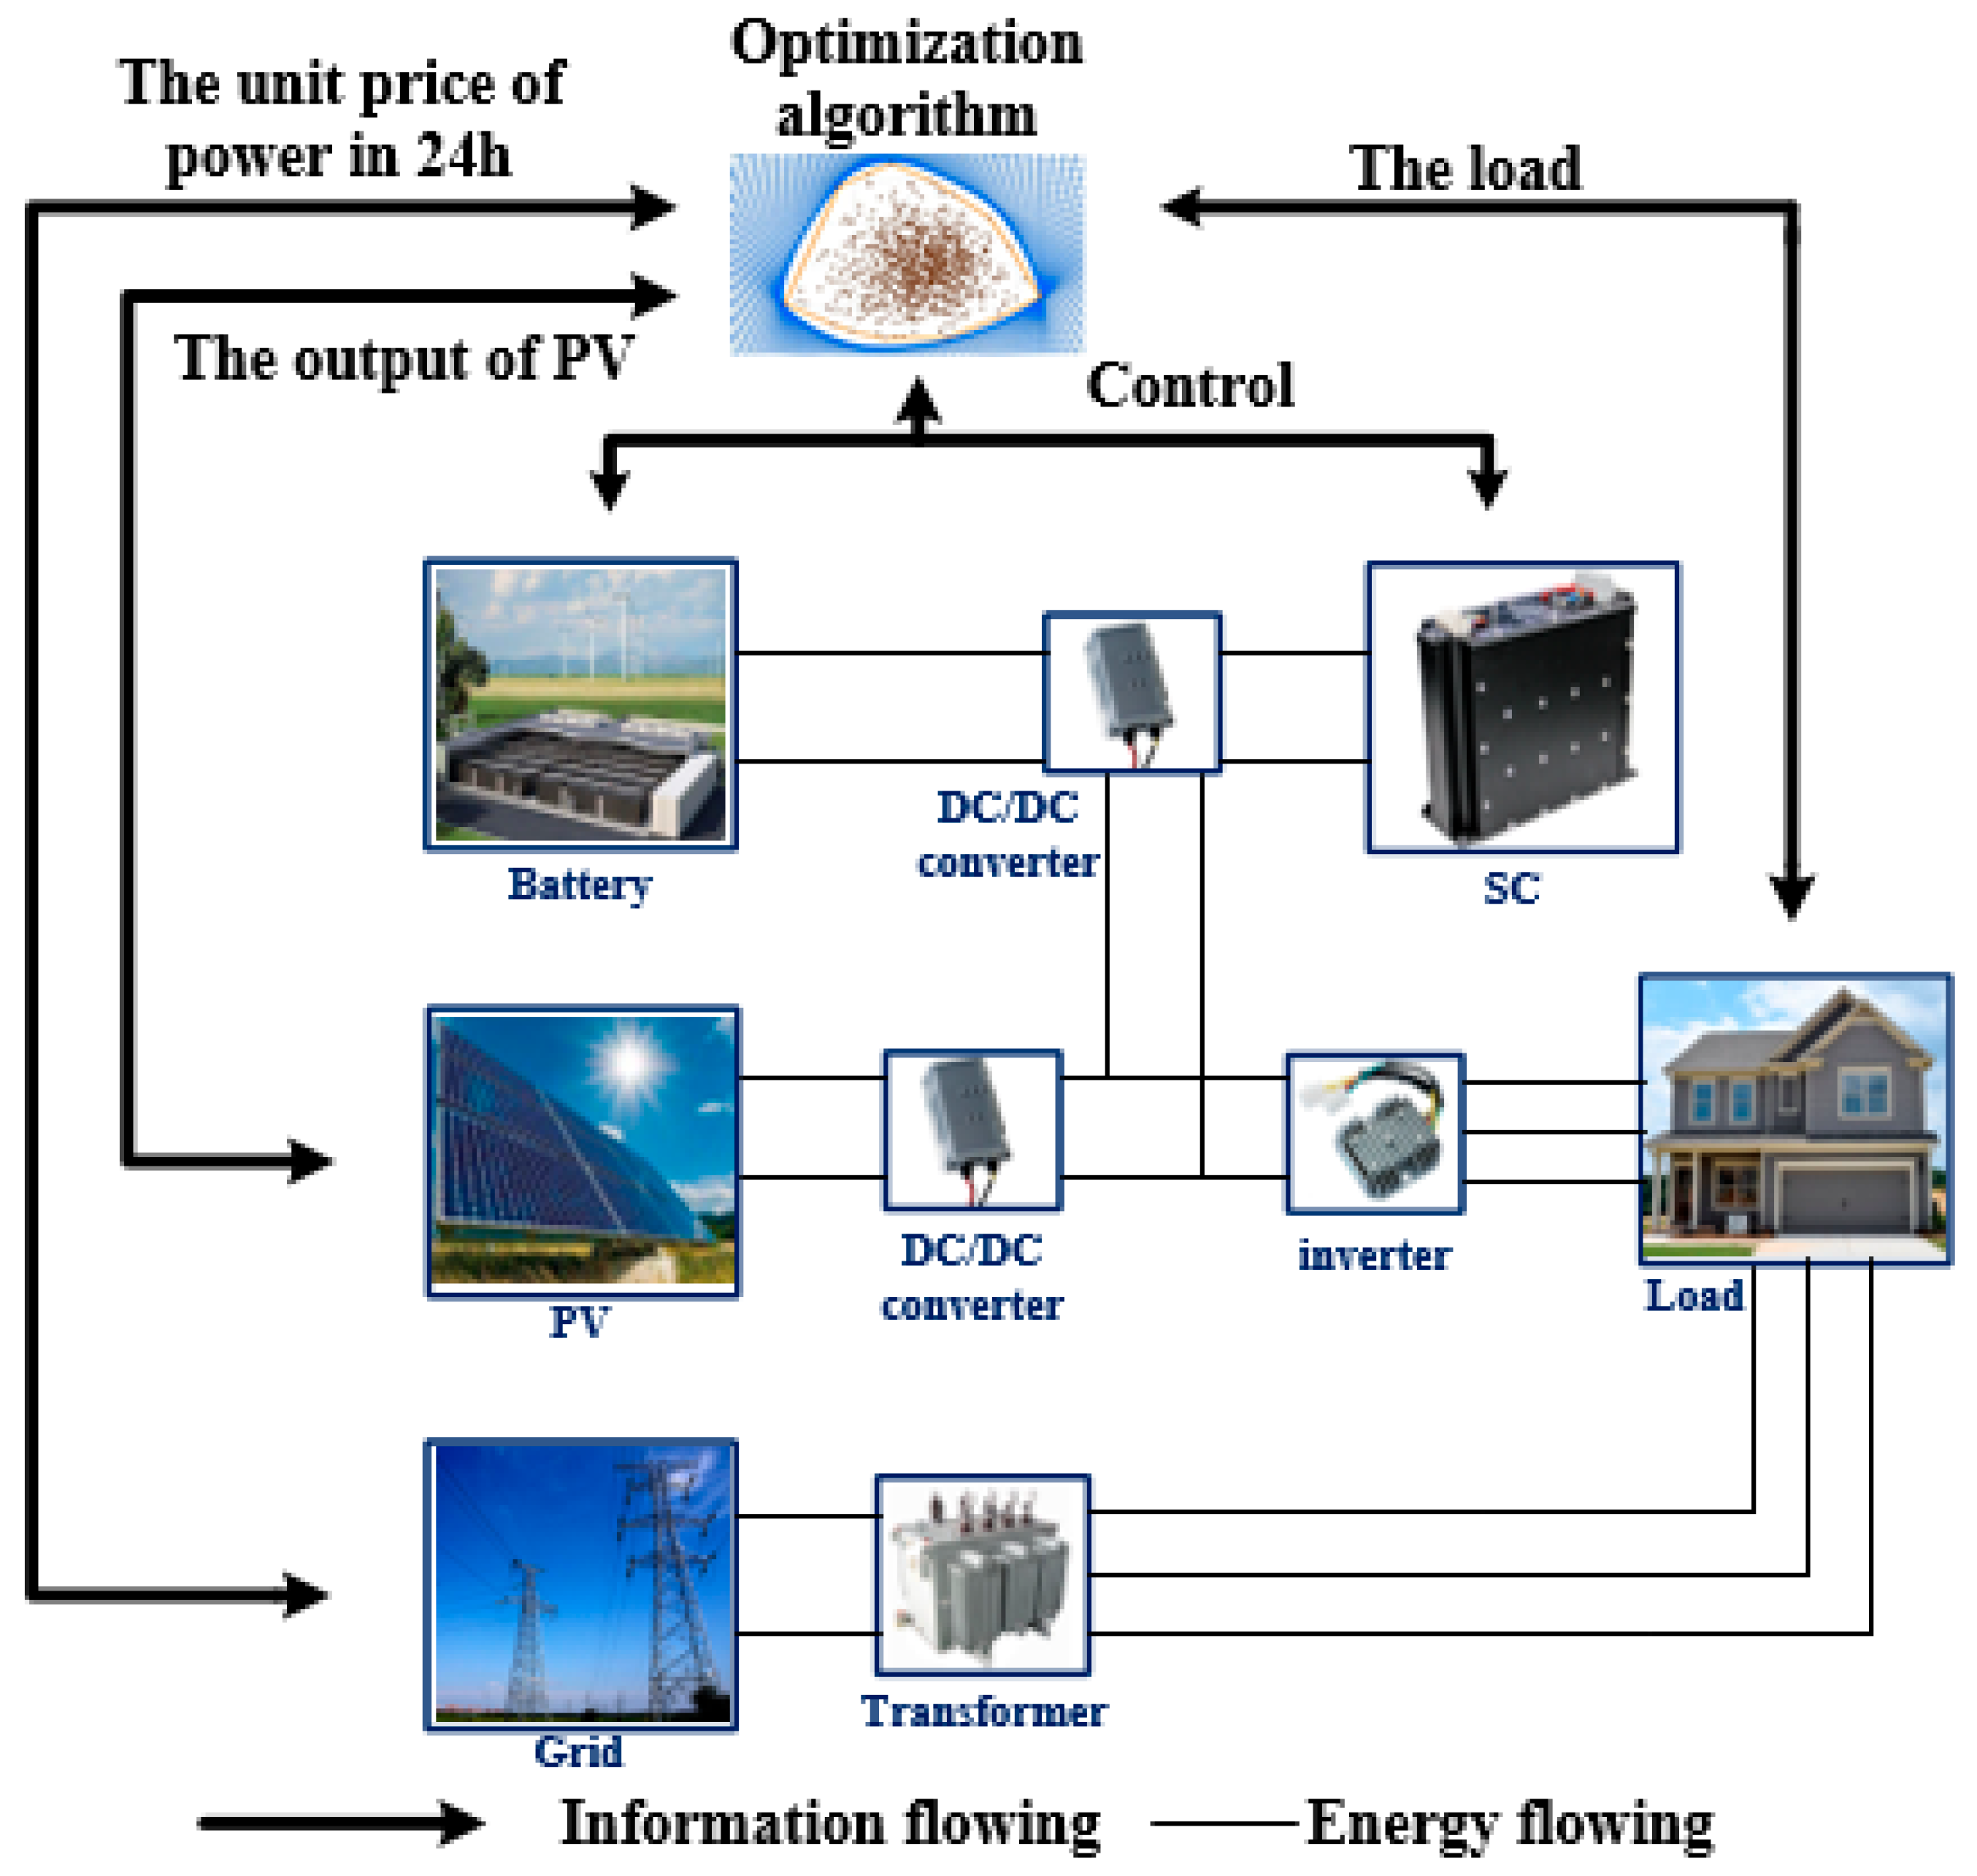
Section 2 introduces the system configuration and working principles and models the system components. And in Section 3, a capacity size optimization framework is developed for planning the PV-ESS system. Section 4 designs and selects three algorithms. Finally, Section 5 introduces the data used in this article and provides simulation results and discussion, and this paper is concluded with Section 6.

2. System Structure and Working Principle

Figure 1 shows the structure of the PV-HESS. The system consists of an ESS comprising two energy storage components, a lithium-ion battery and an SC, PV panels, a load, and current converters.

2.1. Modeling of PV Panels

A certain capacity of PV panels can reduce the cost of electricity and lower the OCT. PV panels convert light energy into electrical energy through photochemical or photoelectric effects. The model of a PV cell can be mainly divided into a basic UI characteristic equivalent model based on the avalanche effect model and a simplified engineering model. In this study, an equivalent circuit model of a PV cell based on a single diode is selected, as shown in Figure 2.
According to the equivalent circuit, the corresponding UI characteristics are as follows:
I P V = I p h U P V + I P V R s R s h I d e q U P V + I P V R s A k T PV 1
here, Id and Iph are, respectively, the reverse saturated leakage current and photo-generated current, which are determined by ambient temperature and light intensity; k is the Boltzmann constant; TPV is the temperature of the PV panels; A is a fitting constant; and q is the amount of electron power. To improve the accuracy of PV panel parameters, Abbassi et al. calibrated the parameters in the formula based on a genetic algorithm and the Newton–Raphson algorithm and proved its accuracy [23].

2.2. Modeling of Energy Storage System

The ESS can effectively alleviate the intermittency and instability of PV power generation. However, the life of lithium-ion batteries is limited by many factors. Different charge–discharge rates, different states of charge (SOC) during charging, different operating temperatures, and the internal resistance of the battery have a certain effect on the battery life. In the PV-ESS system, because of the characteristics of PV power generation, the charging and discharging behaviors of the ESS are quite different during the day and night, and during its operation, the instability in the charging and discharging currents will lead to excessive degradation of the battery. Compared with lithium-ion batteries, SCs have a near-infinite life and an extremely high power density, which can be utilized to smoothen the charge–discharge curve of the lithium-ion battery during system operation, prolong the battery life, and improve system economy.

2.2.1. Lithium-Ion Battery

Li et al. presented analyses and economic comparisons of the efficiency and modes of existing energy storage equipment connected to a power grid [24]. From their work, the battery energy storage system (BESS) was deemed suitable for various distributed systems owing to its flexible capacity, power characteristics, and its relatively compact size. Among the many energy storage batteries, LiFeFO4 batteries are widely used in ESSs owing to their long life and high energy density. In terms of battery model construction, relevant researchers have summarized various equivalent circuit models for lithium-ion batteries [25,26]. Due to the main focus of this article being on the performance of composite energy storage systems under cyclic operating conditions, the accuracy requirement for system dynamic process response is not very high. Therefore, in the modeling process, the battery model is simplified to a Rint model, which ensures the accuracy of the model over a long time scale while reducing the complexity of the model.
I b a t ( t ) = U b a t U b a t 2 4 R b a t P b a t ( t ) 2 R b a t
here, Ibat, Ubat, and Rbat are the current, voltage, and internal resistance of the battery during operation, respectively.

2.2.2. Supercapacitor

Compared with conventional capacitors and batteries, the advantages of SCs are mainly reflected in their fast response, high power density, and long cycle life [27]. Because of its high price, a large-capacity SC increases system acquisition costs and reduces system economics. The open circuit voltage USC of the SC has a linear relationship with its state of charge SOCSC.
S O C S C = U S C U SC _ m a x
Normally, when SOCSC is less than 50%, it will not continue to be used unless it is charged. This is because the power contained in the SC is as follows:
Q S C = 0.5 U S C _ m a x C S C ( 1 S O C S C )
here, QSC is the energy released when the SC discharges to SOCSC, and USC_max(min) is its maximum (minimum) voltage. When SOCSC is 50%, the SC would release 75% of its energy. When the SOCSC is low, the efficiency of the SC is low. The capacity unit of the SC can be converted to the same capacity unit (Wh) as the battery as follows:
C S C = 1 2 C U S C _ max 2 U S C _ min 2 / 3600

2.3. Converter

Converters are a vital part of a PV-ESS system. Inverters are a key factor affecting the economics of PV-ESS systems. From the perspective of the users of PV systems, the economy, high efficiency, reliability, and service life are the main requirements for inverters. As the output of PV has strong randomness and instability, it is necessary to add bidirectional DC/DC converters between the PV panels and the ESS to control the stability of the charging and discharging processes of the ESS and ensure the reliability of the system. Therefore, DC/DC converters are required to have higher power density and efficiency, and their control mode and structure should be relatively simple to improve the stability and service life of the system. Given the above, the parameters of each component are shown in Table 2.

3. Sizing Method of PV-HESS System

Figure 3 shows the flowchart of the sizing method of the PV-HESS system analyzed in this study.
The load and illumination in the same area is often periodic. Therefore, by collecting the annual illumination and load data of a certain area, the global optimal solution for the charging and discharging processes of the ESS in each stage can be solved, and the MOCT of the system with a fixed size can be obtained. A reasonable sizing configuration is obtained by comparing the MOCT of PV-HESS systems with different capacity configurations.

3.1. Model of Life-Cycle Cost

In this study, the objective function is to minimize the annual OCT of the system. The annual average cost of the PV panels, SC, converters, degradation cost of the ESS, and the energy cost generated during the operation of the system are added together, constituting the annual OCT model of the system.
C _ t o t a l = G P V + G C O N + G S C + t = 1 t max G l o s s ( t ) + G ELE ( t )
here, GPV, GCON, and GSC are the annual average costs of the PV modules, converters, and SC modules, respectively; t is an optimized step size equal to one hour; GELE(t) is the cost of purchasing electricity; and Gloss(t) is the cost of battery life degradation during system operation.

3.1.1. Purchase Cost

Based on the foregoing and the age of each component, the cost of acquisition of each component is converted to the average annual cost of investment as follows:
G P V = C P V p r i c e P V r 1 + r Y P V 1 + r Y P V / Y P V
G S C = C S C p r i c e S C r 1 + r Y S C 1 + r Y S C / Y S C
G C O N = C C O N p r i c e C O N r 1 + r Y C O N 1 + r Y C O N / Y C O N
here, CPV, CSC, and CCON are the PV panels size, SC size, and converters size, respectively, and r is the discount rate.

3.1.2. Cost of Battery Degradation

The degradation cost of the batteries is the OCT due to irregular charging and discharging while operating the system. After conducting several experimental studies on the degradation process of LiFePO4 cells, Wang et al. proposed a semi-empirical model for estimating the battery capacity degradation, as follows [28]:
B a t l o s s = A 0 e E a + B C _ R a t e / R T b a t A h z
here, Qloss is the battery capacity degradation, C_Rate is the absolute value of the battery charge and discharge current rate, R is the ideal gas constant, Ea is the activation energy, A0 is the pre-exponential coefficient, Ah is the ampere-hour (Ah) throughput, B is the third undetermined coefficient, z is the second undetermined coefficient, and Tbat is the temperature of the battery in Kelvin. Note that this model is based on the Arrhenius degradation model, wherein the effects of different charge and discharge rates, temperatures, and charge and discharge powers are considered.
Equation (10) can be rearranged as follows:
A h = ( B a t l o s s e E a + B C _ R a t e / R T b a t / A 0 ) 1 z
Next, finding the derivative of Ah in Equation (10) yields the following:
B a t · l o s s = z A 0 e E a + B C _ R a t e / R T b a t ( A h ) z 1
Combining Equations (11) and (12) over one time step from t to t + 1 yields the following:
B a t loss , t + 1 B a t loss , t = Δ A h z A 0 1 z e E a + B C _ R a t e / z R T b a t B a t l o s s , t z 1 z
here, Qloss,t+1 and Qloss,t denote the degradations of the battery from time t to time t + 1, respectively, and △Ah is the accumulated A–h throughput of the battery during the same time period, determined as follows:
Δ A h = t t + 1 I b a t dt
Song et al. calibrated the parameters in Equation (10) with the values listed in Table 3 [29].
Given the above, Gloss(t) can be represented as follows:
G l o s s t = p r i c e bat C b a t 2.637 10 3 I b a t ( t ) e 15162 1516 C _ r a t e ( t ) 2041.52 B a t loss ( t 1 ) 0.2136

3.2. Problem Formulation

The objective of the research is to minimize the system OCT, including the system acquisition cost, battery decay cost, and purchase cost, and improve the system energy utilization under the conditions of meeting various constraints.
Based on the MOCT of the system, the optimal sizing configuration of the system is obtained. The system MOCT, optimal sizing configuration (OCS), and system energy utilization (EFF) are given as follows:
C min C P V i , C B a t j , C S C k = min C _ t o t a l C P V i , C B a t j , C S C k C P V i = C P V 1 , C P V 2 , , C P V max C B a t j = C B a t 1 , C B a t 2 , , C B a t max C S C k = C S C 1 , C S C 2 , , C S C max O C S = min C min C P V i , C B a t j , C S C k E F F = t = 1 t max P l o a d t P ele t / t = 1 t max P PV t
here, CPV(i) is the optimal photovoltaic panel capacity, kW; CBat(j) is the optimal lithium-ion battery capacity, kWh; CSC(k) is the optimal SC capacity, kWh. By inputting the different sizes of each component, the total cost of the system is optimized to minimize it, and the corresponding OCS is obtained, and the EFF is calculated. For the PV-HESS system, the system must meet the following constraints:
P l o a d t = P e l e t + P P V t + P B a t t η B a t + P S C t η S C P B a t min t P B a t t P B a t min t S O C B a t min t S O C B a t t S O C B a t min t P SC min t P S C t P S C max t S O C SC min t S O C S C t S O C S C max t
In the optimization process, in view of the influence of the depth of discharge on the battery life, the battery operating range is set to 20% to 90% of its state of charge (SOC). The initial stage and the termination stage SOC of the battery are set to 55%, and the initial stage and the termination stage SOC of the super capacitor are set to 75%.

4. Design and Comparison of Optimization Algorithms

There are often many complex working states during the operation of a system, and how to plan the power allocation of various components during the system operation is a worthwhile and complex problem to study. Based on the system operating cost model established in Section 3, several commonly used optimization algorithms are compared from the perspective of optimal system economy. Therefore, this section mainly describes three representative algorithms, the rule based algorithm, the dynamic programming algorithm, and the genetic algorithm (GA).

4.1. Rule-Based Algorithm

The rule-based algorithm classifies the running trajectory of the system by using the rules of “if... else”. By combining these rules, rules are used from top to bottom to match the current state of the system. If the current rule is not applicable to the current state of the system, other rules are used to continue matching until a rule that matches the current state of the system is found. Among them, system rules can be expressed as:
r u l e i : ( p r e i ) y i
here, rulei represents the i-th rule, pre is the corresponding premise, and yi is the output result. Although the rule-based algorithm can obtain optimal solutions through detailed partitioning of system states and working modes of ESS, due to the limited comprehensiveness of rulemaking, it is not possible to consider all the factors that affect the system. Moreover, due to the fact that rules are manually formulated, there may be situations where rules are exhausted or conflicting, resulting in the inability to accurately achieve the global optimization of the system. The specific working mode of the rule-based algorithm for PV-ESS system designed in this article isas shown in Figure 4.

4.2. Dynamic Programming

The dynamic programming (DP) algorithm is a conventional and mature optimization algorithm. Compared with other algorithms, DP can obtain an accurate global optimal solution. Several commonly used optimization algorithms have been compared [30]. The results showed that compared with the DP algorithm, these algorithms tend to focus on reducing the size of the ESS to save on the overall system acquisition cost; however, the economics of the system in operation is ignored. Figure 5 shows the backward optimization process of DP for the problem analyzed in this study.
Here, the decision made by the ESS in a certain optimization interval corresponds to the connection between the two states before and after the interval. By determining the optimal path from the state to the end state, and so on, because it satisfies the Markov property in the solution process, repetitive calculations can be avoided, and the global optimal solution can be quickly obtained [31]. In this study, DP was applied to calculate the output of the PV-HESS system, in the following steps:
  • Identify the division unit: As mentioned above, the optimization step was set to an hour.
  • Identify the selection status: In this study, we selected the remaining battery power SOCbat as the state variable.
  • Determine the decision variables: The charge and discharge power Pbat of the ESS is selected as the decision variable.
  • Determine the state transition equation: The state transition involves determining the state of this stage based on the state of the previous stage and the decision made. The corresponding state transition equation is as follows:
S O C b a t t = S O C b a t t 1 P b a t t η b a t t / C b a t
5.
Determine the evaluation function: Combining the objective function with the algorithm, we set the evaluation function as follows:
f ( t ) = m i n t = 1 max ϕ t S O C B a t ( t ) , P B a t ( t ) + φ t S O C B a t ( t + 1 )

4.3. Genetic Algorithm

The GA has the characteristics of simple design and strong robustness. It finds and retain the optimal sub-individuals for each generation by calculating the fitness function. The implementation process of the genetic algorithm is shown in Figure 6.
If the initial population is completely random, the rate of convergence of the algorithm will be very slow. Considering that there are two main ways for the PV-ESS system to save electricity: PV power generation and ESS discharge, the initial population will make the ESS absorb redundant power generation as much as possible, and adjust the discharge amount of ESS according to the difference between the required power and PV power generation to reduce battery degradation. The details of the algorithm are shown in Figure 7.
The relevant parameters of the algorithm are shown in Table 4.

5. Simulation Results and Analysis

5.1. Data Set

The residential buildings in the Harbin area were selected as the research objects. The average winter temperature in Harbin, Heilongjiang Province, China, is approximately −19 °C, and the average summer temperature is 23 °C. The precipitation is mainly concentrated in the period from June to September. The special climate makes illumination vary significantly in the four seasons. The annual climate data of Harbin were derived from Meteonorm software. Figure 8 shows the monthly average temperature and illumination in Harbin. The typical daily load in reference [10] is taken as the system load, as shown in Figure 9.
The illumination and temperature change trend are the same in a year, indicating that the temperature directly affects the PV panels’ power generation. The daily load of the system is relatively average, and the load peak is reached at approximately 18:00 every day. The PV panels generate less power during this period, indicating that the ESS is required to dispatch the PV power generation. As far as PV sizing is concerned, under the condition of constant daily load, excessive PV panels can be used to meet the power demand of the month under weak illumination intensity in winter; however, the excess PV generation in summer is unavoidable. To avoid wastage of resources, the ESS should absorb the excess power. Conversely, a few PV panels are sufficient to meet the power demand in summer; however, in winter, the PV generation is insufficient. Therefore, the difference between the real-time output PV power and the demand power of load is chosen as the demand power Pdemand. Figure 10 shows the demand power of the system and the output of the unit PV panels under different PV sizing.
As shown in Figure 10, the overall trend in the unit PV generation in a year is similar to that shown in Figure 9. However, because of cloudy and rainy days, there is still a period of insufficient PV generation in the month with sufficient sunshine, which reflects the particularity of the climate in Harbin. In addition, because of the intermittent nature of PV power generation, it cannot meet the peak load shown in Figure 9, indicating that the EFF of the PV system is limited when the system only has PV panels; moreover, as PV sizing increases, the EFF decreases, and the system’s OCT is limited.

5.2. Algorithm Comparison and Analysis

5.2.1. Parameter Calibration

In the rule-based energy management algorithm designed in Section 4.1, it is necessary to calibrate the threshold for the discharge power of lithium-ion batteries in HESS. Firstly, four fixed system capacity configurations in Table 5 are selected.
Due to the maximum daily load power of system not exceeding 5 kW, the range of threshold is set to 0–5 kW. By changing the threshold of the rule-based algorithm, several sets of PV-ESS system components sizing in Table 5 are simulated to obtain the system operating costs. The system operating costs for each threshold under the different components sizing obtained are shown in Figure 11.
It can be seen that when the threshold is too small, the trend of operating costs varies for systems with different components sizing. However, when the threshold increases to a certain level, except for configuration four, the system cost no longer changes with the increase in the threshold. There are two main reasons for this.
Firstly, during the operation of the system, the cost of power consumption is higher than the cost of battery degradation, and excessive use of batteries can bring more benefits to the system. Secondly, there is a mismatch in the capacity of system components. Excessive SC use will reduce the operating range of the battery, and the coupling between system component capacities limits the operating cost of the system. Based on the simulation results and taking into account the reduction in battery degradation, it is necessary to predetermine the threshold before running the proposed algorithm.

5.2.2. Comparison of Algorithms

For the parameter calibration work in Section 5.2.1, this section compares and analyzes the three proposed algorithms. Taking configuration 4 of Table 5 as an example, three algorithms were used to optimize the energy flow between system components, obtaining the output curves of each component and the real-time battery decay curve of lithium-ion batteries. The comparison results are shown in Figure 12, Figure 13 and Figure 14.
From Figure 12 and Figure 13, it can be seen that rule-based algorithm prioritizes the charging of the ESS, which leads to repeated charging and discharging of a portion of the electricity, accelerating battery degradation and increasing system operating costs. Based on the GA, there is a slight improvement in this situation. However, based on the charging and discharging curve of lithium-ion battery in DP, it is proved that the ESS is in the constant current discharge stage in most stages and maintains constant current charging when the available charging capacity of the lithium-ion battery is insufficient. And from the power differentiation analysis, it can be seen that the charging and discharging rate of batteries based on DP is much lower than the other two algorithms, and the discharge is more frequent. This charging and discharging mode can fully reserve the available charging and discharging space of the battery, increase the redundant photovoltaic power generation it consumes, and have a small impact on the battery degradation. Meanwhile, when the system requires a continuous and large amount of charging or discharging, the ESS can make accurate responses. Based on the above conclusions, the various indicators of the three algorithms are compared, as shown in Table 6.

5.3. Calculation of Optimal Component Size of System

According to Table 7, the system configurations corresponding to the four scenarios are as follows:
  • Configuration 1: The system does not contain any components;
  • Configuration 2: The system only contains PV systems;
  • Configuration 3: The system contains PV system and lithium-ion battery ESSs;
  • Configuration 4: The system contains all components.
The system cost under the configurations corresponding to scenarios 1 and 2 is simulated. Figure 15 shows the simulation results.
Compared with configuration 1, a suitable sizing of the PV panels can effectively reduce system the MOCT. When CPV = 11 kW, the OCT under configuration 2 is the lowest, i.e., CNY 9188.8. Compared with CNY 11,988.1 when not purchasing the PV panels, the OCT is reduced by 23.35%, but compared with configuration 1, the EFF is reduced by 40.77%. Moreover, when the PV sizing is in the range of 5–20 kW, the annual OCT changes are not obvious, and the EFF shows a significant downward trend. This is because the particularity of the selected climate makes it impossible for fixed-capacity photovoltaic panels to perfectly match summer and winter at the same time. If both the OCT and EFF indicators are considered at the same time, a critical point of 5–7 kW, where there is no significant change in the OCT or a significant decrease in EFF, is selected as the reasonable capacity configuration. It is possible to further reduce the system OCT and improve the EFF by configuring a part of the ESS. If the ESS contains only lithium-ion batteries, the battery degradation cost can be high. Therefore, considering the simultaneous use of SCs and lithium-ion batteries, configurations 3 and 4 are simulated. Figure 16 shows the simulation results.
As the PV sizing increases, the excess power generation increases, and the battery life is reduced. SCs can alleviate this situation; however, the expensive price of the SCs leads to limited sizing configurations, and the degradation of the battery is also limited. Increasing the battery sizing can also slow down battery degradation. The simulation results show that the SC can reduce the battery degradation by approximately three times, except for the case when the PV sizing is less than 5 kW and the excess PV generation is low. Based on Pdemand shown in Figure 10, the greater the battery sizing, the lower the charge and discharge rates of the battery, resulting in a small number of SCs failing to smooth and increase battery charge and discharge power. According to Equation (15), the battery degradation cost is mainly determined by the battery charge and discharge amount and the battery charge and discharge rates. When the lithium-ion battery sizing is much greater than the SC sizing, SC has a limited effect. Therefore, it is necessary to simulate the system economy under different capacity configurations. Figure 17 shows the simulation results.
As shown in Figure 17, when the PV sizing is 5 kW or less, configuration 2 is superior to other configurations, and the use of the ESS increases the OCT. It is unreasonable to use the ESS in the system at this time. This is because when the PV size is insufficient, the PV power generation can only meet the current Pdemand, or the remaining power is limited, resulting in the ESS having a limited effect. When the PV sizing is in the range of 6–8 kW, the excess power of the PV system gradually increases, and ESS can function normally. However, the excess power generation is limited, and the optimal size of the battery in the ESS is small. In addition, as the SC is much costlier than the battery, even if the SC can alleviate the battery life degradation to a certain extent, it is unreasonable to use the SC in the system at this time, and configuration 3 is better than configuration 4. At this stage, as PV sizing increases, the optimal size of the battery ESS increases. When the PV sizing is above 8 kW, the surplus power of PV generation is sufficient, and the use of the ESS becomes a feasible solution for saving on the OCT of the system. Under each optimal sizing, the size of the SC also increases, indicating that under certain circumstances, a certain size of the SC in the ESS can also help reduce the OCT of the system from the perspective of mitigating battery degradation. Although the optimal size of the HESS also increases with the increase in the PV sizing, due to the system acquisition cost and battery degradation cost, the OCT decreases first and then increases. This shows that the optimal sizing is objective. Table 8 summarizes the comparative analysis of the economics of the four configurations.
As listed in Table 8, the effect of each component on the system economy varies as follows (high to low): PV panel, lithium-ion battery, and SC. To improve the EFF of the system, the SC can only play a very small role; the main role is still to extend the battery life. When the size of the battery is large, its ability to mitigate battery life degradation is also limited. Referring to Figure 16 and Figure 17, when the CPV is 11 kW, the CSC is 1.3 kWh, and the Cbat is 48 kWh, the system can realize the MOCT. Here, the CPV values in configuration 3 and configuration 4 are consistent with configuration 2, indicating that PV sizing has a greater impact on system economics than the ESS. Figure 18 shows the simulation analysis of the HESS power under this capacity.
The trend in the annual output power curve of the HESS is consistent with the trend of Pdemand shown in Figure 10, indicating that the lithium-ion battery can handle most of the insufficient and excess power. At this time, the system sizing can take into account both summer and winter, as well as the impact of a special climate. In addition, the discharge power of the battery tends to be stable, and the SC works more frequently. This reduces the charge and discharge rates and charge and discharge amounts of the battery to a certain extent, thereby saving on the OCT. However, the working period of the SC only accounts for 22.39% of the total period. Although the SC has a very long life, it can be charged from the grid side to maintain the state of charge at any time; however, overall, the role of the SC is limited.

6. Conclusions

This paper proposes a PV-HESS system sizing method considering power difference and system economy. By setting four scenarios, the minimum operating costs of the system configurations of each scenario under different sizing configurations are calculated and compared, and a reasonable sizing configuration is obtained. The following are the main findings of this study:
(1)
Considering the saving of battery degradation, under the optimal system component size, the proposed method can effectively monitor the operating status of the battery system. The constant current charging and discharging period accounts for 32.24% of the total simulation period, effectively reducing the system operating cost.
(2)
It can be concluded that when the user budget is low or the electricity consumption is low, the lowest cost of the system can be obtained when the photovoltaic capacity is 5–7 kW under configuration 2. This further improves the economy of the PV-HESS system.
(3)
By comparing the four system configurations, it can be proven for the whole system that the impact of each component on the system economy is as follows (high to low): photovoltaic panels, lithium-ion batteries, and supercapacitors. The combined operation of the lithium-ion battery and SC can properly improve the system economy and prolong the service life of the lithium-ion battery. However, under the constraints of system economy, the degree is low, and the working period of the SC only accounts for 22.39% of the total period. In addition, the ability to improve the energy efficiency is limited.
The proposed method can effectively take into account the power difference due to the output change in PV generation, the degradation of the battery due to irregular charging and discharging, and the effect of bad weather on PV generation. Through the proposed method, a reasonable capacity allocation scheme for PV-HESS is obtained. In future research, predictive and control algorithms can be involved to design an energy management strategy based on rolling optimization that matches the optimal component size of the system.

Author Contributions

Conceptualization, Y.L. and C.T.; methodology, Y.L.; software, Y.L.; validation, Y.L., C.T. and Y.Z.; formal analysis, Y.L.; investigation, Y.L.; resources, Y.L.; data curation, Y.L.; writing—original draft preparation, Y.L.; writing—review and editing, Y.L.; visualization, Y.L.; supervision, Y.L.; project administration, Y.L. and Y.L.; funding acquisition, C.T. All authors have read and agreed to the published version of the manuscript.

Funding

This research received no external funding.

Data Availability Statement

Data sharing not applicable. No new data were created or analyzed in this study.

Conflicts of Interest

The authors declare no conflict of interest.

References

  1. Jia, Y.; Alva, G.; Fang, G. Development and applications of photovoltaic–thermal systems: A review. Renew. Sustain. Energy Rev. 2019, 102, 249–265. [Google Scholar] [CrossRef]
  2. Heinisch, V.; Göransson, L.; Erlandsson, R.; Hodel, H.; Johnsson, F.; Odenberger, M. Smart electric vehicle charging strategies for sectoral coupling in a city energy system. Appl. Energy 2021, 288, 116640. [Google Scholar] [CrossRef]
  3. Raghuwanshi, S.S.; Arya, R. Reliability evaluation of stand-alone hybrid photovoltaic energy system for rural healthcare centre. Sustain. Energy Technol. Assess. 2020, 37, 100624. [Google Scholar] [CrossRef]
  4. Mariano-Hernández, D.; Hernández-Callejo, L.; Zorita-Lamadrid, A.; Duque-Pérez, O.; García, F.S. A review of strategies for building energy management system: Model predictive control, demand side management, optimization, and fault detect & diagnosis. J. Build. Eng. 2021, 33, 101692. [Google Scholar]
  5. Hu, X.; Zou, C.; Zhang, C. Technological developments in batteries: A survey of principal roles, types, and management needs. IEEE Power Energy Mag. 2017, 15, 20–31. [Google Scholar] [CrossRef]
  6. Mathew, M.; Hossain, S.; Saha, S.; Mondal, S.; Haque, E. Sizing approaches for solar photovoltaic-based microgrids: A comprehensive review. IET Energy Syst. Integr. 2021, 4, 1–27. [Google Scholar] [CrossRef]
  7. Kumar, P.; Malik, N.; Garg, A. Comparative analysis of solar-battery storage sizing in net metering and zero export systems. Energy Sustain. Dev. 2022, 69, 41–50. [Google Scholar] [CrossRef]
  8. Wu, X.; Hu, X.; Teng, Y.; Qian, S.; Cheng, R. Optimal integration of a hybrid solar-battery power source into smart home nanogrid with plug-in electric vehicle. J. Power Sources 2017, 363, 277–283. [Google Scholar] [CrossRef] [Green Version]
  9. Wu, X.; Hu, X.; Moura, S.; Yin, X.; Pickert, V. Stochastic control of smart home energy management with plug-in electric vehicle battery energy storage and photovoltaic array. J. Power Sources 2016, 333, 203–212. [Google Scholar] [CrossRef] [Green Version]
  10. Salim, H.K.; Stewart, R.A.; Sahin, O.; Dudley, M. Drivers, barriers and enablers to end-of-life management of solar photovoltaic and battery ESS: A systematic literature review. J. Clean. Prod. 2019, 211, 537–554. [Google Scholar] [CrossRef]
  11. Wong, L.A. Review on the optimal place system in the distribution network. J. Energy Storage 2019, 21, 489–504. [Google Scholar] [CrossRef]
  12. Bayram, I.S.; Abdallah, M.; Tajer, A.; Qaraqe, K.A. A Stochastic Sizing Approach for Sharing-Based Energy Storage Applications. IEEE Trans. Smart Grid 2017, 8, 1075–1084. [Google Scholar] [CrossRef] [Green Version]
  13. Al-Ghussain, L.; Taylan, O.; Baker, D.K. An investigation of PV and wind energy system capacities for alternate short and long-termenergy storage sizing methodologies. Int. J. Energy Res. 2019, 43, 204–218. [Google Scholar] [CrossRef] [Green Version]
  14. Han, X. Capacity Optimal Modeling of Hybrid ESS Considering Battery Life. In Proceedings of the CSEE, San Francisco, CA, USA, 19–21 May 2013; Volume 33, pp. 91–97. [Google Scholar]
  15. Abdelkader, A.; Rabeh, A.; Ali, D.M.; Mohamed, J. Multi-objective genetic algorithm based sizing optimization of a stand-alone wind/PV power supply system with enhanced battery/supercapacitor hybrid energy storage. Energy 2018, 163, 351–363. [Google Scholar] [CrossRef]
  16. Wang, C.; Yu, B.; Xiao, J.; Guo, L. Sizing of ESS for Output Smoothing of Renewable Energy Systems. In Proceedings of the CSEE, Nanjing, China, 17–19 April 2012; Volume 32, pp. 1–8. [Google Scholar]
  17. Alhaider, M.; Fan, L. Planning Energy Storage and Photovoltaic Panels for Demand Response With Heating Ventilation and Air Conditioning Systems. IEEE Trans. Ind. Inform. 2018, 14, 5029–5037. [Google Scholar] [CrossRef]
  18. Erdinc, O.; Paterakis, N.G.; Pappi, I.N.; Bakirtzis, A.G.; Catalão, J.P.S. A New Perspective for Sizing of Distributed Generation and Energy Storage for Smart Households under Demand Response. Appl. Energy 2015, 143, 26–37. [Google Scholar] [CrossRef]
  19. Korjani, S.; Casu, F.; Damiano, A.; Pilloni, V.; Serpi, A. An online energy management tool for sizing integrated PV-BESS systems for residential prosumers. Appl. Energy 2022, 313, 118765. [Google Scholar] [CrossRef]
  20. Koko, S.P. Optimal battery sizing for a grid-tied solar photovoltaic system supplying a residential load: A case study under South African solar irradiance. Energy Rep. 2022, 8, 410–418. [Google Scholar] [CrossRef]
  21. Abbassi, A.; Dami, M.A.; Jemli, M. A statistical approach for hybrid energy storage system sizing based on capacity distributions in an autonomous PV/Wind power generation system. Renew. Energy 2017, 103, 81–93. [Google Scholar] [CrossRef]
  22. Chen, S.X.; Gooi, H.B.; Wang, M.Q. Sizing of Energy Storage for Microgrids. IEEE Trans. Smart Grid 2012, 3, 142–151. [Google Scholar] [CrossRef]
  23. Abbassi, A.; Gammoudi, R.; Dami, M.A.; Hasnaoui, O.; Jemli, M. An improved single-diode model parameters extraction at different operating conditions with a view to modeling a photovoltaic generator: A comparative study. Sol. Energy 2017, 155, 478–489. [Google Scholar] [CrossRef]
  24. Li, W. Framework of probabilistic power system planning. CSEE J. Power Energy Syst. 2015, 1, 1–8. [Google Scholar] [CrossRef]
  25. Meng, J.; Azib, T.; Yue, M. Early-Stage end-of-Life prediction of lithium-Ion battery using empirical mode decomposition and particle filter. Proc. Inst. Mech. Eng. Part A J. Power Energy 2023, 237, 1090–1099. [Google Scholar] [CrossRef]
  26. He, H.; Xiong, R.; Fan, J. Evaluation of Lithium-Ion Battery Equivalent Circuit Models for State of Charge Estimation by an Experimental Approach. Energies 2011, 4, 582–598. [Google Scholar] [CrossRef]
  27. Sharma, K.; Arora, A.; Tripathi, S.K. Review of supercapacitors: Materials and devices. J. Energy Storage 2019, 21, 801–825. [Google Scholar]
  28. Wang, J. Cycle-life model for graphite-LiFePO4 cells. J. Power Sources 2011, 196, 3942–3948. [Google Scholar] [CrossRef]
  29. Song, Z.; Li, J.; Han, X.; Xu, L.; Lu, L.; Ouyang, M.; Hofmann, H. Multi-objective optimization of a semi-active battery/supercapacitor energy storage system for electric vehicles. Appl. Energy 2014, 135, 212–224. [Google Scholar] [CrossRef]
  30. Li, C.; Peng, H.; Sun, J. Energy management strategies comparison for electric vehicles with hybrid energy storage system. Wind. Energy 2016, 19, 437–451. [Google Scholar] [CrossRef]
  31. Zhang, S.; Xiong, R. Adaptive energy management of a plug-in hybrid electric vehicle based on driving pattern recognition and dynamic programming. Appl. Energy 2015, 155, 68–78. [Google Scholar] [CrossRef]
Figure 1. PV-HESS system architecture.
Applsci 13 08693 g001
Figure 2. Photovoltaic equivalent circuit diagram.
Applsci 13 08693 g002
Figure 3. Flowchart of sizing method for photovoltaic-HESS.
Applsci 13 08693 g003
Figure 4. Flow chart of rules-based algorithm.
Applsci 13 08693 g004
Figure 5. Schematic diagram of DP.
Applsci 13 08693 g005
Figure 6. The flow chart of GA.
Applsci 13 08693 g006
Figure 7. The details of GA.
Applsci 13 08693 g007
Figure 8. Monthly mean temperature and illumination in Harbin.
Applsci 13 08693 g008
Figure 9. Daily typical load of residential buildings.
Applsci 13 08693 g009
Figure 10. Pdemand with different photovoltaic capacities: (a) (CPV = 5 kW) Pdemand; (b) (CPV = 10 kW) Pdemand; (c) (CPV = 15 kW) Pdemand; (d) the output of unit PV panels (Harbin area).
Applsci 13 08693 g010aApplsci 13 08693 g010b
Figure 11. The influence of threshold on system capacity configuration.
Applsci 13 08693 g011
Figure 12. Power curve comparison of three algorithms.
Applsci 13 08693 g012
Figure 13. The power discretization analysis of three algorithms.
Applsci 13 08693 g013
Figure 14. Comparison of battery degradation curves of three algorithms.
Applsci 13 08693 g014
Figure 15. Annual MOCT of configurations 1 and 2.
Applsci 13 08693 g015
Figure 16. (CPV = 5~13 kW) The degradation of battery life: (a) (CPV = 5 kW) Batloss; (b) (CPV = 6 kW) Batloss; (c) (CPV = 7 kW) Batloss; (d) (CPV = 8 kW) Batloss; (e) (CPV = 9 kW) Batloss; (f) (CPV = 10 kW) Batloss; (g) (CPV = 11 kW) Batloss; (h) (CPV = 12 kW) Batloss; (i) (CPV = 13 kW) Batloss.
Applsci 13 08693 g016
Figure 17. (CPV = 5~13 kW) Annual OCT of different HESS sizing: (a) (CPV = 5 kW) AOCT; (b) (CPV = 6 kW) AOCT; (c) (CPV = 7 kW) AOCT; (d) (CPV = 8 kW) AOCT; (e) (CPV = 9 kW) AOCT; (f) (CPV = 10 kW) AOCT; (g) (CPV = 11 kW) AOCT; (h) (CPV = 12 kW) AOCT; (i) (CPV = 13 kW) AOCT.
Applsci 13 08693 g017
Figure 18. (CPV = 11, CSC = 1.3, Cbat = 48) The power of HESS.
Applsci 13 08693 g018
Table 1. The overview of related research streams.
ReferenceConsidered Characteristics in Previous FormulationsSolution Technique
HESSBESS DegradationOCTOther IndicatorsHeuristics PolicyExact Policy
[8]
[9]
[12]
[13]
[14]
[15]
[16]
[17]
[18]
[19]
[20]
[21]
[22]
This research
Table 2. Parameters of each component.
Parameter (Unit)Value
YPV (year)15
YSC (year)10
YDCDC, DCAC (year)10
pricePV (CNY/W)1.8
pricebat (CNY/Wh)1
PriceSC (CNY/Wh)5.5
priceDCDC, DCAC (CNY/W)0.045
ηPV (%)16
ηbat_ch, ηbat_dis (%)95, 100
ηSC_ch, ηSC_dis (%)95, 100
Table 3. Parameters corresponding to Equation (10).
Parameter (Unit)Value
A00.0032
B−1516
Z0.824
Ea (J/mol)15,162
R (J/(mol·K))8.314
T (K)298
Table 4. Parameters of GA.
ParameterValue
population500
crossover rate0.8
mutation rate0.1
generation gap0.9
evolutional generation500
Table 5. Four system capacity configurations.
System ComponentsPV Size (kW)Battery Size (kWh)SC Size (kW)
Configuration 1 551
Configuration 2552
Configuration 31052
Configuration 412200
Table 6. Performance comparison of three algorithms.
AlgorithmRule-BasedGA DP
Degradation cost895.4866.1857.9
Electricity cost6091.56063.26058.7
Operation cost6986.96929.36916.6
Table 7. System configurations for the four scenarios.
System ComponentsPVBattery SC
Scenario 1 ×××
Scenario 2××
Scenario 3×
Scenario 4
Table 8. System configurations for the four scenarios.
System Configuration1234
Annual cost(CNY) 11,988.19188.88051.67857.3
Save cost(%)023.3532.8134.46
EFF(%)059.2385.5386.05
Disclaimer/Publisher’s Note: The statements, opinions and data contained in all publications are solely those of the individual author(s) and contributor(s) and not of MDPI and/or the editor(s). MDPI and/or the editor(s) disclaim responsibility for any injury to people or property resulting from any ideas, methods, instructions or products referred to in the content.

