
Meta-Analysis of Influence of Diversity of Parental Forms on Heterosis and Specific Combining Ability of Their Hybrids


Abstract
:Featured Application
Abstract
1. Introduction
2. Materials and Methods
- (1)
- heterosis effects:where denotes the heterosis effect of the ij-th hybrid, denotes the mean value of the ij-th hybrid, denotes the mean value of the i-th and j-th parental forms.
- (2)
- SCA effects:where denotes specific combining ability effect of the ij-th hybrid, denotes the mean value for the genotype obtained by crossing the i-th and j-th parental forms, denotes the effect of general combining ability of the i-th (j-th) parental form, denotes the grand mean.
- (3)
- Phenotypic differentiation of parental forms was assessed by Mahalanobis distance:where denotes Mahalanobis distance between the i-th and j-th hybrids, and denote the t-dimensional vectors of means of individual traits for the i-th and j-th parental forms, respectively, and S denotes the covariance matrix.
- (4)
- Genetic differentiation or similarity of parental forms:where denotes the number of alleles in the i-th parental form, denotes the number of alleles in the j-th parental form, denotes the number of alleles present in both the i-th and j-th parental forms.
3. Results
4. Discussion
5. Conclusions
Author Contributions
Funding
Institutional Review Board Statement
Informed Consent Statement
Data Availability Statement
Conflicts of Interest
References
- Cerna, F.J.; Rafalski, A.; Tingey, S.; Dyer, D. Relationship between seed yield heterosis and molecular marker heterozygosity in soybean. Theor. Appl. Genet. 1997, 95, 460–467. [Google Scholar] [CrossRef]
- Cheres, M.T.; Miller, J.F.; Crane, J.M.; Knapp, S.J. Genetic distance as a predictor of heterosis and hybrid performance within and between heterosis group in sunflower. Theor. Appl. Genet. 2000, 100, 889–894. [Google Scholar] [CrossRef]
- Li, Z.K.; Luo, L.J.; Mei, H.W.; Wang, D.L.; Shu, Q.Y.; Tabien, R.; Zhong, D.B.; Ying, C.S.; Stansel, J.W.; Khush, G.S.; et al. Overdominant epistatic loci are the primery genetic basis of inbreeding depression and heterosis I. Biomass and grain yield. Genetics 2001, 158, 1737–1753. [Google Scholar] [CrossRef] [PubMed]
- Shull, G.H. Hybridization methods in corn breeding. Am. Breed. Assoc. Repts. 1911, 6, 63–72. [Google Scholar] [CrossRef]
- Sinha, S.K.; Khanna, R. Physiological, biochemical, and genetic basis of heterosis. Adv. Agron. 1975, 27, 1230174. [Google Scholar] [CrossRef]
- Pooni, H.S.; Treharne, A.J. The role of epistasis and background genotype in the expression of heterosis. Heredity 1994, 72, 628–635. [Google Scholar] [CrossRef] [Green Version]
- Ba Bong, B.; Swaminathan, M.S. Magnitude of hybrid vigor retained in doubled haploid lines of some heterotic rice hybrids. Theor. Appl. Genet. 1995, 90, 253–257. [Google Scholar] [CrossRef] [PubMed]
- Comstock, R.E.; Robinson, H.F.; Harvey, P.H. A breeding procedure designed to make maximum use of both general and specific combining ability. Agron. J. 1949, 41, 360–367. [Google Scholar] [CrossRef]
- Bocianowski, J.; Nowosad, K.; Bujak, H.; Łuczkiewicz, T.; Piesik, D. Evaluation of the breeding value of the spring oilseed rape (Brassica napus L.) inbred lines based on a multi-trait analysis. Indian J. Genet. Plant Breed. 2016, 76, 284–289. [Google Scholar] [CrossRef]
- Betran, F.J.; Ribaut, J.M.; Beck, D.; de Leon, D.G. Genetic diversity, specific combining ability and heterosis in tropical maize under stress and nonstress environments. Crop Sci. 2003, 43, 797–806. [Google Scholar] [CrossRef]
- Diers, B.W.; Mc Vetty, P.B.E.; Osborn, T.C. Relationship between heterosis and genetic distance based on Restriction Fragment Lenght Polymorphism markers in oilseed rape (Brassica napus L.). Crop Sci. 1996, 36, 79–83. [Google Scholar] [CrossRef]
- Dreisigacker, S.; Melchinger, A.E.; Zhang, P.; Ammar, K.; Flachenecker, C.; Hoisington, D.; Warburton, M.L. Hybrid performance and heterosis in spring bread wheat, and their relations to SSR-based genetic distances and coefficients of parentage. Euphytica 2005, 144, 51–59. [Google Scholar] [CrossRef]
- Kwon, S.J.; Ha, W.G.; Hwang, H.G.; Yang, S.J.; Choi, H.C.; Moon, H.P. Relationship between heterosis and genetic divergence in ‘Tongil’-type rice. Plant Breed. 2002, 121, 487–492. [Google Scholar] [CrossRef]
- Martin, J.M.; Talbert, L.E.; Lanning, S.P.; Blake, N.K. Hybrid performance in wheat as related to parental diversity. Crop Sci. 1995, 35, 104–108. [Google Scholar] [CrossRef]
- Golinski, P.; Waskiewicz, A.; Wisniewska, H.; Kiecana, I.; Mielniczuk, E.; Gromadzka, K.; Kostecki, M.; Bocianowski, J.; Rymaniak, E. Reaction of winter wheat (Triticum aestivum L.) cultivars to infection with Fusarium spp.: Mycotoxin contamination in grain and chaff. Food Addit. Contam. Part A 2010, 27, 1015–1024. [Google Scholar] [CrossRef] [PubMed] [Green Version]
- Scandura, M.; Fabbri, G.; Caniglia, R.; Iacolina, L.; Mattucci, F.; Mengoni, C.; Pante, G.; Apollonio, M.; Mucci, N. Resilience to Historical Human Manipulations in the Genomic Variation of Italian Wild Boar Populations. Front. Ecol. Evol. 2022, 10, 833081. [Google Scholar] [CrossRef]
- Villanueva, B.; Fernández, A.; Peiró-Pastor, R.; Peñaloza, C.; Houston, R.D.; Sonesson, A.K.; Tsigenopoulos, C.S.; Bargelloni, L.; Gamsiz, K.; Karahan, B.; et al. Population structure and genetic variability in wild and farmed Mediterranean populations of gilthead seabream and European seabass inferred from a 60K combined species SNP array. Aquacult. Rep. 2022, 24, 101145. [Google Scholar] [CrossRef]
- Kozak, M.; Bocianowski, J.; Liersch, A.; Tartanus, M.; Bartkowiak-Broda, I.; Piotto, F.A.; Azevedo, R.A. Genetic divergence is not the same as phenotypic divergence. Mol. Breed. 2011, 28, 277–280. [Google Scholar] [CrossRef] [Green Version]
- Zafar, M.M.; Razzaq, A.; Farooq, M.A.; Rehman, A.; Firdous, H.; Shakeel, A.; Mo, H.; Ren, M.; Ashraf, M. Genetic Variation Studies of Ionic and within Boll Yield Components in Cotton (Gossypium hirsutum L.) under Salt Stress. J. Nat. Fibers 2022, 19, 3063–3082. [Google Scholar] [CrossRef]
- Hu, X.; Wang, H.; Diao, X.; Liu, Z.; Wu, Y.; Liang, Q.; Wang, H.; Huang, C. Transcriptome profiling and comparison of maize ear heterosis during the spikelet and floret differentiation stages. BMC Genom. 2016, 17, 959. [Google Scholar] [CrossRef] [Green Version]
- Reif, J.C.; Melchinger, A.E.; Xia, X.C.; Warburton, M.L.; Hoisington, D.A.; Vasal, S.K.; Beck, D.; Bohn, M.; Frisch, M. Use of SSRs for establishing heterotic groups in subtropical maize. Theor. Appl. Genet. 2003, 107, 947–957. [Google Scholar] [CrossRef] [PubMed]
- Vasal, S.K.; Srinivasan, G.; Pandey, S.; González, F.C.; Crossa, J.; Beck, D.L. Heterosis and Combining Ability of CIMMYT’s Quality Protein Maize Germplasm: I. Lowland Tropical. Crop Sci. 1993, 33, 46–51. [Google Scholar] [CrossRef]
- Boeven, P.H.G.; Würschum, T.; Weissmann, S.; Miedanre, T.; Maurer, H.P. Prediction of hybrid performance for Fusarium head blight resistance in triticale (×Triticosecale Wittmack). Euphytica 2016, 207, 475–490. [Google Scholar] [CrossRef]
- Singh, S.; Dey, S.S.; Bhatia, R.; Kumar, R.; Sharma, K.; Behera, T.K. Heterosis and combining ability in cytoplasmic male sterile and doubled haploid based Brassica oleracea progenies and prediction of heterosis using microsatellites. PLoS ONE 2019, 14, e0210772. [Google Scholar] [CrossRef] [Green Version]
- Reid, L.M.; Xiang, K.; Zhu, X.; Baum, B.R.; Molnar, S.J. Genetic diversity analysis of 119 Canadian maize inbred lines based on pedigree and simple sequence repeat markers. Can. J. Plant Sci. 2011, 91, 651–661. [Google Scholar] [CrossRef]
- de Faria, S.V.; Zuffo, L.T.; Rezende, W.M.; Caixeta, D.G.; Pereira, H.D.; Azevedo, C.F.; DeLima, R.O. Phenotypic and molecular characterization of a set of tropical maize inbred lines from a public breeding program in Brazil. BMC Genom. 2022, 23, 54. [Google Scholar] [CrossRef] [PubMed]
- Heckenberger, M.; Bohn, M.; Ziegle, J.S.; Joe, L.K.; Hauser, J.D.; Hutton, M.; Melchinger, A.E. Variation of DNA fingerprints among accessions within maize inbred lines and implications for identification of essentially derived varieties. I. Genetic and technical sources of variation in SSR data. Mol. Breed. 2002, 10, 181–191. [Google Scholar] [CrossRef]
- Heckenberger, M.; Rouppe van der Voort, J.; Melchinger, A.E.; Peleman, J.; Bohn, M. Variation of DNA fingerprints among accessions within maize inbred lines and implications for identification of essentially derived varieties. II. Genetic and technical sources of variation in AFLP data and comparison to SSR data. Mol. Breed. 2003, 12, 97–106. [Google Scholar] [CrossRef]
- Haydar, F.M.A. Genetic Diversity and Combining Ability in Maize (Zea mays L.). Ph.D. Thesis, Department of Botany, University of Rajshahi, Rajshahi, Bangladesh, 2013. [Google Scholar]
- Dhliwayo, T.; Pixley, K.; Menkir, A.; Warburton, M. Combining ability, genetic distances, and heterosis among elite CIMMYT and IITA tropical maize inbred lines. Crop Sci. 2009, 49, 1201–1210. [Google Scholar] [CrossRef]
- Tomkowiak, A.; Bocianowski, J.; Radzikowska, D.; Kowalczewski, P.Ł. Selection of Parental Material to Maximize Heterosis Using SNP and SilicoDarT Markers in Maize. Plants 2019, 8, 349. [Google Scholar] [CrossRef] [PubMed] [Green Version]
- Tomkowiak, A.; Bocianowski, J.; Kwiatek, M.; Kowalczewski, P.Ł. Dependence of the heterosis effect on genetic distance, determined using various molecular markers. Open Life Sci. 2020, 15, 1–11. [Google Scholar] [CrossRef] [PubMed] [Green Version]
- Bocianowski, J.; Tomkowiak, A.; Bocianowska, M.; Sobiech, A. The Use of DArTseq Technology to Identify Markers Related to the Heterosis Effects in Selected Traits in Maize. Curr. Issues Mol. Biol. 2023, 45, 2644–2660. [Google Scholar] [CrossRef]
- Makumbi, D.; Betrán, J.F.; Bänziger, M.; Ribaut, J.-M. Combining ability, heterosis and genetic diversity in tropical maize (Zea mays L.) under stress and non-stress conditions. Euphytica 2011, 180, 143–162. [Google Scholar] [CrossRef]
- Muraya, M.M.; Ndirangu, C.M.; Omolo, E.O. Heterosis and combining ability in diallel crosses involving maize (Zea mays) S1 lines. Aust. J. Experim. Agric. 2006, 46, 387–394. [Google Scholar] [CrossRef]
- Ali, F.; Shah, I.A.; ur Rahman, H.; Noor, M.; Khan, M.Y.; Ullah, I.; Yan, J. Heterosis for yield and agronomic attributes in diverse maize germplasm. Aust. J. Crop Sci. 2012, 6, 455–462. [Google Scholar]
- Pswarayi, A.; Vivek, B.S. Combining ability amongst CIMMYT’s early maturing maize (Zea mays L.) germplasm under stress and non-stress conditions and identification of testers. Euphytica 2008, 162, 353–362. [Google Scholar] [CrossRef]
- Saleh, G.; Abdullah, D.; Anuar, A. Performance, heterosis and heritability in selected tropical maize single, double and three-way cross hybrids. J. Agric. Sci. 2002, 138, 21–28. [Google Scholar] [CrossRef]
- Yang, W.; Yu, X.; Yang, W.; Liu, B. Parental epigenetic difference in DNA methylation-level may play contrasting roles for different agronomic traits related to yield heterosis in maize. Afr. J. Biotechnol. 2011, 10, 9253–9263. [Google Scholar] [CrossRef] [Green Version]
- Jiang, L.; Ge, M.; Zhao, H.; Zhang, T. Analysis of Heterosis and Quantitative Trait Loci for Kernel Shape Related Traits Using Triple Testcross Population in Maize. PLoS ONE 2015, 10, e0124779. [Google Scholar] [CrossRef] [PubMed] [Green Version]
- Evgenidis, G.; Mellidis, V.; Karamaligkas, C.; Koutsika-Sotiriou, M. Performance evaluation and genetic analysis of maize populations and diallel crosses under irrigated and drought-stressed conditions. Acta Agron. Hung. 2009, 57, 255–265. [Google Scholar] [CrossRef]
- Rajendran, A.; Muthiah, A.; Joel, J.; Shanmugasundaram, P.; Raju, D. Heterotic grouping and patterning of quality protein maize inbreds based on genetic and molecular marker studies. Turk. J. Biol. 2014, 38, 10–20. [Google Scholar] [CrossRef]
- Beyene, Y.; Botha, A.M.; Myburg, A.A. Genetic diversity in traditional Ethiopian highland maize accessions assessed by AFLP markers and morphological traits. Biodivers. Conserv. 2006, 15, 2655–2671. [Google Scholar] [CrossRef]
- Beyene, Y.; Botha, A.M.; Myburg, A.A. Genetic Diversity Among Traditional Ethiopian Highland Maize Accessions Assessed by Simple Sequence Repeat (SSR) Markers. Genet. Resour. Crop Evol. 2006, 53, 1579–1588. [Google Scholar] [CrossRef]
- Heckenberger, M.; Bohn, M.; Klein, D.; Melchinger, A.E. Identification of Essentially Derived Varieties Obtained from Biparental Crosses of Homozygous Lines: II. Morphological Distances and Heterosis in Comparison with Simple Sequence Repeat and Amplified Fragment Length Polymorphism Data in Maize. Crop Sci. 2005, 45, 1132–1140. [Google Scholar] [CrossRef] [Green Version]
- Liersch, A.; Popławska, W.; Ogrodowczyk, M.; Krótka, K.; Bartkowiak-Broda, I.; Bocianowski, J. Assessment of genetic distance of parental lines of F1 hybrids of winter oilseed rape and its relationship with phenotypic distance and heterosis effect. Rośliny Oleiste 2010, 31, 229–241. [Google Scholar]
- Bocianowski, J.; Kozak, M.; Liersch, A.; Bartkowiak-Broda, I. A heuristic method of searching for interesting markers in terms of quantitative traits. Euphytica 2011, 181, 89–100. [Google Scholar] [CrossRef] [Green Version]
- Wolko, J.; Dobrzycka, A.; Bocianowski, J.; Bartkowiak-Broda, I. Estimation of heterosis for yield-related traits for single cross and three-way cross hybrids of oilseed rape (Brassica napus L.). Euphytica 2019, 215, 156. [Google Scholar] [CrossRef] [Green Version]
- Wolko, J.; Łopatyńska, A.; Wolko, Ł.; Bocianowski, J.; Mikołajczyk, K.; Liersch, A. Identification of SSR Markers Associated with Yield-Related Traits and Heterosis Effect in Winter Oilseed Rape (Brassica napus L.). Agronomy 2022, 12, 1544. [Google Scholar] [CrossRef]
- Riaz, A.; Li, G.; Quresh, Z.; Swati, M.S.; Quiros, C.F. Genetic diversity of oilseed Brassica napus inbred lines based on sequence-related amplified polymorphism and its relation to hybrid performance. Plant Breed. 2001, 120, 411–415. [Google Scholar] [CrossRef]
- Hasan, M.; Seyis, F.; Badani, A.G.; Pons-Kühnemann, J.; Friedt, W.; Lühs, W.; Snowdon, R.J. Analysis of Genetic Diversity in the Brassica napus L. Gene Pool Using SSR Markers. Genet. Resour. Crop Evol. 2006, 53, 793–802. [Google Scholar] [CrossRef]
- Yu, C.Y.; Hu, S.W.; Zhao, H.X.; Gua, A.G.; Sun, G.L. Genetic distances revealed by morphological characters, isozymes, proteins and RAPD markers and their relationships with hybrid performance in oilseed rape (Brassica napus L.). Theor. Appl. Genet. 2005, 110, 511–518. [Google Scholar] [CrossRef]
- Sarawat, P. Heterosis in Peas (Pisum sativum L.). Ph.D. Thesis, University of Adelaide, Adelaide, Australia, 1992. [Google Scholar]
- Sarawat, P.; Stoddard, F.L.; Marshall, D.R. Genetic distance and its association with heterosis in peas. Euphytica 1993, 73, 255–264. [Google Scholar] [CrossRef]
- Kuczyńska, A.; Surma, M.; Kaczmarek, Z.; Adamski, T. Relationship between phenotypic and genetic diversity of parental genotypes and the frequency of transgression effects in barley (Hordeum vulgare L.). Plant Breed. 2007, 126, 361–368. [Google Scholar] [CrossRef]
- Schut, J.; Qi, X.; Stam, P. Association between relationship measures based on AFLP markers, pedigree data and morphological traits in barley. Theor. Appl. Genet. 1997, 95, 1161–1168. [Google Scholar] [CrossRef]
- Zhang, L.Y.; Marchand, S.; Tinker, N.A.; Belzile, F. Population structure and linkage disequilibrium in barley assessed by DArT markers. Theor. Appl. Genet. 2009, 119, 43–52. [Google Scholar] [CrossRef] [PubMed]
- Czyczyło-Mysza, I.M.; Marcińska, I.; Skrzypek, E.; Bocianowski, J.; Dziurka, K.; Rančić, D.; Radošević, R.; Pekić-Quarrie, S.; Dodig, D.; Quarrie, S.A. Genetic analysis of water loss of excised leaves associated with drought tolerance in wheat. PeerJ 2018, 6, e5063. [Google Scholar] [CrossRef]
- AL–Hamadny, G.A.T.; Abdulla, S.K.; Sulyman, S.A. Relationship between genetic and phenotypic diversity of parental genotypes and specific combining ability and heterosis in tetraploid wheat. J. Kirkuk Univ. Agric. Sci. 2014, 5, 8–22. [Google Scholar]
- Yildirim, M.; Bahar, B.; Genç, İ.; Hatipoğlu, R.; Altintaş, S. Reciprocal effects in anther cultures of wheat hybrids. Biol. Plant 2008, 52, 779–782. [Google Scholar] [CrossRef]
- Fufa, H.; Baenziger, P.S.; Beecher, B.; Dweikat, I.; Graybosch, R.A.; Eskridge, K.M. Comparison of phenotypic and molecular marker-based classifications of hard red winter wheat cultivars. Euphytica 2005, 145, 133–146. [Google Scholar] [CrossRef]
- Guo, X.; Gao, A.; Liu, W.; Yang, X.; Li, X.; Li, L. Evaluation of genetic diversity, population structure, and linkage disequilibrium among elite Chinese wheat (Triticum aestivum L.) cultivars. Aust. J. Crop Sci. 2011, 5, 1167–1172. [Google Scholar]
- Griffing, B. Concept of general and specific combining ability in relation to diallel crossing systems. Aust. J. Biol. Sci. 1956, 9, 463–493. [Google Scholar] [CrossRef] [Green Version]
- Mahalanobis, P.C. On the generalized distance in statistics. Proc. Natl. Inst. Sci. India 1936, 2, 49–55. [Google Scholar]
- Nei, M.; Li, W. Mathematical model for studying genetic variation in terms of restriction endonucleases. Proc. Natl. Acad. Sci. USA 1979, 76, 5269–5273. [Google Scholar] [CrossRef] [PubMed]
- VSN International: Hemel Hempstead. VSN International Genstat for Windows, 22nd ed.; VSN International: Hemel Hempstead, UK, 2022. [Google Scholar]
- Geiger, H.H.; Schnell, F.W. Cytoplasmic male sterility in rye (Secale cereale L.). Crop Sci. 1970, 10, 590–593. [Google Scholar] [CrossRef]
- Geiger, H.H.; Morgenstern, K. Angewandt-genetische Studien zur Cytoplasmatischen Pollensterilität bei Winterroggen. Theor. Appl. Genet. 1975, 46, 269–276. [Google Scholar] [CrossRef]
- Geiger, H.H.; Miedaner, T. Genetic basis and phenotypic stability of male-fertility restoration in rye. Vortr. Pflanzenzüchtg. 1996, 35, 27–38. [Google Scholar]
- Miedaner, T.; Wilde, P.; Wortmann, H. Combining ability of non-adapted sources for male-fertility restoration in Pampa CMS of hybrid rye. Plant Breed. 2005, 124, 39–43. [Google Scholar] [CrossRef]
- Andorf, C.; Beavis, W.D.; Hufford, M.; Smith, S.; Suza, W.P.; Wang, K.; Woodhouse, M.; Yu, J.; Lübberstedt, T. Technological advances in maize breeding: Past, present and future. Theor. Appl. Genet. 2019, 132, 817–849. [Google Scholar] [CrossRef] [Green Version]
- Gowda, M.; Zhao, Y.; Maurer, H.P.; Weissmann, E.A.; Würschum, T.; Reif, J.C. Best linear unbiased prediction of triticale hybrid performance. Euphytica 2013, 191, 223–230. [Google Scholar] [CrossRef]
- Zafar, M.M.; Zhang, Y.; Farooq, M.A.; Ali, A.; Firdous, H.; Haseeb, M.; Fiaz, S.; Shakeel, A.; Razzaq, A.; Ren, M. Biochemical and Associated Agronomic Traits in Gossypium hirsutum L. under High Temperature Stress. Agronomy 2022, 12, 1310. [Google Scholar] [CrossRef]
- Civan, P.; Rincent, R.; Danguy-Des-Deserts, A.; Elsen, J.M.; Bouchet, S. Population Genomics Along with Quantitative Genetics Provides a More Efficient Valorization of Crop Plant Genetic Diversity in Breeding and Pre-breeding Programs. In Population Genomics; Springer: Cham, Switzerland, 2021; pp. 1–64. [Google Scholar] [CrossRef]
- Masojć, P. The application of molecular markers in the process of selection. Cell. Mol. Biol. Lett. 2002, 7, 499–509. [Google Scholar]
- Liu, J.; Liu, D.; Tao, W.; Li, W.; Wang, S.; Chen, P.; Cheng, S.; Gao, D. Molecular marker-facilitated pyramiding of different genes for powdery mildew resistance in wheat. Plant Breed. 2000, 119, 21–24. [Google Scholar] [CrossRef]
- Singh, S.; Franks, C.D.; Huang, L.; Brown-Guedira, G.L.; Marshall, D.S.; Gill, B.S. Lr41, Lr39, and a leaf rust resistance gene from Aegilops cylindrica may be allelic and are located on wheat chromosome2DS. Theor. Appl. Genet. 2004, 108, 586–591. [Google Scholar] [CrossRef]
- Sheng, J.X.; Lu, G.Y.; Fu, T.D.; Yang, G.S. Relationship between genetic diversity and hybrid performance in Oilseed rape (Brassica napus). Acta Agron. Sin. 2002, 28, 622–627. [Google Scholar]
- Boppenmaier, J.; Malchinger, A.E.; Brunklaus-Jung, E.; Geiger, H.H.; Herrmann, R.G. Genetic Diversity for RFLPs in European maize inbreds I. Relation to performance of flint × dent crosses for forage traits. Crop Sci. 1992, 32, 895–902. [Google Scholar] [CrossRef]
- Melchinger, A.E.; Boppenmaier, J.; Dhillon, B.S.; Pollmer, W.G.; Herrmann, R.G. Genetic diversity for RFLPs in European maize inbreds: II Relation to performance of hybrids within versus between heterotic groups for forage traits. Theor. Appl. Genet. 1992, 84, 672–681. [Google Scholar] [CrossRef]
- Moser, H.; Lee, M. RFLP variation and genealogical distance, multivariate distance, heterosis and genetic variance in oats. Theor. Appl. Genet. 1994, 87, 947–956. [Google Scholar] [CrossRef]
- Zhang, Q.F.; Zhou, Z.Q.; Yang, G.P.; Xu, C.G.; Liu, K.D.; Saghai-Maroof, M.A. Molecular marker heterozygosity and hybrid performance in indica and japonica rice. Theor. Appl. Genet. 1996, 93, 1218–1224. [Google Scholar] [CrossRef] [PubMed]
- Krystkowiak, K.; Adamski, T.; Surma, M.; Kaczmarek, Z. Relationship between phenotypic and genetic diversity of parental genotypes and the specific combining ability and heterosis effects in wheat (Triticum aestivum L.). Euphytica 2009, 165, 419–434. [Google Scholar] [CrossRef]
- Lavale, S.A.; Mathew, D.; Pradeepkumar, T.; John, K.J.; Joseph, J. Mapping the QTL and tagging yield traits in bitter gourd (Momordica charantia L.) using microsatellite markers. Biocatal. Agric. Biotechnol. 2023, 47, 102553. [Google Scholar] [CrossRef]
- Xu, Y.; Yang, Y.; Wu, S.; Liu, D.; Ren, Y. QTL Mapping for Root Traits and Their Effects on Nutrient Uptake and Yield Performance in Common Wheat (Triticum aestivum L.). Agriculture 2023, 13, 210. [Google Scholar] [CrossRef]
- Bocianowski, J. A comparison of two methods to estimate additive-by-additive interaction of QTL effects by a simulation study. J. Theor. Biol. 2012, 308, 20–24. [Google Scholar] [CrossRef]
- Bocianowski, J. Analytical and numerical comparisons of two methods of estimation of additive × additive interaction of QTL effects. Sci. Agric. 2012, 69, 240–246. [Google Scholar] [CrossRef] [Green Version]
- Bocianowski, J. The use of weighted multiple linear regression to estimate QTL-by-QTL epistatic effects. Genet. Mol. Biol. 2012, 35, 802–809. [Google Scholar] [CrossRef] [PubMed] [Green Version]
- Bocianowski, J. Estimation of epistasis in doubled haploid barley populations considering interactions between all possible marker pairs. Euphytica 2014, 196, 105–115. [Google Scholar] [CrossRef] [Green Version]
- Bocianowski, J.; Nowosad, K. Mixed linear model approaches in mapping QTLs with epistatic effects by a simulation study. Euphytica 2015, 202, 459–467. [Google Scholar] [CrossRef]
- Cyplik, A.; Bocianowski, J. Analytical and numerical comparisons of two methods of estimation of additive × additive × additive interaction of QTL effects. J. Appl. Genet. 2022, 63, 213–221. [Google Scholar] [CrossRef]
- Cyplik, A.; Sobiech, A.; Tomkowiak, A.; Bocianowski, J. Genetic Parameters for Selected Traits of Inbred Lines of Maize (Zea mays L.). Appl. Sci. 2022, 12, 6961. [Google Scholar] [CrossRef]
- Cyplik, A.; Czyczyło-Mysza, I.M.; Jankowicz-Cieslak, J.; Bocianowski, J. QTL×QTL×QTL Interaction Effects for Total Phenolic Content of Wheat Mapping Population of CSDH Lines under Drought Stress by Weighted Multiple Linear Regression. Agriculture 2023, 13, 850. [Google Scholar] [CrossRef]
- Banerjee, N.; Khan, M.S.; Swapna, M.; Singh, R.K.; Kumar, S. Progress and Prospects of Association Mapping in Sugarcane (Saccharum Species Hybrid), a Complex Polyploid Crop. Sugar Tech. 2020, 22, 939–953. [Google Scholar] [CrossRef]
- Pallares, L.F.; Harr, B.; Turner, L.M.; Tautz, D. Use of a natural hybrid zone for genomewide association mapping of craniofacial traits in the house mouse. Mol. Ecol. 2014, 23, 5756–5770. [Google Scholar] [CrossRef] [Green Version]
- Venkatesh, T.V.; Chassy, A.W.; Fiehn, O.; Flint-Garcia, S.; Zeng, Q.; Skogerson, K.; Harrigan, G.G. Metabolomic Assessment of Key Maize Resources: GC-MS and NMR Profiling of Grain from B73 Hybrids of the Nested Association Mapping (NAM) Founders and of Geographically Diverse Landraces. J. Agric. Food Chem. 2016, 64, 2162–2172. [Google Scholar] [CrossRef] [PubMed]
- Astorkia, M.; Hernandez, M.; Bocs, S.; Lopez de Armentia, E.; Herran, A.; Ponce, K.; León, O.; Morales, S.; Quezada, N.; Orellana, F.; et al. Association Mapping between Candidate Gene SNP and Production and Oil Quality Traits in Interspecific Oil Palm Hybrids. Plants 2019, 8, 377. [Google Scholar] [CrossRef] [PubMed] [Green Version]
- Reiss, E.R.; Drinkwater, L.E. Cultivar mixtures: A meta-analysis of the effect of intraspecific diversity on crop yield. Ecol. Appl. 2018, 28, 62–77. [Google Scholar] [CrossRef] [PubMed]
- Said, J.I.; Lin, Z.; Zhang, X.; Song, M.; Zhang, J. A comprehensive meta QTL analysis for fiber quality, yield, yield related and morphological traits, drought tolerance, and disease resistance in tetraploid cotton. BMC Genom. 2013, 14, 776. [Google Scholar] [CrossRef] [Green Version]
- Wang, Y.; Ying, H.; Yin, Y.; Wang, H.; Cui, Z. Benefits and Trade-Offs of Tillage Management in China: A Meta-Analysis. Agronomy 2021, 11, 1495. [Google Scholar] [CrossRef]
- Pittelkow, C.M.; Linquist, B.A.; Lundy, M.E.; Liang, X.; Van Groenigen, K.J.; Lee, J.; Van Gestel, N.; Six, J.; Venterea, R.T.; Van Kessel, C. When does no-till yield more? A global meta-analysis. Field Crop. Res. 2015, 183, 156–168. [Google Scholar] [CrossRef] [Green Version]
- Zhao, X.; Liu, S.-L.; Pu, C.; Zhang, X.-Q.; Xue, J.-F.; Ren, Y.-X.; Zhao, X.-L.; Chen, F.; Lal, R.; Zhang, H.-L. Crop yields under no-till farming in China: A meta-analysis. Eur. J. Agron. 2017, 84, 67–75. [Google Scholar] [CrossRef]
- Hernández-Terán, A.; Wegier, A.; Benítez, M.; Lira, R.; Escalante, A.E. Domesticated, Genetically Engineered, and Wild Plant Relatives Exhibit Unintended Phenotypic Differences: A Comparative Meta-Analysis Profiling Rice, Canola, Maize, Sunflower, and Pumpkin. Front. Plant Sci. 2017, 8, 2030. [Google Scholar] [CrossRef] [PubMed] [Green Version]
- Thungo, Z.; Shimelis, H.; Odindo, A.; Mashilo, J. Genetic gain for agronomic, physiological, and biochemical traits and quality attributes in bread wheat (Triticum aestivum L.): A meta-analysis. Euphytica 2021, 217, 119. [Google Scholar] [CrossRef]
- Sala, R.G.; Andrade, F.H.; Cerono, J.C. Quantitative trait loci associated with grain moisture at harvest for line per se and testcross performance in maize: A meta-analysis. Euphytica 2012, 185, 429–440. [Google Scholar] [CrossRef]
- Selamat, N.; Nadarajah, K.K. Meta-Analysis of Quantitative Traits Loci (QTL) Identified in Drought Response in Rice (Oryza sativa L.). Plants 2021, 10, 716. [Google Scholar] [CrossRef] [PubMed]
- Barker, H.L.; Holeski, L.M.; Lindroth, R.L. Independent and interactive effects of plant genotype and environment on plant traits and insect herbivore performance: A meta-analysis with Salicaceae. Funct. Ecol. 2019, 33, 422–435. [Google Scholar] [CrossRef]
- Larimer, A.L.; Bever, J.D.; Clay, K. The interactive effects of plant microbial symbionts: A review and meta-analysis. Symbiosis 2010, 51, 139–148. [Google Scholar] [CrossRef]
- Fasahat, P.; Aghaeezadeh, M.; Kakueinezhad, M.; Jabbari, L. A meta-analysis of genotype × environment interaction on sugar beet performance. Biom. Lett. 2020, 57, 221–236. [Google Scholar] [CrossRef]
- Ali, M.; Copeland, L.O.; Elias, S.G.; Kelly, J.D. Relationship between genetic distance and heterosis for yield and morphological traits in winter canola (Brassica napus L.). Theor. Appl. Genet. 1995, 91, 118–121. [Google Scholar] [CrossRef]


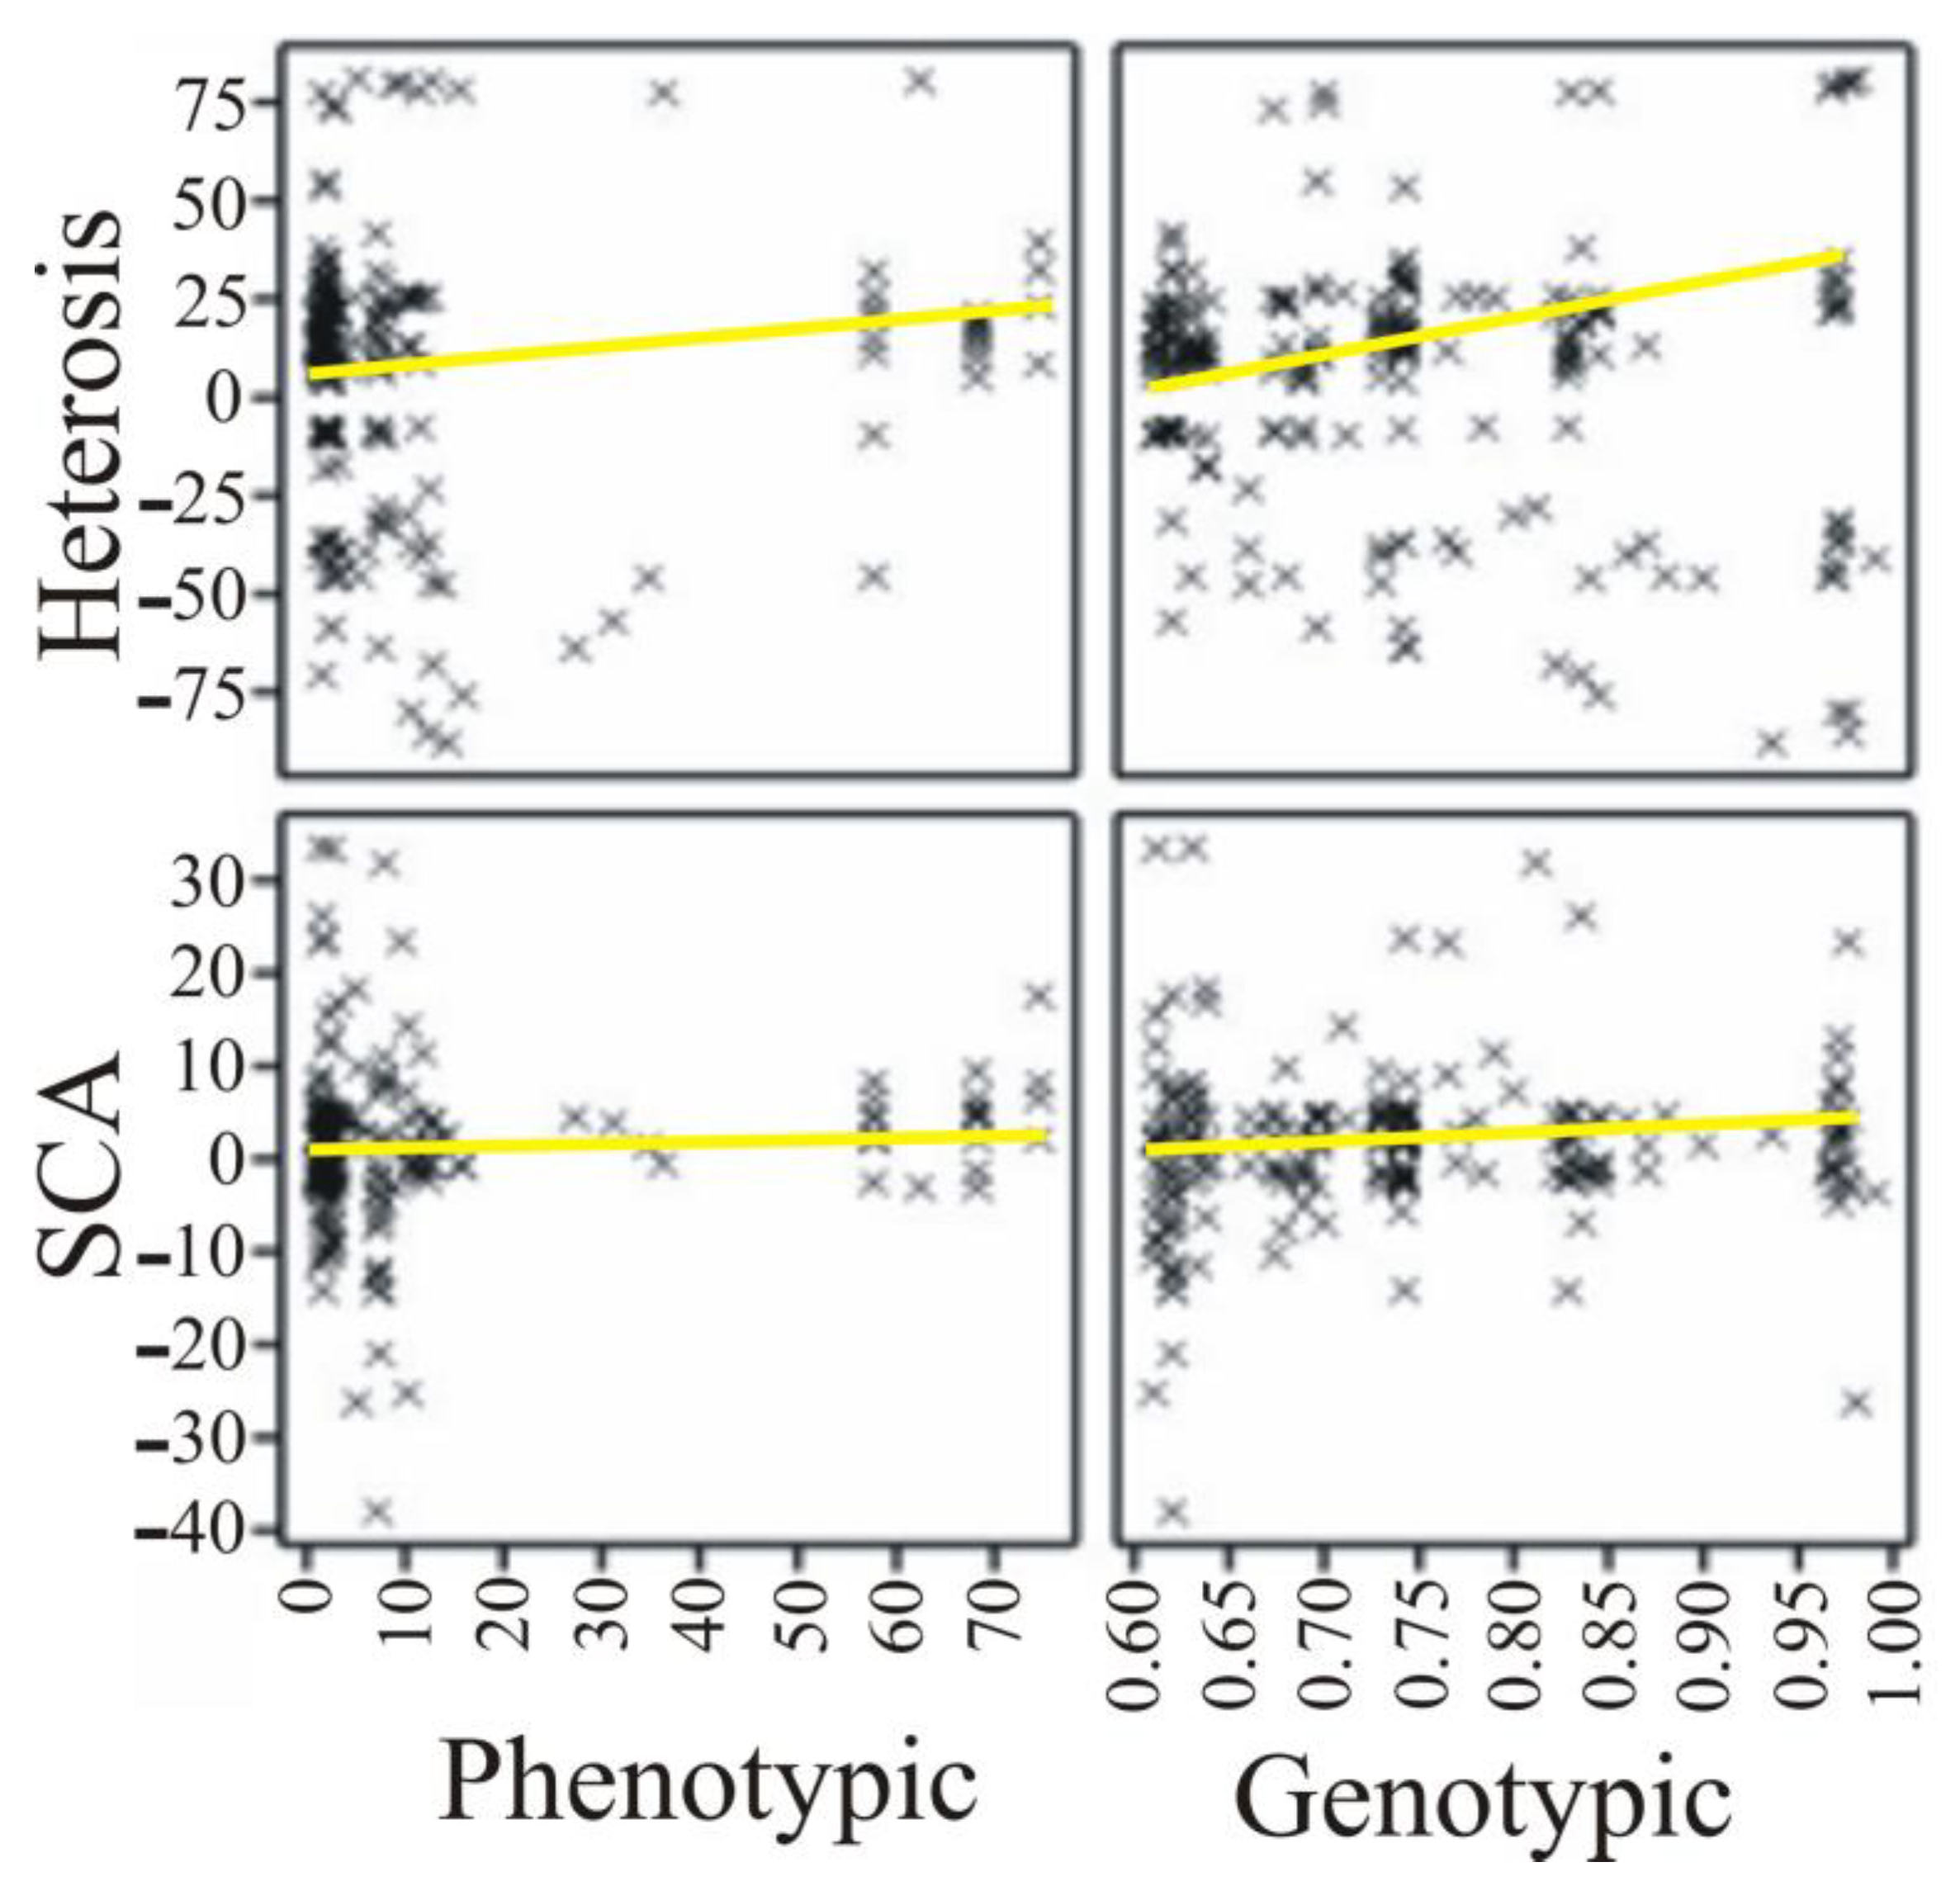
| Parameter | Phenotypic Distance | Genetic Distance |
|---|---|---|
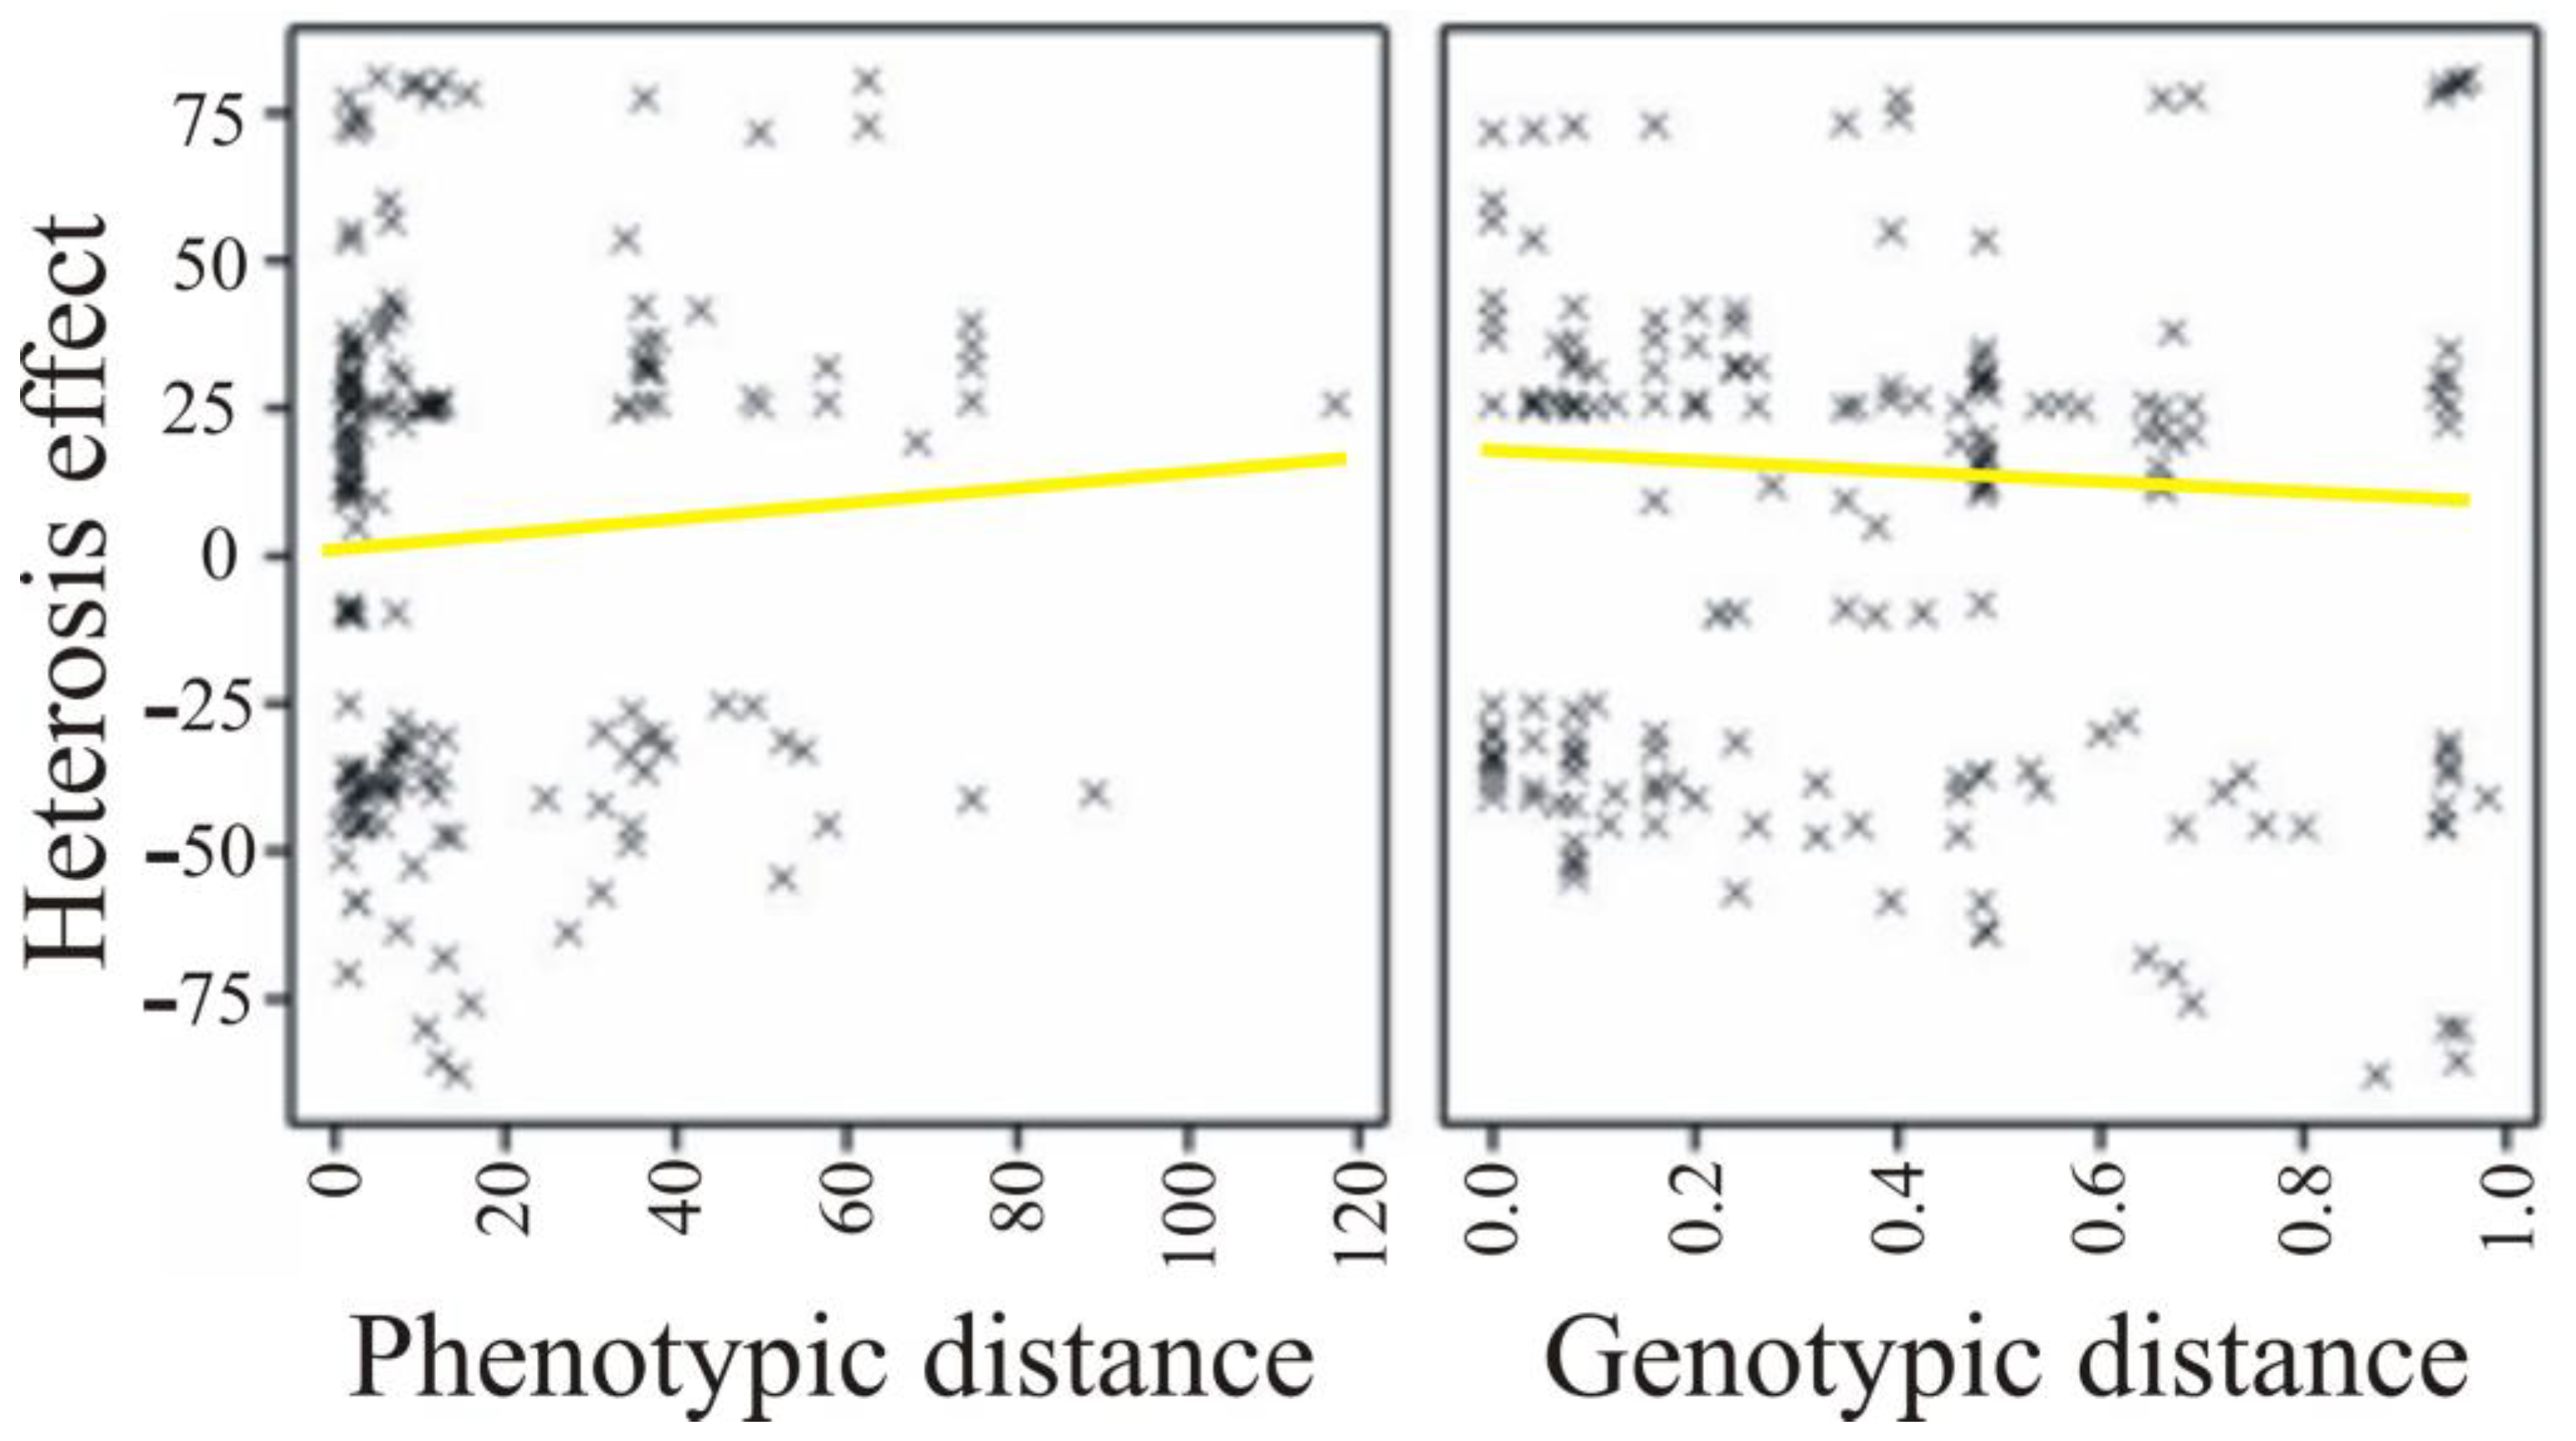
| Heterosis effect | 0.041 (0.074) | −0.071 (0.002) |
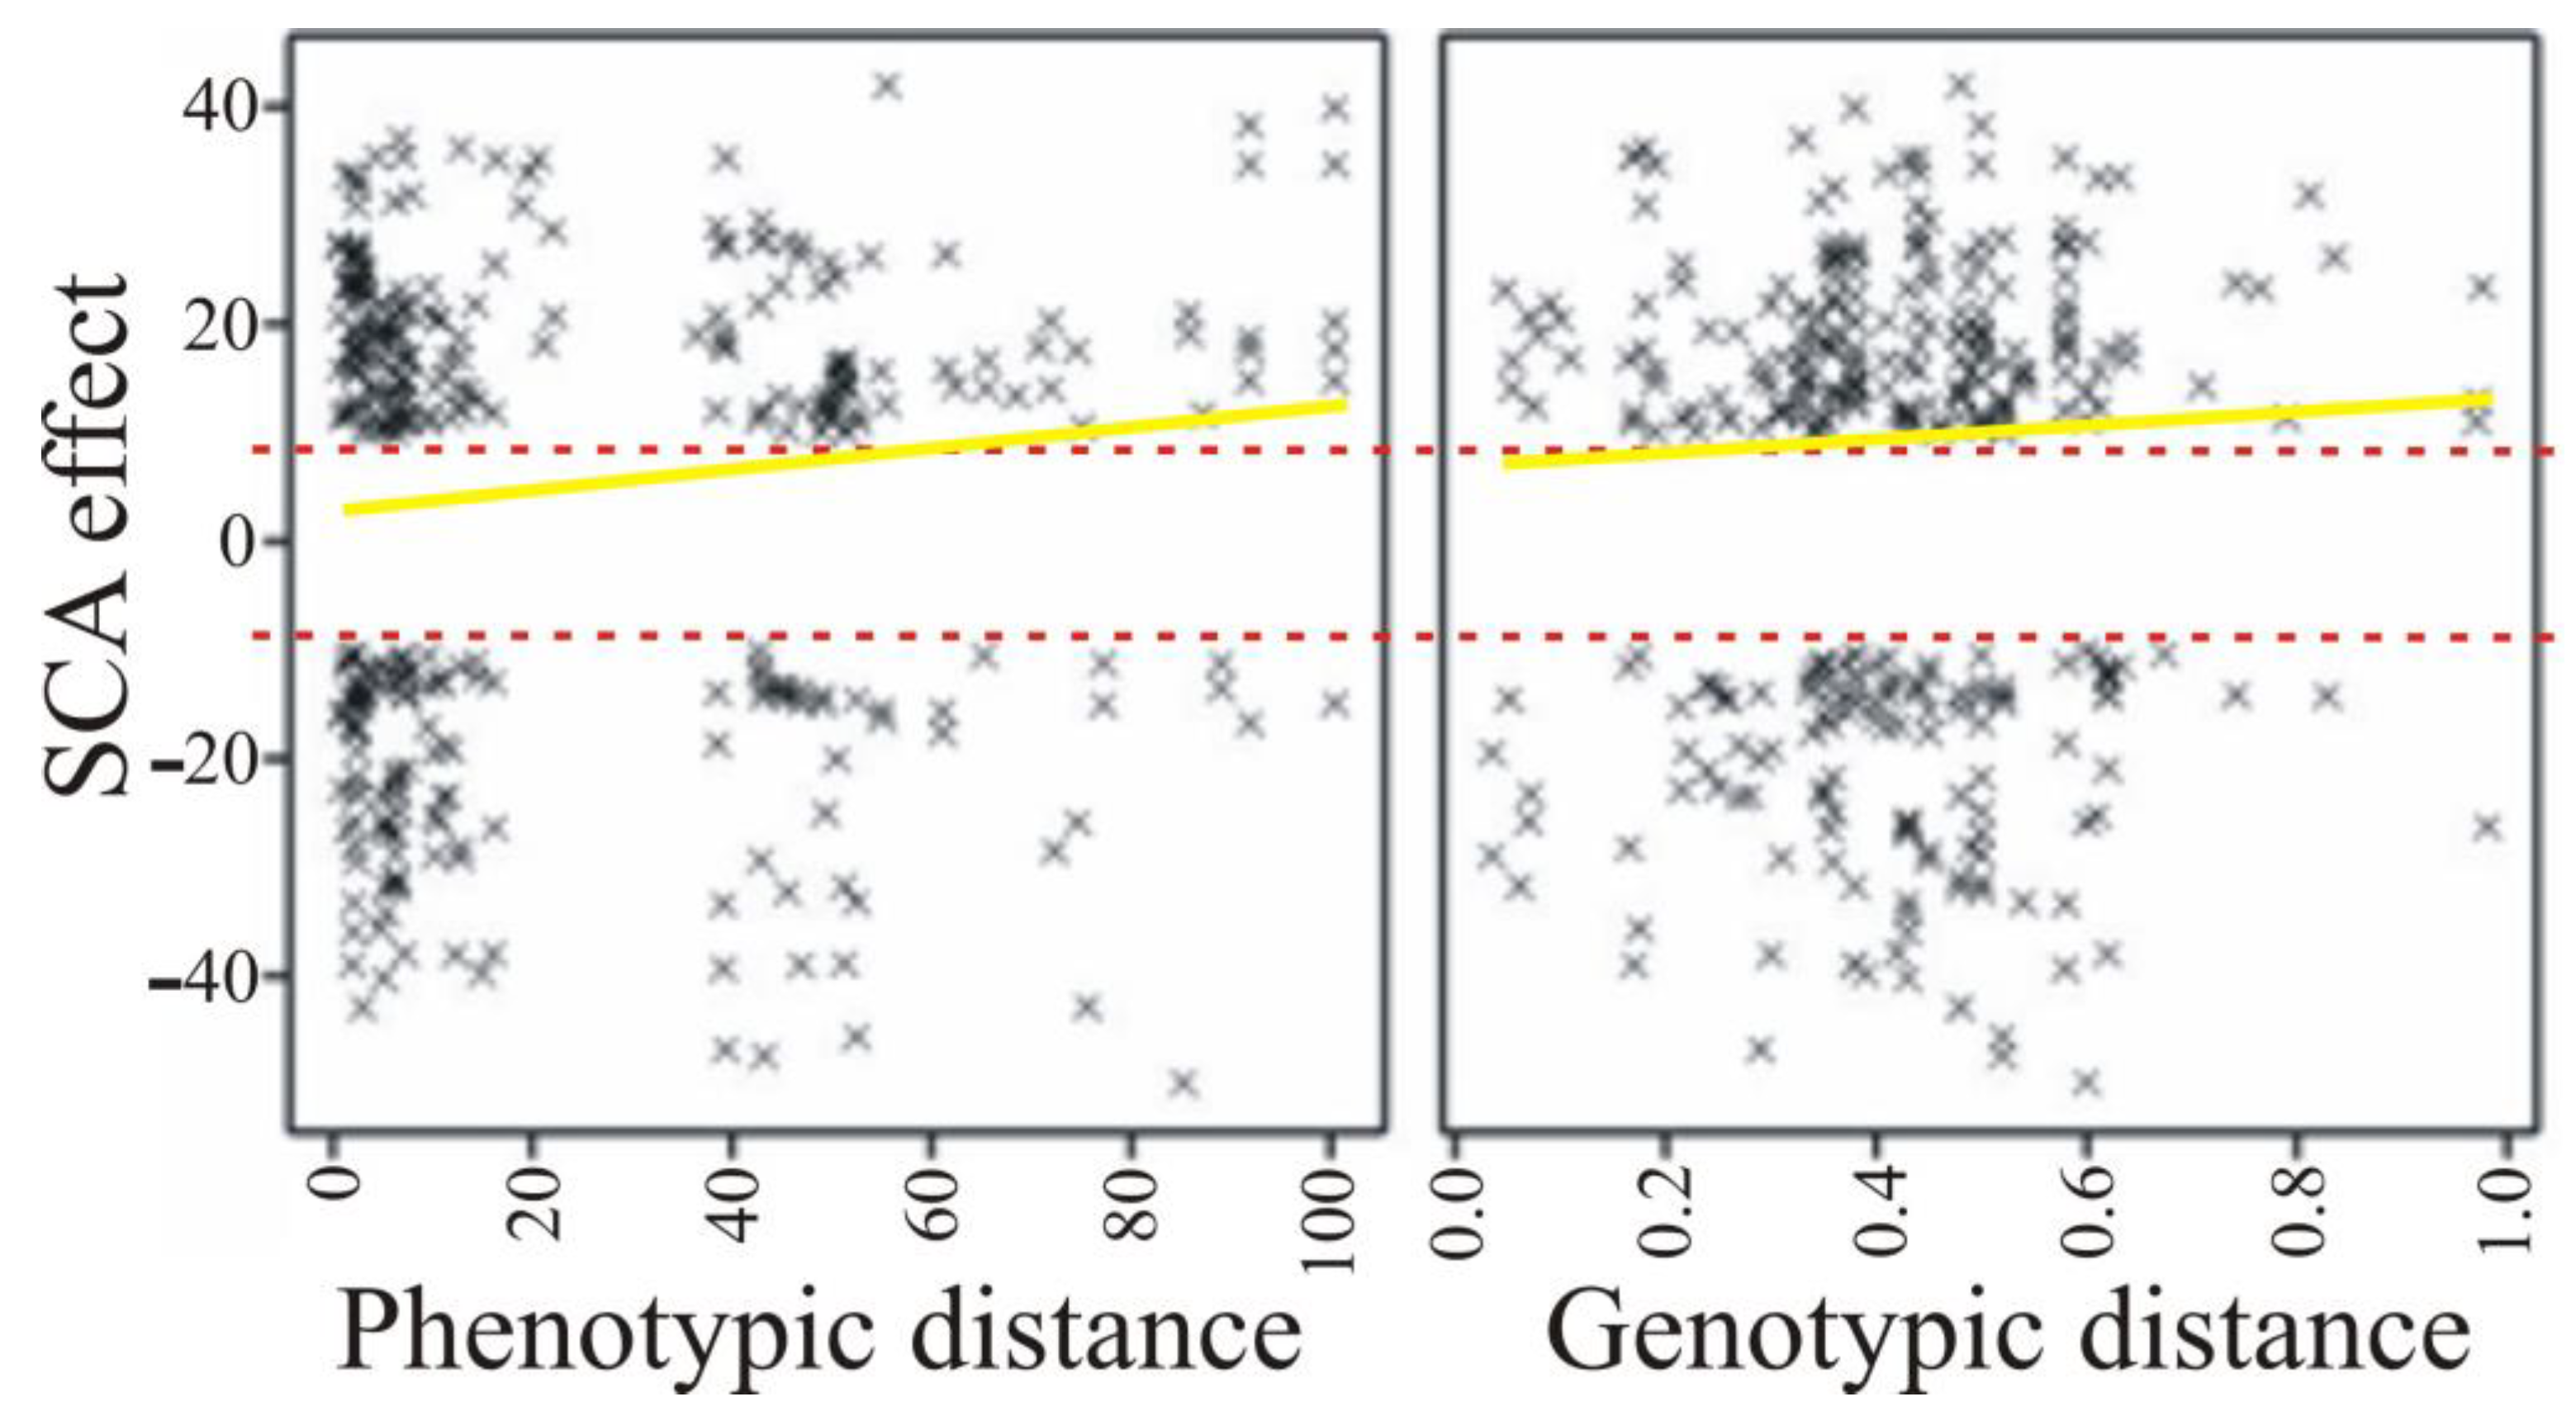
| SCA effect | 0.049 (0.029) | 0.012 (0.584) |
| Heterosis | Phenotypic Distance | Genetic Distance |
|---|---|---|
| Correlation coefficient | 0.048 | −0.013 |
| p-value | 0.518 | 0.886 |
| Significant Effect of Heterosis | The Number of Significant Effects | Phenotypic Distance | Genetic Distance |
|---|---|---|---|
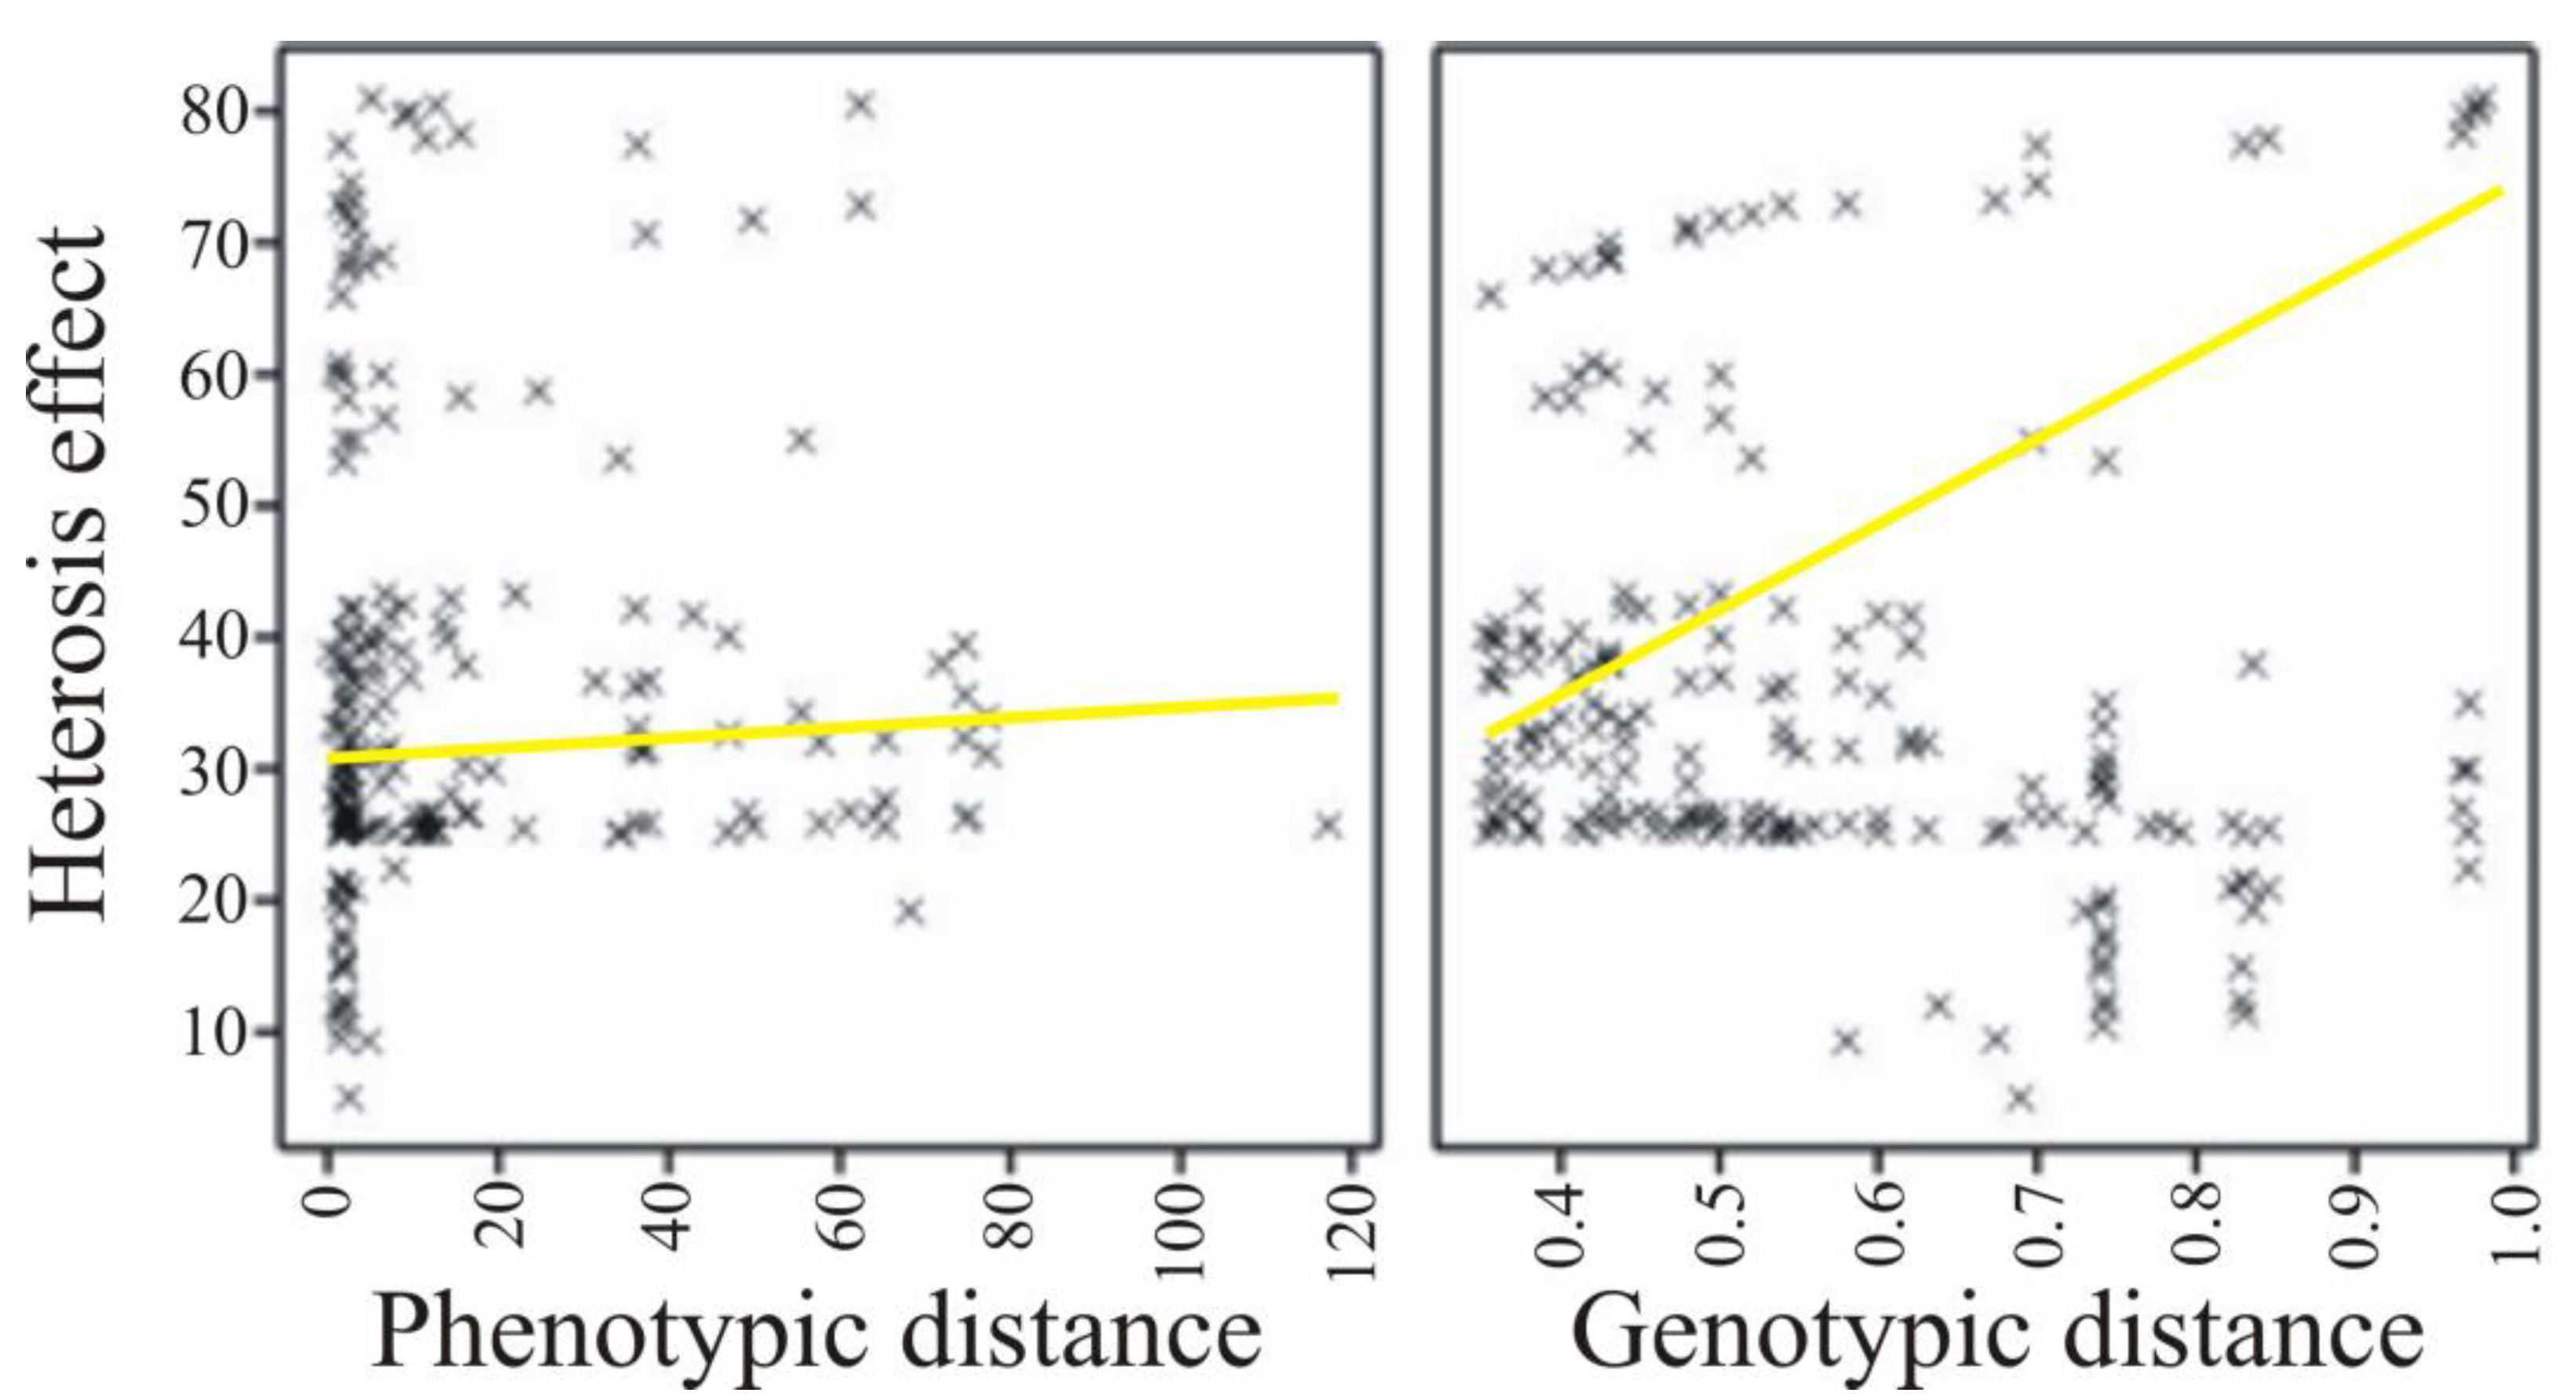
| Positive | 68 | 0.190 (0.120) | 0.326 (0.007) |
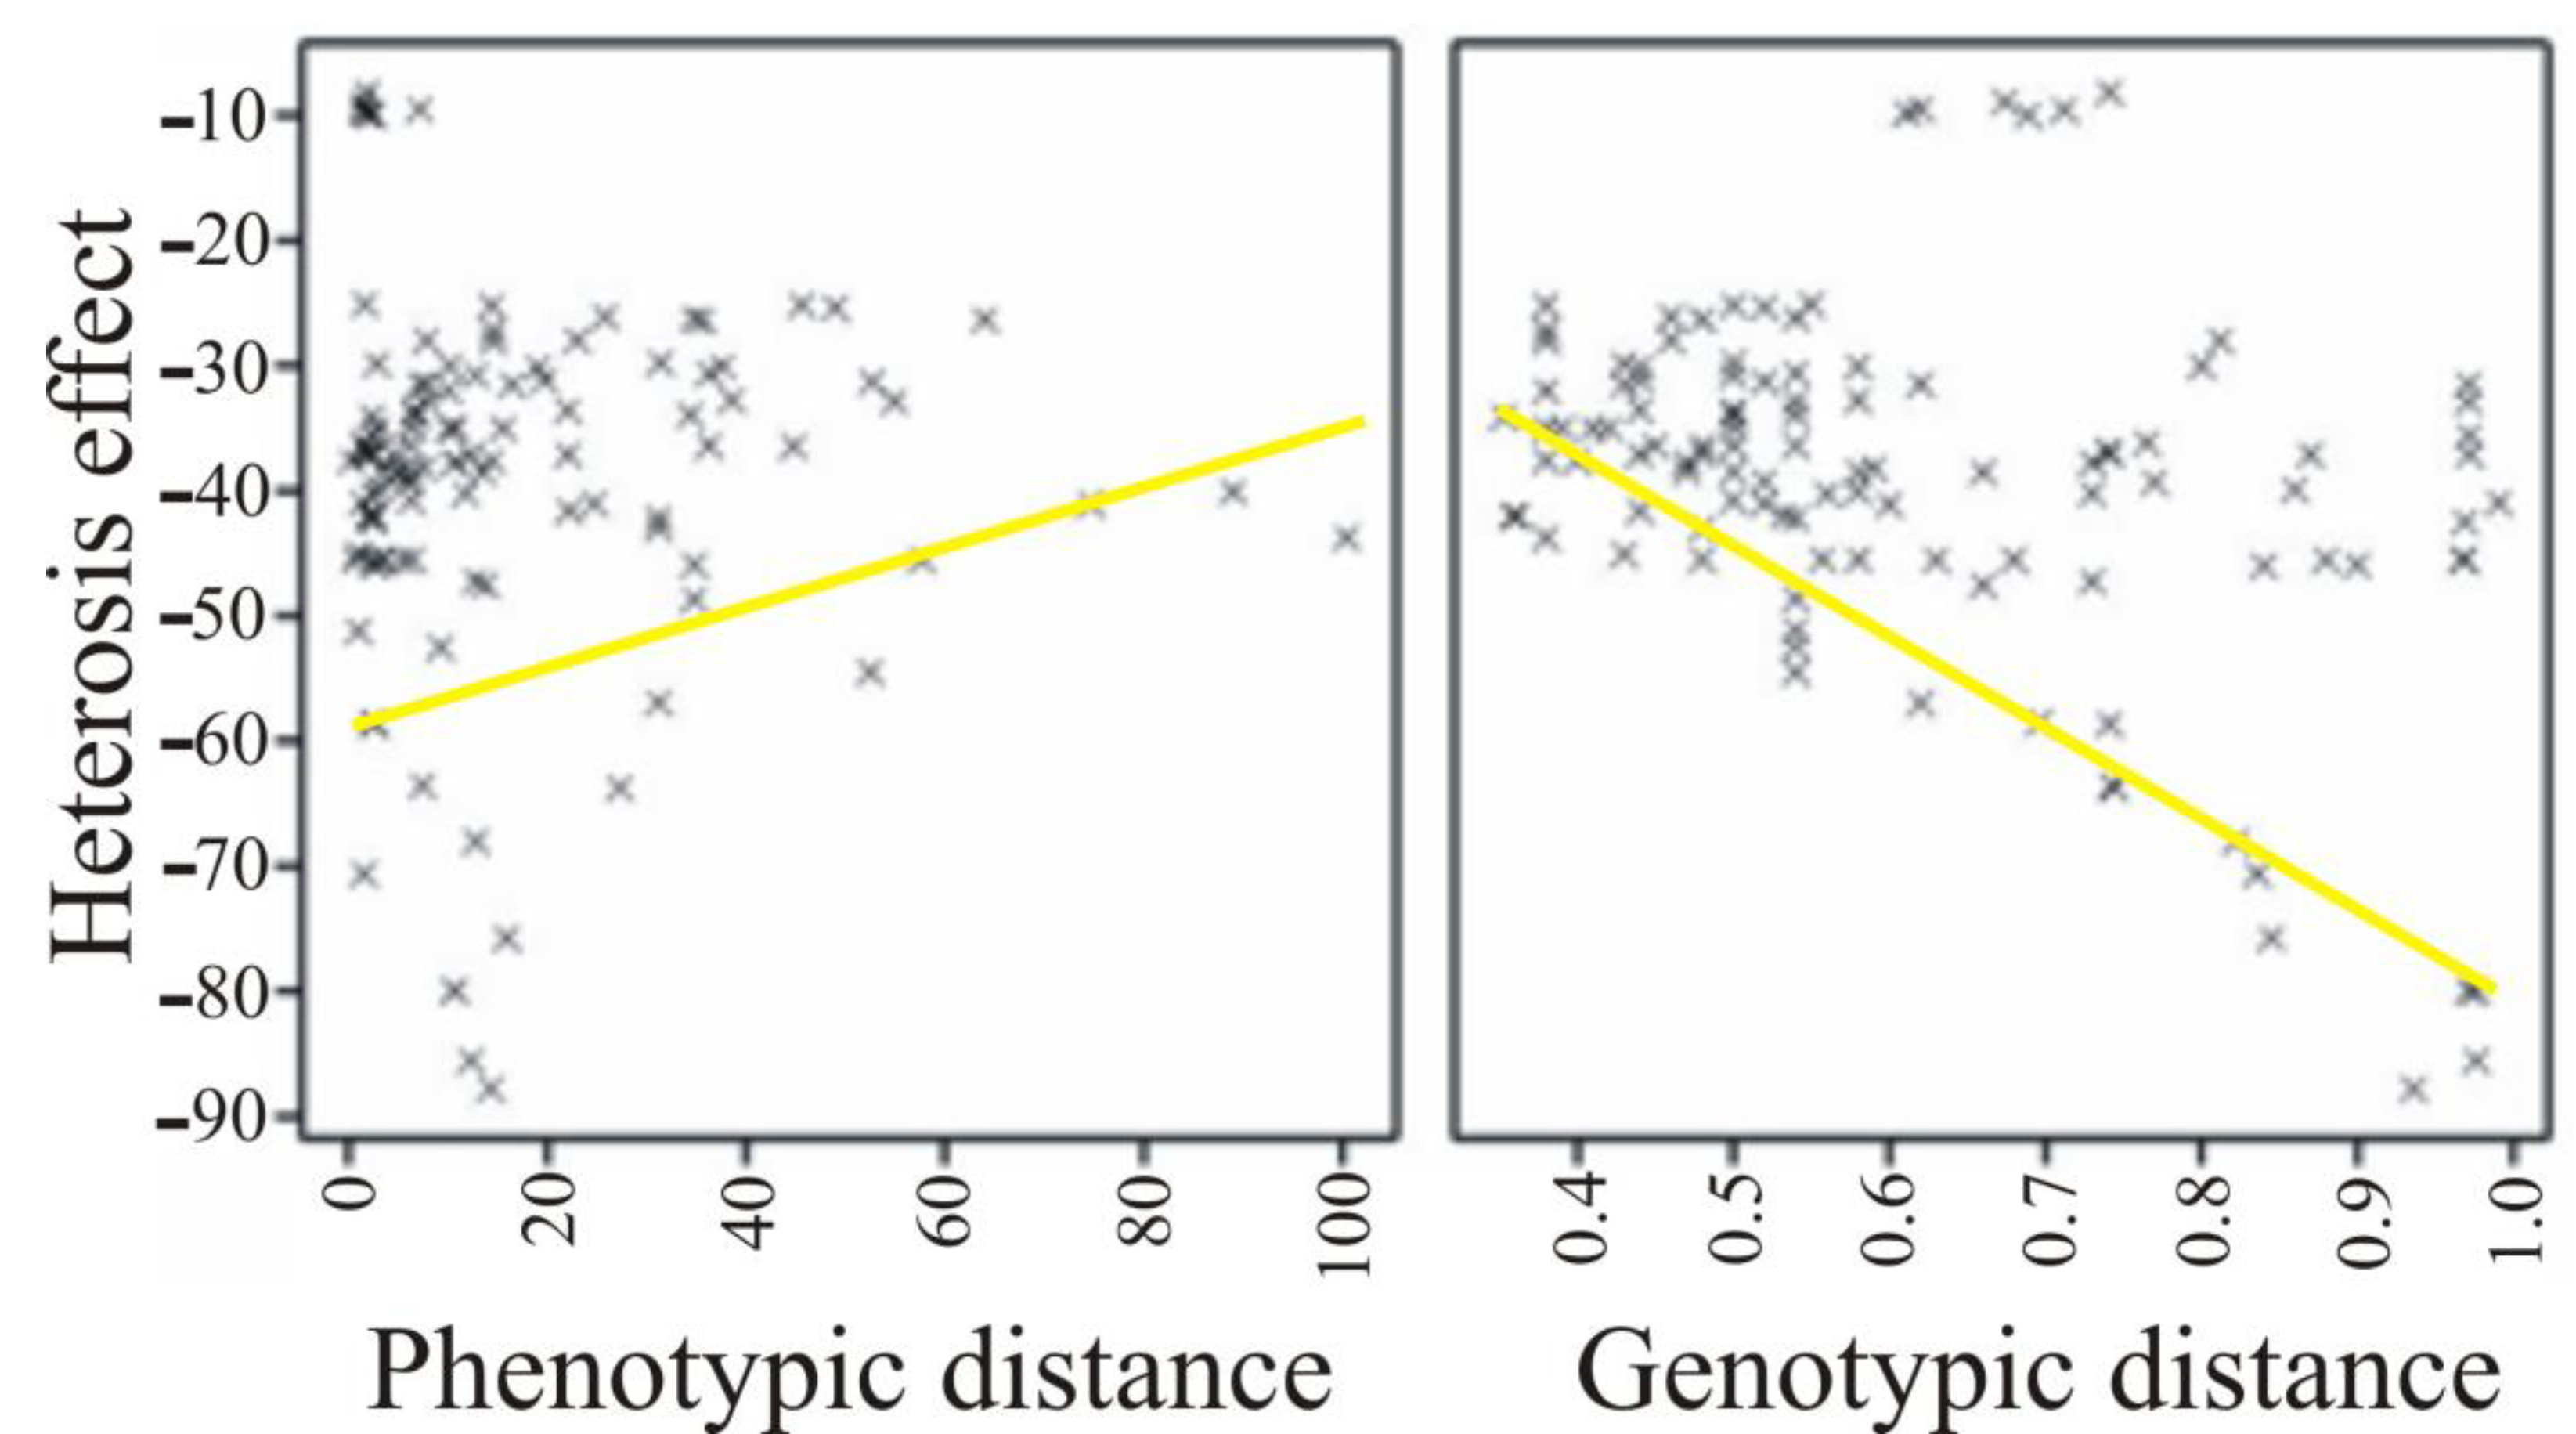
| Negative | 46 | 0.305 (0.039) | −0.426 (0.003) |
Disclaimer/Publisher’s Note: The statements, opinions and data contained in all publications are solely those of the individual author(s) and contributor(s) and not of MDPI and/or the editor(s). MDPI and/or the editor(s) disclaim responsibility for any injury to people or property resulting from any ideas, methods, instructions or products referred to in the content. |
© 2023 by the authors. Licensee MDPI, Basel, Switzerland. This article is an open access article distributed under the terms and conditions of the Creative Commons Attribution (CC BY) license (https://creativecommons.org/licenses/by/4.0/).
Share and Cite
Bocianowski, J.; Nowosad, K.; Bujak, H. Meta-Analysis of Influence of Diversity of Parental Forms on Heterosis and Specific Combining Ability of Their Hybrids. Appl. Sci. 2023, 13, 8704. https://doi.org/10.3390/app13158704
Bocianowski J, Nowosad K, Bujak H. Meta-Analysis of Influence of Diversity of Parental Forms on Heterosis and Specific Combining Ability of Their Hybrids. Applied Sciences. 2023; 13(15):8704. https://doi.org/10.3390/app13158704
Chicago/Turabian StyleBocianowski, Jan, Kamila Nowosad, and Henryk Bujak. 2023. "Meta-Analysis of Influence of Diversity of Parental Forms on Heterosis and Specific Combining Ability of Their Hybrids" Applied Sciences 13, no. 15: 8704. https://doi.org/10.3390/app13158704