Article

Tracking Sensor Location by Video Analysis in Double-Shell Tank Inspections

School of Engineering and Applied Sciences, Washington State University Tri-Cities, Richland 99354, WA, USA
*
Author to whom correspondence should be addressed.
Appl. Sci. 2023, 13(15), 8708; https://doi.org/10.3390/app13158708
Submission received: 15 June 2023 / Revised: 18 July 2023 / Accepted: 18 July 2023 / Published: 28 July 2023
(This article belongs to the Special Issue Computer Vision-Based Intelligent Systems: Challenges and Approaches)

Abstract

:

Featured Application

Defects in the bottom of the primary tank are mapped by data from an ultrasonic sensor pulled through narrow air slots in the space between primary and secondary tanks. The location of data collection points is critical to map accuracy. Laboratory experiments suggest that analyzing videos from cameras on the front and back crawlers moving the sensor can help track sensor location with sufficient accuracy for map creation.

Abstract

Double-shell tanks (DSTs) are a critical part of the infrastructure for nuclear waste management at the U.S. Department of Energy’s Hanford site. They are expected to be used for the interim storage of partially liquid nuclear waste until 2050, which is the target date for completing the immobilization process for all Hanford nuclear waste. At that time, DSTs will have been used about 15 years beyond their original projected lifetime. Consequently, for the next approximately 30 years, Hanford DSTs will undergo periodic nondestructive evaluation (NDE) to ensure their integrity. One approach to perform NDE is to use ultrasonic data from a robot moving through air slots, originally designed for cooling, in the confined space between primary and secondary tanks. Interpreting ultrasonic sensor output requires knowing where measurements were taken with a precision of approximately one inch. Analyzing video acquired during inspection is one approach to tracking sensor location. The top edge of an air slot is easily detected due to the difference in color and texture between the primary tank bottom and the air slot walls. A line fit to this edge is used in a model to calculate the apparent width of the air slot in pixels at targets near the top edge that can be recognized in video images. The apparent width of the air slot at the chosen target in a later video frame determines how far the robot has moved between those frames. Algorithms have been developed that automate target selection and matching in later frames. Tests in a laboratory mockup demonstrated that the method tracks the location of the ultrasonic sensor with the required precision.

1. Introduction

Double-Shell Tanks (DSTs) at the Department of Energy’s Hanford site have been used for the interim storage of partially liquid nuclear waste since their construction in the years 1971–1986. They are expected to serve this function until the immobilization of nuclear waste at the Hanford site is complete around the year 2050. At that time, DSTs will be about 15 years beyond their original projected lifetime [1]. Consequently, the periodic nondestructive evaluation (NDE) of DSTs will be a part of nuclear waste management at Hanford for many years.
The NDE process has two phases. The first phase uses a low-resolution electromagnetic acoustic transducer (EMAT) sensor developed by the Southwest Research Institute [2] to scan large regions of the primary tank bottom. These scans are used to identify regions where high-resolution data are needed, which are obtained by guided wave phased array (GWPA) sensors developed by Guidedwave [3]. These ultrasonic sensors are deployed for the NDE of Hanford tanks [4,5] by robots that move through a network of air slots in the confined space between primary and secondary tank bottoms. See Hede et al., [6] for a recent review of technology developments used in Hanford double-shell primary tank bottom inspections.
Figure 1 shows components of a graphical user interface [7] developed to provide situational awareness to operators controlling the movement of GWPA sensors through air slots. The display on the left shows the network of air slots (blue lines) in relation to welds (red lines) in the bottom of the primary tanks of the AP type. Air slots were originally designed for cooling with air injected at the center and escaping into the annulus-shaped region between the walls of the primary and secondary tanks. To maintain an approximately constant flow rate, the width of air-slots, while constant in each section, decreases slightly as sections approach the air escape point. We refer to this escape point as the “entrance” to an air slot because access to air slots for NDE is through 24-inch raisers into the space between primary and secondary tanks, which are below ground. The section at the entrance has a width of 3 inches at the top of the air slot where the walls of the channel contact the bottom of the primary tank, as shown in the upper right panel of Figure 1.
Ultrasonic data, acquired at approximately 6-inch intervals in an air slot, is used to map regions of the bottom of the primary tank to identify defects with the potential to cause leakage. This interpretation of the ultrasonic sensor output, which enables the reinspection of defects, requires knowing where the ultrasonic measurements were taken with a precision of approximately one inch. In ref. [7], we showed that analyzing video acquired while the sensor is moving can help predict the distance moved with the required precision; however, the method (see Section 2.1 for details) could not be used to track sensor location until target selection and matching in a later frame was automated. The development and testing of the automation required for tracking is the main contribution of this paper.
Video in the GUI can alert the operator to debris in the bottom of air slots that might obstruct the movement of the sensor and changes in the surface of the tank bottom that could prevent the sensor from making the contact needed to acquire good data. The diameter of the primary tank is approximately 80 ft; hence, the display in the left panel of the GUI has pan and zoom that lets the operator follow tracking data sent to the GUI on a scale comparable to the video display. The ultrasonic data display in the GUI (bottom right) lets the operator judge the quality of data before moving to the next data acquisition site.
Proximity to welds in the tank bottom has a major impact on ultrasonic data. All air slots cross under welds at least once, and these crossings may not be detectable in the video sent to the GUI. The relationship between air slots and welds shown in the left panel of the GUI (see Figure 1) was derived from construction drawings and is sufficiently accurate to use data from tracking to alert the operator that the proximity to the welds will influence the ultrasonic data displayed on the GUI.
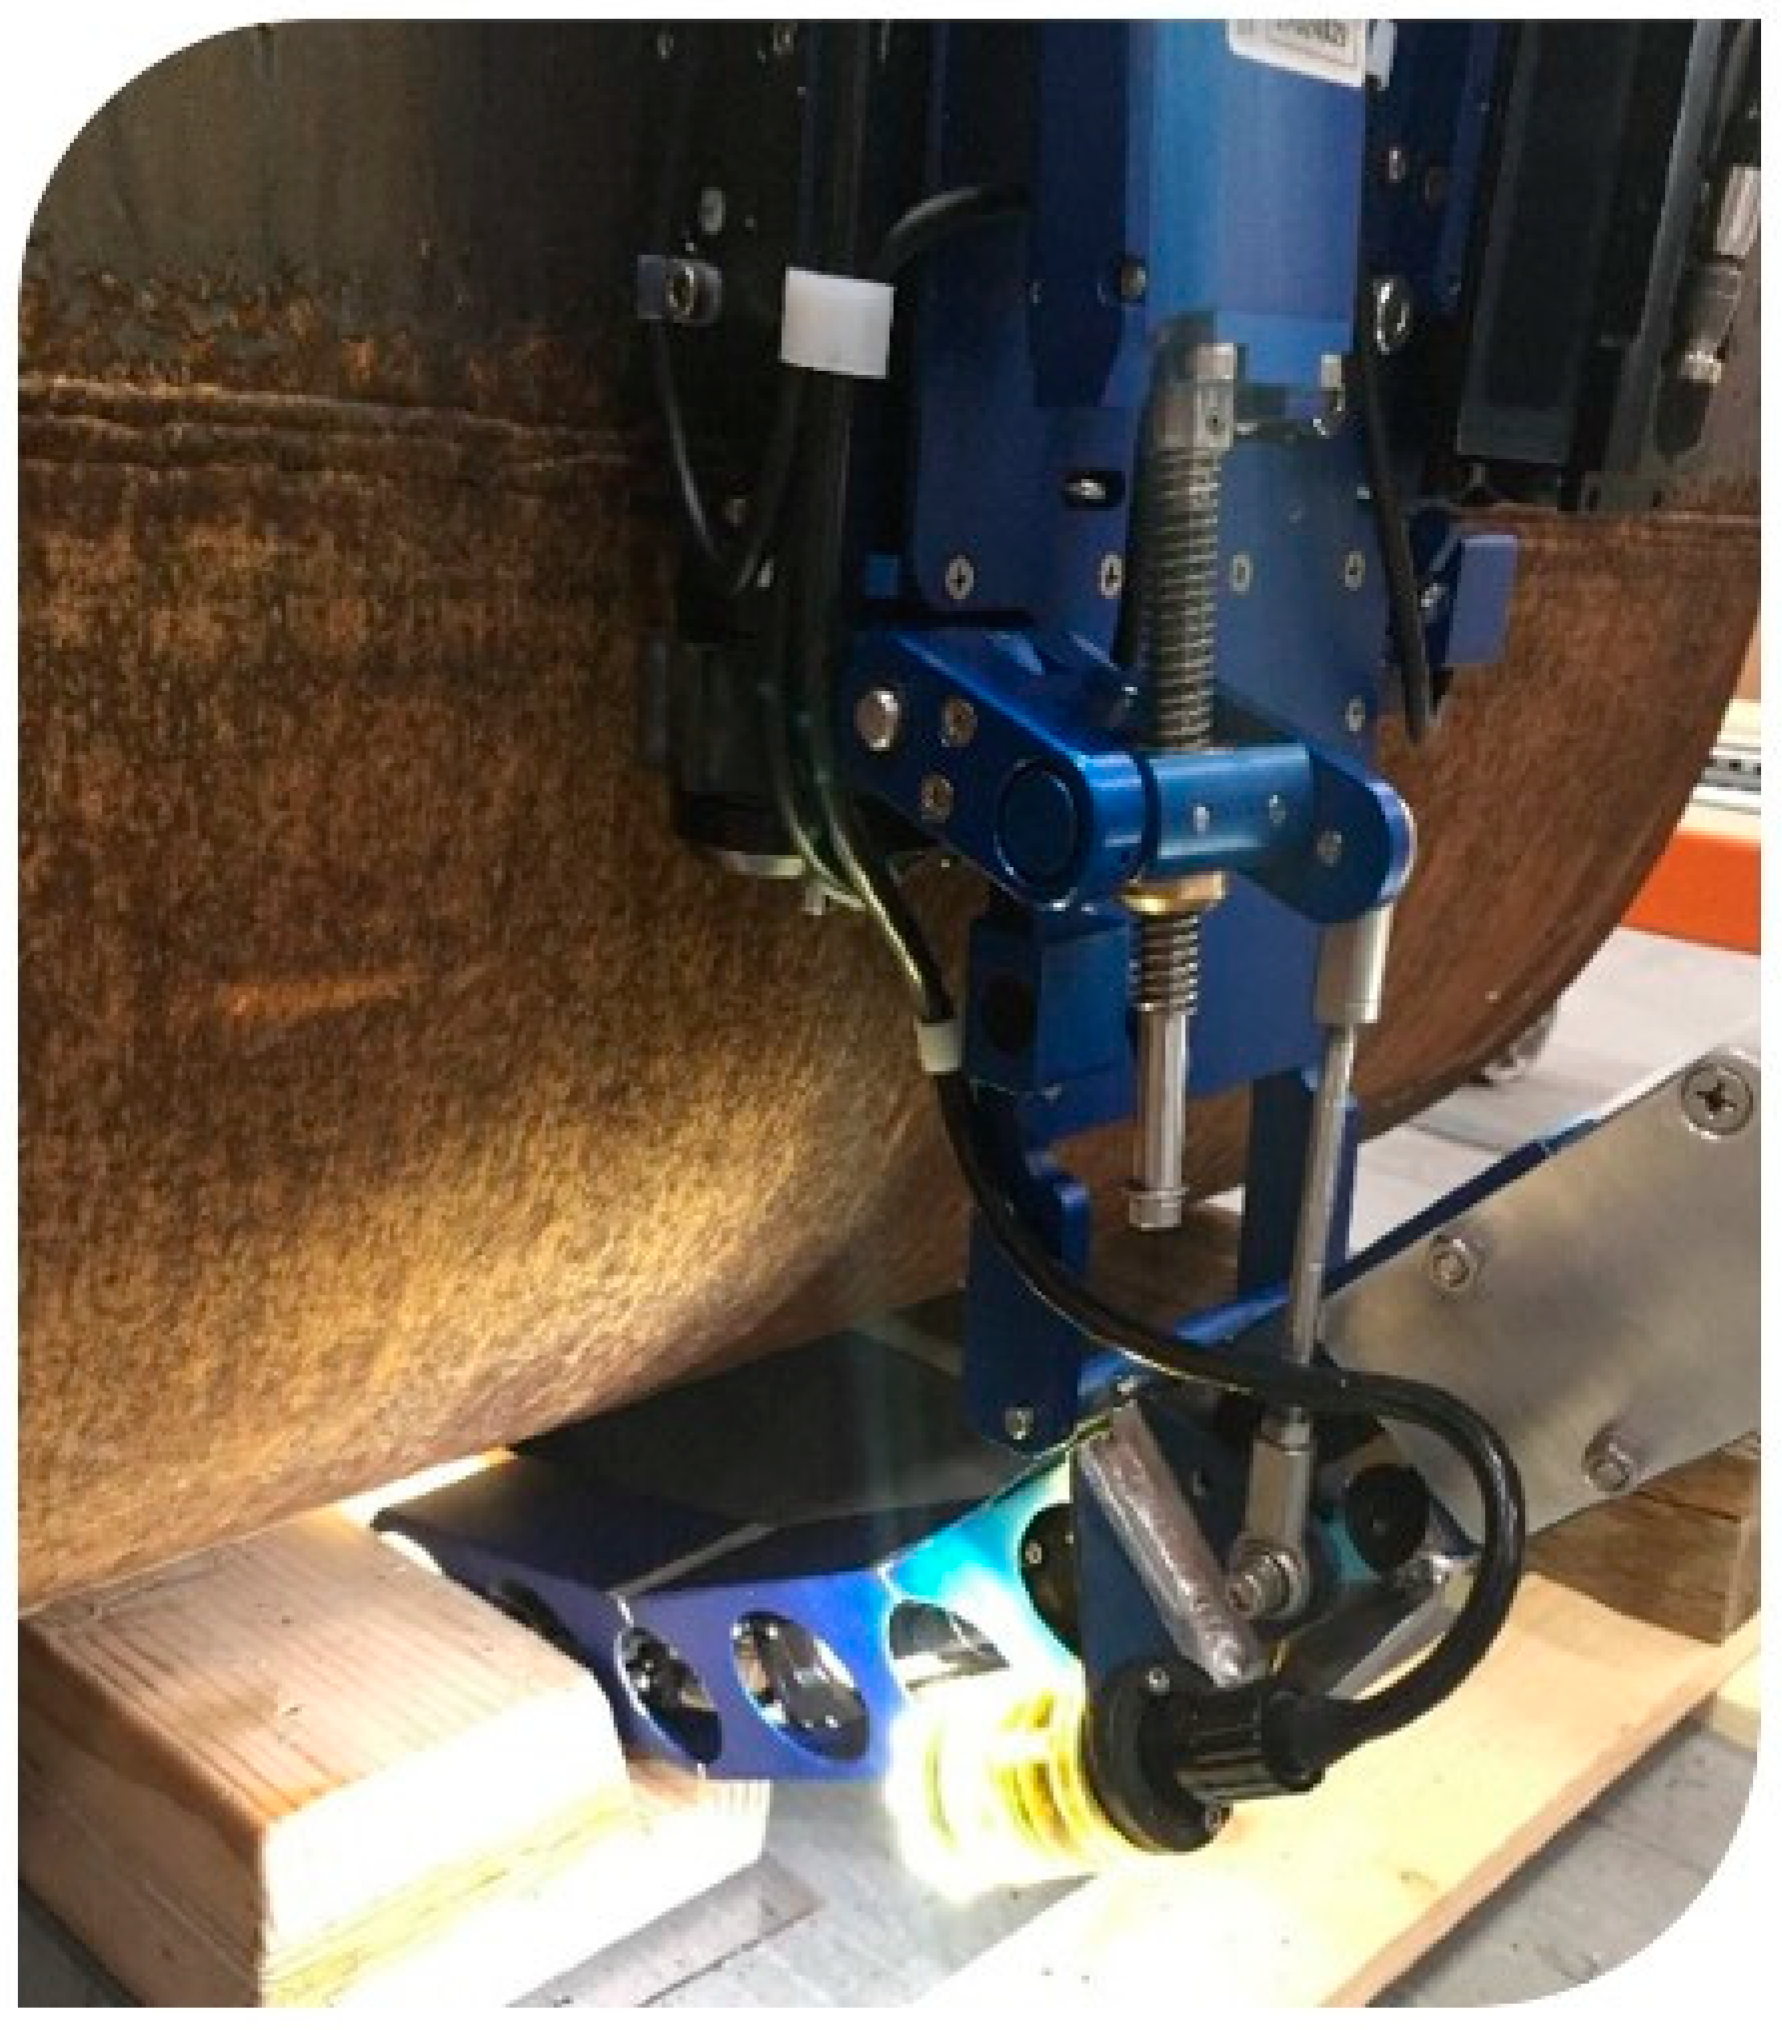
The robot that pulls the ultrasonic sensor through the air slots is carried to the entrance of an air slot by the marsupial mother bot [8] shown in Figure 2 that moves on the wall of the primary tank in the annulus region between the primary and secondary tanks. Maneuvering the injection arm into the air slot entrance current requires careful manual control to avoid damage to the mother bot. This is an area where future research on simultaneous localization and mapping (SLAM) [9,10] could make a significant contribution in moving the mother bot between targeted air slots in the NDE workflow.
The bifurcated pattern of air slots shown in Figure 1 means that the ultrasonic sensor does not travel to the center of the tank from every air slot entrance but must always pass through at least one turn. The 3-car design shown in Figure 3 is required to move the sensor through these turns. Wheels rolling in the bottom of the air slot push the treads of crawlers against the bottom of the primary tank. Both crawlers have video cameras with feeds that can be switched as needed.

2. Materials and Methods

2.1. Prediction of Distance Moved from Analysis of Video Acquired during Movement—This Work Was Previously Reported [7] and Included Here for a Complete Discussion of Our Method of Sensor Tracking by Video Analysis

Triangle similarity [11] is the standard method for predicting the distance between camera and object from a photograph of the object. Calibration of the method determines the apparent focal length of the camera F = PD/W, where D is distance to an object of known width, W, and P is the width of the object in pixels in the photograph. Given F, we can calculate distance D = WF/P to any object of known width, W, from its image width in pixels, P. This method can be applied to predict distance moved by video analysis if we know P1 and P2 and the image widths of an object of known width, W, in earlier and later video frames, respectively. Then, the camera has moved a distance, WF/P1-WF/P2, toward the object in the time between those frames.
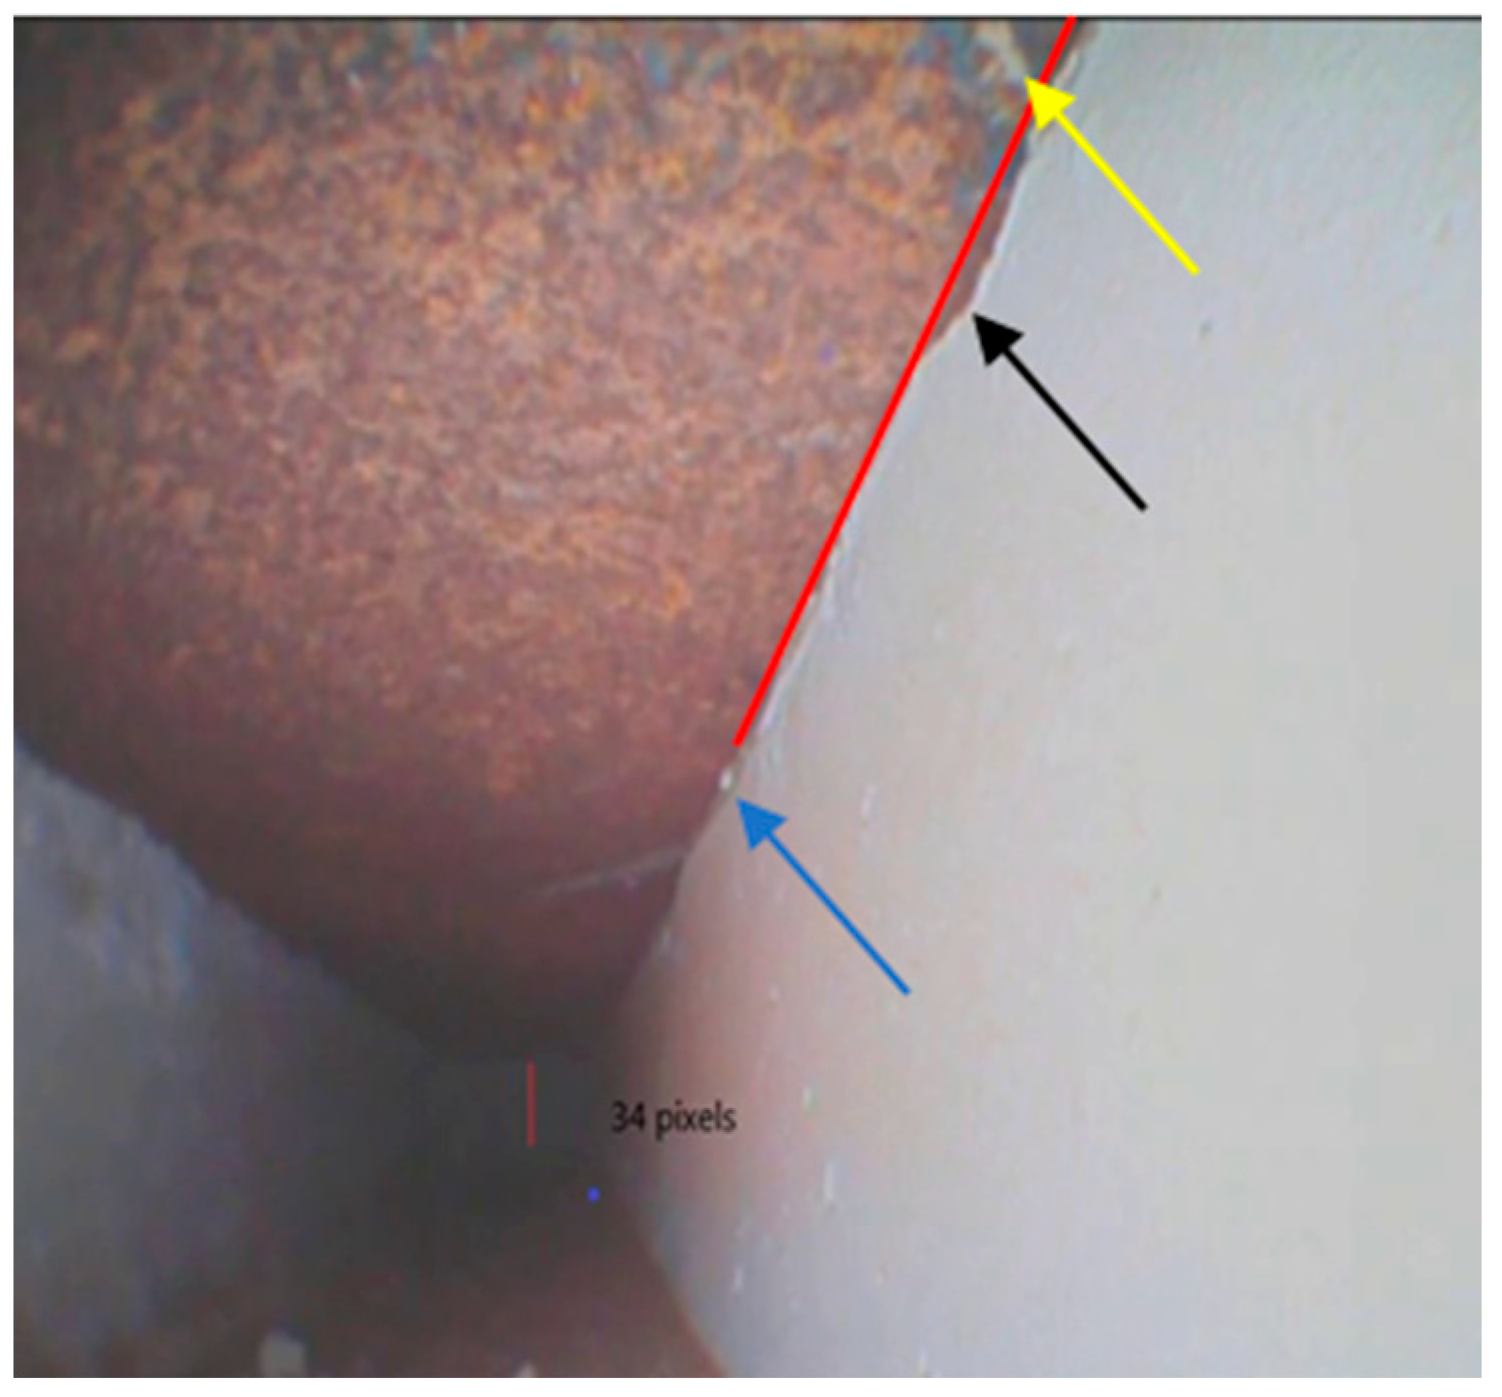
As seen in Figure 4, which comes from a video taken during inspection of air slot 31-1 in DST AP-107 [12], the top edges of the air slot can be easily detected in video analysis due to the difference in color and texture between tank bottom and channel walls. The blue arrow points to a target that is a good choice if the robot is moving toward the target. The increase in apparent channel width at the target in a later video frame can be used to determine how far the camera has moved toward the target in the time interval between frames. We used the output from Canny edge detection [13,14] to fit lines to the edges where walls of the air slot meet the bottom of the primary tank. For extended targets, like those pointed out by the black and yellow arrows, a connection to a point on the edge where the apparent width will be calculated is made by a line perpendicular to the fit to the edge through the chosen point.
The width of an air slot is constant for any of the straight sections that make up the air slot network (see Figure 1), and the value is known from construction drawings. To use this information as the known width in calculations of the distance from the camera to the selected target, we need to know the apparent width of the air slot in the image, even though we do not know the point on the opposite edge that is directly opposite the target. This problem was solved and reported in [7] by a combination of analytical geometry and laboratory measurements illustrated by Figure 5.
If the camera is aligned with the central axis of the channel, then the lines fit to the top edges of an air slot will form two sides of an isosceles triangle with a base that is the apparent width of the channel at the target in the video frame. We refer to the value calculated from this ideal geometry as the “isosceles triangle” approximation. The perspective of the channel image in each video frame will not be ideal; hence, corrections to the isosceles triangle approximation were determined empirically with data from the laboratory mockup of the air slot shown in Figure 5 with graph-paper lining. A linear fit to these corrections as a function of the slope of the edge containing the target led to a model that reproduced experimental results with an error of less than 5%. The accuracy of this method to predict distance moved from video acquired during the movement was tested by comparison to laser rangefinder measurements and found to be within the requirements for use in NDE of DSTs.

2.2. Tracking Sensor Location by Video Analysis

The method described above for predicting sensor movement from video acquired by cameras on the crawlers pulling the ultrasonic sensor through air slots is not practical over large distances without automated target selection and matching in a later frame. Automation was achieved by application of Scale Invariant Feature Transform (SIFT) [15] and Fast Library for Approximate Nearest Neighbors (FLANN) [16] in Python’s OpenCV Library [17]. SIFT extracts keypoints and computes their descriptors (invariant feature transforms), which FLANN uses to find matches of those keypoints in later frames. Links in [15,16] provide additional information about these algorithms.
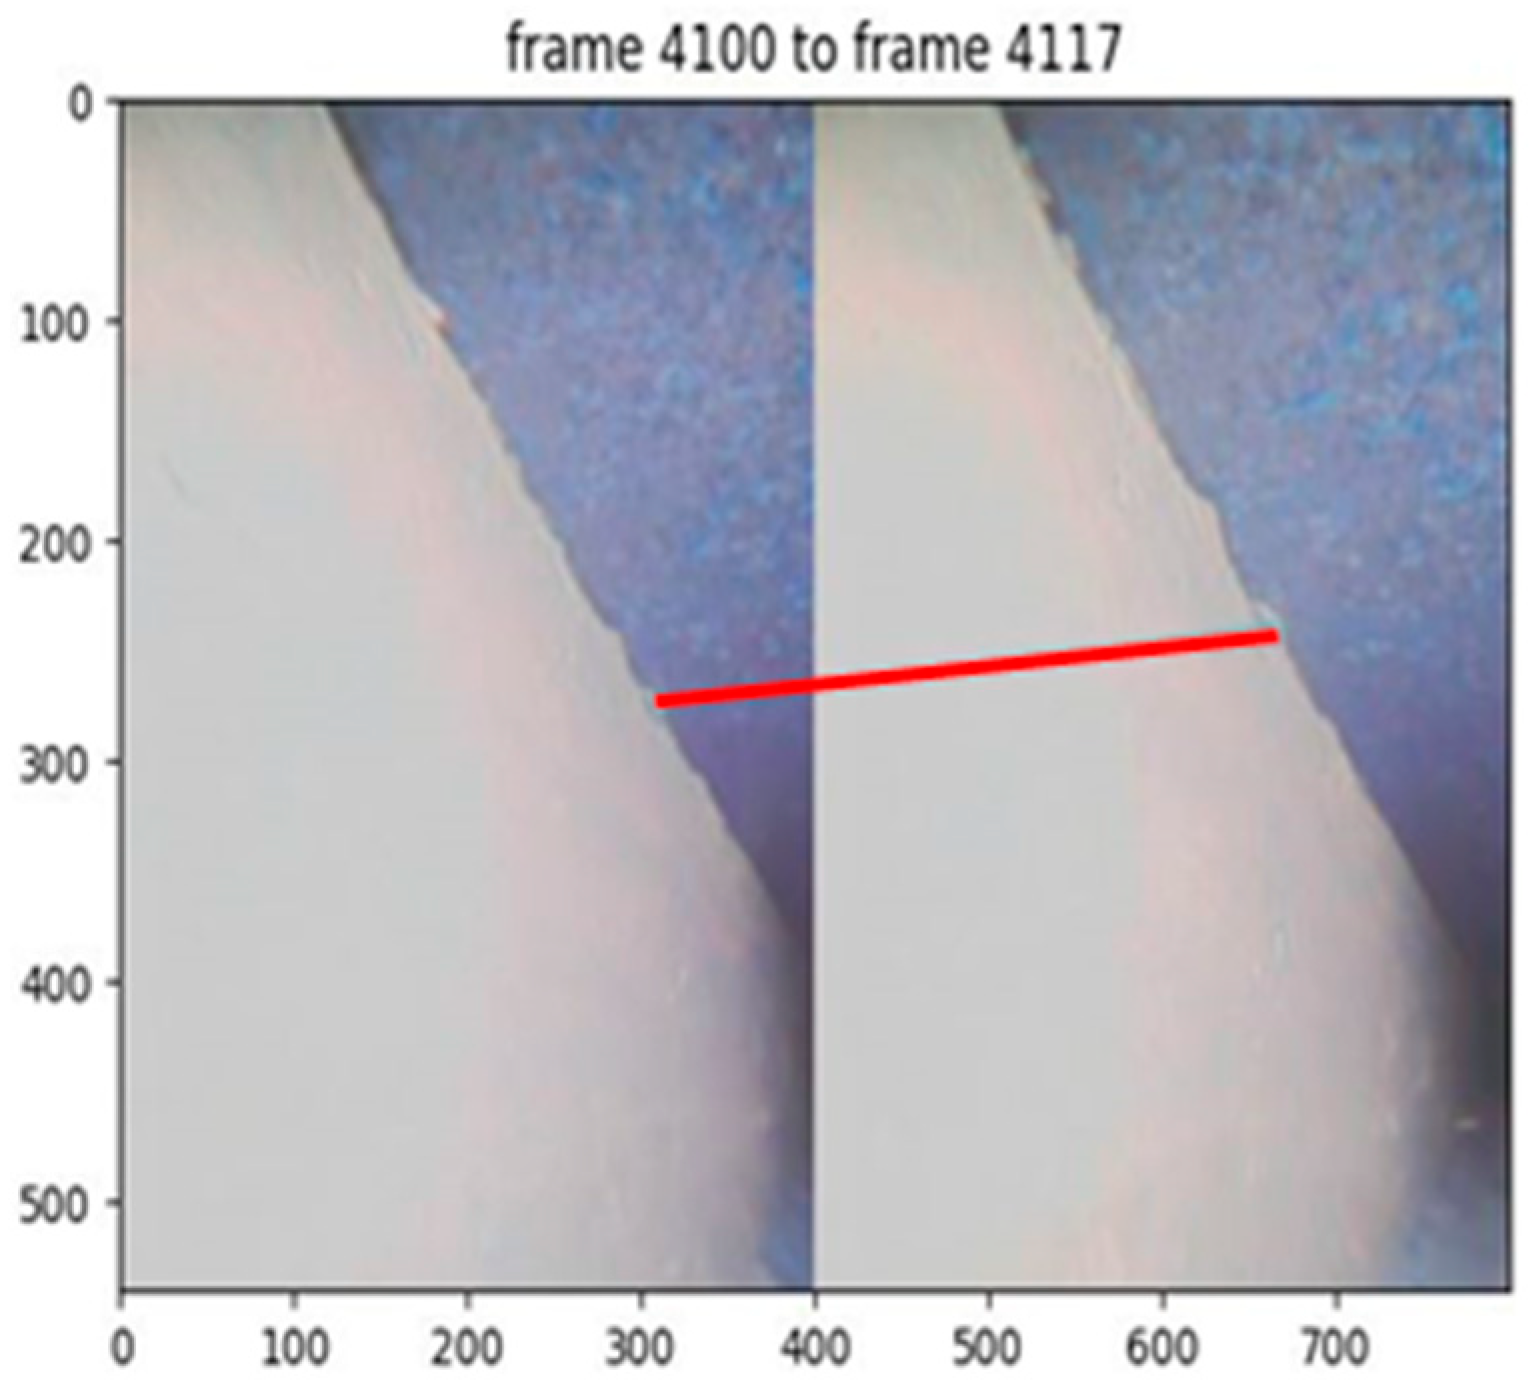
Figure 6 shows the location of a keypoint in frame 4100 of the video taken during inspection of air slot 31-1 in DST AP-107 [12], which we call the “start” frame, matched to the same keypoint in frame 4117, which we call the search frame. Coordinates of keypoints are written to an output file for later calculation of how far the sensor moved in the time between the frames.
The frame count between start and search frames is mainly determined by the illumination of the channel by lights on the front and rear crawlers because large changes in brightness between start and search frames increase mismatches. After a successful match, the search frame becomes a new start frame to match keypoints with a new search frame separated by the same frame count as before. If a search for matching keypoints fails, the frame count is decreased by one successively until a successful match is found or the count between start and search frames is less than a threshold. In the latter case, a gap equal to the desired constant frame count is entered into the output table, and a new start–search sequence is initiated. These gaps are filled later by manual target matching in the frames that border the gap. After gap filling, the coordinates of matched keypoints in each pair of start–search frames are used to calculate how far the sensor has moved in the time between frames.
The absolute location of the sensor is the accumulation of many short measurements of size determined by the optimum count between start and search frames. The robot is expected to move at approximately constant speed between sites of data collection; consequently, accumulated measurements as a function of frame number are approximately linear. Fitting a line to these data reduces noise in the absolute location and may reveal large errors in distance measurements that require correction by reexamining the video.
The method of tracking sensor location described above cannot be implemented while the crawler carrying the camera is negotiating a turn in the air slot because mismatches increase, and the slope of the edge that contains a target cannot be accurately determined. Consequently, when the front camera comes within 6 inches of a turn, the video for tracking sensor location is switched to the camera on the back crawler. The same method of measuring distance moved applies to the rear camera based on the reduction in the apparent width of the channel as the RAVIS moves away from a target selected in an earlier frame. When the front crawler has completed the turn, video is returned to the front camera.
Additional video to test our method of sensor tracking was obtained using a section of air slot in our laboratory, donated by the Pacific Northwest National Laboratory (PNNL), that contains 2 turns of the bifurcated air slot network shown in Figure 1. A 3-car mockup of the RAVIS, shown in Figure 3, was constructed based on dimensions of the crawlers and sensor, which was also provided by PNNL.
Tracking sensor location by offline video analysis means that the movement of the sensor is under external control. We acquire video while the sensor is moving and analyze the video after the sensor has stopped to predict how far it has moved. In the laboratory, we can measure how far the sensor moved to test the accuracy of predictions by offline video analysis.
Tracking sensor location by real-time video analysis means that we both acquire and analyze video while the sensor is moving and use the results for motor control. An operator starts the movement of the sensor and expects the real-time video analysis to stop the movement after the sensor has gone a prescribed distance, such as the distance between data collection sites. In the laboratory, we can measure how far the sensor moved and compare it to the results of real-time video analysis, but we are more interested in the comparison of the actual distance moved to the prescribed distance to discover the trustworthiness of real-time video analysis for moving the sensor a prescribed distance.
At the velocity of sensor movement that is typical of our laboratory experiments, video acquired at 6–10 fps with a frame buffer size of 1 allowed us to grab the newest frame and analyze it for how far the sensor had moved since the last grabbed frame. Typically, 10–20 matches on both upper edges of the air slot channel are selected to estimate incremental movement in the range of 10–15 mm. When the accumulation of incremental movements approaches the chosen distance between sites of data acquisition, usually 6 inches, the computer sends a signal to stop the motors on the crawlers. A ground-truth measurement of actual distance traveled is taken before the user restarts crawler movement.

3. Results

Most mismatches can be automatically rejected due to the unreasonable prediction of RAVIS movement. An example where this is not the case is entry 1.7639 in Table 1. This mismatch was verified manually by reviewing the keypoints in frames 4740 and 4759.
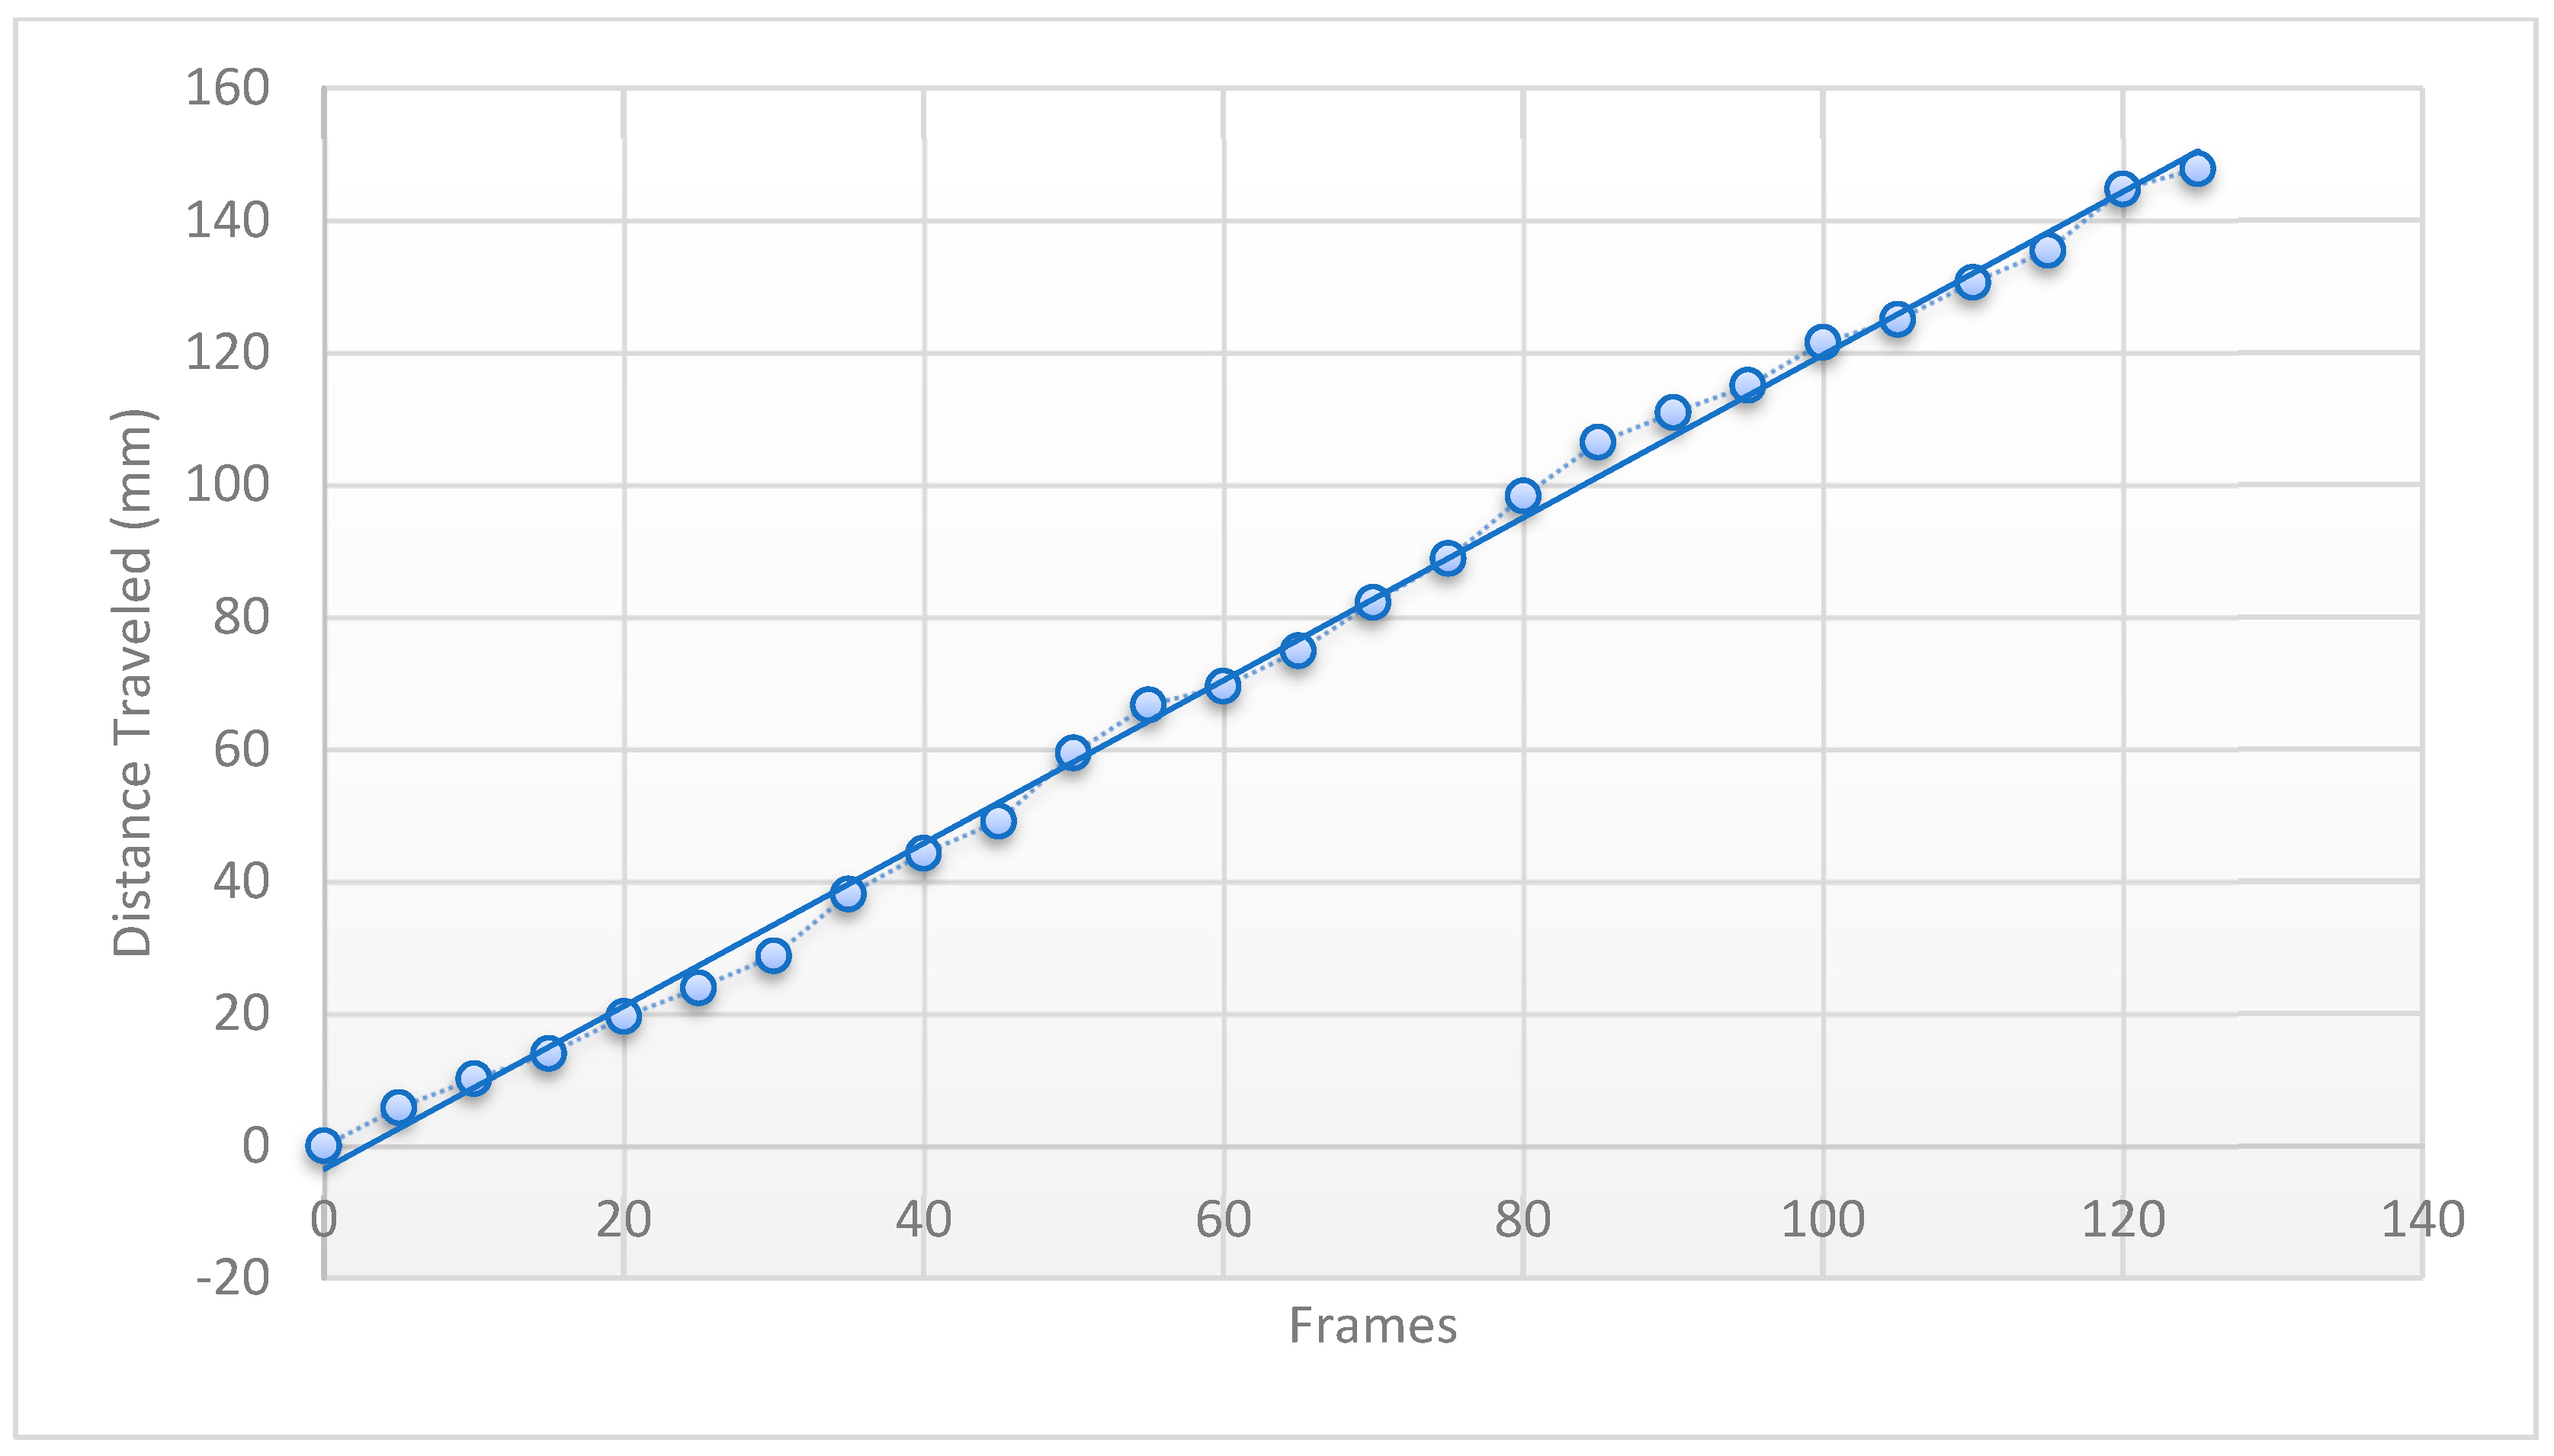
To test the accuracy of the offline video analysis of the sensor movement, we collect video while the crawler moves the sensor a specified distance and compare the actual distance moved to predictions of video analysis. Data points in Figure 7 show the accumulated predictions of RAVIS movement by an analysis of the video taken in a 6-inch run starting from the entrance of the section of the air slot in our laboratory. The prediction of total distance traveled based on the accumulation of 25 separate matches of features at 5-frame intervals is 147.8 mm, which differs from the ground-truth distance of 152.4 mm by 3%. The linear fit to the data points shows that the RAVIS moved at a nearly constant speed over the test distance. The predicted distance traveled based on the empirical constant velocity is 149.3 mm, which is slightly more accurate (2% error) than the accumulation of short distance measurements. The video analysis of two more 6-inch runs predicted 152.2 and 150.0 mm based on accumulated short-distance predictions. The standard deviation of absolute error in the three predications is 2.192 mm (1.44% of ground-truth distance).
Table 2 shows data from a video analysis of five runs in the laboratory air slot mockup that simulated tracking the ultrasonic sensor from the entrance of an air slot through two turns into the next wider section of the air slot (see Figure 1). All but one of the ground-truth segments in Table 2 are 6 inches in length, which is a typical separation of data collection sites in the ultrasonic evaluation of the primary tank bottom. The notation in the first column of Table 2 shows where in the air-slot mockup the interval is located (S for initial straight section, T for turn, and W for wider section) and which camera, front (F) or back (B), is being used for the video analysis of the sensor movement.
The first seven entries in Table 2 show predictions of video analysis for distance between simulated data collection sites in the straight section at the entrance to an air slot. For the first four of these, both crawlers are in the straight section with video from the front camera being analyzed. For the last three of them, the front crawler is navigating the turn into the short section of the air slot connecting the initial straight section with the wider second long section (see air slot pattern in Figure 1). The errors in predictions are less than 10%, show no distinction between front and back cameras, and occur with both positive and negative signs.
The next five entries in Table 2 show predictions of distance between simulated data collection sites by an analysis of video from cameras moving in the short connecting section of the air slot. Among these five, the third FT prediction is for a shorter distance (3.2″) that is sufficient to allow video from the back camera to take over the tracking of the sensor movement in the short connecting section of the air slot mockup as the front crawler navigates the second turn into the wider section of the air slot. The error in the next two BT predictions exceeds 20% (see Table 2). We believe this is due to the sluggish movement of the front crawler as it navigates the turn into the second long and wider section of the air slot.
The final four predictions in Table 2 are from an analysis of video from the front camera as the front crawler moves in the wider section of the air slot. The last of these again exceeds 20% probably due to sluggish motion as the back crawler navigates a turn. Error in the prediction of the accumulated distance traveled is small (see last row of Table 2) due to the cancellation of errors occurring with opposite signs.
To test the accuracy of real-time sensor tracking, we added motor controls to stop the crawlers when the video analysis predicted the sensor had moved a specified distance. We performed ten experiments to move the sensor forward 6 inches from a starting position with back crawler at the entrance to the air slot mockup in the lab. After motor control stopped the sensor movement, we measured the actual distance moved and calculated the percentage difference from the 6-inch target for sensor movement. The mean and standard deviation of the percentage difference between the target and the actual distance moved was 5.4 ± 3.9%. In all but one of the 10 real-time tracking experiments, the actual distance moved exceeded the target distance.
To illustrate the impact of this type of error distribution in real-time sensor tracking, we simulated data collection at ten sites if the actual distance traveled between sites was taken from our ten real-time 6-inch tracking experiments. Table 3 shows the position error at each simulated data collection site. The position error on sites 5–10 exceeds the tolerance of 1 inch (25.4 mm). Since the expected error in real-time tracking over a 6-inch distance is only 8.2 mm, this simulated failure of real-time sensor tracking is clearly due to the accumulation of errors from inadequate compensation for motor-control delay. This problem will be addressed in future research.

4. Conclusions

We have demonstrated consistent accuracy of offline video analysis for tracking sensor movement through straight sections of an air slot mockup in our laboratory. The 3-car RAVIS mockup constructed from the dimensions of the commercial RAVIS currently used for the NDE of double-shell tanks at Hanford did not have consistent forward motion as it navigated the turns in the bifurcated air slot channels. The inconsistent sensor motion as the crawlers change direction in response to force applied to the walls of the air slot increases the error of offline video analysis to predict the distance traveled between sites of data collection. Modifying the RAVIS mockup to enable smoother motion through turns in the air slots, without radical deviation from the commercial robots currently being tested for the NDE of DSTs at Hanford [6], is one of our goals for future research. Achieving this goal will allow us to more completely test real-time sensor tracking, which currently has been limited to targeted movement in the initial straight sections of the air slot mockup. The main focus of future research in real-time sensor tracking will be more effective motor control to avoid the accumulation of errors in repeated movement between sites of ultrasonic data collection.

Author Contributions

Conceptualization, C.M. and J.M.; methodology, J.P. and E.A.; software, J.P.; validation, J.P. and E.A.; formal analysis, J.P. and J.M.; investigation, J.P. and E.A.; resources and funding, C.M.; writing—original draft preparation, J.M. and J.P.; writing—review and editing, J.M. and J.P. All authors have read and agreed to the published version of the manuscript.

Funding

This research was funded by the Pacific Northwest National Laboratory, grant number 516084.

Data Availability Statement

The data presented in this study are available on request from the corresponding author.

Acknowledgments

The authors gratefully acknowledge assistance from Washington River Protection Solutions staff members who provided data on the structure of Hanford DSTs that enabled us to map the air slot network in relation to tank-bottom welds and the Pacific Northwest National Laboratory for the realistic air slot mockup provided to WSU-TC. This mockup enabled a demonstration of the validity and effectiveness of our proposed position-tracking techniques.

Conflicts of Interest

The authors declare no conflict of interest. The funders had no role in the design of the study; in the collection, analyses, or interpretation of data; in the writing of the manuscript; or in the decision to publish the results.

References

  1. Girardot, C.; Venetz, T.; Boomer, K.; Johnson, J. Hanford Single-Shell Tank and Double-Shell Tank Integrity Programs. In Proceedings of the Waste Management Symposium, Phoenix, AZ, USA, 6–10 March 2016. [Google Scholar]
  2. Denslow, K.; Glass, S.; Larche, M.; Boomer, K.; Gunter, J. Hanford Under-tank Inspection with Ultrasonic Volumetric Non-destructive Examination Technology. In Proceedings of the Waste Management Symposium, Phoenix, AZ, USA, 18–22 March 2018. [Google Scholar]
  3. Zhoa, J.; Durham, N.; Abdel-Hati, K.; McKenzie, C.; Thomson, D.J. Acoustic guided wave techniques for detecting corrosion damage of electric grounding rods. Measurement 2019, 147, 106858. [Google Scholar] [CrossRef]
  4. Borigo, C.; Love, F.; Owens, S.; Rose, J.L. Guided Wave Phased Array Technology for Rapid Inspection of Hanford Double Shell Tank Liners. In Proceedings of the ASNT Annual Conference, Nashville, TN, USA, 30 October–2 November 2017. [Google Scholar]
  5. Denslow, K.; Moran, T.; Larche, M.; Glass, S.; Boomer, K.; Kelly, S.; Wooley, T.; Gunter, J.; Rice, J.; Stewart, D.; et al. Progress on Advancing Robotic Ultrasonic Volumetric Inspection Technology for Hanford Under-tank Inspection. In Proceedings of the WM2019 Conference, Phenix, AZ, USA, 3–7 March 2019. [Google Scholar]
  6. Hede, A.; Wooley, T.; Boomer, K.; Gunter, J.; Soon, G.; Nelson, E.; Denslow, K. Hanford Double-Shell Primary Tank Bottom Inspection Technology Development. In Proceedings of the WM2022 Conference, Phenix, AZ, USA, 6–10 March 2022. [Google Scholar]
  7. Cree, C.; Cater, E.; Wang, H.; Mo, C.; Miller, J. Tracking Robot Location in Non-Destructive Evaluation of Double-Shell Tanks. Appl. Sci. 2020, 10, 7318. [Google Scholar] [CrossRef]
  8. Dobell, C.; Hamilton, G. Marsupial Miniature Robotic Crawler Development and Deployment in Nuclear Waste Double Shell Tank Refractory Air Slots. In Proceedings of the ASNT Annual Conference, Nashville, TN, USA, 30 October–2 November 2017. [Google Scholar]
  9. Mastafa, M.; Stancu, A.; Delanoue, N.; Codres, E. Guaranteed SLAM—An interval approach. Robot. Auton. Syst. 2018, 100, 160–170. [Google Scholar] [CrossRef]
  10. Abouzabir, A.; Elouardi, A.; Latif, R.; Bouaziz, S.; Tajer, A. Embedding SLAM algorithms: Has it come of age? Robot. Auton. Syst. 2018, 100, 14–26. [Google Scholar] [CrossRef]
  11. Rosebrock, A. Triangle Similarity for Object/Marker to Camera Distance. Available online: https://www.pyimagesearch.com/2015/01/19/find-distance-camera-objectmarker-using-python-opencv/ (accessed on 19 January 2015).
  12. Gunter, J.R. Primary Tank Bottom Visual Inspection System Development and Initial Deployment at Tank AP-107. RPP-RPT-61208, November 2018.
  13. Canny, J. A Computational Approach to Edge Detection. Technical Report 6. IEEE Trans. Pattern Anal. Mach. Intell. 1986, PAMI–8, 679–698. [Google Scholar] [CrossRef]
  14. Szeliski, R. Computer Vision: Algorithms and Applications; Springer: Berlin/Heidelberg, Germany, 2011. [Google Scholar]
  15. Lowe, D. Distinctive image features from scale-invariant keypoints. Int. J. Comput. Vis. 2004, 60, 91–110. Available online: https://docs.opencv.org/master/da/df5/tutorial_py_sift_intro.html (accessed on 10 July 2023). [CrossRef]
  16. Arandjelovic, R. Three things everyone should know to improve object retrieval. In Proceedings of the 2012 IEEE Conference on Computer Vision and Pattern Recognition (CVPR), CVPR ‘12, Washington, DC, USA, 16–21 June 2012; pp. 2911–2918. Available online: https://docs.opencv.org/3.4/d5/d6f/tutorial_feature_flann_matcher.html (accessed on 10 July 2023).
  17. Bradski, G. The OpenCV Library. Dr. Dobb J. Softw. Tools 2000, 120, 122–125. [Google Scholar]
Figure 1. Graphical user interface (GUI) display showing AP-type tank-bottom weld pattern (red lines) in relation to air slots (left). Video from a camera on the front crawler pulling the ultrasonic sensor through an air slot (top right). Data like that expected from the NDE of DSTs (bottom right). Black dot in the left panel illustrating the position of the sensor (not to scale).
Applsci 13 08708 g001
Figure 2. Mother bot inserting the mouse bot into an air slot in a mockup of primary tank at Pacific Northwest National Lab.
Applsci 13 08708 g002
Figure 3. A three-car robot, called RAVIS, used to move the ultrasonic sensor in the middle of the car through air slots.
Applsci 13 08708 g003
Figure 4. Analysis of video from front camera in visual inspection of an air slot. The red line shows a fit to points from the edge detection of the contact between the air slot wall and the tank bottom. Arrows show possible targets where apparent width of the top of the air slot will be calculated in the current and later frames.
Applsci 13 08708 g004
Figure 5. View from rear camera showing graph-paper-lined channel marked with points that are 50 mm apart on the top edges. Spot where the beam from a laser pointer attached to the camera hits the graph paper covering the channel entrance, which shows that the camera is off center toward the right-hand wall of the channel.
Applsci 13 08708 g005
Figure 6. Application of Python algorithms SIFT and FLAMM to match a target in frame 4100 with the same target in frame 4117. The red line connects the target as seen in the 2 frames.
Applsci 13 08708 g006
Figure 7. Video analysis of a 6-inch run starting from the entrance of air slot mockup. Data points show accumulation of short-distance measurements based on matching features at 5-frame intervals. Line shows a linear fit to data.
Applsci 13 08708 g007
Table 1. Example of a small change in distance per frame due to a mismatch not automatically detected.
Start FrameFinish Framemm Pre-Frame
470047201.0174
472047401.1418
474047591.7639
475947791.2402
477947990.9720
Table 2. Test of predictions of offline video analysis in a simulation of data collection in nondestructive double-shell tank evaluation.
run1run2run3run4run5Averagestd dev% ErrorTarget
FS156.24157.39158.74153.33152.64155.671.252.14152.40
FS168.24164.11149.27133.57161.88155.419.971.98152.40
FS138.26148.56132.07146.21158.72144.768.33−5.01152.40
FS166.71159.31137.48143.69146.13150.6615.20−1.14152.40
BS141.70152.52154.82143.27129.57144.387.01−5.26152.40
BS153.99144.12173.71166.41139.52155.5515.072.07152.40
BS142.88153.81177.22181.05163.22163.6417.547.37152.40
FT154.42149.22131.95143.16151.91146.1311.77−4.11152.40
FT194.58156.18174.24167.56182.45175.0019.2114.83152.40
FT88.4379.7876.9399.9477.0284.425.993.8681.28
BT126.13148.8992.18100.77130.03119.6028.54−21.52152.40
BT144.41160.74267.46241.84140.80191.0566.8325.36152.40
FW164.80152.61149.62167.20144.89155.828.042.25152.40
FW144.85135.50137.12156.97139.76142.845.00−6.27152.40
FW163.80154.26156.55156.66176.80161.614.986.05152.40
FW153.66144.39192.53239.20201.25186.2125.5422.18152.40
Total2403.112361.392461.882540.832396.582432.7650.492.772367.28
Table 3. Position error in simulated data collection using experimentally determined errors in real-time video tracking with motor control.
SitePosition Error (mm)
18.01
211.9
320.0
423.7
541.9
638.0
748.5
860.7
971.9
1082.1
Disclaimer/Publisher’s Note: The statements, opinions and data contained in all publications are solely those of the individual author(s) and contributor(s) and not of MDPI and/or the editor(s). MDPI and/or the editor(s) disclaim responsibility for any injury to people or property resulting from any ideas, methods, instructions or products referred to in the content.