Article

Improving Monocular Camera Localization for Video-Based Three-Dimensional Outer Ear Reconstruction Tasks

by
Mantas Tamulionis
,
Artūras Serackis
,
Kęstutis Bartnykas
,
Darius Miniotas
,
Šarūnas Mikučionis
,
Raimond Laptik
,
Andrius Ušinskas
and
Dalius Matuzevičius
*
Department of Electronic Systems, Vilnius Gediminas Technical University (VILNIUS TECH), 10223 Vilnius, Lithuania
*
Author to whom correspondence should be addressed.
Appl. Sci. 2023, 13(15), 8712; https://doi.org/10.3390/app13158712
Submission received: 29 June 2023 / Revised: 22 July 2023 / Accepted: 26 July 2023 / Published: 28 July 2023
(This article belongs to the Special Issue User Experience in Virtual Environments)

Abstract

:
This work addresses challenges related to camera 3D localization while reconstructing a 3D model of an ear. This work explores the potential solution of using a cap, specifically designed not to obstruct the ear, and its efficiency in enhancing the camera localization for structure-from-motion (SfM)-based object reconstruction. The proposed solution is described, and an elaboration of the experimental scenarios used to investigate the background textures is provided; data collection and software tools used in the research are reported. The results show that the proposed method is effective, and using the cap with texture leads to a reduction in the camera localization error. Errors in the 3D location reconstruction of the camera were calculated by comparing cameras localized within typical ear reconstruction situations to those of higher-accuracy reconstructions. The findings also show that caps with sparse dot patterns and a regular knitted patterned winter hat are the preferred patterns. The study provides a contribution to the field of 3D modeling, particularly in the context of creating 3D models of the human ear, and offers a step towards more accurate, reliable, and feasible 3D ear modeling and reconstruction.

1. Introduction

After the sound wave reaches the listener, the size and shape of the ear changes the spectrum of sound reaching the eardrum. These spectral distortions act as a unique feature of the human body to help us understand the location of the sound source. This phenomenon is called the head-related transfer function (HRTF)—a response describing how we receive sound waves from different points in space. Other parts of the human body such as the head, shoulders, and torso also change the sound spectrum, but only frequencies up to 3 kHz are affected in this way. Frequencies above 3 kHz are shaped by the individual anatomy of the external ear [1]. Hair can also affect the HRTF spectrum, especially at high frequencies, but studies have shown that this should not affect the user’s ability to accurately localize a sound source [2].
The pinna is one of the most individual parts of the human body, even variations of a few millimeters in its geometry have a strong effect on the HRTF filter [3]. When analyzing the entire human population, different pinna shapes result in changes of up to 20 dB in the HRTF spectrum above 4 kHz [4]. However, it has been shown that not all parts of the pinna are equally important for the HRTF spectrum. The cavum conchae, fossa triangularis, and scapha have the greatest influence, while the posterior half of the helix changes the spectrum the least [5].
There are two main factors that allow a human listener to locate a sound source. These are the interaural time difference (ITD) and the interaural level difference (ILD). An ITD occurs when the sound source is at a different distance from the two ears. Studies show that humans can detect ITDs as small as 10 µs, which corresponds to differences in distance of about 0.3 mm [6]. The ILD is the result of the acoustic shadow created by the head, which acts as a barrier to high frequencies. For example, a wavelength of 2000 Hz is shorter than the distance between human ears. Below 2000 Hz, ILD becomes ineffective because the lower frequencies are able to bypass the detected obstacle [7].
The spatial resolution of an HRTF is determined by the number of positions of the sound source distributed over the surface of the virtual sphere in a certain interval of degrees. It has been shown that this resolution may not be the same for sounds coming from the front and from the side. The minimum audible angle (MAA) is the smallest angular deviation perceptible to a person; on the horizontal axis, it is 1 degree for frontal sounds and proportionally increases to 10 degrees for lateral sounds. On the vertical axis, a person feels a change in frontal sounds from 4 degrees, and for sounds coming from the side, the MAA increases up to 20 degrees [8].
Individual HRTFs are important for improving the user experience in virtual reality. Only by using it can a person hear the virtual sound through headphones exactly as they would hear the sound if the source existed in the natural environment. Use cases range from entertainment games to assistive systems for the blind. The user can be navigated by voice, giving them the right direction and eliminating the need to look at a map [9]. Online work meetings that have become popular during the COVID-19 pandemic could be more realistic, with participants hearing immersive virtual acoustics. Everyone who joined the conference could sit in a different part of the virtual room and hear the information being said by the other participants from the side corresponding to their position.
Most of the virtual reality products available today still use a common HRTF, which is the average of several measured subjects, but averaging over individuals does not produce good perceptual results [10]. Virtual source localization experiments have shown that the use of a common HRTF has a very high possibility of up–down and front–back confusion, while the use of an individual HRTF significantly reduces the occurrence of this effect [11].
One way to obtain a personalized HRTF is through binaural acoustic measurements, where microphones are inserted into the subject’s ear canal and a large number of sound sources are placed in a semicircle around the human head at different elevation angles, but maintaining the same radius. The subject is seated in an automated rotating chair and measurements are taken each time the chair is repositioned at a fixed azimuth [12]. Such measurements are difficult and available only for scientific purposes, requiring expensive equipment, an anechoic room, and expertise. Although there have been attempts to simplify this process to one that could be performed at home using only a single speaker and a head tracking system [13], or using a smartphone by moving it around the head, storing the phone’s position in space, and recording the test signal played by the phone with microphones built into headphones [14].
Researchers are constantly looking for ways to easily obtain as close to an individual HRTF as possible without complicated measurement procedures. There are suggestions to select the most appropriate HRTF from the ones available by analyzing the anthropometric data of the subject whose personalized HRTF we are looking for and identifying the most similar object in the selected database [15,16]. Another way to select the HRTF matcher is to classify the anthropometric data of the database objects into clusters, highlight the centers of these clusters, identify which cluster best fits the subject’s ear, and select the central HRTF of that cluster as the subject’s individual HRTF [17].
In addition to acoustic measurements and the most similar HRTF fitting methods, numerical calculations are also possible when trying to calculate the expected HRTF spectrum by analyzing how sound waves of different frequencies will reach the eardrum point geometrically from all possible directions. For such algorithms, it is necessary to provide an accurate 3D model of the head and ears. The mesh can be created in many ways—the head can be laser scanned [18] or it can be reconstructed photogrammetrically [19,20]. With an accurate 3D model, we can calculate a human-customized HRTF filter; researchers have developed tools for this task [21]. An HRTF filter can also be computed using deep neural networks (DNNs) with anthropometric measurements and ear images [22] or sound source directions [23] as input. DNN can also be used to detect an ear in an image and automatically label the points that define its shape [24,25,26,27,28,29].
Image-based reconstruction and modeling of objects [30,31,32], scenes [33,34,35,36,37,38], or processes [39,40], is a widely available and relatively inexpensive technique for information acquisition [41,42,43]. One of the photogrammetric methods is the structure-from-motion (SfM) technique [44,45,46]. This provides a noninvasive, cost-effective means of creating three-dimensional models of objects and environments from sets of two-dimensional images [47,48,49,50,51]. The SfM approach works by first estimating camera positions and then progressively reconstructing the 3D coordinates of the points in the scene [52,53,54]. SfM is highly valuable in the sense that it allows for the reconstruction of 3D structures using images taken from hand-held cameras [55,56,57,58,59]. However, the accuracy of SfM is intrinsically linked to the quality of the input images and the precision of camera localization [60,61,62].
Deep neural networks have been used to implement SfM tasks that include feature detection, matching, and outlier rejection [63,64,65,66,67]. Deep learning can automatically learn feature representations and mapping functions from large volumes of data, which has been shown to improve the robustness and accuracy of SfM [68,69,70]. Deep learning has also been combined with traditional SfM techniques to create hybrid models, which can take advantage of the strengths of both approaches [71,72]. Deep neural networks can be used for monocular depth and camera motion estimation to regress the camera pose [73,74,75].
An essential factor in the success and precision of object 3D reconstruction is the accurate localization of the camera in a three-dimensional space [76]. As the SfM technique depends on determining the three-dimensional structure of a scene from a series of two-dimensional images taken from different viewpoints, accurately determining the camera’s spatial position and orientation at each viewpoint is paramount [41,77]. Inaccuracies in camera 3D localization can lead to errors in the derived depth information, the resulting three-dimensional reconstruction, and any subsequent analyses [78]. Such errors can propagate and magnify, ultimately undermining the fidelity of the reconstructed model. This can, in turn, adversely impact the usability of the ear’s 3D model to derive precise HRTF.
This work addresses challenges related to camera 3D localization while reconstructing an ear’s 3D model. Efforts are put towards developing and refining methodology that enhances the precision of camera 3D localization. This will pave the way for more accurate, reliable, and robust 3D reconstruction of the ear.
The novelty and contributions of this work can be summarized as follows:
  • Proposed a simple solution for the improvement of camera 3D localization for the ear 3D reconstruction tasks. The proposed solution is based on enriching the background texture.
  • Presented a dataset construction approach for the evaluation of camera 3D localization.
  • Performed comparative evaluation of different cap textures’ influence on the precision of camera 3D localization.
  • Presented comparative results of camera 3D localization improvement solutions; the results show that the proposed method is effective and using a cap with texture allows a reduction in camera localization error. The results also show that caps with sparse dot patterns and a regular knitted patterned winter hat are the preferred patterns.
The problem of and proposed solution for camera 3D localization improvement is summarized in Figure 1.
The outline of the paper is as follows. In Materials and Methods (Section 2), the proposed solution for improving camera 3D localization via enhancing the background texture around the ear is described; an elaboration of the experimental scenarios used to investigate the background textures is provided; the data collection and software tools used in the research are reported. Results (Section 3) gives experimental comparison results of the background enhancement approaches using various caps and the overall usefulness of the solution and provides an interpretation of the findings and practical implications. Finally, Section 4 gives the conclusions of this work.

2. Materials and Methods

Three-dimensional reconstruction of an object, an ear in our case, by leveraging a dataset of photographs and applying the structure-from-motion (SfM) technique, requires a precise computation of camera positions.
SfM generates 3D reconstructions of an object or a scene from a series of 2D images, taken from different viewpoints. The process also estimates the camera’s position and orientation for each of the images. The overall SfM pipeline consists of several steps: feature extraction; feature matching; camera motion estimation; dense point cloud generation; mesh generation; and texturing.
The key mathematical concepts underlying SfM are projective geometry and optimization. The relationship between the 3D point and its 2D projection on an image can be expressed using homogeneous coordinates and the camera projection matrix. The purpose of the optimization process is to find the 3D structure and camera parameters that best explain the observed 2D image points. This is usually formulated as a non-linear least-squares problem.
Performing photogrammetry using the SfM technique for the reconstruction of the ear requires a sequence of actions that must be carried out. First, capturing the ear from various angles is a necessary step. This step provides a comprehensive set of images necessary for the reconstruction process. Second, the removal of the background in the images. The background is unsuitable for the reconstruction process due to the head movements relative to the background during the capture process. An unfixed background can lead to inaccurate results in the reconstruction process. Third, calculating camera positions in 3D space is an essential process. These positions can be determined by associating feature points within the head region across different frames. However, a notable problem arises in the side area of the head—the texture is not rich, therefore, it is difficult to extract a sufficient number of distinctive feature points that can be accurately matched across the frames.
In this research, we propose augmenting the side region of the head with a suitable texture for the reconstruction process. This research explores the potential solution of using a cap and its efficiency in enhancing the camera 3D localization for SfM-based object reconstruction.

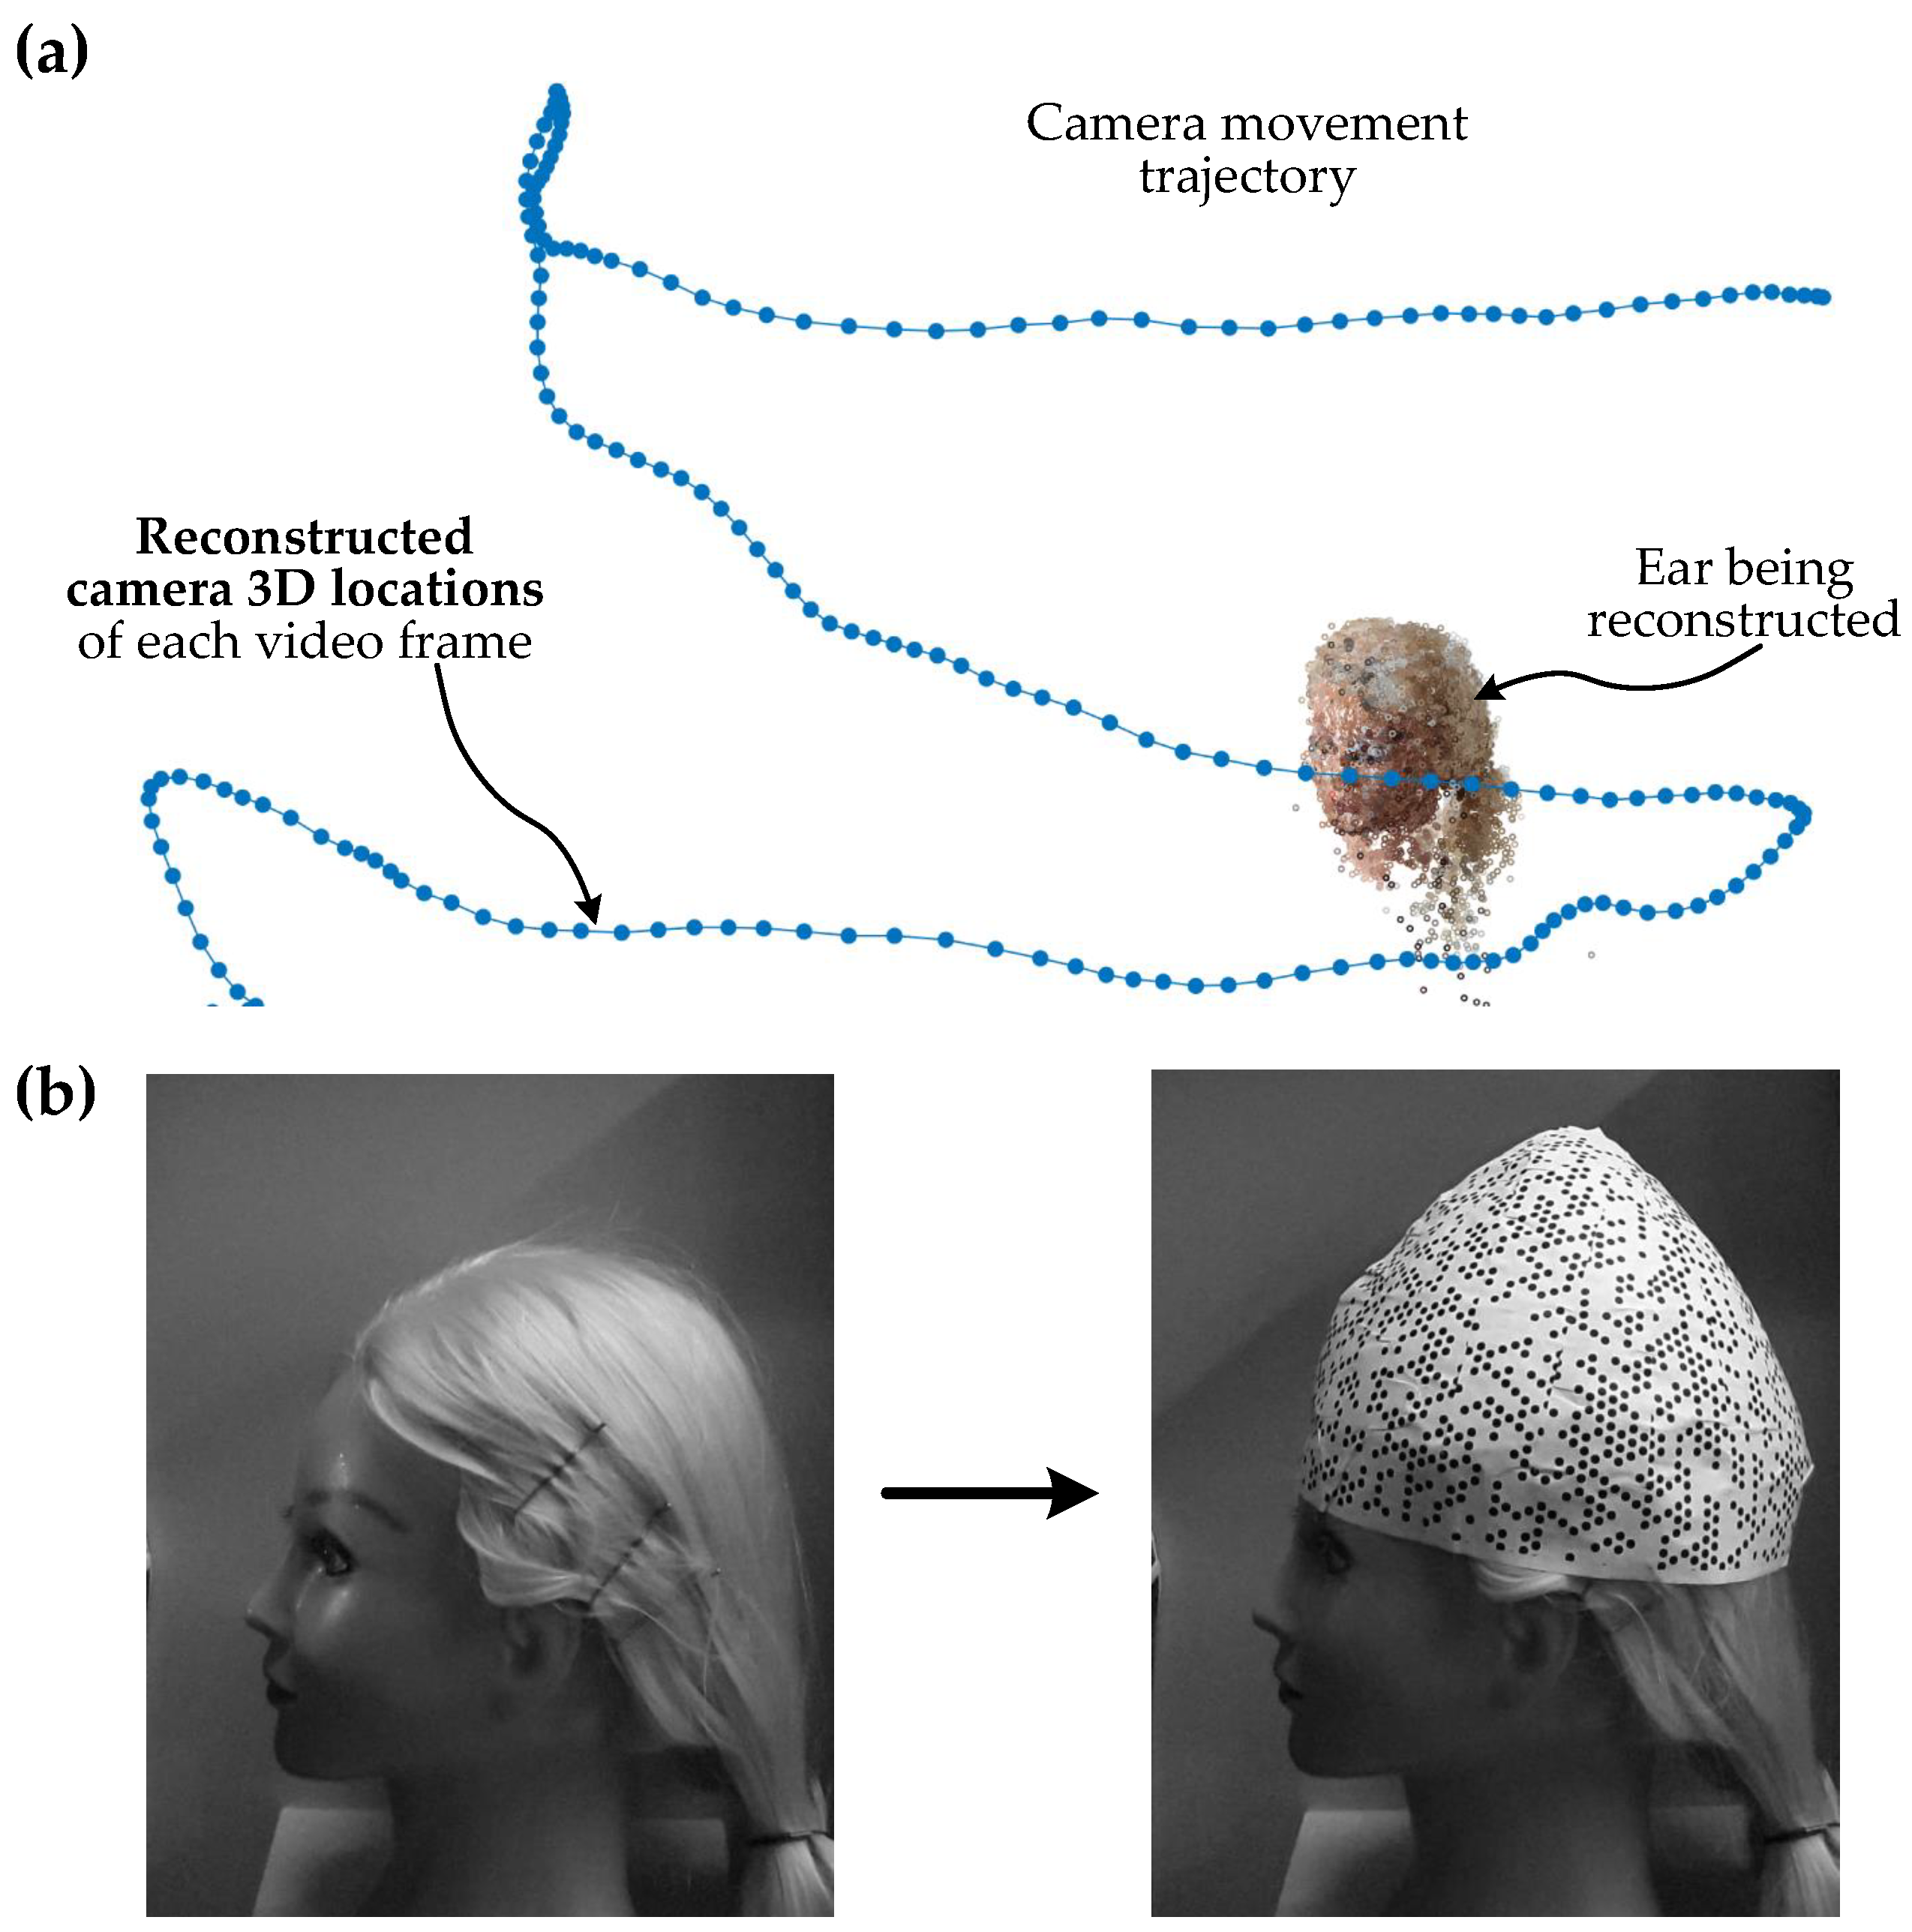
2.1. Improvement of Camera 3D Localization

The primary source of camera 3D localization inaccuracies is the scarcity of texture on the side of the head, which leads to the lack of unique feature points that can be tracked in the image set.
The solution we are investigating is aimed at improving texture in the background of images of the ear in a such way that the background would be fixed relative to the ear. There are several requirements for the approach: (1) the simplicity of implementation, (2) actual improvement in the 3D localization of cameras, and (3) an additional advantage would be if it would help to reconstruct the metric scale of the scene.
The most convenient solution to add texture to the face, without obstructing the portion under reconstruction (the ear), is to place a cap with an appropriate texture on the head, ensuring that it does not cover the ear. This brings us to the research questions we seek to answer in this study: what type of texture is best suited for this purpose, and does the placement of such a cap indeed improve camera localization. To answer these questions, 13 textures cases were designed and investigated as separate experimental scenarios. These experimental scenarios are depicted in Figure 2 and summarized in Section 2.2.

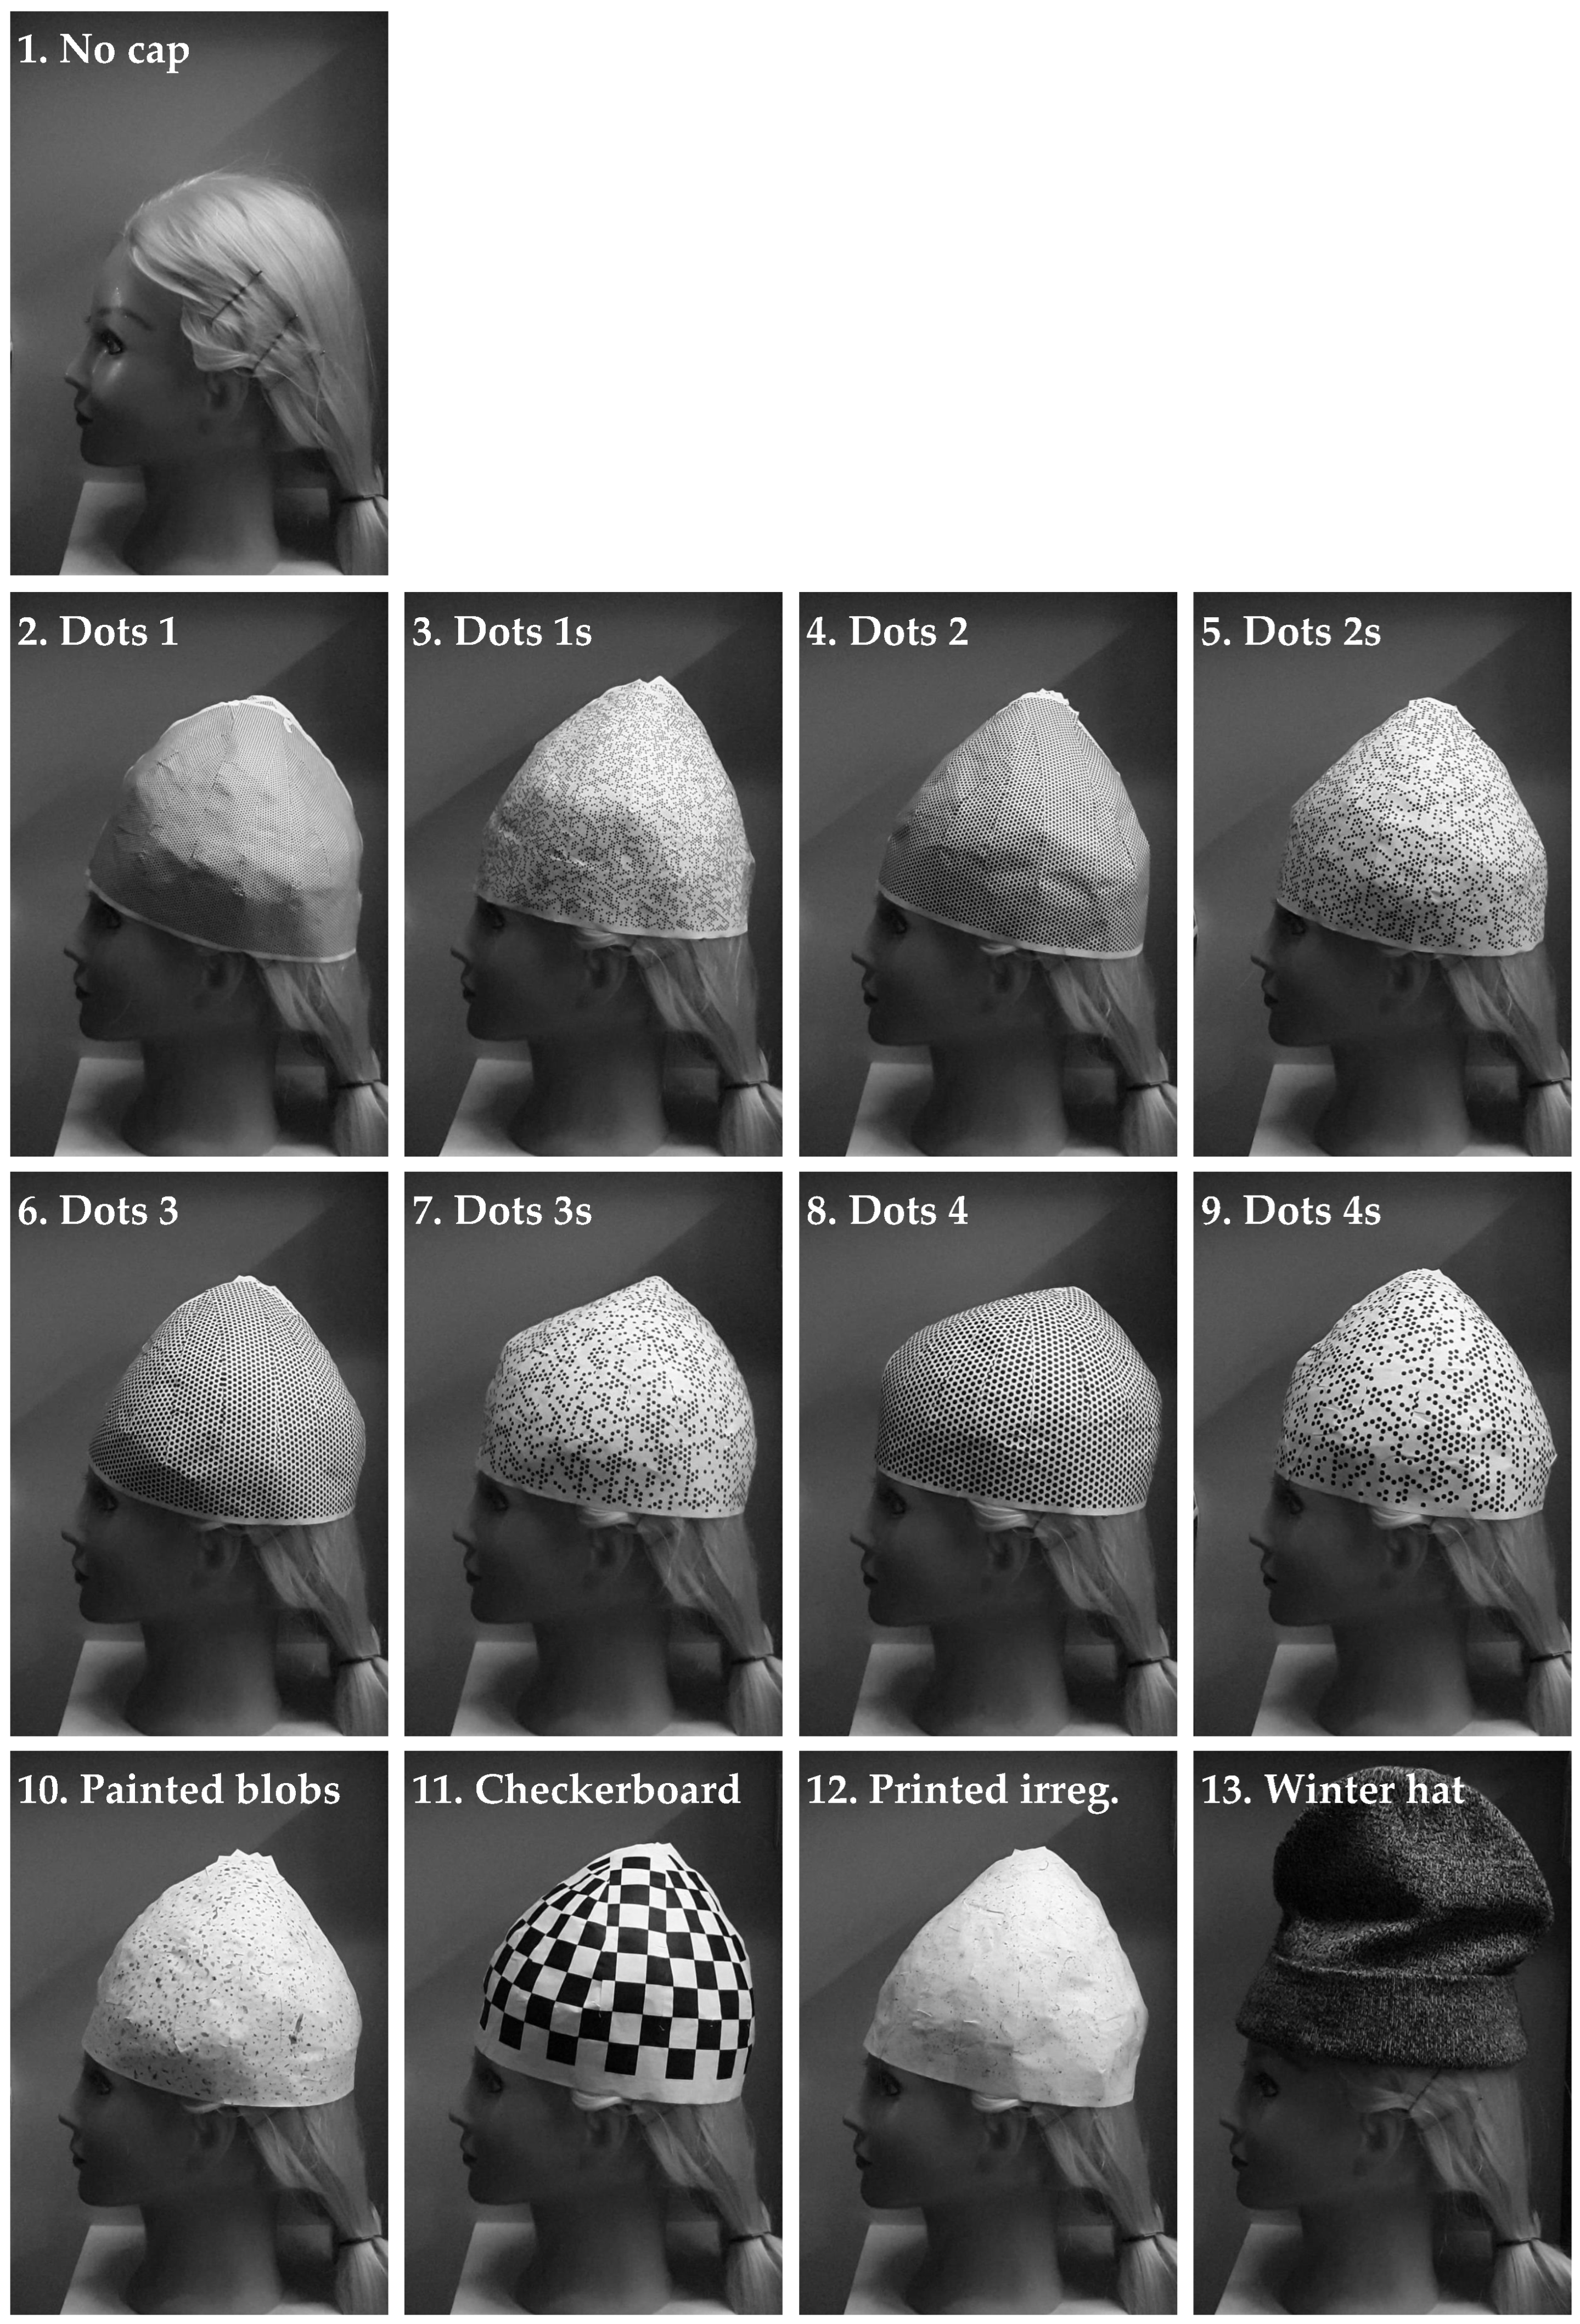
2.2. Experimental Scenarios

The experimental scenarios were carefully designed to investigate the usefulness of the proposed solution to enhance the background texture around the ear using a cap. To evaluate the potential benefits of wearing a cap, scenarios both with and without a cap were set up. To compare the usefulness of different textures on the caps, 12 additional scenarios were tested, each with a distinct cap texture. These different setups allowed for a comprehensive analysis of the influence of the cap texture on the enhancement of the background texture around the ear, which is an important factor for accurate 3D localization of cameras.
The experimental scenarios (cases) for the investigation of the effect of cap usage on camera 3D localization accuracy (refer to Figure 2) were as follows:
  • No cap—regular case of image collection for ear reconstruction;
  • Dots 1—regularly arranged dot pattern of the 1st size;
  • Dots 1s—sparse dot pattern of the 1st size;
  • Dots 2—regularly arranged dot pattern of the 2nd size;
  • Dots 2s—sparse dot pattern of the 2nd size;
  • Dots 3—regularly arranged dot pattern of the 3rd size;
  • Dots 3s—sparse dot pattern of the 3rd size;
  • Dots 4—regularly arranged dot pattern of the 4th size;
  • Dots 4s—sparse dot pattern of the 4th size;
  • Painted blobs—pattern of randomly painted blobs of different sizes;
  • Checkerboard—a well-known pattern used for camera calibration;
  • Printed irreg.—printed pattern of irregularly scattered small dots;
  • Winter hat—a regular knitted patterned winter hat.

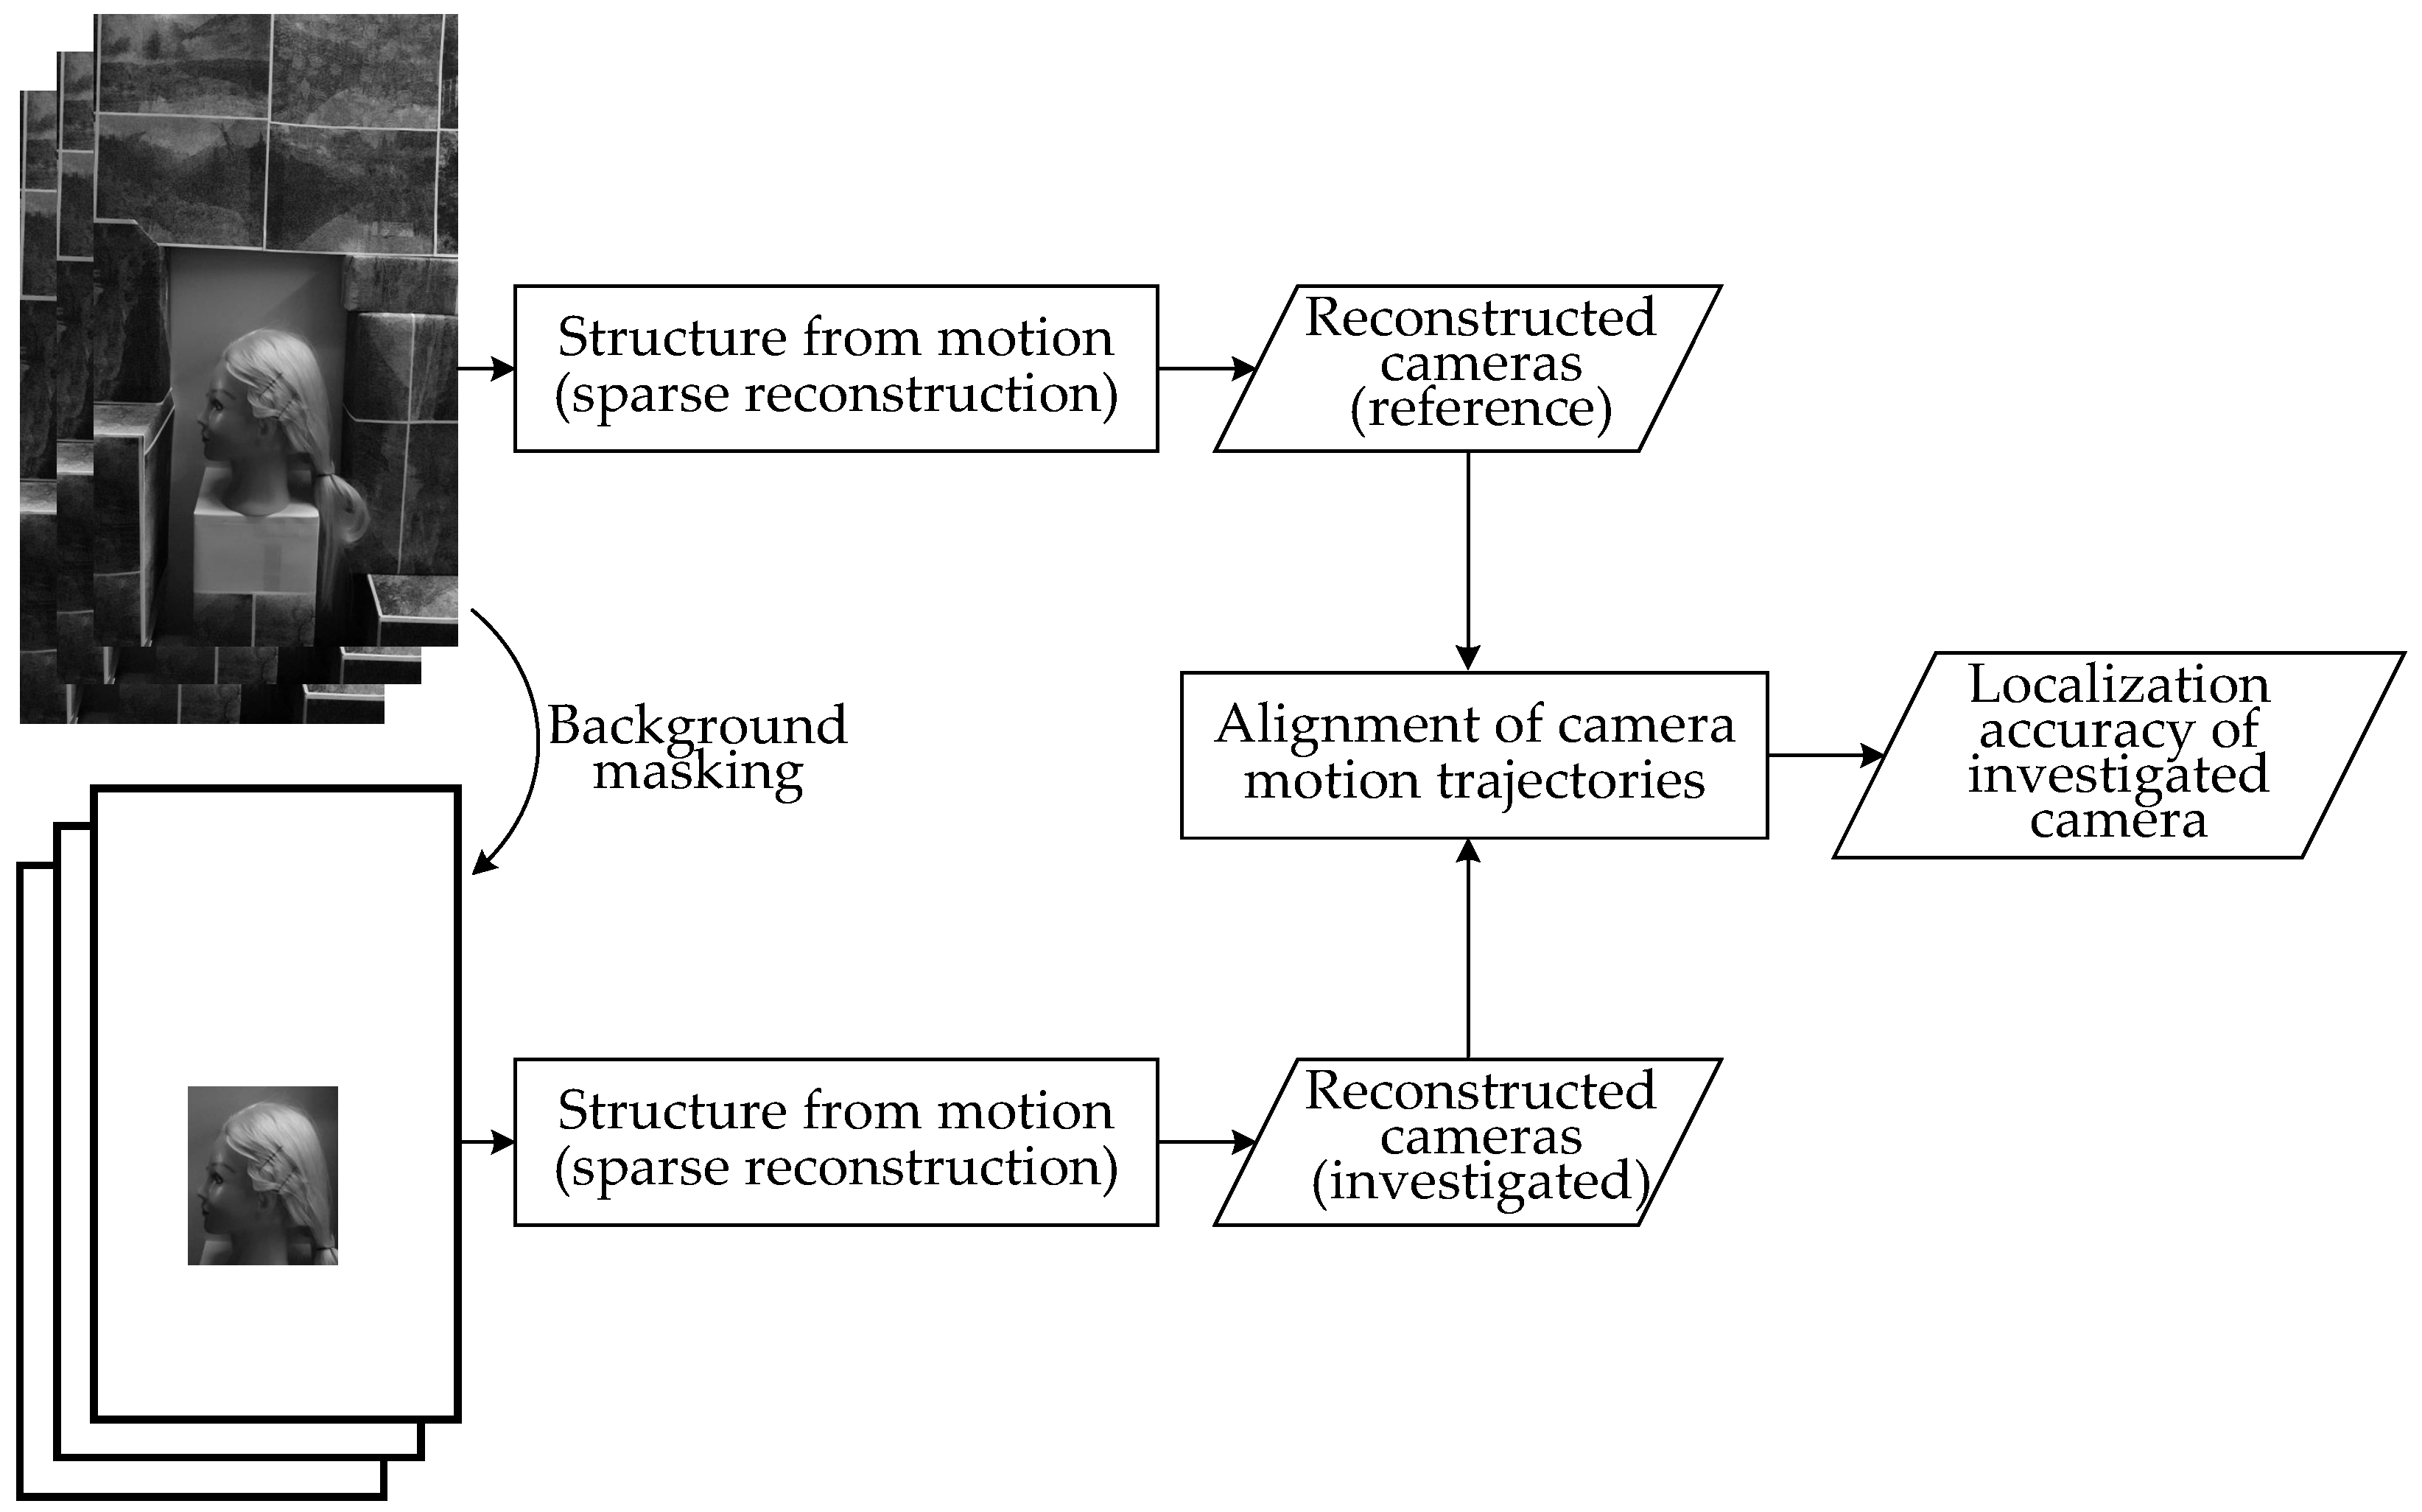
2.3. Camera Localization Quality Evaluation

The effects of cap usage on the accuracy of camera 3D localization were evaluated and compared across various experimental scenarios. Errors in the 3D location reconstruction of the camera were calculated by comparing camera localizations within typical ear reconstruction situations to those of higher accuracy. Figure 3 presents the experimental setup used to assess the precision of the camera reconstruction. The upper branch is dedicated to the calculation of high-accuracy camera localizations, while the lower branch illustrates a typical ear reconstruction situation. In a standard ear reconstruction scenario, the background around the head in the image would be removed because it is typically non-static and unsuitable for the photogrammetric reconstruction of the ear.
High-accuracy camera localization is achieved by taking advantage of a specially created background with a rich texture placed behind the mannequin’s head. This background is not only texturally rich, but also non-flat. To simulate images that would be acquired for reconstruction of the ears, the surrounding background of the head in the images was masked. The position of the head in the image sequence was tracked and the same bounding box (BBox) of the head was transferred between all images in the set.
Camera localization was performed using the Meshroom software and the structure-from-motion algorithm for sparse reconstruction. Sparse reconstruction was performed for both initial and masked images. The 3D locations of the reconstructed cameras were aligned by a 3D similarity transformation, comprising translation, rotation, and scaling. This research did not involve reconstruction of the absolute scale of the model. To estimate the absolute scale, additional information is required [79]. Scale differences were eliminated during the alignment of the 3D locations of the reconstructed cameras in the test cases to the 3D locations of the reference camera. Therefore, the comparative evaluation of the cap usage scenarios does not require scale information.
After aligning the locations of the camera sets, the Euclidean distances between the locations were computed. The median of these distances was used as an error metric for camera 3D localization within a specific cap type and experimental setup scenario (camera distance and camera motion trajectory).

2.4. Software Used

The software tools and programming languages used in this research are as follows:
  • MATLAB programming and numeric computing platform (version R2022a, The Mathworks Inc., Natick, MA, USA) for the implementation of the introduced improvements to the baseline reconstruction algorithm by integrating with AliceVision/Meshroom; MATLAB was also used for data analysis and visualization;
  • Meshroom (version 2021.1.0) (https://alicevision.org accessed on 15 September 2022) [80], 3D reconstruction software based on the AliceVision photogrammetric computer vision framework. Used for the execution of the SfM reconstruction algorithms;

2.5. Setup and Data Collection

The study involved the collection of an image dataset designed specifically for the experimental evaluation of the proposed solutions aimed at enhancing camera 3D localization. This dataset was acquired through the recording of videos and extracting frames. A total of four different experimental setups were implemented, each consisting of 13 experimental cases (scenarios).
The four experimental setups differed in the distances between the camera and a mannequin head, along with variations in the radius of the camera’s circular motion trajectory. After setting the distance from the camera to the mannequin’s head, the radius of the camera’s trajectory was tuned so that the head of the mannequin would never go outside of the frame while the camera was moving. The 13 experimental cases (scenarios) consisted of cases involving the presence of different caps or the absence of a cap on the mannequin’s head (summary in Section 2.2).
The precision of the reconstructed 3D locations of the reference camera was increased by specially creating a background. A background image has to have a rich pattern, which is favored by the photogrammetry algorithms. The background was added in such a way that later it could be completely masked using image processing steps after detecting the head’s bounding box (BBox). An image of the mannequin’s head without a background was used to perform 3D localization of the cases under investigation.
The videos were acquired using the smartphone Samsung Galaxy S10+ standard camera app. For the comparative evaluation of the proposed solutions (head caps), 195 videos were taken. The acquisition conditions can be grouped into four experimental setups: videos were recorded at four different distances and slightly different camera motion trajectories. The capture conditions of the same experimental setup were kept as homogeneous as possible: fixed orientation of the smartphone, lighting conditions, artificial background, frame rate of 24 frames/s, frame size of  3840 × 2160  pixels, ISO 800, shutter speed 1/350, F1.5, average length of the videos  17.2 ± 2.6  s. The movement pattern of the phone while capturing was the same for all videos—a circle, the radius of which changed between the four experimental setups. The motion of the camera in a circular or near circular trajectory was established with the help of a device which allowed repeating the same camera motion trajectory while changing experimental cases.

3. Results and Discussion

In this research, we addressed the problem of camera 3D localization for tasks involving the reconstruction of a 3D model of the ear. We proposed a simple solution to improve the accuracy of 3D camera localization based on enriching the background texture—specifically, using a hat with a particular pattern.
To ascertain the effectiveness of this ’hat’ solution and compare how different patterns might enhance camera localization accuracy, we generated a specific dataset to test these hypotheses. We performed a comparative evaluation of the influence of different cap textures on the precision of 3D camera localization and presented the comparative results of solutions to improve camera 3D localization in Figure 4.
The results of the experimental comparison presented in Figure 4 comprise a comparison of 13 experimental scenarios (cases). The first column (block of data points) in the chart presents the results of the baseline case when no cap was used. The subsequent columns display the results of scenarios when different caps were used. The experimental scenarios are depicted in Figure 2 and summarized in Section 2.2. The camera 3D localization accuracy was evaluated in different experimental cases (the evaluation method is described in Section 2.3), and the errors are graphed in Figure 4.
The data for evaluation were collected in four different experimental setups (as described in Section 2.5); therefore, the results are grouped in Figure 4, and the color along with the marker type denotes the particular experimental setup. Each data point corresponds to a separate experiment. The data points are arranged in four virtual columns, and the fifth column shows the summary statistics using a box plot that incorporates all the data points from the first four columns.
The main conclusion drawn from the results presented in Figure 4 is that the use of a hat reduces camera localization errors—errors in the first data block (“no cap” experimental case) are the highest.
We observed that some reconstruction experiments were unsuccessful (the photogrammetry pipeline failed to reconstruct the sparse scene). These failures are summarized and presented as bar charts beneath the horizontal axis. The height of the bar indicates the percentage of failed reconstructions. The “dots 4” (regularly arranged dot pattern of the fourth size dots), “dots 3”, “checkerboard”, “no cap”, and “dots 1” cases included failed reconstructions.
The lowest reconstruction errors and all successful camera 3D location reconstructions were achieved using a regular knitted patterned winter hat (“winter hat” case), caps with sparse dot patterns (“dots 1s”, “dots 4s”, “dots 3s”, “dots 2s”), and a hat with a pattern of randomly painted blobs of different sizes (“painted blobs”). All the hats with sparse-dotted patterns performed well regardless of the pattern’s dot size. Caps with a printed dot pattern offer the greatest potential to aid in the reconstruction of the scale of the 3D ear model. However, the weakness of the “painted blobs” hat is that it was painted manually.
The results demonstrate that the proposed method is effective and that the use of a cap with texture reduces camera localization error. The findings also suggest that caps with sparse dot patterns and a regular knitted patterned winter hat are the preferred patterns.

4. Conclusions

This study provides a contribution to the field of 3D reconstruction, particularly in the context of creating a 3D model of the human ear. Our research shows that using a cap, specially designed not to cover the ear, is a straightforward and efficient solution to improve camera localization in this task.
The effectiveness of this approach comes from the enrichment of the background in the image of the ear. The fixed relationship between the cap and the ear prevents independent movement of the background and usage of an appropriate cap ensures that the ear remains visible.
The 3D camera localization accuracy was evaluated in 13 experimental scenarios—12 different caps and no cap. The experimental results show that the use of a cap with texture reduces camera localization errors. In some cases, performing sparse reconstruction without the cap is impossible, i.e., the structure-from-motion (SfM) algorithm from Meshroom fails to determine the camera positions and to reconstruct the scene. Our experiments demonstrate that the use of caps can alleviate this issue by aiding in the determination of camera positions. The results demonstrate that caps with sparse dot patterns and a regular knitted patterned winter hat are the preferred patterns.
Furthermore, a cap with the appropriate texture could also be useful for reconstruction of the metric scale of the object. This is crucial when metric measurements are required. Further experiments can be carried out to compare cap patterns for reconstruction of the metric scale of the ear.

Author Contributions

Conceptualization and methodology, all authors; software, M.T., R.L. and D.M. (Dalius Matuzevičius); validation, Š.M. and R.L.; formal analysis, M.T. and A.S.; investigation, M.T., K.B., D.M. (Darius Miniotas) and Š.M.; resources, A.S. and D.M. (Dalius Matuzevičius); data curation, M.T., A.U. and D.M. (Dalius Matuzevičius); writing—original draft preparation, M.T., K.B. and D.M. (Darius Miniotas); writing—review, editing, all authors; visualization, M.T., R.L. and D.M. (Dalius Matuzevičius); supervision, D.M. (Dalius Matuzevičius) and A.S.; project administration, A.S. and D.M. (Dalius Matuzevičius). All authors have read and agreed to the published version of the manuscript.

Funding

This research received no external funding.

Institutional Review Board Statement

Not applicable.

Informed Consent Statement

Not applicable.

Data Availability Statement

The data presented in this study are available upon request from the corresponding author.

Conflicts of Interest

The authors declare no conflict of interest.

Abbreviations

The following abbreviations are used in this manuscript:
SfMStructure-from-motion
HRTFHead-related transfer function
ITDInteraural time difference
ILDInteraural level difference
DNNDeep neural network
MAAMinimum audible angle
BBoxBounding box

References

  1. Algazi, V.R.; Avendano, C.; Duda, R.O. Elevation localization and head-related transfer function analysis at low frequencies. J. Acoust. Soc. Am. 2001, 109, 1110–1122. [Google Scholar] [CrossRef]
  2. Brinkmann, F.; Dinakaran, M.; Pelzer, R.; Grosche, P.; Voss, D.; Weinzierl, S. A cross-evaluated database of measured and simulated HRTFs including 3D head meshes, anthropometric features, and headphone impulse responses. J. Audio Eng. Soc. 2019, 67, 705–718. [Google Scholar] [CrossRef]
  3. Ziegelwanger, H.; Reichinger, A.; Majdak, P. Calculation of listener-specific head-related transfer functions: Effect of mesh quality. In Proceedings of the Meetings on Acoustics ICA2013, Montreal, QC, Canada, 2–7 June 2013; Volume 19, p. 050017. [Google Scholar]
  4. Møller, H.; Sørensen, M.F.; Hammershøi, D.; Jensen, C.B. Head-related transfer functions of human subjects. J. Audio Eng. Soc. 1995, 43, 300–321. [Google Scholar]
  5. Stitt, P.; Katz, B.F. Sensitivity analysis of pinna morphology on head-related transfer functions simulated via a parametric pinna model. J. Acoust. Soc. Am. 2021, 149, 2559–2572. [Google Scholar] [CrossRef] [PubMed]
  6. Thavam, S.; Dietz, M. Smallest perceivable interaural time differences. J. Acoust. Soc. Am. 2019, 145, 458–468. [Google Scholar] [CrossRef]
  7. Pollack, K.; Majdak, P.; Kreuzer, W. Modern acquisition of personalised head-related transfer functions: An overview. In Advances in Fundamental and Applied Research on Spatial Audio; BoD—Books on Demand: Norderstedt, Germany, 2022. [Google Scholar]
  8. Aggius-Vella, E.; Kolarik, A.J.; Gori, M.; Cirstea, S.; Campus, C.; Moore, B.C.; Pardhan, S. Comparison of auditory spatial bisection and minimum audible angle in front, lateral, and back space. Sci. Rep. 2020, 10, 6279. [Google Scholar] [CrossRef] [Green Version]
  9. Wilson, J.; Walker, B.N.; Lindsay, J.; Cambias, C.; Dellaert, F. Swan: System for wearable audio navigation. In Proceedings of the 2007 11th IEEE International Symposium on Wearable Computers, Boston, MA, USA, 11–13 October 2007; pp. 91–98. [Google Scholar]
  10. Guezenoc, C.; Seguier, R. HRTF individualization: A survey. arXiv 2020, arXiv:2003.06183. [Google Scholar]
  11. Wenzel, E.M.; Arruda, M.; Kistler, D.J.; Wightman, F.L. Localization using nonindividualized head-related transfer functions. J. Acoust. Soc. Am. 1993, 94, 111–123. [Google Scholar] [CrossRef]
  12. Yu, G.; Wu, R.; Liu, Y.; Xie, B. Near-field head-related transfer-function measurement and database of human subjects. J. Acoust. Soc. Am. 2018, 143, EL194–EL198. [Google Scholar] [CrossRef]
  13. Reijniers, J.; Partoens, B.; Steckel, J.; Peremans, H. HRTF measurement by means of unsupervised head movements with respect to a single fixed speaker. IEEE Access 2020, 8, 92287–92300. [Google Scholar] [CrossRef]
  14. Yang, Z.; Choudhury, R.R. Personalizing head related transfer functions for earables. In Proceedings of the 2021 ACM SIGCOMM 2021 Conference, Virtual Event, 23–27 August 2021; pp. 137–150. [Google Scholar]
  15. Zotkin, D.; Hwang, J.; Duraiswaini, R.; Davis, L.S. HRTF personalization using anthropometric measurements. In Proceedings of the 2003 IEEE Workshop on Applications of Signal Processing to Audio and Acoustics (IEEE Cat. No. 03TH8684), New Paltz, NY, USA, 19–22 October 2003; pp. 157–160. [Google Scholar]
  16. Lu, D.; Zeng, X.; Guo, X.; Wang, H. Personalization of head-related transfer function based on sparse principle component analysis and sparse representation of 3D anthropometric parameters. Acoust. Aust. 2020, 48, 49–58. [Google Scholar] [CrossRef]
  17. Guo, Z.; Lu, Y.; Zhou, H.; Li, Z.; Fan, Y.; Yu, G. Anthropometric-based clustering of pinnae and its application in personalizing HRTFs. Int. J. Ind. Ergon. 2021, 81, 103076. [Google Scholar] [CrossRef]
  18. Dinakaran, M.; Brinkmann, F.; Harder, S.; Pelzer, R.; Grosche, P.; Paulsen, R.R.; Weinzierl, S. Perceptually motivated analysis of numerically simulated head-related transfer functions generated by various 3D surface scanning systems. In Proceedings of the 2018 IEEE International Conference on Acoustics, Speech and Signal Processing (ICASSP), Calgary, AB, Canada, 15–20 April 2018; pp. 551–555. [Google Scholar]
  19. Dellepiane, M.; Pietroni, N.; Tsingos, N.; Asselot, M.; Scopigno, R. Reconstructing head models from photographs for individualized 3D-audio processing. In Proceedings of the Computer Graphics Forum; Blackwell Publishing Ltd.: Oxford, UK, 2008; Volume 27, pp. 1719–1727. [Google Scholar]
  20. Trojnacki, M.; Dąbek, P.; Jaroszek, P. Analysis of the Influence of the Geometrical Parameters of the Body Scanner on the Accuracy of Reconstruction of the Human Figure Using the Photogrammetry Technique. Sensors 2022, 22, 9181. [Google Scholar] [CrossRef]
  21. Ziegelwanger, H.; Kreuzer, W.; Majdak, P. Mesh2hrtf: Open-source software package for the numerical calculation of head-related transfer functions. In Proceedings of the 22nd International Congress on Sound and Vibration, Florence, Italy, 12–16 July 2015. [Google Scholar]
  22. Lee, G.W.; Kim, H.K. Personalized HRTF modeling based on deep neural network using anthropometric measurements and images of the ear. Appl. Sci. 2018, 8, 2180. [Google Scholar] [CrossRef] [Green Version]
  23. Lu, D.; Zeng, X.; Guo, X.; Wang, H. Head-related Transfer Function Reconstruction with Anthropometric Parameters and the Direction of the Sound Source: Deep Learning-Based Head-Related Transfer Function Personalization. Acoust. Aust. 2021, 49, 125–132. [Google Scholar] [CrossRef]
  24. Cintas, C.; Quinto-Sánchez, M.; Acuña, V.; Paschetta, C.; De Azevedo, S.; Cesar Silva de Cerqueira, C.; Ramallo, V.; Gallo, C.; Poletti, G.; Bortolini, M.C.; et al. Automatic ear detection and feature extraction using geometric morphometrics and convolutional neural networks. IET Biom. 2017, 6, 211–223. [Google Scholar] [CrossRef]
  25. Ban, K.; Jung, E.S. Ear shape categorization for ergonomic product design. Int. J. Ind. Ergon. 2020, 80, 102962. [Google Scholar] [CrossRef]
  26. Wang, X.; Liu, B.; Dong, Y.; Pang, S.; Tao, X. Anthropometric Landmarks Extraction and Dimensions Measurement Based on ResNet. Symmetry 2020, 12, 1997. [Google Scholar] [CrossRef]
  27. Varna, D.; Abromavičius, V. A System for a Real-Time Electronic Component Detection and Classification on a Conveyor Belt. Appl. Sci. 2022, 12, 5608. [Google Scholar] [CrossRef]
  28. Sledevič, T.; Serackis, A.; Plonis, D. FPGA Implementation of a Convolutional Neural Network and Its Application for Pollen Detection upon Entrance to the Beehive. Agriculture 2022, 12, 1849. [Google Scholar] [CrossRef]
  29. Matuzevicius, D.; Navakauskas, D. Feature selection for segmentation of 2-D electrophoresis gel images. In Proceedings of the 2008 11th International Biennial Baltic Electronics Conference, Tallinn, Estonia, 6–8 October 2008; pp. 341–344. [Google Scholar]
  30. Xu, Z.; Wu, T.; Shen, Y.; Wu, L. Three dimentional reconstruction of large cultural heritage objects based on uav video and tls data. Int. Arch. Photogramm. Remote Sens. Spat. Inf. Sci. 2016, 41, 985. [Google Scholar] [CrossRef] [Green Version]
  31. Matuzevičius, D. Synthetic Data Generation for the Development of 2D Gel Electrophoresis Protein Spot Models. Appl. Sci. 2022, 12, 4393. [Google Scholar] [CrossRef]
  32. Matuzevičius, D.; Serackis, A.; Navakauskas, D. Mathematical models of oversaturated protein spots. Elektron. Elektrotechnika 2007, 73, 63–68. [Google Scholar]
  33. Hamzah, N.B.; Setan, H.; Majid, Z. Reconstruction of traffic accident scene using close-range photogrammetry technique. Geoinf. Sci. J. 2010, 10, 17–37. [Google Scholar]
  34. Caradonna, G.; Tarantino, E.; Scaioni, M.; Figorito, B. Multi-image 3D reconstruction: A photogrammetric and structure from motion comparative analysis. In Proceedings of the International Conference on Computational Science and Its Applications, Melbourne, VIC, Australia, 2–5 July 2018; Springer: Berlin/Heidelberg, Germany, 2018; pp. 305–316. [Google Scholar]
  35. Žuraulis, V.; Matuzevičius, D.; Serackis, A. A method for automatic image rectification and stitching for vehicle yaw marks trajectory estimation. Promet-Traffic Transp. 2016, 28, 23–30. [Google Scholar] [CrossRef] [Green Version]
  36. Şenol, H.İ.; Polat, N.; Yunus, K.; Memduhoğlu, A.; Ulukavak, M. Digital documentation of ancient stone carving in Şuayip City. Mersin Photogramm. J. 2021, 3, 10–14. [Google Scholar] [CrossRef]
  37. SARICAOĞLU, T.; Kaya, N.K. A combined use of image and range-based data acquisition for the three-dimensional information mapping archaeological heritage. Mersin Photogramm. J. 2021, 3, 1–9. [Google Scholar] [CrossRef]
  38. Doğan, Y.; Yakar, M. GIS and three-dimensional modeling for cultural heritages. Int. J. Eng. Geosci. 2018, 3, 50–55. [Google Scholar] [CrossRef] [Green Version]
  39. Genchi, S.A.; Vitale, A.J.; Perillo, G.M.; Delrieux, C.A. Structure-from-motion approach for characterization of bioerosion patterns using UAV imagery. Sensors 2015, 15, 3593–3609. [Google Scholar] [CrossRef] [Green Version]
  40. Mistretta, F.; Sanna, G.; Stochino, F.; Vacca, G. Structure from motion point clouds for structural monitoring. Remote Sens. 2019, 11, 1940. [Google Scholar] [CrossRef] [Green Version]
  41. Zeraatkar, M.; Khalili, K. A Fast and Low-Cost Human Body 3D Scanner Using 100 Cameras. J. Imaging 2020, 6, 21. [Google Scholar] [CrossRef] [Green Version]
  42. Straub, J.; Kerlin, S. Development of a large, low-cost, instant 3D scanner. Technologies 2014, 2, 76–95. [Google Scholar] [CrossRef]
  43. Straub, J.; Kading, B.; Mohammad, A.; Kerlin, S. Characterization of a large, low-cost 3D scanner. Technologies 2015, 3, 19–36. [Google Scholar] [CrossRef] [Green Version]
  44. Westoby, M.J.; Brasington, J.; Glasser, N.F.; Hambrey, M.J.; Reynolds, J.M. ‘Structure-from-Motion’photogrammetry: A low-cost, effective tool for geoscience applications. Geomorphology 2012, 179, 300–314. [Google Scholar] [CrossRef] [Green Version]
  45. Li, X.; Iyengar, S. On computing mapping of 3d objects: A survey. ACM Comput. Surv. (CSUR) 2014, 47, 1–45. [Google Scholar] [CrossRef]
  46. Özyeşil, O.; Voroninski, V.; Basri, R.; Singer, A. A survey of structure from motion. Acta Numer. 2017, 26, 305–364. [Google Scholar] [CrossRef]
  47. Matuzevičius, D.; Serackis, A. Three-Dimensional Human Head Reconstruction Using Smartphone-Based Close-Range Video Photogrammetry. Appl. Sci. 2021, 12, 229. [Google Scholar] [CrossRef]
  48. Trujillo-Jiménez, M.A.; Navarro, P.; Pazos, B.; Morales, L.; Ramallo, V.; Paschetta, C.; De Azevedo, S.; Ruderman, A.; Pérez, O.; Delrieux, C.; et al. body2vec: 3D Point Cloud Reconstruction for Precise Anthropometry with Handheld Devices. J. Imaging 2020, 6, 94. [Google Scholar] [CrossRef]
  49. Zhao, Y.; Mo, Y.; Sun, M.; Zhu, Y.; Yang, C. Comparison of three-dimensional reconstruction approaches for anthropometry in apparel design. J. Text. Inst. 2019, 110, 1635–1643. [Google Scholar] [CrossRef]
  50. Iglhaut, J.; Cabo, C.; Puliti, S.; Piermattei, L.; O’Connor, J.; Rosette, J. Structure from motion photogrammetry in forestry: A review. Curr. For. Rep. 2019, 5, 155–168. [Google Scholar] [CrossRef] [Green Version]
  51. Yakar, M.; Dogan, Y. 3D Reconstruction of Residential Areas with SfM Photogrammetry. In Proceedings of the Advances in Remote Sensing and Geo Informatics Applications: Proceedings of the 1st Springer Conference of the Arabian Journal of Geosciences (CAJG-1), Hammamet, Tunisia, 12–15 November 2018; Springer: Berlin/Heidelberg, Germany, 2019; pp. 73–75. [Google Scholar]
  52. Leipner, A.; Obertová, Z.; Wermuth, M.; Thali, M.; Ottiker, T.; Sieberth, T. 3D mug shot—3D head models from photogrammetry for forensic identification. Forensic Sci. Int. 2019, 300, 6–12. [Google Scholar] [CrossRef] [PubMed]
  53. Wei, Y.m.; Kang, L.; Yang, B.; Wu, L.D. Applications of structure from motion: A survey. J. Zhejiang Univ. SCIENCE C 2013, 14, 486–494. [Google Scholar] [CrossRef]
  54. Duran, Z.; Atik, M.E. Accuracy comparison of interior orientation parameters from different photogrammetric software and direct linear transformation method. Int. J. Eng. Geosci. 2021, 6, 74–80. [Google Scholar] [CrossRef]
  55. Barbero-García, I.; Pierdicca, R.; Paolanti, M.; Felicetti, A.; Lerma, J.L. Combining machine learning and close-range photogrammetry for infant’s head 3D measurement: A smartphone-based solution. Measurement 2021, 182, 109686. [Google Scholar] [CrossRef]
  56. Barbero-García, I.; Lerma, J.L.; Mora-Navarro, G. Fully automatic smartphone-based photogrammetric 3D modelling of infant’s heads for cranial deformation analysis. ISPRS J. Photogramm. Remote Sens. 2020, 166, 268–277. [Google Scholar] [CrossRef]
  57. Lerma, J.L.; Barbero-García, I.; Marqués-Mateu, Á.; Miranda, P. Smartphone-based video for 3D modelling: Application to infant’s cranial deformation analysis. Measurement 2018, 116, 299–306. [Google Scholar] [CrossRef] [Green Version]
  58. Barbero-García, I.; Cabrelles, M.; Lerma, J.L.; Marqués-Mateu, Á. Smartphone-based close-range photogrammetric assessment of spherical objects. Photogramm. Rec. 2018, 33, 283–299. [Google Scholar] [CrossRef] [Green Version]
  59. Fawzy, H.E.D. The accuracy of mobile phone camera instead of high resolution camera in digital close range photogrammetry. Int. J. Civ. Eng. Technol. (IJCIET) 2015, 6, 76–85. [Google Scholar]
  60. Tamulionis, M.; Sledevič, T.; Abromavičius, V.; Kurpytė-Lipnickė, D.; Navakauskas, D.; Serackis, A.; Matuzevičius, D. Finding the Least Motion-Blurred Image by Reusing Early Features of Object Detection Network. Appl. Sci. 2023, 13, 1264. [Google Scholar] [CrossRef]
  61. Yao, G.; Huang, P.; Ai, H.; Zhang, C.; Zhang, J.; Zhang, C.; Wang, F. Matching wide-baseline stereo images with weak texture using the perspective invariant local feature transformer. J. Appl. Remote Sens. 2022, 16, 036502. [Google Scholar] [CrossRef]
  62. Wei, L.; Huo, J. A Global fundamental matrix estimation method of planar motion based on inlier updating. Sensors 2022, 22, 4624. [Google Scholar] [CrossRef] [PubMed]
  63. Ma, J.; Jiang, X.; Fan, A.; Jiang, J.; Yan, J. Image matching from handcrafted to deep features: A survey. Int. J. Comput. Vis. 2021, 129, 23–79. [Google Scholar] [CrossRef]
  64. Zhang, L.; Wang, Q.; Lu, H.; Zhao, Y. End-to-end learning of multi-scale convolutional neural network for stereo matching. In Proceedings of the Asian Conference on Machine Learning, PMLR, Beijing, China, 14–16 November 2018; pp. 81–96. [Google Scholar]
  65. Jiang, X.; Ma, J.; Xiao, G.; Shao, Z.; Guo, X. A review of multimodal image matching: Methods and applications. Inf. Fusion 2021, 73, 22–71. [Google Scholar] [CrossRef]
  66. Fu, Y.; Lei, Y.; Wang, T.; Curran, W.J.; Liu, T.; Yang, X. Deep learning in medical image registration: A review. Phys. Med. Biol. 2020, 65, 20TR01. [Google Scholar] [CrossRef] [Green Version]
  67. Haskins, G.; Kruger, U.; Yan, P. Deep learning in medical image registration: A survey. Mach. Vis. Appl. 2020, 31, 1–18. [Google Scholar] [CrossRef] [Green Version]
  68. De Vos, B.D.; Berendsen, F.F.; Viergever, M.A.; Staring, M.; Išgum, I. End-to-end unsupervised deformable image registration with a convolutional neural network. In Proceedings of the Deep Learning in Medical Image Analysis and Multimodal Learning for Clinical Decision Support: Third International Workshop, DLMIA 2017, and 7th International Workshop, ML-CDS 2017, Held in Conjunction with MICCAI 2017, Québec City, QC, Canada, 14 September 2017; Proceedings 3. Springer: Berlin/Heidelberg, Germany, 2017; pp. 204–212. [Google Scholar]
  69. De Vos, B.D.; Berendsen, F.F.; Viergever, M.A.; Sokooti, H.; Staring, M.; Išgum, I. A deep learning framework for unsupervised affine and deformable image registration. Med. Image Anal. 2019, 52, 128–143. [Google Scholar] [CrossRef] [Green Version]
  70. Yang, X.; Kwitt, R.; Styner, M.; Niethammer, M. Quicksilver: Fast predictive image registration—A deep learning approach. NeuroImage 2017, 158, 378–396. [Google Scholar] [CrossRef]
  71. Zhou, T.; Brown, M.; Snavely, N.; Lowe, D.G. Unsupervised learning of depth and ego-motion from video. In Proceedings of the IEEE Conference on Computer Vision and Pattern Recognition, Honolulu, HI, USA, 21–26 July 2017; pp. 1851–1858. [Google Scholar]
  72. Gao, L.; Zhao, Y.; Han, J.; Liu, H. Research on multi-view 3D reconstruction technology based on SFM. Sensors 2022, 22, 4366. [Google Scholar] [CrossRef]
  73. Sun, Q.; Tang, Y.; Zhao, C. Cycle-SfM: Joint self-supervised learning of depth and camera motion from monocular image sequences. Chaos Interdiscip. J. Nonlinear Sci. 2019, 29, 123102. [Google Scholar] [CrossRef]
  74. Klodt, M.; Vedaldi, A. Supervising the new with the old: Learning sfm from sfm. In Proceedings of the European Conference on Computer Vision (ECCV), Munich, Germany, 8–14 September 2018; pp. 698–713. [Google Scholar]
  75. Acharya, D.; Khoshelham, K.; Winter, S. BIM-PoseNet: Indoor camera localisation using a 3D indoor model and deep learning from synthetic images. ISPRS J. Photogramm. Remote Sens. 2019, 150, 245–258. [Google Scholar] [CrossRef]
  76. Fraser, C.S. Automatic camera calibration in close range photogrammetry. Photogramm. Eng. Remote Sens. 2013, 79, 381–388. [Google Scholar] [CrossRef] [Green Version]
  77. Yi, G.; Jianxin, L.; Hangping, Q.; Bo, W. Survey of structure from motion. In Proceedings of the 2014 International Conference on Cloud Computing and Internet of Things, Changchun, China, 13–14 December 2014; pp. 72–76. [Google Scholar]
  78. Battistoni, G.; Cassi, D.; Magnifico, M.; Pedrazzi, G.; Di Blasio, M.; Vaienti, B.; Di Blasio, A. Does Head Orientation Influence 3D Facial Imaging? A Study on Accuracy and Precision of Stereophotogrammetric Acquisition. Int. J. Environ. Res. Public Health 2021, 18, 4276. [Google Scholar] [CrossRef] [PubMed]
  79. Nikolov, I.; Madsen, C.B. Calculating Absolute Scale and Scale Uncertainty for SfM Using Distance Sensor Measurements: A Lightweight and Flexible Approach. In Recent Advances in 3D Imaging, Modeling, and Reconstruction; IGI Global: Hershey, PA, USA, 2020; pp. 168–192. [Google Scholar]
  80. Griwodz, C.; Gasparini, S.; Calvet, L.; Gurdjos, P.; Castan, F.; Maujean, B.; Lillo, G.D.; Lanthony, Y. AliceVision Meshroom: An open-source 3D reconstruction pipeline. In Proceedings of the 12th ACM Multimedia Systems Conference—MMSys ’21, Istanbul, Turkey, 28 September–1 October 2021; ACM Press: New York, NY, USA, 2021. [Google Scholar] [CrossRef]
Figure 1. The problem of camera 3D localization. Building the 3D model of the ear using the structure-from-motion (SfM) technique requires a precise computation of the camera positions (a). In this research, we propose augmenting the side region of the head with a suitable texture for the reconstruction process. The solution we are investigating aims to enhance the texture in the background of the image of the ear, such that it remains fixed relative to the ear. We are exploring the potential of using a cap (b), examining its efficiency in improving 3D camera localization for SfM-based object reconstruction.
Applsci 13 08712 g001
Figure 2. Experimental scenarios for the investigation of the effect of cap usage on camera 3D localization accuracy. Cap usage is the proposed solution for background enrichment with patterns in order to improve feature matching in the photogrammetry pipeline. Twelve types of caps were tested, leading to 13 experimental scenarios: 1. No cap—regular case of image collection for ear reconstruction; 2. Dots 1, 4. Dots 2, 6. Dots 3, and 8. Dots 4—four dot size cases of regularly arranged dot patterns; 3. Dots 1s, 5. Dots 2s, 7. Dots 3s, and 9. Dots 4s—four dot size cases of sparse dot patterns; 10. Painted blobs—pattern of randomly painted blobs of different sizes; 11. Checkerboard—a well-known pattern used for camera calibration; 12. Printed irreg.—printed pattern of irregularly scattered small dots; 13. Winter hat—a regular knitted patterned winter hat.
Applsci 13 08712 g002
Figure 3. The experimental setup for the evaluation of camera reconstruction accuracy. Reference camera locations forming a camera motion trajectory are reconstructed using a full frame image. A background of such an image has a rich pattern that is favored by the photogrammetry algorithms. Images from test cases contain only the head region, as real scenarios of capturing the head for ear reconstruction would require removal of the background region that cannot be ensured to be static. Reconstructed camera locations from the investigated scenarios are compared to reference camera locations by aligning camera trajectories. The camera localization accuracy is evaluated as the median of camera displacements in the investigated trajectory.
Applsci 13 08712 g003
Figure 4. Results of experimental comparison of proposed camera 3D localization improvement solutions. In the graph, the results of 13 experimental cases are summarized. Each case consists of data arranged in 5 virtual columns: the first four columns show the separate experiment accuracy evaluation results (camera localization errors) of the four experimental setups, and the fifth column shows summary statistics with a box plot, which includes all data points from the first four columns. As some reconstruction experiments were not successful (photogrammetry pipeline failed to reconstruct the sparse scene), these failures are summarized and presented as bar charts under the horizontal axis. Full-sized bars mean that 100% of cases failed. The same color of the bar charts and data points labels the same experimental setup.
Applsci 13 08712 g004
Disclaimer/Publisher’s Note: The statements, opinions and data contained in all publications are solely those of the individual author(s) and contributor(s) and not of MDPI and/or the editor(s). MDPI and/or the editor(s) disclaim responsibility for any injury to people or property resulting from any ideas, methods, instructions or products referred to in the content.

