Article

Evaluation of the Nutritional Quality of Different Soybean and Pea Varieties: Their Use in Balanced Diets for Different Pathologies

by
Elena Moroșan
1,†,
Carmen Elena Lupu
2,†,
Magdalena Mititelu
1,*,
Adina Magdalena Musuc
3,*,
Andreea Ioana Rusu
4,†,
Ionuț Daniel Răducan
4,†,
Oana Karampelas
5,
Ionuț Bogdan Voinicu
6,
Sorinel Marius Neacșu
7,
Monica Licu
8,†,
Ana Corina Pogan
1,
Daniela Cîrnațu
4,
Elena Iuliana Ilie
9 and
Adriana Maria Dărăban
4
1
Department of Clinical Laboratory and Food Safety, Faculty of Pharmacy, “Carol Davila” University of Medicine and Pharmacy, 6 Traian Vuia Street, 020945 Bucharest, Romania
2
Department of Mathematics and Informatics, Faculty of Pharmacy, “Ovidius” University of Constanta, 6 Capitan Aviator Al. Serbanescu Street, Campus, C Block, 900470 Constanta, Romania
3
“Ilie Murgulescu” Institute of Physical Chemistry, 202 Spl. Independentei, 060021 Bucharest, Romania
4
Faculty of Pharmacy, “Vasile Goldiș” Western University of Arad, 86 Liviu Rebreanu Street, 310045 Arad, Romania
5
Department of Pharmaceutical Technology and Biopharmacy, Faculty of Pharmacy, “Carol Davila” University of Medicine and Pharmacy, 6 Traian Vuia Street, 020945 Bucharest, Romania
6
Department of Pharmaceutical Botany and Cell Biology, Faculty of Pharmacy, “Carol Davila” University of Medicine and Pharmacy, 6 Traian Vuia Street, 020956 Bucharest, Romania
7
Professional Farma Line, 116 Republicii Street, 105200 Baicoi, Romania
8
Department of Medical Psychology, Faculty of Medicine, “Carol Davila” University of Medicine and Pharmacy, 050474 Bucharest, Romania
9
Department of Pharmacognosy, Phytochemistry and Phytotherapy, Faculty of Pharmacy, “Carol Davila” University of Medicine and Pharmacy, 050474 Bucharest, Romania
*
Authors to whom correspondence should be addressed.
These authors contributed equally to this work.
Appl. Sci. 2023, 13(15), 8724; https://doi.org/10.3390/app13158724
Submission received: 27 June 2023 / Revised: 24 July 2023 / Accepted: 25 July 2023 / Published: 28 July 2023

Abstract

:
Among the cultivated plants of great interest at the planetary level, soy and pea can be highlighted. Soy represents a major source of protein and oil, with exceptional and widely accepted qualities in most cultures and religions. It is also a very good substitute for animal protein, having significant amounts of essential amino acids. Peas, although less cultivated than soybeans, contain large amounts of protein and carbohydrates, and they are also a source of food used in many diets due to their high nutritional content. The present study focuses on the nutrient composition analysis of five soybean varieties and four pea varieties grown in Romania for their use in food in the most efficient way. Protein dosage was carried out using Bradford and Kjeldahl methods, and the amino acids were dosed using gas chromatography. It was demonstrated that the analyzed varieties are rich in nutrients with different content depending on their type. Among the soybean hybrid varieties analyzed, the beans from the early Ovidiu F type and the semi-early Anduța F stood out for their increased content of lipids (23.28%) and proteins with increased biological value, and in the case of the pea beans, those from the Evelina F (22.21%) varieties of the Afila and Spectral F autumn types presented the highest content of proteins (21.06%) and essential amino acids (16.87%). All the obtained results offer a theoretical foundation for the advanced and balanced application of different varieties of soybean and pea bean in a balanced diet.

1. Introduction

Soybean (Glycine max L.) is an annual leguminous plant in the Fabaceae (Leguminosae) family that originated in the current area of the People’s Republic of China (most likely the north and center) more than 3000 years ago, or even over 5000 years ago according to some reports [1,2]. The overall dry matter composition of whole soybeans is approximately 40% protein, 21% lipid, 5% ash and 34% carbohydrate [3]. The limitation of its use in people’s diets comes not only from isoflavones but also from the produced flatulence, which is due to raffinose and stachyose. The digestive tract of humans does not secrete enzymes capable of hydrolyzation of the 1–4 galactosidic bonds in raffinose and stachyose to simpler sugars [4,5]. Thus, they reach the area of the distal ileum and later the large intestine, where they are metabolized by bacteria and produce flatulence. About 90–95% of the protein is spare protein and has two subunits of storage proteins: 35% conglycinin (7S) and 52% glycinin (11S). The 11S fraction contains mainly legumin, and the 7S fraction contains vicillin and convicillin. Soy protein has a number of advantages over other types of natural proteins: increased biological value, low price compared to those of animal origin, non-animal origin and relatively long storage time due to stability [6,7]. Soy protein is a macromolecule derived from plants of great interest in the biomedical field. Membranes, fibers, microparticles and even thermoplastics have also been developed based on soy protein in combination with other proteins (e.g., wheat gluten, casein), polysaccharides (e.g., cellulose, chitosan) and synthetic materials. The resulting materials are useful in tissue regeneration, wound healing and as targeted drug therapeutic systems [8]. In the past, soy protein was considered only as a traditional nutrient. In the second half of the 1970s, the hypocholesterolemic effect of soy protein was discovered [9]. In addition, it decreases the expression of the lipogenic enzyme gene in the liver, according to a study in Wistar rats [10]. The protein from soybeans contains nutritious as well as useful components for the body, a series of anti-nutrients including protein-like substances such as trypsin inhibitors (which inhibit the digestion of food proteins and reduce their nutritional value by reducing absorption) and hemagglutinins (lectins that exert negative effects on the nutritional value of soy-based preparations and can usually be inactivated by heat processing) [11]. Goitrogens (substances that block the production of thyroid hormones by interfering with the uptake of iodine in the thyroid gland) are also part of the anti-nutritional category present in soy, which demonstrates the precautions that must be taken in the case of the preparation and consumption of soy-based foods in people with thyroid gland diseases, along with saponins and allergenic glycoproteins [12]. In the last three decades, numerous clinical studies have demonstrated the beneficial effect of soy consumption on plasma lipids in animals and humans. Introducing soy into the diet or even replacing animal protein with soy protein, according to research studies, improves the lipid profile in various animal species but also in men and women alike, especially in those with high levels of total cholesterol [13,14,15]. However, the mechanism of bioactive soy compounds responsible for this effect is not completely known, but of great interest are isoflavones. Soy dietary supplementation showed a decrease in the concentration of total and low-density lipoproteins (basically a decrease in LDL cholesterol), concomitant with an increase in high-density lipoprotein (HDL) cholesterol [16,17]. Soy foods, due to their content of phytoestrogenic isoflavones, have been used to both decrease the risk of cardiovascular disease and to improve menopausal symptoms [18,19,20]. Compared to animal protein (which is considered a complete protein because it contains all the essential amino acids), soy protein is not as complete, possibly due to anti-nutrients, but it is the highest-quality plant protein. Moreover, it has a preventive or even therapeutic action in certain conditions, being considered a functional food, as part of the diet. It has proven benefits in improving chronic diseases caused by aging, having an antioxidant effect, and stabilizing the functions of mitochondria [21,22].
The pea (Pisum sativum L.) belongs to the Fabaceae (Leguminosae) family and is very widespread, being a popular cultivated plant. It is an important source of proteins, amino acids and carbohydrates. Peas are used alone or in combination with other vegetables. Peas are of major nutritional importance due to their high content of protein, complex carbohydrates, dietary fiber, minerals, vitamins and antioxidant compounds. Although peas are used in animal nutrition extensively, consumption of peas among the population is lower than that of other better accepted traditional foods [23]. Last but not least, in recent years, the richness of nutrients available in peas and their beneficial functional properties have accelerated the growth of interest and demand for this food in the direction of nutrition for children and the elderly [24,25]. Protein and sugars are important qualitative components of peas, which are a rich source of protein. Different varieties have been developed to produce dry mature berries; juicy, immature and well-developed berries and immature, juicy and edible pods. Varieties with dry beans are often referred to collectively as field peas. The names garden pea or English pea are empirically given to varieties harvested as immature pods, while the pods are known as snow peas or snap peas. In some Asian cuisines, the stems of pea plants are used as greens [26,27,28]. Peas contain about 20–25% protein, 1.5–2% lipids and 60–65% carbohydrates [29]. Over the past 20 years, pea protein has attracted a global increase in consumer attention due to its functionality, nutritional properties and non-GMO status, becoming an increasingly popular alternative source. Allergic reactions to peas in humans are rare, and peas have a low content of anti-nutritional components such as protease inhibitors, phytic acid and α-galactosidase compared to soybeans or dry edible beans (Phaseolus vulgaris) [30,31,32]. Both plants, soybeans and peas, have undergone extensive development on the agricultural level, and through this prism they have also been subjected to genetic engineering processes (hybridization, improvement, genetic modification). The purposes of genetic engineering are multiple, for example increasing productivity, changing flowering and fruiting periods to adapt to different climates, increasing cold resistance, increasing strain resistance, resistance to different parasites, resistance to different herbicides used to remove weeds from crops (e.g., classic glyphosate), changing the composition by increasing the amounts of certain amino acids (for example methionine, in the case of soy, to be more nutritious for chickens) or changing the composition of the oil (in the case of fatty soybean oil, lower amounts of linoleic acid and linolenic acid diminishes the rancidity process) [33].
Checking the nutritional quality of the analyzed sample represents an important objective of this research. The regular intake of soybean and pea bean varieties rich in various vitamins, proteins and minerals may reduce the risk of breast and prostate cancer and may alleviate the symptoms of menopause. In the experimental part of the present work, a series of quantitatively and qualitatively analyses were carried out in order to evaluate the nutritional components of five samples from different soybean varieties and four samples from different pea varieties grown in Romania, hybrid varieties obtained using crossing and selection approaches, by conventional plant breeding, at the Fundulea National Research Institute Agricultural Development from Romania. The purpose of the conducted research is to guide the use in food of different obtained varieties of the two plants in order to capitalize on those types that have high concentrations of valuable nutrients. The relevance of this research was to demonstrate the significance of the modifications produced by crossing and selection approaches at the physiological and morphological level of the selected cultivars.
The novelty of the research consists of the development of hybrid species of two plant products widely used in the food industry (peas and soybeans) but also pharmaceuticals in the case of soybean lipids. The present study aims to evaluate the nutrient composition of five soybean varieties and four pea varieties grown in Romania in order to be used in food in the most effective way. The hybrid species used in this study are varieties with improved composition in valuable nutrients for the body: total proteins, total lipids and essential amino acids. In the case of vegetable products, it is known that proteins in general are lower in essential amino acids compared to those from animal sources. The properties of the analyzed varieties purchased from the National Agricultural Research and Development Institute [34] are shown in Table 1.

2. Materials and Methods

2.1. Plant Material

Five varieties of soybeans (Glycine max L.) and four varieties of peas (Pisum sativum L.) were used for the analysis. Soybean samples (Ovidiu F early, Anduța F semi-early, Florina F semi-early, Fabiana F semi-late, Crina F semi-early) and peas (Spectral F autumn, Aurora-type afila, Evelina F-type afila, Nicoleta-type afila) were procured from the National Institute of Agricultural Research and Development (INCDA) Fundulea from Romania in 500 g samples for each type. The samples were dried in a closed oven at 60 °C for 24 h, then each sample was ground and kept in the dark and a cool place (+4 °C) in a sealed glass container until further analysis.

2.2. Analysis of Soybean Lipids

Lipids were extracted using the Soxhlet method: 5 g of each dry sample was extracted with 150 mL of hexane. The solvent was removed by evaporation on a Buchi R-215 rotary evaporator. The obtained oil was analyzed by gas chromatography. Then, 5 mL methanol, 5 mL hexane and 1 mL NaOH 0.1 M solution in anhydrous methanol were added to 100 μL of oil from each sample in a derivatization vial. The vials were sealed, and the mixture was subjected to hydrolysis at 85 °C for 15 min. The reaction mixture was cooled to room temperature, the vials were opened and 2 mL of 14% BF3 in methanol was added. The vials were sealed again and subjected to esterification at 85 °C for 5 min. After cooling, the vials were opened and 2 mL of 60 g/L NaCl aqueous solution was added for better separation of the layers (non-polar hexane and polar hydroalcoholic), then the samples used for analysis were taken from the hexane (upper) layer with a micro-pipette [35,36].
A Thermo Scientific TSQ 8000 EVO gas chromatograph coupled with a triple quadrupole mass detector (GC MS/MS) was used for the analysis of the processed samples. The working conditions were as follows: a Thermo Scientific Trace GOLD TG-5 SilMS (L = 30.00 m, D = 0.25 mm) column, He was used as gas carrier at a flow rate of 1.0 mL/min and the analysis time was 26.267 min. The detection of the total ion chromatogram (TIC), at M/z 40–600, was performed using Chromeleon 7.2.10 software.
Table 2 shows the experimental conditions for the analysis of hydrolyzed fatty acids from soybean oil in the form of methyl esters.
A stock solution of methylated fatty acid derivatives was used for calibration curve (Figure S1 from Supplementary Material File), from which successive dilutions were carried out (C1: 100 μL, C2: 500 μL, C3: 1000 μL, diluted to 1000 μL with HPLC grade hexane). A total of 0.5 μL of each sample was injected and analyzed.

2.3. Protein and Amino Acid Analysis of Soybeans and Pea Beans

Considering the types of proteins from soy and pea, both albumins and globulins, two extraction media were chosen in this research: Tris-glycine buffer media and aqueous media. According to the literature, these media are suitable for the extraction of large amounts of protein (almost quantitative) from most biological samples (plant, animal and human) [37]. The Tris-glycine buffer was prepared using 0.6000 g of Trizma base® (Sigma-Aldrich, Darmstadt, Germany) and 2.8800 g of glycine, which were placed in a 100 mL volumetric flask. Then, they were dissolved in Milli-Q® (Sigma-Aldrich, Darmstadt, Germany) ultrapure water and were made up to the mark with the same solvent. Before use, a 1:10 dilution (20 mL buffer stock solution into a 200 mL volumetric flask) was carried out. For samples dissolved in other buffer solutions, this dilution was not performed. For protein extraction, depending on the sensitivity of the methods and the approximate protein content of the samples, according to the literature, a concentration of 20 mg/mL of sample was chosen. Thus, 0.1000 g of sample, weighed on the analytical balance, was brought into plastic tubes for the centrifuge. Then, the extraction medium (Tris-glycine buffer or Milli-Q® ultrapure water) was added to each tube. The samples were shaken on the angle shaker for 1 h for total dispersion and extraction. Subsequently, the sample tubes were centrifuged at 4000 rpm for 30 min. The supernatant was transferred and then used in the assays. In the case of soy, the degrease sample obtained after exhaustion with n-hexane in the Soxhlet device was used. All analyses were carried out in triplicate.

2.3.1. Protein Dosage by the Bradford Method

The absorbances of the samples were measured using a Perkin Elmer Life and Analytical Science Molecular Absorption Spectrophotometer LAMBDA 25 (λ = 595 nm). The method is reproducible, has little interference (sodium, potassium and sugars do not interfere, only strongly alkaline solutions or detergents, such as sodium lauryl sulfate or detergents in cleaning products) and is also fast (the reaction is practically complete after 2 min, and the coloration is stable for 1 h) [38].
Preparation of the Bradford reagent: 0.0125 g of Coomassie Brilliant Blue G-250® (Sigma-Aldrich, Darmstadt, Germany) in a Berzelius beaker was weighed on the analytical balance, and 5 mL of ethanol was added. After dissolution, 10 mL of phosphoric acid was added. The mixture was transferred to a 100 mL volumetric flask, and the Berzelius beaker was rinsed several times with ultrapure Milli-Q® water. It was brought to the mark with the same solvent and was kept for 24 h in the refrigerator, for stabilization. The reagent was fresh for one week.
The calibration curve was obtained according to the method first published in 1976; the standard used was bovine serum albumin (BSA) [38]. Two stock solutions of 1 mg/mL were prepared, in Tris-glycine or water, from which successive dilutions were performed to obtain the calibration curve.
BSA stock solutions: 0.0250 g of BSA was introduced into a 25 mL volumetric flask. Then, it was dissolved in solvent (Tris-glycine buffer or ultrapure water) and was made up to the mark using the same solvent. The BSA standards were prepared from the stock solution, according to Table 3, at a final volume of 1.25 mL. Then, the solution was made up to 5 mL using the Bradford reagent (in the volumetric flask).
The analyzed samples were prepared by mixing 1.25 mL (Vp) protein extraction solution with Bradford reagent in a 5 mL volumetric flask. It was brought up to the mark with Bradford reagent and was read in the spectrometer at λ = 595 nm after 15 min. The coloration was stable for 1 h. The analyses were carried out in triplicate.

Protein Determination Using the Kjeldahl Method

Sample digestion: 0.5000 g sample and 4.0000 g disaggregation mixture (100 g potassium sulfate, 5.0 g copper sulfate, 2.5 g selenium) were weighed on the analytical balance. Then, 15 mL of concentrated sulfuric acid was added. Next, the mixture was introduced into the Digesdahl 23130-21 apparatus. The mixture was subjected to digestion (mineralization) at 440 °C by periodic stirring. The temperature was maintained until the sample became clear after approximately 15–20 min (the sample became clear, transparent, or colored green, the shade varying depending on the sample). Then, it was cooled to room temperature.
The resulting mixture after digestion was transferred into a 500 mL distillation flask. The digestion vessel was rinsed several times with water. A total of 50 mL of 4% boric acid solution and a few drops of indicator mixture were introduced into the collection vessel, and 50 mL of 30% NaOH solution (prepared by diluting a 50% sodium hydroxide solution) was added to the funnel. The water tap was turned on to constantly cool the descending refrigerant. The alkaline solution was allowed to drip slowly into the still mixture. Water was introduced successively into the funnel and allowed to flow up to half the capacity of the distillation vessel. A small amount of water was kept in the funnel. The heating was turned on, and the mixture was distilled until the collection vessel contained about 100 mL. Then, the heating was stopped, the rod was suddenly lifted from the funnel to avoid the pressure drop of the system amid the suction of the collected fraction. The collected fraction was titrated with 0.1 N HCl solution in the presence of the methyl red–brom-cresol green indicator mixture, turning from green to purple. The solution factor was obtained by titrating the Trizma base® standard substance.

2.3.2. Amino Acids Determination by Gas Chromatography

Protein hydrolysis represents an essential process in amino acid analysis. This involves incubation of the samples with 6M hydrochloric acid at elevated temperature. Studies showed that the time required decreases with the increase in temperature [39]. Another study stated that the hydrolysis mode also influenced the racemization percentage [40]. Thus, the hydrolysis test in the oven at 110 °C, for 8 h, was chosen.
A total of 600 μL of protein extract was used and placed in a glass vial. Then, 720 μL of 37% hydrochloric acid solution was added for a final acid concentration of 6M. The vials were sealed and were placed in the oven at 110 °C for 8 h. Then, a small amount (50 μL) of the hydrolyzate mixture was placed dry in a derivatization vial in a well-ventilated area at room temperature or near a heat source (max. 50 °C). When the mixture was completely dried, it was taken up with 250 μL acetonitrile, and 250 μL BSTFA [N, O-bis(trimethylsilyl)trifluoroacetamide] was added. The vials were derivatized at 105 °C for 1 h. Then, they were cooled and were left to rest for 2 h.
The analyses were carried out using a Thermo Scientific TSQ 8000 EVO Triple Quadrupole Mass Detector Coupled Gas Chromatograph (GC MS/MS), Thermo Scientific TraceGOLD TG-5SilMS column (L = 30.00 m, D = 0.25 mm), with carrier gas He, flow rate of 1.0 mL/min, analysis time of 46.667 min, total ion chromatogram (TIC) detection M/z 40–600 and Chromeleon 7.2.10 software.
Table 4 shows the conditions used for gas chromatography analysis of amino acids as derivatives with trimethylsilyl.
The calibration curve (Figure S2 from Supplementary Material File) was obtained as follows: The following volumes of amino acid stock solution C1: 50 μL, C2: 100 μL, C3: 400 μL were used, dried according to the procedures previously described and were processed in the same way. A total of 1.0 μL was injected and analyzed.

2.3.3. Protein Electrophoresis

The general principle of the method is described in the European Pharmacopoeia [41,42,43,44]. Preparation of the solubilization buffer and sample preparation: a 2.5 mL concentration gel buffer solution, 2.0 mL glycerol, 4.0 mL sodium dodecyl sulfate (SDS) 10% solution, 0.5 mL Coomassie Brilliant Blue G-250® 0.1% solution, 1 mL Milli-Q® ultrapure water were added to a test tube and homogenized. Then, 2-mercaptoethanol 1:20 (v/v) was added before use. It has an antioxidant role. The test solutions were osbtained from 60 μL of previously prepared sample solution and 60 μL of solubilization buffer. They were shaken and kept in the water bath at 95 °C for 5 min to denature the proteins.
(i).
The 30% acrylamide–bisacrylamide solution was prepared as follows: 29.2000 g of acrylamide and 0.8000 g of N,N′-methylenebisacrylamide were weighed and were introduced into a 100 mL volumetric flask. They were dissolved in Milli-Q® ultrapure water and made up to volume with the same solvent. Then, they were filtered and stored in brown glass vials in the refrigerator for 30 days.
(ii).
Preparation of the 10% sodium dodecyl sulfate (SDS) solution: 10 g of sodium dodecyl sulfate was weighed and placed in a 100 mL volumetric flask. It was dissolved in Milli-Q® ultrapure water and made up to volume with the same solvent. The solution was stored at room temperature.
(iii).
Preparation of gel buffer for separation: 18.1500 g of Trizma base® (tromethamine) was weighed and placed in a Berzelius beaker. Then, it was dissolved into Milli-Q® ultrapure water, and the pH was adjusted to 8.80 using the Mettler Toledo FiveEasy pH F20 pH meter with 6 N HCl solution. The content was transferred to a 100 mL volumetric flask and brought to the mark with the same solvent. It was stored in the refrigerator. The final concentration of Tris was 1.5 M.
(iv).
Preparation of the gel buffer for concentration: 6.0000 g of Trizma base® was weighed and placed into a Berzelius beaker. Then, it was dissolved in Milli-Q® ultrapure water, and the pH was adjusted to 6.80 using the Mettler Toledo FiveEasy pH F20 pH meter with 6 N HCl solution. The contents were transferred into a 100 mL volumetric flask and made up to the mark with the same solvent. It was stored in the refrigerator. The final concentration of Tris was 0.5 M.
(v).
Preparation of 10% ammonium persulfate (APS) solution: 0.1000 g of ammonium persulfate was weighed using the analytical balance and dissolved in 1 mL of Milli-Q® ultrapure water.
(vi).
Preparation of migration buffer pH 8.3:3.0300 g of Trizma base® and 14.4000 g of glycine were weighed on the analytical balance. They were placed in a 1000 mL volumetric flask. It was dissolved in ultrapure Milli-Q® water. Then, 10 mL of 10% SDS solution was added and made up to the mark with the same solvent. No pH adjustment was made.
(vii).
Preparation of fixing solution: 12.0000 g of trichloroacetic acid was weighed and placed in a 100 mL volumetric flask. It was dissolved in Milli-Q® ultrapure water and made up to a volume with the same solvent.
(viii).
Preparation of Coomassie staining solution: 0.1800 g of Coomassie Brilliant Blue G-250® was dissolved in 45 mL of methanol. In total, 10 mL glacial acetic acid and 45 mL Milli-Q® ultrapure water were added.
(ix).
Preparation of the bleaching solution: the solution was prepared with a volumetric methanol/acetic acid/ultrapure water ratio of 40:10:50.
(x).
Preparation of anti-fade solution: a solution of 2% acetic acid in ultrapure water was prepared.
(xi).
Tris-glycine pH 8.3 buffer was prepared according to the procedure presented for protein extraction.
(a)
The formation of gels
Plates of 10 mm thickness were selected and assembled in dedicated supports resting on an absorbent sponge for the polymerized separation gel. Ultra-pure water, 30% solution of acrylamide–bisacrylamide, Tris tampon and 10% SDS solutions were mixed. Then, TMED and 10% APS solutions were quickly added, homogenized and slowly and carefully poured between the plates to a distance below the penetration of the comb. A layer of isopropanol was added to create a uniform gel without gas bubbles. The mixture was left to polymerize for 15–30 min, then the isopropanol was removed and gently wiped with filter paper to avoid contamination. For the concentration gel, the procedure was similar, and after pouring it between the plates, over the already polymerized separation gel, the comb corresponding to the chosen width was inserted, with the desired number of wells—in this case 15 wells. It was left to polymerize for about 30 min, and when the reaction was complete the comb was removed. Gels were stored in the refrigerator in migration buffer to avoid dehydration. The Bio-Rad PowerPac Basic electrophoresis system that can accommodate two gels was assembled. The tightness of the cathodic enclosure was checked (migration buffer was poured first to check carefully for possible leaks in the anode and outer enclosures). It was brought up to mark on the tank with buffer. The wells were loaded with 10 μL of each sample and one well with 10 μL of molecular mass marker. The entire installation was covered with the protective cover provided, and the wires were connected accordingly (positive to positive and negative to negative). Direct current was set; initially, the voltage was maintained at 80 V for 15 min, then was increased to 100 V and maintained for another 15 min then was increased to 120 V until the end of the process. It was considered complete when the migration front reached the bottom edge of the plates.
(b)
Staining and interpretation of bands
The gel was removed from the plate system and subjected to the fixation step. Fixation means treating the gel with the fixing solution (30 mL of 12% trichloroacetic acid solution) for 15 min. The gels were placed in a crystallizer, and the Coomassie staining reagent was added over them. They were kept under stirring conditions for 12 h. Then, the gels were removed from the staining solution and were destained several times with fractions of the destaining solution until the contrast between the protein bands and the gel background was adequate to read (essentially the reagent that had entered the gel pores was eluted; the protein-bound reagent was stable upon discoloration) for approximately 6 h, with a solution change every 2–3 h. The presence of proteins causes the appearance of horizontal blue bands, and the evaluation of molecular masses was based on the molecular mass marker. Subsequently, it was stained with silver reagent. Silver reagent is generally used for small amounts of protein due to its sensitivity. In the presence of appreciable amounts of proteins, the staining becomes too intense and difficult to interpret, the close bands overlap and the protein fractions cannot be distinguished. However, the advantage was represented by the visualization of some proteins in small amounts, which are not visible after staining with the Coomassie reagent.
The Pierce Silver Stain kit was used. Silver coloring steps are as follows:
(a)
The gels were washed twice with ultrapure Milli-Q® water for 5 min each. Then, the water was removed.
(b)
They were fixed with ethanol/acetic acid/ultrapure water 3:1:6 v/v/v solution twice for 15 min. The solution was removed.
(c)
They were washed with 10% ethanol solution in water twice, 5 min each.
(d)
The gels were immersed in a solution consisting of 25 mL Milli-Q® ultrapure water and 50 μL Silver Stain Sensitizer reagent for exactly 1 min.
(e)
They were washed with ultrapure water twice for exactly 1 min, after which the water was removed.
(f)
They were immersed in a solution consisting of 25 mL Milli-Q® ultrapure water and 250 μL Silver Stain Enhancer reagent for exactly 5 min.
(g)
They were washed with ultrapure water twice for exactly 20 s, after which the water was removed.
(h)
They were immersed in a mixture of 25 mL Silver Stain Developer and 250 μL Silver Stain Enhancer for approximately 30 s until bands became visible.
(i)
The reaction was quickly stopped with 5% acetic acid solution.
Stained gels were analyzed on the scanner and with Bio-Rad’s ChemiDoc XRS + System software (Bio-Rad, Hercules, CA, USA). Since, after silver staining, differently colored bands were obtained, for their better observation, photos were also captured with a classic camera. All reagents used were of analytical grade from Merck and Sigma-Aldrich.
All samples were analyzed in triplicate, and the results were expressed as mean ± standard deviation (SD).

2.4. Statistical Analysis

Statistical analysis was implemented using GraphPad Software 9, Inc., San Diego, CA, USA. The basic descriptive statistics, like mean and standard deviation for continuous variables, were obtained. For every sample, we investigated whether there were any statistically significant differences between the means of lipid contents, methyl esters of fatty acids, content of protein and amino acids for analyzed soybeans and pea samples. Thereby, one-way ANOVA with post hoc Tukey tests for multiple comparisons to highlight which specific group’s means were different was used. The statistical significance level was considered at alpha = 5% (p ≤ 0.05).

3. Results

3.1. The Lipid Content of Soybeans

The results of the analysis of the total lipid content of the soybeans analyzed are presented in Table 5.
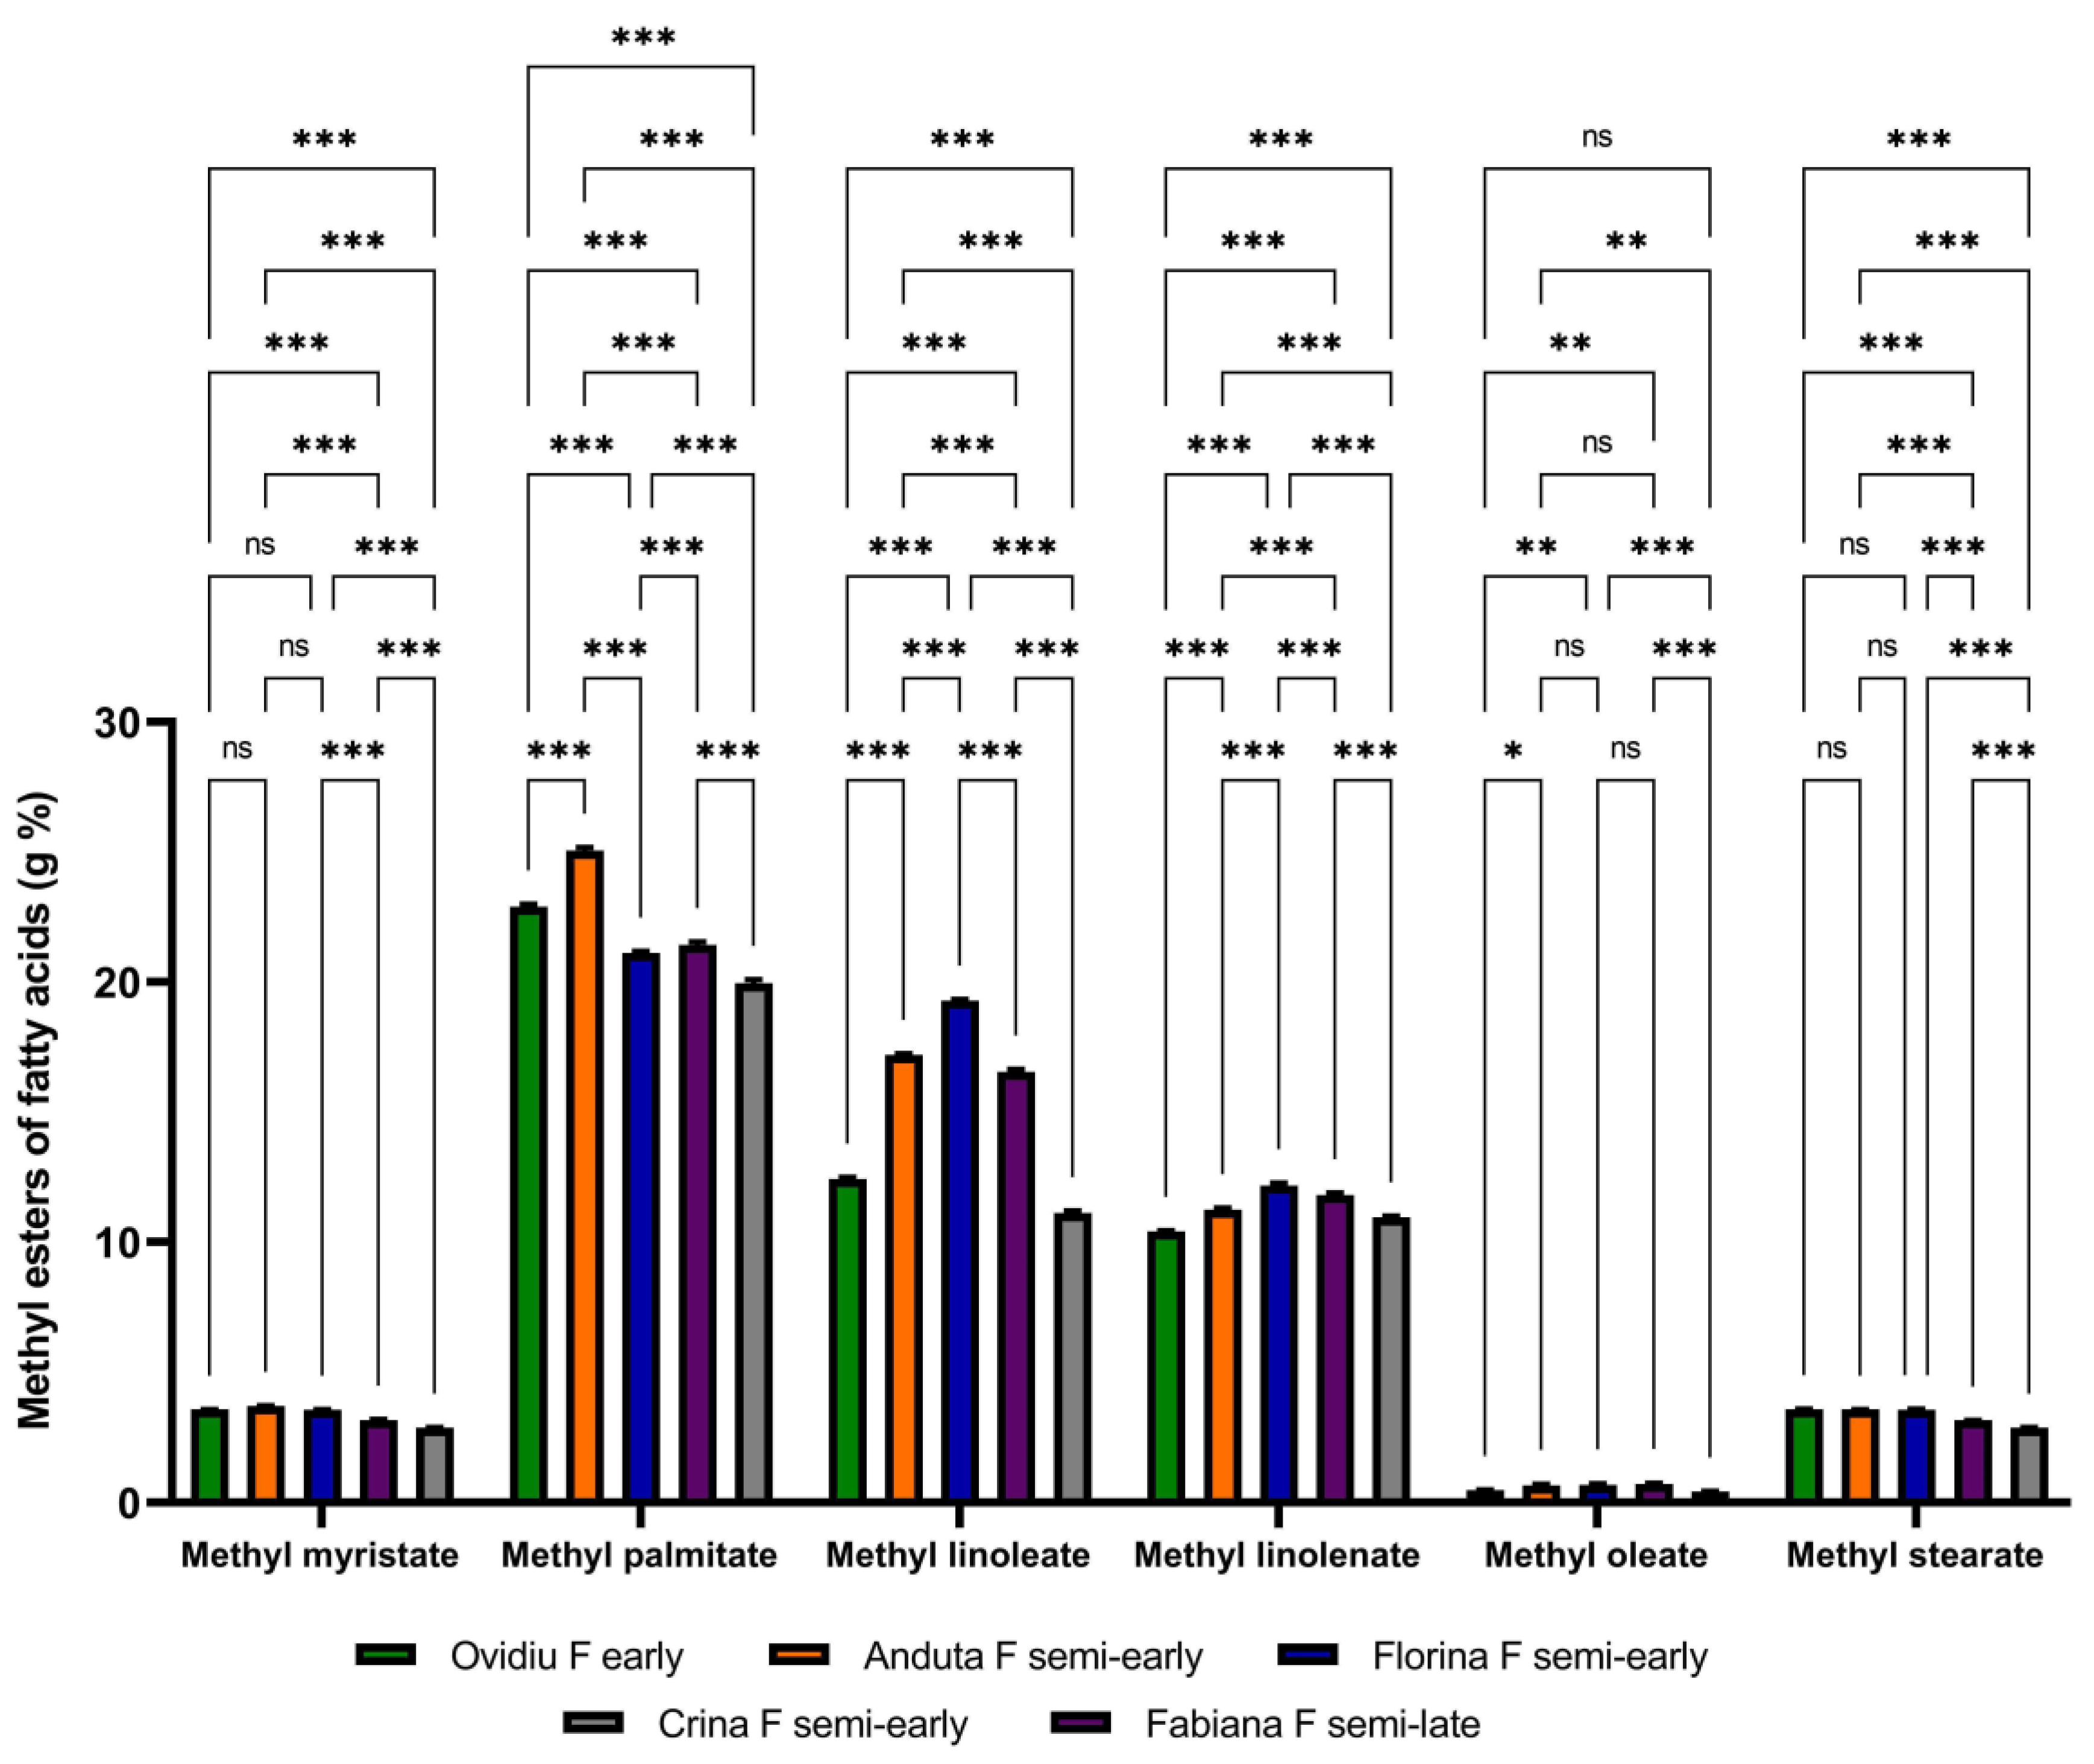
The distribution of the main methyl esters of fatty acids dosed in the samples of total lipid extracts obtained from soybeans from different varieties is presented in Figure 1 for the undiluted samples and in Figure 2 for the 1/10 diluted samples.
Using diluted samples represents a more accurate method because the areas are within the calibration range.

3.2. The Protein Content of Soybeans and Peas

Proteins are substances with a high nitrogen content, on average 16%. A reproducible and accurate method for evaluating the amount of protein in samples is the Kjeldahl method, which involves the dosage of protein nitrogen in the form of an ammonium ion. The transformation of organic nitrogen into inorganic nitrogen is called digestion and consists of the mineralization of the samples at high temperature (440 °C) in a concentrated sulfuric acid environment and in the presence of a disaggregation mixture. Nitrogen results in the formation of an ammonium ion, which is transformed into ammonia in the basic environment created with the help of a sodium hydroxide solution. The obtained sample was distilled, and the ammonia was retained in a 4% boric acid solution. The resulting mixture was titrated with 0.1 N HCl solution in the presence of the methyl orange indicator.
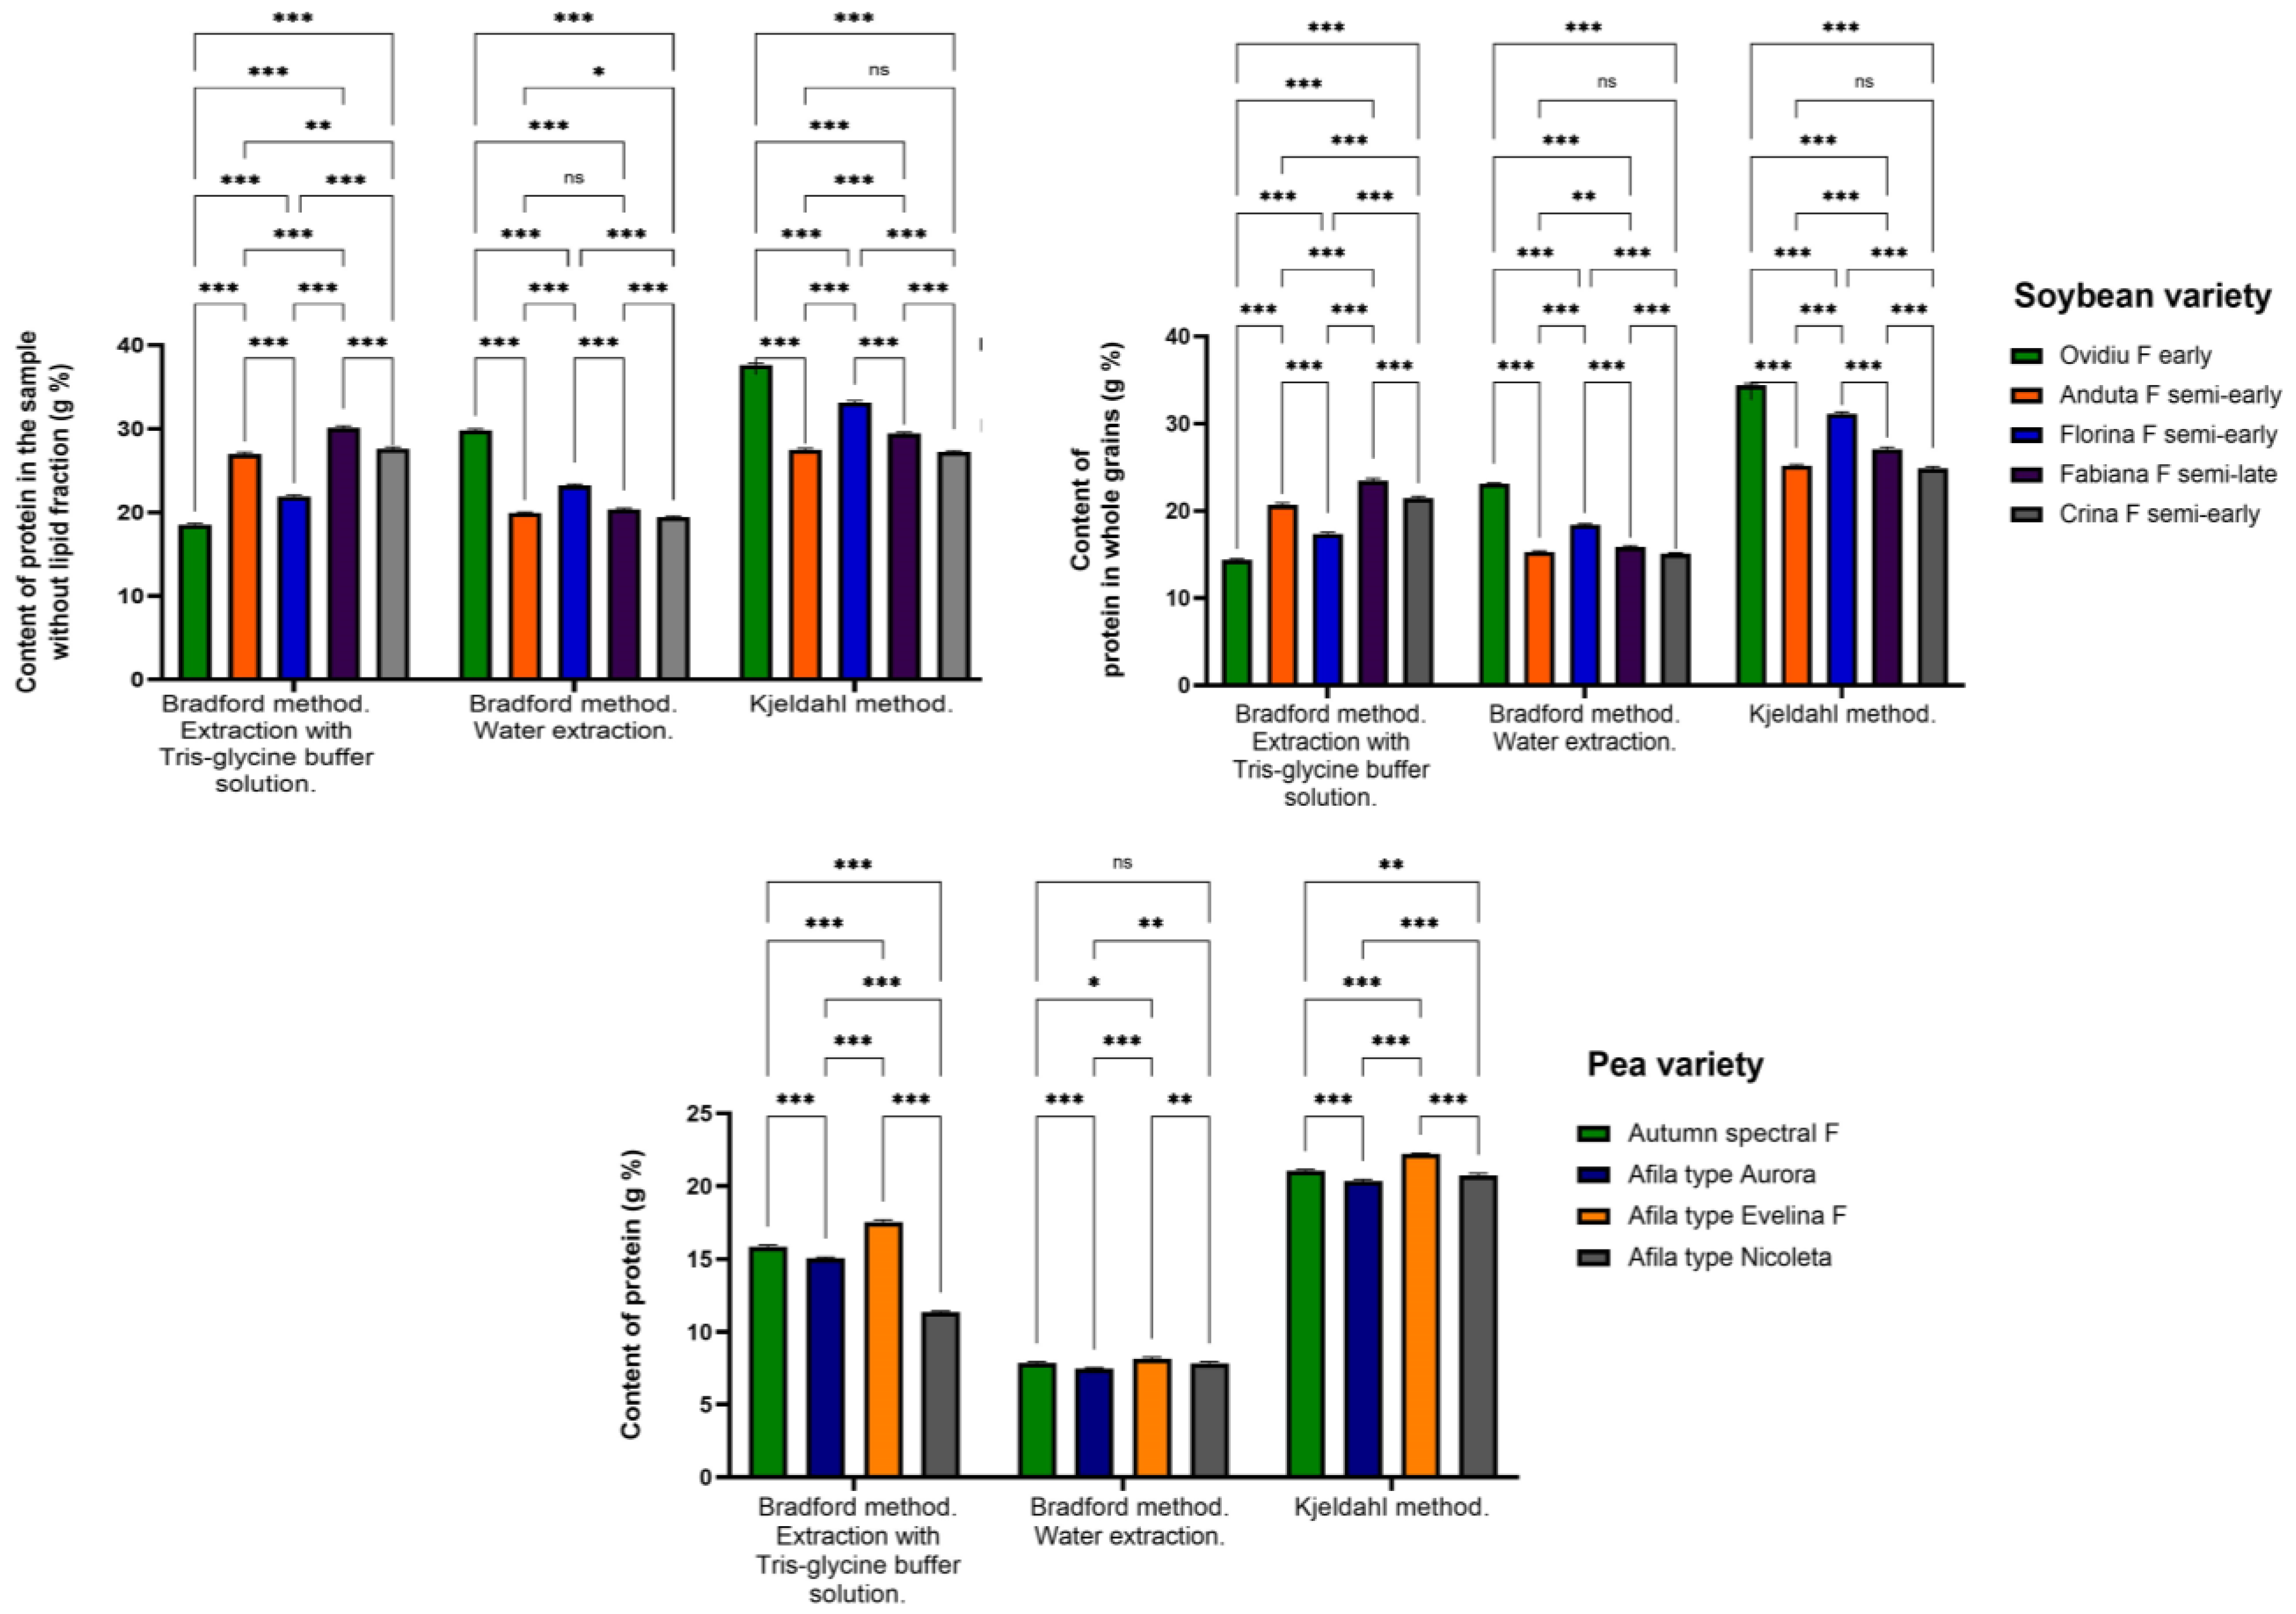
For protein contents, the post hoc Tukey test for multiple comparisons was performed at the level of each soybean sample (Ovidiu F early, Anduța F semi-early, Florina F semi-early, Fabiana F semi-late, Crina F semi-early) and pea type (Spectral F autumn, Aurora-type afila, Evelina F-type afila, Nicoleta-type afila) depending on the extraction method (Kjeldahl method and Bradford method by extraction with Tris-glycine buffer and by extraction with water) (Figure 3). No significant difference was found between the proteins content in whole grains of Anduța F semi-early and Crina F semi-early after water extraction using the Bradford (p = 0.674) and Kjeldahl methods (p = 0.245).
The Kjeldahl method is the most widely used method in research and quality control of protein determination, being more precise than other methods. The results obtained are different compared to those recorded using the Bradford method. The binding of Coomassie Brilliant Blue G-250® reagent is specific to each protein. Although reproducible, the method has errors for different types of proteins.
Amino acids are another complementary method of evaluating the amount of protein. By summing the amounts of amino acids, the amount of protein in the samples can be calculated. To dose them, protein hydrolysis was necessary, but amino acids are not volatile substances. A modern, precise, but difficult and expensive method is HPLC analysis. Due to the time-consuming nature of an HPLC analysis (more than 1 h for each injection, with the need for repeated washes due to precipitation of components in the elution mixture), an appropriate gas chromatography method was chosen. This method assumes that the amino acids resulting from protein hydrolysis are transformed into volatile derivatives, namely the grafting of trimethylsilyl groups. The amount of each amino acid can be calculated based on the standard curve.
The results of the analysis of amino acids from the soybean and pea samples analyzed are presented in Table 6 and Figure 4.
As can be seen from Table 6 and Figure 4, the highest content of amino acids with higher concentrations identified by analysis was exhibited by the Ovidiu F early variety (27.61%), and the Crina F semi-early variety had the lowest (9.91%). The pea samples analyzed from the Evelina F variety of the afila type presented the highest content of amino acids (16.87%) as can be seen from Figure 4.
The aqueous extracts had less conclusive and relevant results both for the dosage of total protein content and for the analysis of amino acid concentrations; therefore, they are not presented in the case of amino acid dosage. The amino acids methionine and tryptophan degrade during hydrolysis, even if 2-mercaptoethanol is introduced into the hydrolysis mixture for protection, because the conditions are very incisive, and as a result they cannot be dosed.
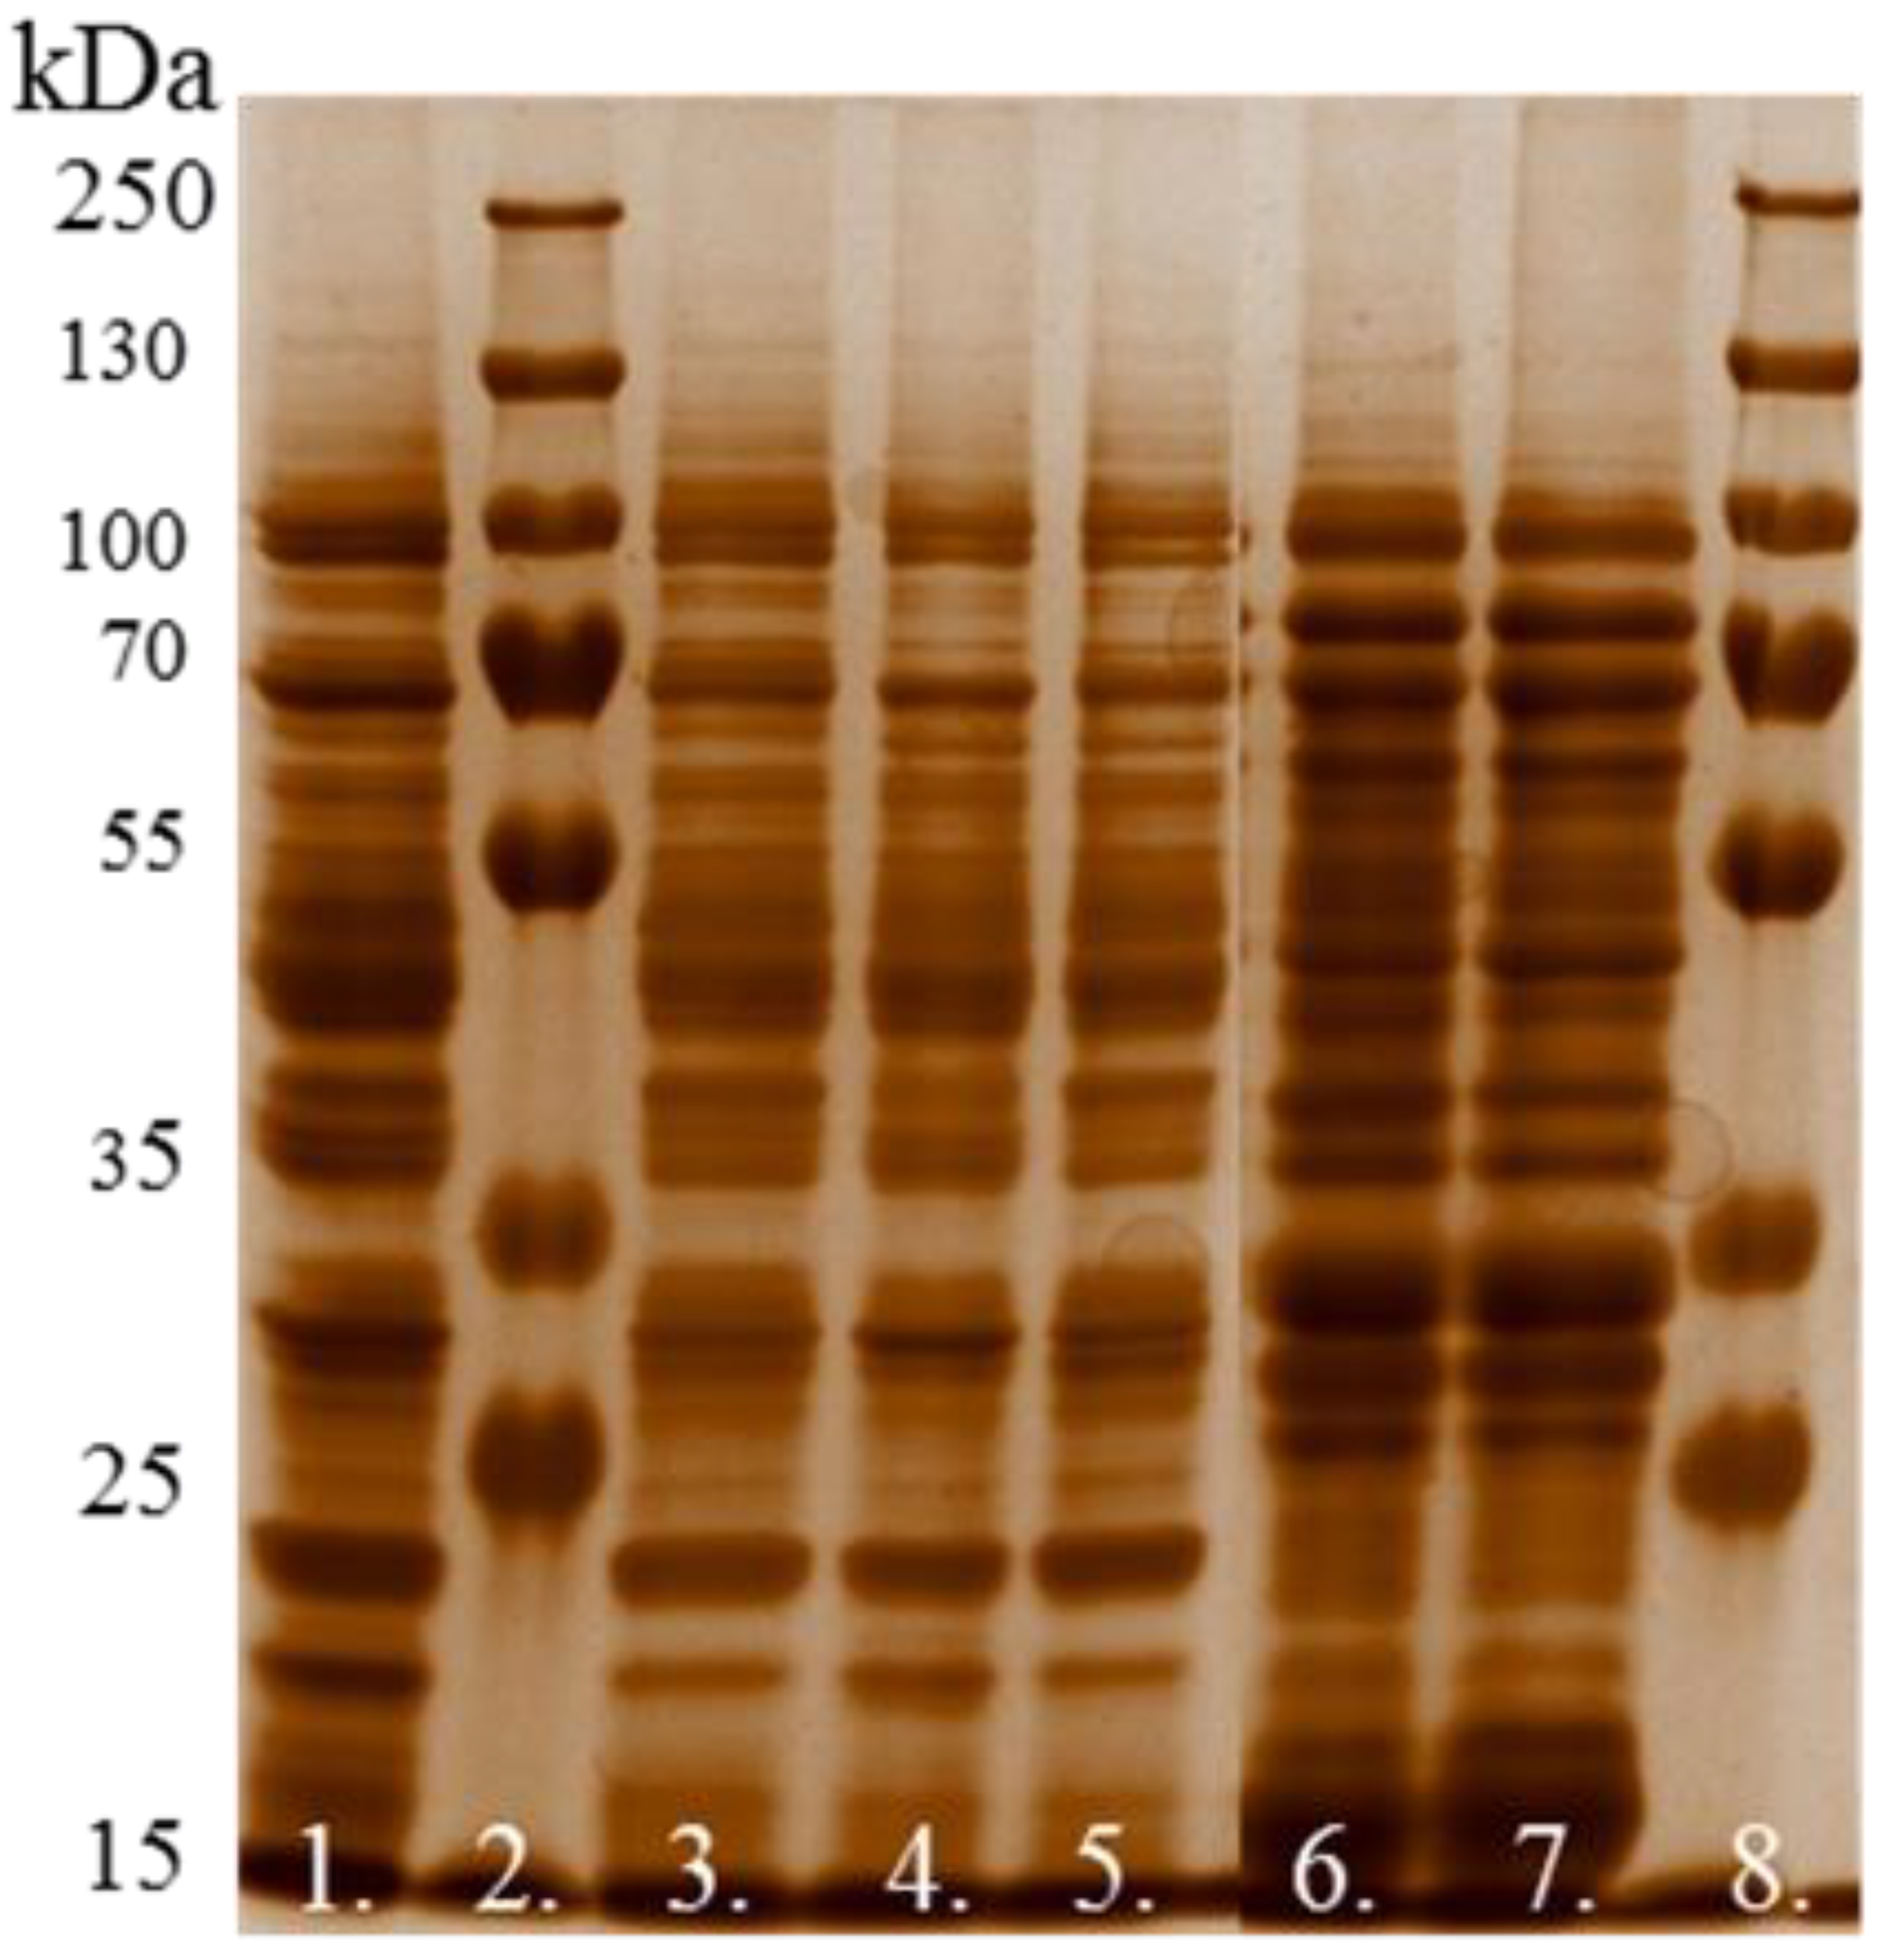
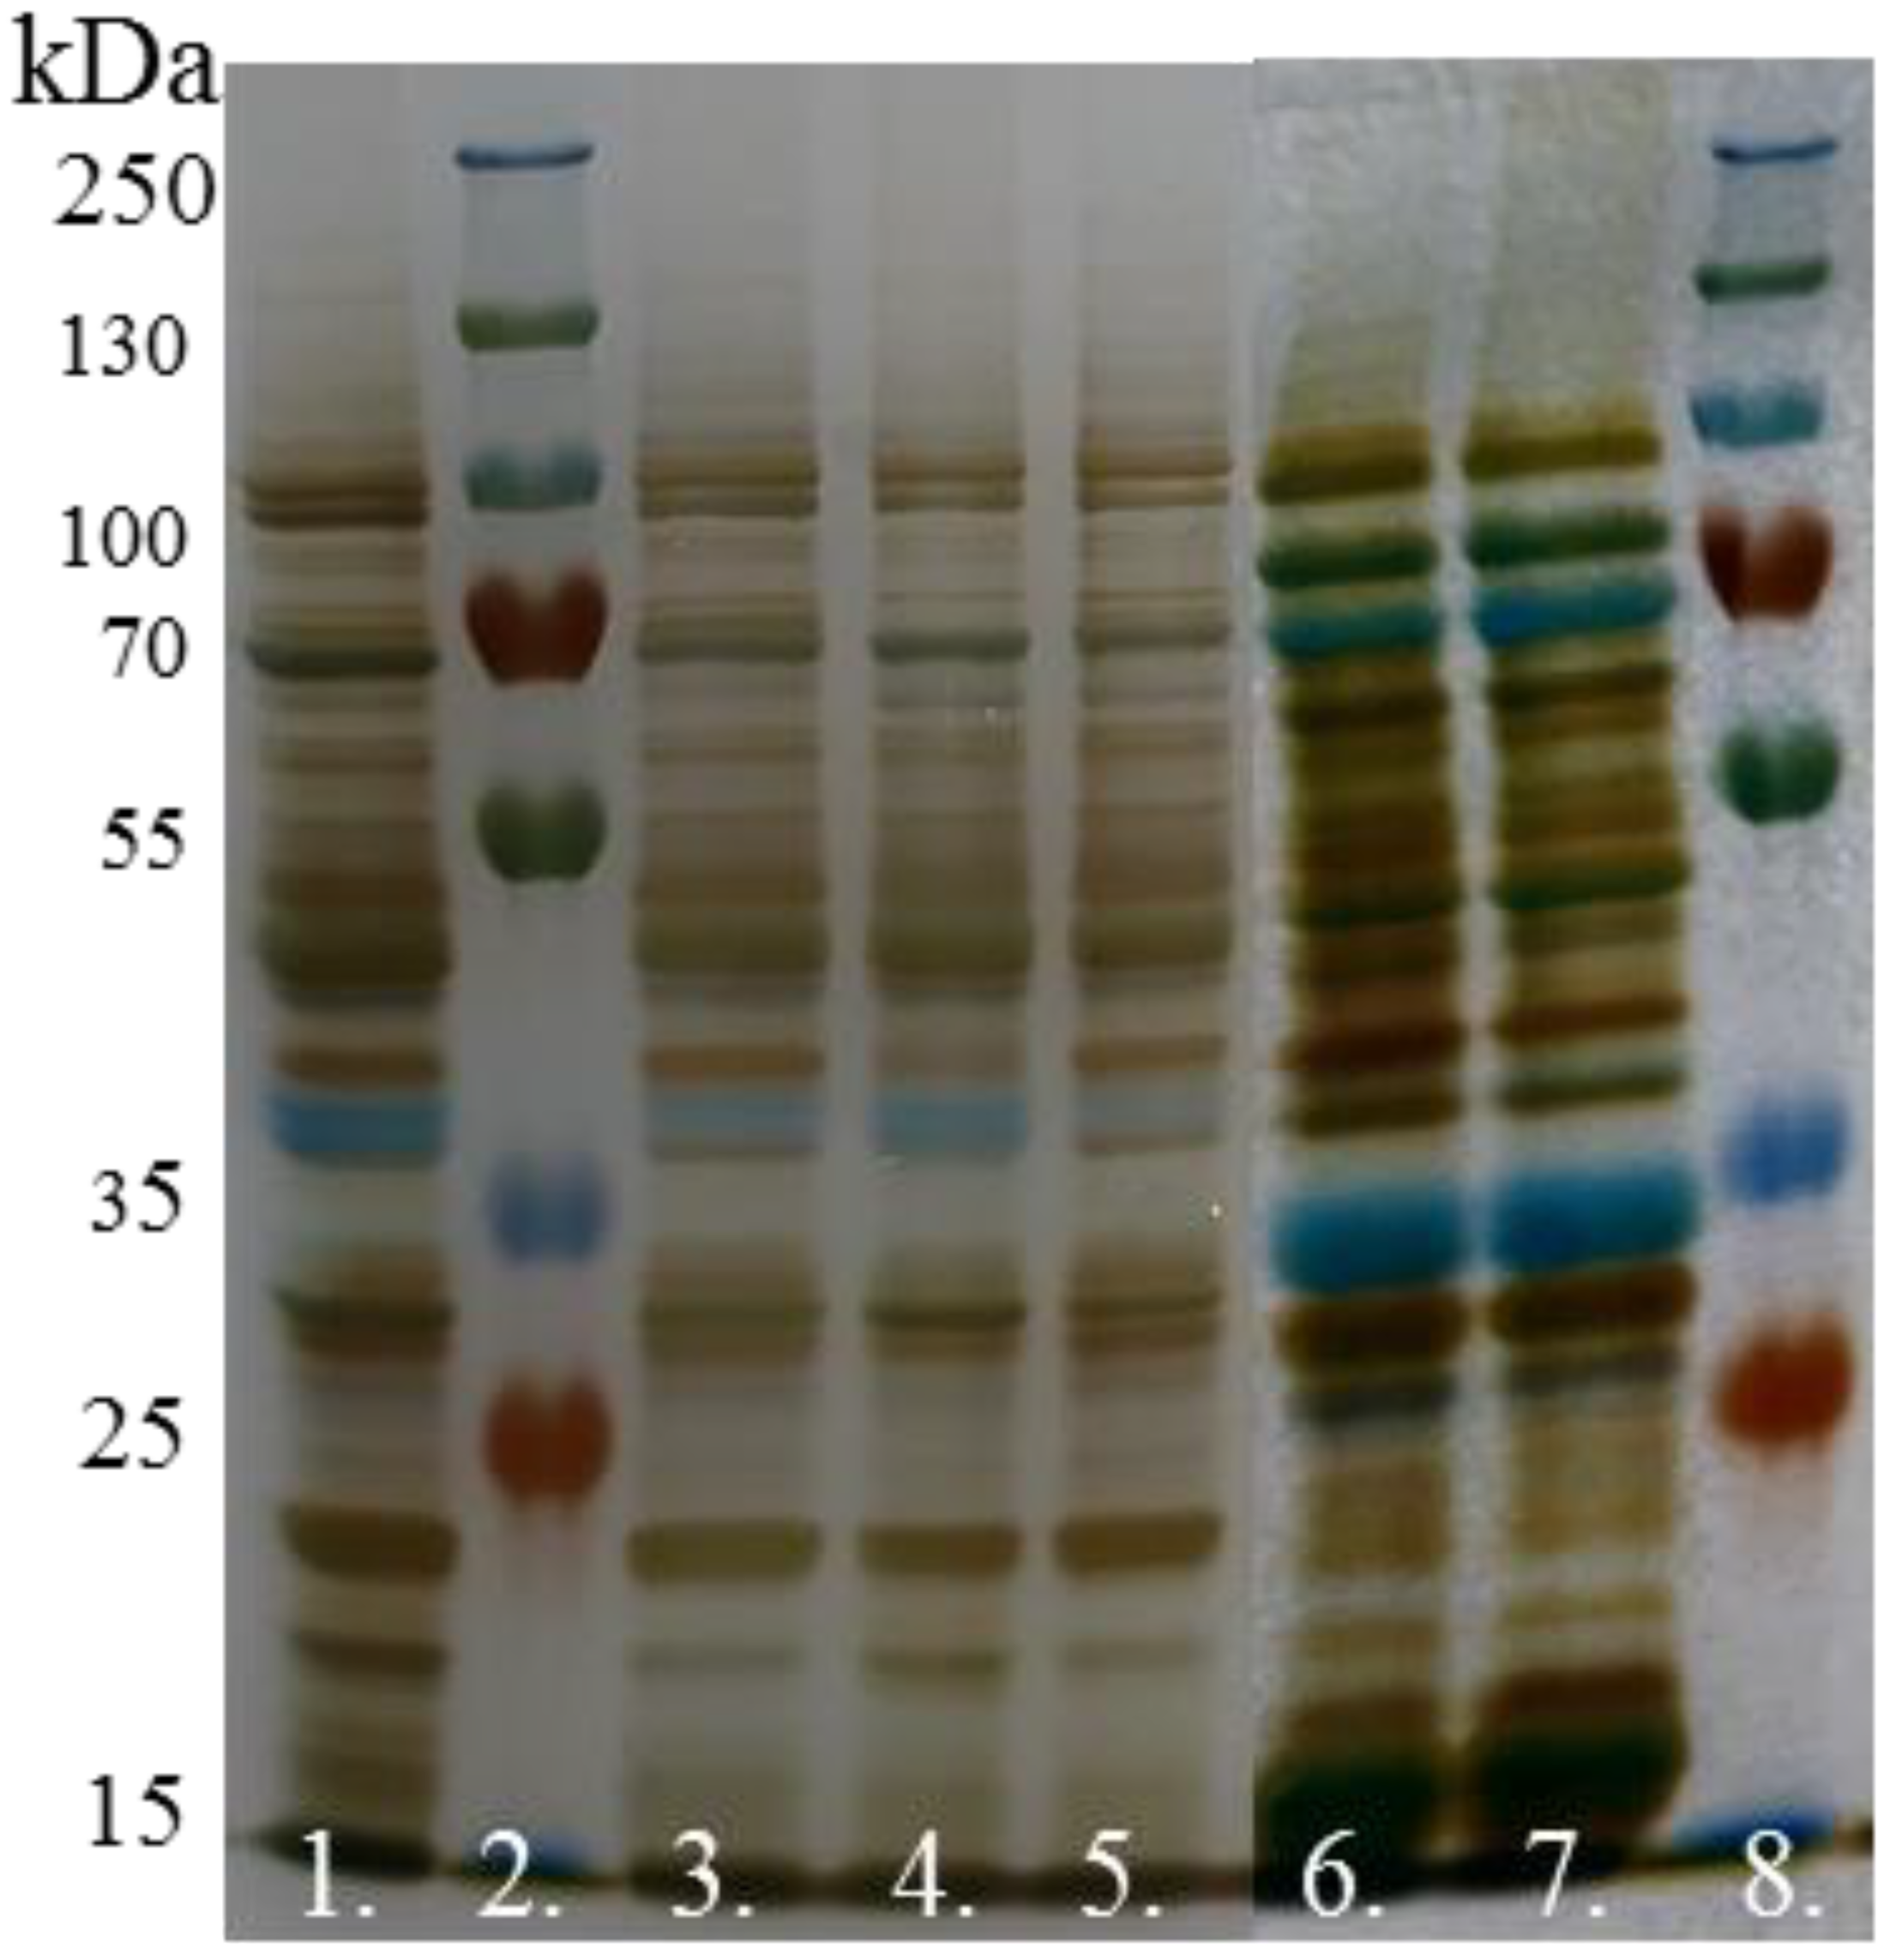
The electrophoresis of the samples carried out in the SDS-PAGE system is illustrated in Figure 5 and Figure 6:
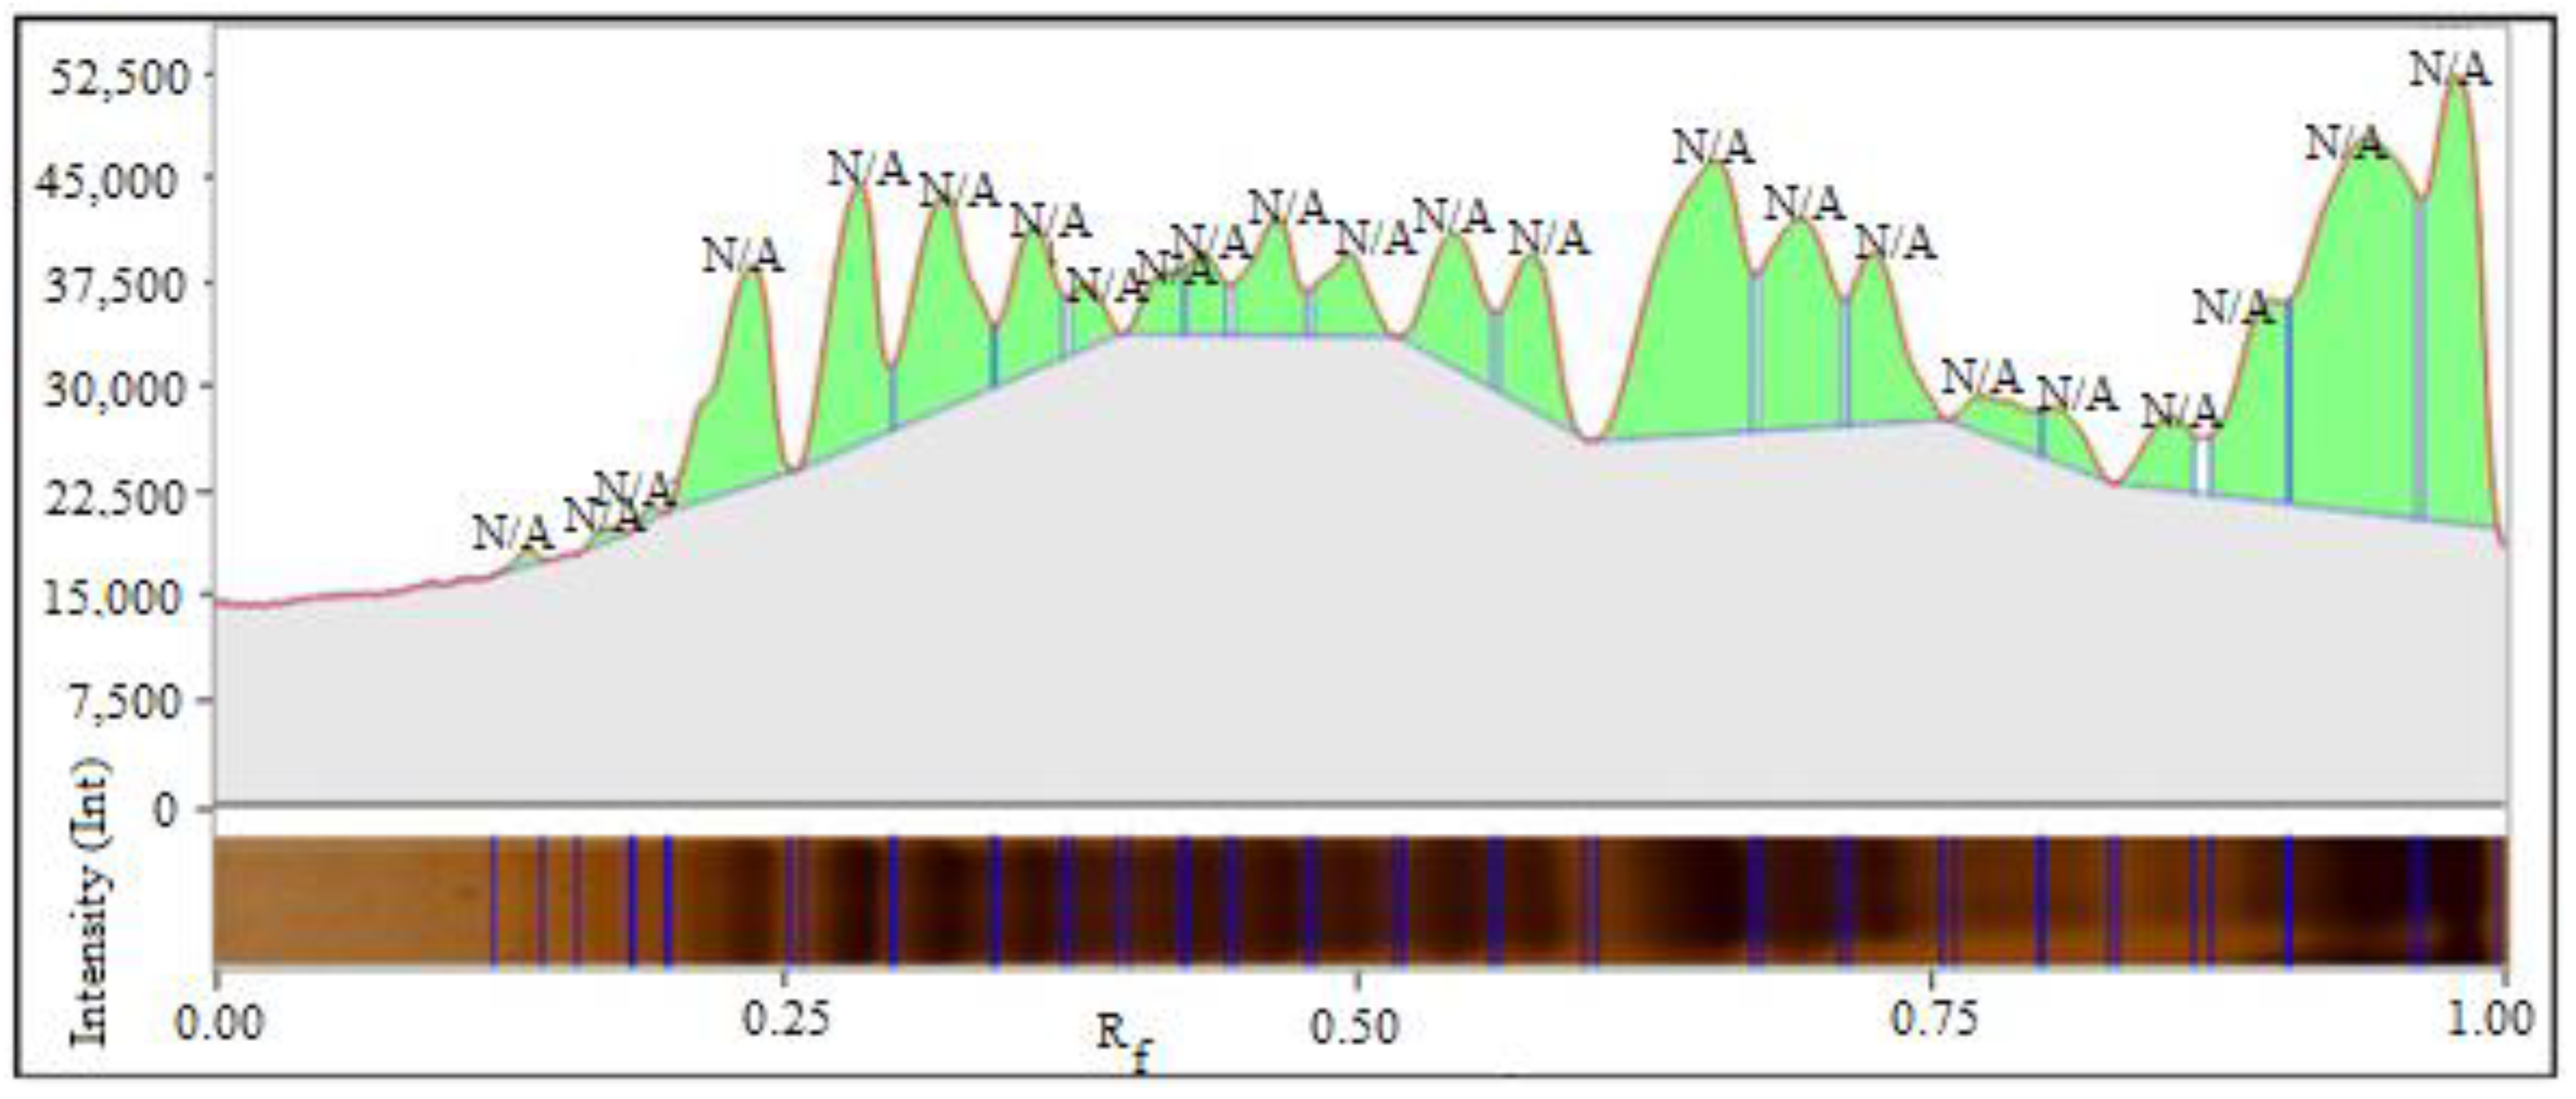
Analysis of molecular marker bands after Coomassie staining (Figure 7) and after silver staining (Figure 8).
As the samples showed intense and easily quantifiable bands after Coomassie staining, it was decided to apply the silver staining method only to certain samples for demonstration purposes (Figure 8). It can be seen that some bands that were almost completely masked after Coomassie staining became visible.
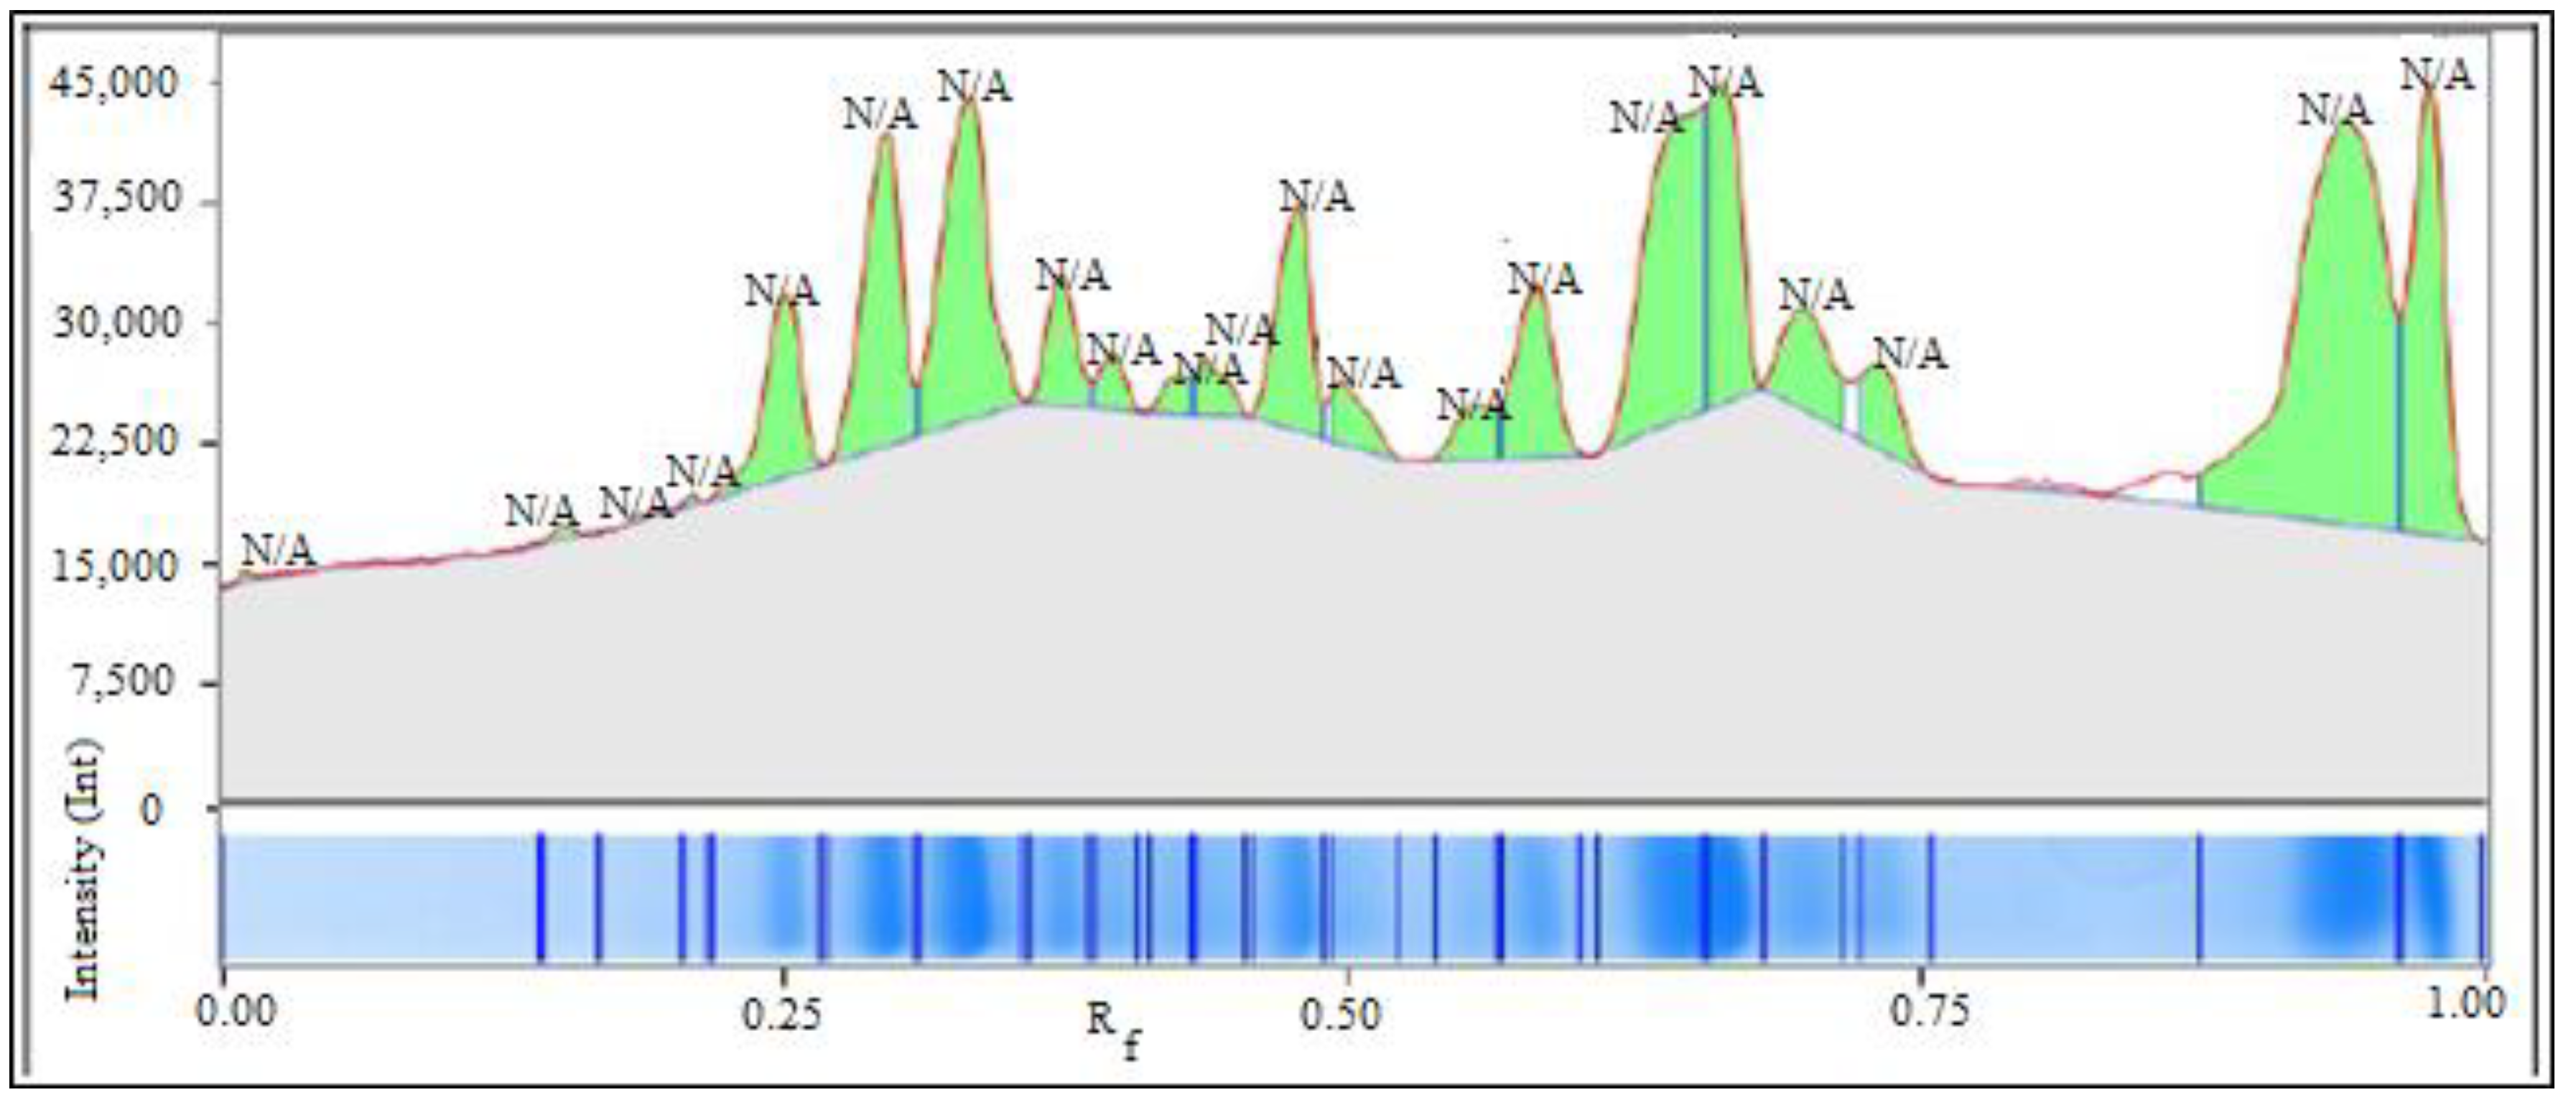
A comparative example is shown of band analysis for the Ovidiu soy protein sample extracted in tris-glycine, after staining with Coomassie (Figure 9) and with silver (Figure 10).
On examination with the naked eye, it was observed that the gels show bands of different colors after the silver staining. It was decided that, in addition to the examination with the scanner and with the appropriate software, a classic camera would also be used for clearer observation of the color differences (Figure 11).
The bands colored in blue, green, red (the molecular marker), dark green and brown can be seen. They show the different affinities of the multiple types of proteins present in the samples. However, the electrophoresis method is not an absolute method for either identification or determination. Electrophoresis performed in this way helps to observe proteins and their molecular masses, the fragments of which are more abundant and have special properties compared to the rest. A standard is needed for correct identification, as there are many varieties of proteins that may have molecular masses close to or even identical to the suspected protein in the sample. We are also talking in this case, and of course in other cases, of organisms with modified genomes that thus have the potential to produce protein species not studied or not known to exist in that sample.

4. Discussion

The nutritional evaluation of some assortments of vegetable products plays an essential role in their correct use in the diet of patients with various ailments. The development of hybrid species with different compositions in terms of the proportion of different macro- and micronutrients plays an important role in the selection of plant products more adapted to individual nutritional needs. For example, in renal failure, protein intake is restricted, and, in this sense, the varieties of vegetable products with a lower protein content are more indicated for consumption. In patients with dyslipidemia, the intake of dietary fats is restricted, and, consequently, the varieties with a reduced content of lipids are more indicated in the diet. In the case of sportspeople, the quality of amino acids is very important in protein sources, especially those amino acids involved in the regeneration of muscle mass (leucine, isoleucine, valine, lysine and, in particular, glutamine). Essential amino acids are found in smaller amounts in proteins of vegetable origin compared to those of animal origin, and consequently the development of plant species with a higher content of essential amino acids is particularly important for vegetarian diets. Essential amino acids are important for supporting the regeneration processes of the body and for strengthening the immune function. If the food valorization of vegetable lipids is pursued (as is the case with the soy vegetable product, which is an important source of proteins as well as lipids), hybrid species with a higher lipid content are more indicated for the purpose of valorizing the lipid fractions. Soybean oil is not only used in food but also in the pharmaceutical industry to obtain nutritional supplements (for example, hepatoprotective supplements indicated in fatty liver, a condition known as hepatic steatosis).
Lipids are an extremely important factor in determining the quality of soybeans but also in their use in food. Soybean oil is an oil used and appreciated in various areas of gastronomy due to its versatility [45]. Although there are no significant differences in the lipid content of the analyzed soybeans from the five used varieties, it is noted from Table 5 that the semi-early Anduța F variety has the highest content of total lipid extract (23.28%), and the semi-early Florina F variety has the lowest content of lipid extract (20.67%). Although soy lipids are rich in unsaturated fatty acids and therefore do not present an increased atherogenic risk, they still increase caloric intake [46]. As a result, in the diet of overweight people, it is recommended to consume soybeans that come from varieties with a lower lipid content. Varieties with high lipid content are recommended for obtaining edible oil but also for the pharmaceutical industry as a source of phospholipids [47,48]. The US FDA estimates 25 g/day of soy protein intake for cholesterol reduction, but there are no other formal recommendations. Some clinical and population studies which involved adults proposed approximately two to four servings per day [49].
According to the data obtained using the Kjeldahl method, soybeans from the early Ovidiu F variety have the highest protein content (34.41% in whole grains according to Figure 3), and the lowest content is the semi-early Crina F variety (24.88% in whole grains according to Figure 3), while in peas the highest protein content is found in the beans from the afila-type Evelina F variety (22.21% according to Figure 3), and the lowest content is found in the beans from the afila-type Aurora variety (20.33% according to Figure 3).
The analysis of the distribution of fatty acids in the composition of the total lipid extract isolated from soybeans highlights the predominance of unsaturated fatty acids and especially polyunsaturated ones (Figure 1 and Figure 2). The semi-early Anduta F variety has the highest content of essential fatty acids omega 6 (25.05% from Figure 2) and omega 3 (17.20% from Figure 2), and the semi-early Crina F the lowest content of essential fatty acids (11.12% from Figure 2). The highest content of omega 3 fatty acids is presented by the semi-early Florina F variety (19.29% from Figure 2), which is indicated in the diet of inflammatory diseases because it is known that the alpha linolenic polyunsaturated fatty acid has a good anti-inflammatory effect. Moreover, the semi-early Florina F variety is also indicated for the pharmaceutical industry as a source of omega 3 acid. Healthy diets recommend the predominant intake of unsaturated fats due to the beneficial effects, especially of the essential fatty acids’ omega 3 and omega 6 that lower serum cholesterol and have an important preventive role in metabolic diseases (diabetes, obesity, gout, cardiovascular diseases) but also in degenerative ones [50,51].
Proteins are some of the most important nutritional constituents because they are sources of essential amino acids necessary for the processes of regeneration, growth and also for the synthesis of antibodies [52]. Among the soybean samples analyzed, the Ovidiu F early and Florina F semi-early varieties had the highest percentages in protein content, as did the pea Evelina F afila and Spectral F fall varieties. These varieties with high protein content are indicated in the diet of vegetarians, children, the elderly and even athletes.
The results of the analysis of amino acids from the soybean and pea samples analyzed are in agreement with those obtained when measuring the total protein content. The soybean and pea varieties with high protein content have the richest content of essential amino acids (Table 6). Branched amino acids such as leucine, isoleucine and valine are valuable for restoring muscle mass; as a result, soybean and pea varieties with a high and implicit protein content and with an increased content of amino acids with increased biological value are indicated in the diet of performance athletes and also in the diet of the elderly to combat sarcopenia [53].
When the capitalization of natural extracts in order to obtain supplements or medicines is pursued, an analysis of compounds with toxic potential that can contaminate the plant products used as raw material (pesticides, toxic metals) is also necessary [54,55]. This is also the case with soybean and pea varieties that must be grown in the least polluted environment. It is also necessary to take into account the climatic factors that can influence the chemical composition of the crop varieties as well as the quality of the soil in order to obtain plant products that are as nutritious and safe for consumption as possible [56].

5. Conclusions

The present study evaluates the composition of the main nutrients from different soybean and pea hybrid varieties from which the beans were harvested. The varieties were developed to be used in food but also in the food industry to obtain bioactive extracts: lipid content, dosage and identification of fatty acids from soybeans, protein content and identification and dosage of essential amino acids. Furthermore, the analyses followed the identification of the most suitable varieties for different uses: obtaining edible oil or the fraction of essential fatty acids for the pharmaceutical industry and obtaining valuable sources of essential amino acids and quality proteins of vegetable origin. The newly analyzed soybean and pea varieties showed higher content of indispensable amino acid according to gas chromatography and proteins using Bradford and Kjeldahl methods. The obtained higher content of fatty amino acids for Andruta F and Florina F varieties provides these cultivars potential benefits in human health. The increase in protein content and in essential amino acids, even in relatively small proportions, represents a nutritional advantage for the plant species in the case of the obtained hybrids. The protein content of hybrid species cannot be spectacularly increased, but an increase of even 0.5% represents an important increase from a nutritional point of view. In vegetable products with exploitation of the lipid fraction, it is very important to develop hybrids that increase oil production.
Sustainable agriculture aims at the creation of nutritious and resistant plant varieties that can be used effectively both in balanced human nutrition and for obtaining extracts with therapeutic properties.

Supplementary Materials

The following supporting information can be downloaded at: https://www.mdpi.com/article/10.3390/app13158724/s1, Figure S1: Calibration curve for the analysis of methyl esters.; Figure S2: Calibration curve for amino acids analysis.

Author Contributions

Conceptualization, E.M., C.E.L., I.D.R., A.I.R. and M.L.; methodology, A.M.M. and S.M.N.; software, O.K.; validation, A.M.M., M.M. and A.I.R.; formal analysis, O.K., I.D.R., E.I.I. and D.C.; investigation, I.B.V., E.I.I. and S.M.N.; resources, A.I.R. and A.M.D.; data curation, S.M.N. and D.C.; writing—original draft preparation, I.B.V., A.M.M. and A.I.R.; writing—review and editing, M.M. and A.M.M.; visualization, M.M.; supervision, A.C.P.; project administration, E.M., C.E.L., I.D.R., A.I.R. and M.L.; funding acquisition, A.M.D. and A.C.P. All authors have read and agreed to the published version of the manuscript.

Funding

This research received no external funding.

Institutional Review Board Statement

Not applicable.

Informed Consent Statement

Not applicable.

Data Availability Statement

Not applicable.

Conflicts of Interest

The authors declare no conflict of interest.

References

  1. Willis, H. Growing Great Soybeans. Acres USA 1989, 1, 6–8. Available online: http://eap.mcgill.ca/CPSO_3.htm (accessed on 10 February 2023).
  2. Stacey, G. Genetics and Genomics of Soybean; Springer: New York, NY, USA, 2008; eBook; ISBN 978-0-387-72299-3. [Google Scholar] [CrossRef]
  3. Perkins, E.G. Composition of Soybeans and Soybean Products. In Practical Handbook of Soybean Processing and Utilization; Erickson, D.R., Ed.; AOCS Press: Champaign, IL, USA, 1995; pp. 9–28. [Google Scholar] [CrossRef]
  4. Navarro, D.M.D.L.; Abelilla, J.J.; Stein, H.H. Structures and characteristics of carbohydrates in diets fed to pigs: A review. J. Anim. Sci. Biotechnol. 2019, 10, 39. [Google Scholar] [CrossRef] [PubMed]
  5. Ioniță-Mîndrican, C.-B.; Ziani, K.; Mititelu, M.; Oprea, E.; Neacșu, S.M.; Moroșan, E.; Dumitrescu, D.-E.; Roșca, A.C.; Drăgănescu, D.; Negrei, C. Therapeutic Benefits and Dietary Restrictions of Fiber Intake: A State of the Art Review. Nutrients 2022, 14, 2641. [Google Scholar] [CrossRef] [PubMed]
  6. Deng, K.; Huang, Y.; Hua, Y. Isolation of glycinin (11S) from lipid-reduced soybean flour: Effect of processing conditions on yields and purity. Molecules 2012, 17, 2968–2979. [Google Scholar] [CrossRef] [PubMed] [Green Version]
  7. Wang, Z.; Li, Y.; Jiang, L.; Qi, B.; Zhou, L. Relationship between Secondary Structure and Surface Hydrophobicity of Soybean Protein Isolate Subjected to Heat Treatment. J. Chem. 2014, 2014, 475389. [Google Scholar] [CrossRef] [Green Version]
  8. Silva, S.S.; Fernandes, E.; Pina, S.; Silva-Correia, J.; Vieira, S.; Oliveira, J.; Reis, R.L. 2.11 Polymers of Biological Origin. Comprehensive Biomaterials II; Ducheyne, P., Ed.; Elsevier: Amsterdam, The Netherlands, 2017; pp. 228–252. ISBN 9780081006924. [Google Scholar] [CrossRef] [Green Version]
  9. Fukushima, D.; Proteins, S.; Phillips, G.O.; Williams, P.A. (Eds.) Handbook of Food Proteins; Woodhead Publishing: Cambridge, UK, 2011; pp. 210–232. [Google Scholar] [CrossRef]
  10. Iritani, N.; Hosomi, H.; Fukuda, H.; Tada, K.; Ikeda, H. Soybean protein suppresses hepatic lipogenic enzyme gene expression in Wistar fatty rats. J. Nutr. 1996, 126, 380–388. [Google Scholar] [CrossRef] [Green Version]
  11. Gilani, G.S.; Xiao, C.W.; Cockell, K.A. Impact of antinutritional factors in food proteins on the digestibility of protein and the bioavailability of amino acids and on protein quality. Br. J. Nutr. 2012, 108, S315–S332. [Google Scholar] [CrossRef] [Green Version]
  12. Doerge, D.R.; Sheehan, D.M. Goitrogenic and estrogenic activity of soy isoflavones. Environ. Health Perspect. 2002, 110, 349–353. [Google Scholar] [CrossRef] [Green Version]
  13. Ahnen, R.T.; Jonnalagadda, S.S.; Slavin, J.L. Role of plant protein in nutrition, wellness, and health. Nutr. Rev. 2019, 77, 735–747. [Google Scholar] [CrossRef]
  14. Ho, S.C.; Woo, J.L.; Leung, S.S.; Sham, A.L.; Lam, T.H.; Janus, E.D. Intake of soy products is associated with better plasma lipid profiles in the Hong Kong Chinese population. J. Nutr. 2000, 130, 2590–2593. [Google Scholar] [CrossRef] [Green Version]
  15. Huang, H.; Krishnan, H.B.; Pham, Q.; Yu, L.L.; Wang, T.T.Y. Soy and Gut Microbiota: Interaction and Implication for Human Health. J. Agric. Food Chem. 2016, 64, 8695–8709. [Google Scholar] [CrossRef]
  16. Rosell, M.S.; Appleby, P.N.; Spencer, E.A.; Key, T.J. Soy intake and blood cholesterol concentrations: A cross-sectional study of 1033 pre- and postmenopausal women in the Oxford arm of the European Prospective Investigation into Cancer and Nutrition. Am. J. Clin. Nutr. 2004, 80, 1391–1396. [Google Scholar] [CrossRef] [Green Version]
  17. Tokede, O.A.; Onabanjo, T.A.; Yansane, A.; Gaziano, J.M.; Djoussé, L. Soya products and serum lipids: A meta-analysis of randomised controlled trials. Br. J. Nutr. 2015, 114, 831–843. [Google Scholar] [CrossRef] [Green Version]
  18. Messina, M.; Nagata, C.; Wu, A.H. Estimated Asian adult soy protein and isoflavone intakes. Nutr. Cancer 2006, 55, 1–12. [Google Scholar] [CrossRef]
  19. Devi, M.K.A.; Gondi, M.; Sakthivelu, G.; Giridhar, P.; Rajasekaran, T.; Ravishankar, G.A. Functional attributes of soybean seeds and products, with reference to isoflavone content and antioxidant activity. Food Chem. 2009, 114, 771–776. [Google Scholar] [CrossRef]
  20. Liu, X.X.; Li, S.H.; Chen, J.Z.; Sun, K.; Wang, X.J.; Wang, X.G.; Hui, R.T. Effect of soy isoflavones on blood pressure: A meta-analysis of randomized controlled trials. Nutr. Metab. Cardiovasc. Dis. 2012, 22, 463–470. [Google Scholar] [CrossRef]
  21. Nagata, C. Ecological study of the association between soy product intake and mortality from cancer and heart disease in Japan. Int. J. Epidemiol. 2000, 29, 832–836. [Google Scholar] [CrossRef]
  22. Kim, M.K.; Kim, J.H.; Nam, S.J.; Ryu, S.; Kong, G. Dietary intake of soy protein and tofu in association with breast cancer risk based on a case-control study. Nutr. Cancer 2008, 60, 568–576. [Google Scholar] [CrossRef]
  23. Andreani, G.; Sogari, G.; Marti, A.; Froldi, F.; Dagevos, H.; Martini, D. Plant-Based Meat Alternatives: Technological, Nutritional, Environmental, Market, and Social Challenges and Opportunities. Nutrients 2023, 15, 452. [Google Scholar] [CrossRef]
  24. Kumari, T.; Deka, S.C. Potential healthbenefits of garden pea seeds and pods: A review. Legume Sci. 2021, 3, e82. [Google Scholar] [CrossRef]
  25. Shanthakumar, P.; Klepacka, J.; Bains, A.; Chawla, P.; Dhull, S.B.; Najda, A. The Current Situation of Pea Protein and Its Application in the Food Industry. Molecules 2022, 27, 5354. [Google Scholar] [CrossRef] [PubMed]
  26. Lu, Z.X.; He, J.F.; Zhang, Y.C.; Bing, D.J. Composition, physicochemical properties of pea protein and its application in functional foods. Crit. Rev. Food Sci. Nutr. 2020, 60, 2593–2605. [Google Scholar] [CrossRef] [PubMed]
  27. Stone, A.K.; Karalash, A.; Tyler, R.T.; Warkentin, T.D.; Nickerson, M.T. Functional attributes of pea protein isolates prepared using different extraction methods and cultivars. Food Res. Int. 2015, 76, 31–38. [Google Scholar] [CrossRef]
  28. Lam, A.C.Y.; Can Karaca, A.; Tyler, R.T.; Nickerson, M.T. Pea protein isolates: Structure, extraction, and functionality. Food Rev. Int. 2018, 34, 126–147. [Google Scholar] [CrossRef]
  29. Ioniţă, A.C.; Ghica, M.; Moroşan, E.; Nicolescu, F.; Mititelu, M. In vitro effects of some synthesized aminoacetanilide N’-substituted on human leukocytes separated from peripheral blood. Farmacia 2019, 67, 684–690. [Google Scholar] [CrossRef]
  30. Ge, J.; Sun, C.X.; Corke, H.; Gul, K.; Gan, R.Y.; Fang, Y. The health benefits, functional properties, modifications, and applications of pea (Pisum sativum L.) protein: Current status, challenges, and perspectives. Compr. Rev. Food Sci. Food Saf. 2020, 19, 1835–1876. [Google Scholar] [CrossRef]
  31. Philipp, C.; Emin, M.A.; Buckow, R.; Silcock, P.; Oey, I. Pea protein-fortified extruded snacks: Linking melt viscosity and glass transition temperature with expansion behaviour. J. Food Eng. 2018, 217, 93–100. [Google Scholar] [CrossRef]
  32. Barac, M.B.; Pesic, M.B.; Stanojevic, S.P.; Kostic, A.Z.; Cabrilo, S.B. Techno-functional properties of pea (Pisum sativum) protein isolates: A review. Acta Period. Technol. 2015, 46, 1–18. [Google Scholar] [CrossRef] [Green Version]
  33. Sedeek, K.E.M.; Mahas, A.; Mahfouz, M. Plant Genome Engineering for Targeted Improvement of Crop Traits. Front. Plant Sci. 2019, 10, 114. [Google Scholar] [CrossRef] [Green Version]
  34. Available online: https://www.incda-fundulea.ro/fise/fise.html (accessed on 28 May 2023).
  35. Mititelu, M.; Neacsu, S.M.; Oprea, E.; Dumitrescu, D.-E.; Nedelescu, M.; Drăgănescu, D.; Nicolescu, T.O.; Rosca, A.C.; Ghica, M. Black Sea Mussels Qualitative and Quantitative Chemical Analysis: Nutritional Benefits and Possible Risks through Consumption. Nutrients 2022, 14, 964. [Google Scholar] [CrossRef]
  36. Mititelu, M.; Udeanu, D.I.; Nedelescu, M.; Neacsu, S.M.; Nicoara, A.C.; Oprea, E.; Ghica, M. Quality Control of Different Types of Honey and Propolis Collected from Romanian Accredited Bee-Keepers and Consumer’s Risk Assessment. Crystals 2022, 12, 87. [Google Scholar] [CrossRef]
  37. Mehraj, S.S.; Kamili, A.N.; Nazir, R.; Haq, E.; Balkhi, H.M. Comparative evaluation of extraction methods for total proteins from Crocus sativus L. (Saffron). Saudi J. Biol. Sci. 2018, 25, 1603–1608. [Google Scholar] [CrossRef] [Green Version]
  38. Bradford, M.M. A rapid and sensitive method for the quantitation of microgram quantities of protein utilizing the principle of protein-dye binding. Anal. Biochem. 1976, 72, 248–254. [Google Scholar] [CrossRef]
  39. Tsugita, A.; Scheffler, J.-J. A Rapid Method for Acid Hydrolysis of Protein with a Mixture of Trifluoroacetic Acid and Hydrochloric acid. Eur. J. Biochem. 1982, 124, 585–588. [Google Scholar] [CrossRef]
  40. Csapó, J.; Csapó-Kiss, Z.; Wágner, L.; Tálos, T.; Martin, T.G.; Folestad, S.; Tivesten, A.; Némethy, S. Hydrolysis of proteins performed at high temperatures and for short times with reduced racemization, in order to determine the enantiomers of D- and L-amino acids. Anal. Chim. Acta 1997, 339, 99–107. [Google Scholar] [CrossRef]
  41. Fritsch, R.J.; Krause, I. Electrophoresis. In Encyclopedia of Food Sciences and Nutrition, 2nd ed.; Caballero, B., Trugo, L., Finglas, P.M., Eds.; Academic Press: New York, NY, USA, 2003; pp. 2055–2062. [Google Scholar]
  42. Gas, B. Electrophoresis Principles. In Encyclopedia of Analytical Science, 2nd ed.; Worsfold, P., Townshend, A., Poole, C., Eds.; Elsevier: Amsterdam, The Netherlands, 2005; pp. 363–370. [Google Scholar]
  43. Council of Europe. European Pharmacopoeia, 10th ed.; EDQM, Council of Europe: Strasbourg, France, 2019. [Google Scholar]
  44. Morosan, E.; Secareanu, A.A.; Musuc, A.M.; Mititelu, M.; Ionită, A.C.; Ozon, E.A.; Raducan, I.D.; Rusu, A.I.; Dărăban, A.M.; Karampelas, O. Comparative Quality Assessment of Five Bread Wheat and Five Barley Cultivars Grown in Romania. Int. J. Environ. Res. Public Health 2022, 19, 11114. [Google Scholar] [CrossRef]
  45. De Maria, M.; Robinson, E.J.Z.; Kangile, J.R.; Kadigi, R.; Dreoni, I.; Couto, M.; Howai, N.; Peci, J.; Fiennes, S. Global Soybean Trade. The Geopolitics of a Bean; UK Research and Innovation Global Challenges Research Fund (UKRI GCRF) Trade, Development and the Environment Hub: London, UK, 2020. [Google Scholar] [CrossRef]
  46. Visioli, F.; Poli, A. Fatty Acids and Cardiovascular Risk. Evidence, Lack of Evidence, and Diligence. Nutrients 2020, 12, 3782. [Google Scholar] [CrossRef]
  47. Kim, I.S.; Kim, C.H.; Yang, W.S. Physiologically Active Molecules and Functional Properties of Soybeans in Human Health-A Current Perspective. Int. J. Mol. Sci. 2021, 22, 4054. [Google Scholar] [CrossRef]
  48. Viñado, A.; Castillejos, L.; Barroeta, A.C. Soybean Lecithin High in Free Fatty Acids for Broiler Chicken Diets: Impact on Performance, Fatty Acid Digestibility and Saturation Degree of Adipose Tissue. Animals 2019, 9, 802. [Google Scholar] [CrossRef] [Green Version]
  49. Messina, M. Soy and Health Update: Evaluation of the clinical and epidemiologic literature. Nutrients 2016, 8, 754. [Google Scholar] [CrossRef] [Green Version]
  50. Paduraru, D.N.; Coman, F.; Ozon, E.A.; Gherghiceanu, F.; Andronic, O.; Ion, D.; Stanescu, M.; Bolocan, A. The use of nutritional supplement in romanian patients—Attitudes and beliefs. Farmacia 2019, 67, 1060–1065. [Google Scholar] [CrossRef]
  51. Djuricic, I.; Calder, P.C. Beneficial Outcomes of Omega-6 and Omega-3 Polyunsaturated Fatty Acids on Human Health: An Update for 2021. Nutrients 2021, 13, 2421. [Google Scholar] [CrossRef] [PubMed]
  52. Church, D.D.; Hirsch, K.R.; Park, S.; Kim, I.Y.; Gwin, J.A.; Pasiakos, S.M.; Wolfe, R.R.; Ferrando, A.A. Essential Amino Acids and Protein Synthesis: Insights into Maximizing the Muscle and Whole-Body Response to Feeding. Nutrients 2020, 12, 3717. [Google Scholar] [CrossRef] [PubMed]
  53. Mann, G.; Mora, S.; Madu, G.; Adegoke, O.A.J. Branched-Chain Amino Acids: Catabolism in Skeletal Muscle and Implications for Muscle and Whole-Body Metabolism. Front. Physiol. 2021, 12, 702826. [Google Scholar] [CrossRef]
  54. Mititelu, M.; Moroșan, E.; Nicoară, A.C.; Secăreanu, A.A.; Musuc, A.M.; Atkinson, I.; Cusu, J.P.; Nițulescu, G.M.; Ozon, E.A.; Sarbu, I.; et al. Development of immediate release tablets containing calcium lactate synthetized from Black Sea mussel shells. Mar. Drugs 2022, 20, 45. [Google Scholar] [CrossRef]
  55. Mititelu, M.; Stanciu, G.; Drăgănescu, D.; Ioniță, A.C.; Neacșu, S.M.; Dinu, M.; Stefanvan Staden, R.-I.; Moroșan, E. Mussel Shells, a Valuable Calcium Resource for the Pharmaceutical Industry. Mar. Drugs 2022, 20, 25. [Google Scholar] [CrossRef]
  56. Jassim Aziz, R.; Mihele, D.; Dogaru, E. Study Regarding the Influence of Vitis vinifera Fruit (Muscat of Hamburg Species) On Some Biochemical Parameters. Farmacia 2010, 58, 332–340. [Google Scholar]
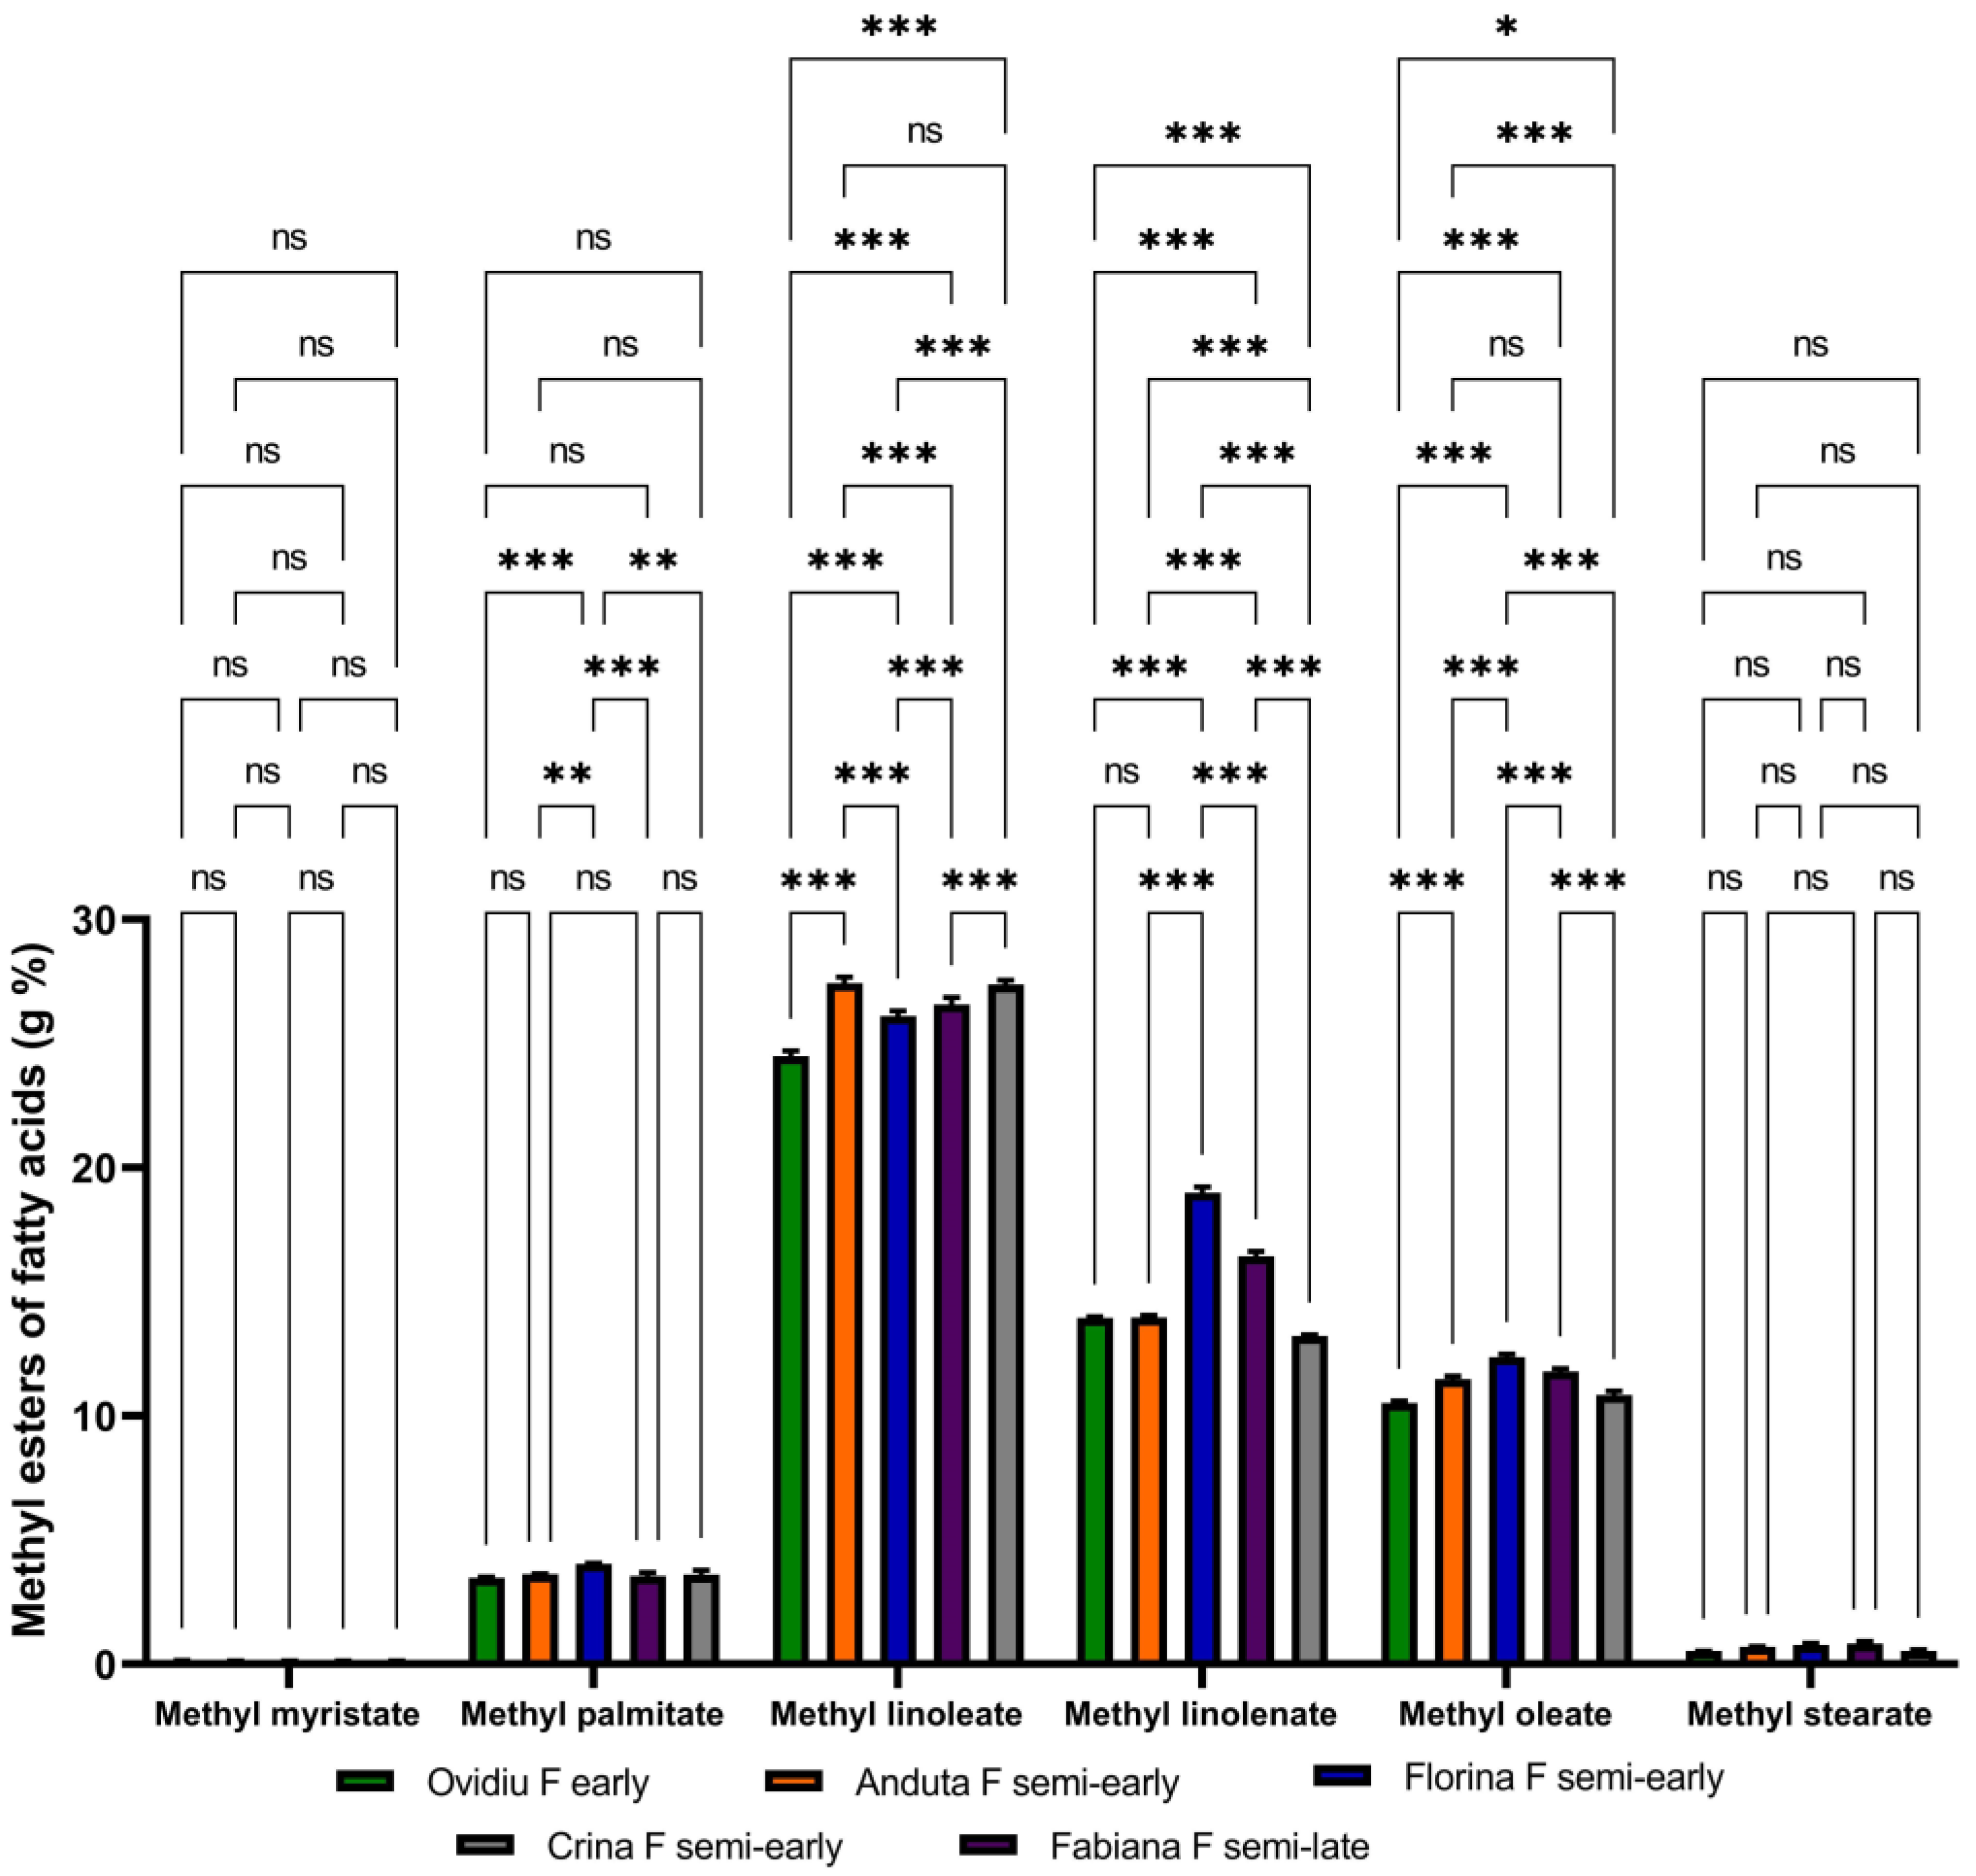
Figure 1. The percentage of methyl esters of fatty acids in the undiluted samples. The results are presented as mean ± SD (n = 3). Asterisks indicate the statistical significance examined by ANOVA with Tukey post hoc test (* p ≤ 0.05, ** p < 0.01, *** p < 0.001, ns: p > 0.05).
Applsci 13 08724 g001
Figure 2. The percentage of methyl esters of fatty acids in the 1/10 diluted samples. The results are presented as mean ± SD (n = 3). Asterisks indicate the statistical significance examined by ANOVA with Tukey post hoc test (* p ≤ 0.05, ** p < 0.01, *** p < 0.001, ns: p > 0.05).
Applsci 13 08724 g002
Figure 3. Protein percentage content in soybean and pea samples after extraction with Tris-glycine buffer solution and water extraction determined using the Bradford method and Kjeldahl methods. The results are presented as mean ± SD (n = 3). Asterisks indicate the statistical significance examined by ANOVA with Tukey post hoc test (* p ≤ 0.05, ** p < 0.01, *** p < 0.001, ns: p > 0.05).
Applsci 13 08724 g003
Figure 4. Total amino acids (g %) for (a) soybean kernels and (b) pea kernels. The results are presented as mean ± SD (n = 3). ANOVA and multiple comparison of means using Tukey multiple comparation test. Asterisks indicate the statistical significance examined by ANOVA with Tukey post hoc test (** p < 0.01, *** p < 0.001, ns: p > 0.05).
Applsci 13 08724 g004
Figure 5. Protein fingerprints of soybean and pea samples extracted in Tris-glycine buffer and water, after Coomassie staining (legend: 1. Molecular marker—Thermo Scientific (Waltham, MA, USA); 2. Ovidiu soy Tris-glycine extract; 3. Ovidiu soy water extract; 4. Anduța soy Tris-glycine extract; 5. Anduța soy water extract; 6. Florina soy Tris-glycine extract; 7. Florina soy water extract; 8. Fabiana soybean Tris-glycine extract; 9. Fabiana soy water extract; 10. Crina soy Tris-glycine extract; 11. Crina soy water extract; 12. Spectral pea Tris-glycine extract; 13. Spectral pea water extract; 14. Evelina pea Tris-glycine extract; 15. Evelina pea water extract; 16. Aurora pea Tris-glycine extract; 17. Aurora pea water extract; 18. Nicoleta pea Tris-glycine extract; 19. Nicoleta pea water extract).
Applsci 13 08724 g005
Figure 6. Protein fingerprints of some pea and soybean samples after staining by the silver method (legend: 1. Aurora pea Tris-glycine extract; 2. Molecular marker—Thermo Scientific (Waltham, MA, USA); 3. Aurora pea aqueous extract; 4. Nicoleta pea Tris-glycine extract; 5. Nicoleta pea aqueous extract; 6. Ovidiu soy Tris-glycine extract; 7. Ovidiu aqueous soy extract; 8. Molecular marker—Thermo Scientific).
Applsci 13 08724 g006
Figure 7. Analysis of molecular marker bands after Coomassie staining.
Applsci 13 08724 g007
Figure 8. Analysis of molecular marker bands after silver staining.
Applsci 13 08724 g008
Figure 9. Analysis of band intensity for the Tris-glycine-extracted Ovidiu soybean protein sample after Coomassie staining.
Applsci 13 08724 g009
Figure 10. Analysis of the intensity of the bands for the Ovidiu soybean protein sample extracted in Tris-glycine, after staining with silver.
Applsci 13 08724 g010
Figure 11. The result of electrophoresis analysis, captured with a camera (legend: 1. Aurora pea Tris-glycine extract; 2. Molecular marker—Thermo Scientific; 3. Aurora pea aqueous extract; 4. Nicoleta pea Tris-glycine extract; 5. Nicoleta pea aqueous extract; 6. Ovidiu soy Tris-glycine extract; 7. Ovidiu aqueous soy extract; 8. Molecular marker—Thermo Scientific).
Applsci 13 08724 g011
Table 1. Properties of the analyzed varieties of soybeans (Glycine max L.) and peas (Pisum sativum L.).
Type of VarietiesMorphological AttributesPhysiological CharacteristicsQuality
Soybeans
Ovidiu F earlyGrowth type: determined. Bush shape: semi-spreading. Pubescence: gray. Flower: white.
Pod: dark brown. Plant height: 80–122 cm. Grain: yellow with yellow hilum. Mass: 100–160 g. Insertion height of the first pods: 12–20 cm.
Vegetation period: 100–110 days. Good drought and heat tolerance. Very good resistance to falling and shaking. Good resistance to soybean blight (Peronospora manshurica), bacterial burn (Pseudomonas glycinea) and Fusarium wilt (Fusarium oxysporum).In terms of the non-irrigated period, the maximum production was 5765 kg/ha. The Ovidiu F variety has a high production capacity for the maturity stage to which it belongs (over 4600 kg/ha).
Anduța F semi-earlyGrowth type: determined. Bush shape: semi-spreading. Pubescence: gray. Flower: white. Pod: dark brown. Plant height: 90–110 cm. Grain: yellow with black hilum. Mass: 140–180 g. Insertion height of the first pods: 15–20 cm.Vegetation period: 100–110 days. Good drought and heat tolerance. Very good resistance to falling and shaking. Good resistance to soybean blight (Peronospora manshurica), bacterial burn (Pseudomonas glycinea) and Fusarium wilt (Fusarium oxysporum).Under the non-irrigated period conditions, the maximum production was 5395 kg/ha. The Anduţa F variety has a high production capacity for the maturity group to which it belongs (over 4500 kg/ha).
Florina F semi-earlyGrowth type: indeterminate. Bush shape: semi-spreading. Pubescence: gray. Flower: purple. Pod: dark brown. Plant height: 95–125 cm. The grain: yellow with a brown hilum. Mass: 120–140 g. Insertion height of the first pods: 15–17 cm.Vegetation period: 100–110 days. Good drought and heat tolerance. Very good resistance to falling and shaking. Good resistance to soybean blight (Peronospora manshurica), bacterial burn (Pseudomonas glycinea) and Fusarium wilt (Fusarium oxysporum).In terms of non-irrigated period, the maximum production was 5088 kg/ha. The Florina F variety has a high production capacity for the maturity group to which it belongs (over 4000 kg/ha).
Fabiana F semi-lateGrowth type: indeterminate. Bush shape: compact. Pubescence: gray. Flower: purple. Pod: light brown. Plant height: 115–122 cm. The grain: yellow with a brown hilum. Mass: 120–140 g. Insertion height of the first pods: 15–17 cm.Vegetation period: 118–130 days. Good drought and heat tolerance. Very good resistance to falling and shaking. Good resistance to soybean blight (Peronospora manshurica), bacterial burn (Pseudomonas glycinea) and Fusarium wilt (Fusarium oxysporum).Maximum production in non-irrigated conditions was 5808 kg/ha. The Fabiana F variety has a capacity of high production for the maturity group from which belongs over 4600 kg/ha.
Crina F semi-earlyGrowth type: determinate. Compact bush shape. Pubescence: gray. Flower: white. Pod: gray. Plant height: 85–100 cm. Grain: yellow with a light brown hilum. Mass: 140–150 g.Vegetation period: 114–123 days. Good drought and heat tolerance. Very good resistance to falling and shaking. Good resistance to bacterial blight (Peronospora manshurica) and manna (Pseudomonas glycinea).Crina F has a high production capacity for the maturity group to which it belongs, between 2500 and 4500 kg/ha. The variety shows a superior stability of production in the conditions in the southern part of the country, as a result of an increased tolerances to atmospheric drought.
Peas
Spectral F autumnIt has good winter hardiness level. The vegetation period is 135–140 days. The color of the flowers is white. The grains are spherical, smooth and yellow pericarp. The plant height is of 150–200 cm.
Aurora-type afilaPlant height: 45–55 cm; Leaf: “Afila” type; Flowers: white, Pod: medium to small, green; Grain: yellow.Vegetation period: 78–93 days. Good resistance to falling and shaking. The protein content varies from 25% to 27%.Average production in the three years of testing, very different from the climatic point of view, it 2541 kg/ha.
Evelina F-type afilaGrowth type: undetermined. Plant height: 65–90 cm. Leaf: “Afila” type, with leaflets transformed into tendrils strongly developed and branched with large stems in the middle. Flowers: white, grouped by two in a raceme. Pod: small to medium, green. Grain: smooth with yellow skin. Mass: 250–280 g.Vegetation period: 75–90 days. Very good resistance to falling and shaking. Good resistance to pea powdery mildew (Erysiphe polygoni), anthracnose (Ascochya pisi) and viruses. The protein content varies from 24.5% to 26%. The percentage of shells is 7.5%.Average production in the three years of testing, very different from the climatic point of view, was 3786 kg/ha.
Nicoleta-type afilaGrowth type: undetermined. Plant height: 60–85 cm. Leaf: “Afila” type, with leaflets transformed into tendrils strongly developed and branched with large stems in the middle. Flowers: white, grouped by two in a raceme. Pod: small to medium, green. Grain: smooth with yellow skin. Mass: 250–280 g.Vegetation period: 78–96 days. Very good resistance to falling and shaking. Good resistance to pea powdery mildew (Erysiphe polygoni), anthracnose (Ascochya pisi) and viruses. The protein content varies from 24.5% to 26%. The percentage of shells is 7.5%.Production in the three years of testing, very different from the climatic point of view, was 3567 kg/ha.
Table 2. The experimental conditions for the analysis of methyl esters.
tR—Retention Time (min)Rate
(°C/min)
Target Temperature (°C)Stationary Time (min)
0.000Run
2.0000.00170.02.00
14.6673.00202.02.00
26.2675.00250.02.00
Table 3. Preparation of BSA standard solutions for protein analysis using the Bradford method.
Concentration of BSA (μg/mL)Stock Solution Volume of BSA (μL)Solvent Volume (μL)
5062.51187.5
1001251125
2002501000
400500750
600750500
Table 4. Amino acid analysis conditions.
Retention Time (min)Rate (°C/min)Target Temperature (°C)Stationary Time (min)
0.000Run
4.0000.00100.04.00
11.0003.00170.00.00
17.6673.00190.00.00
46.66710.00280.020.00
Table 5. The total lipid extract from the analyzed soybean samples.
Soybean VarietySample Table Taken in Work (g)Total Lipid Extract (g)Total Lipid Extract (% Dry Weight)
Ovidiu F early5.03 ± 0.011.13 ± 0.2522.46 ± 0.12
Anduta F semi-early5.03 ± 0.011.17 ± 0.3323.28 ± 0.25
Florina F semi-early5.01 ± 0.021.03 ± 0.5520.67 ± 0.18
Fabiana F semi-late5.01 ± 0.021.10 ± 0.6622.00 ± 0.33
Crina F semi-early5.00 ± 0.011.11 ± 0.4222.29 ± 0.15
Table 6. Percentage amino acid content of protein samples extracted from soybean and pea kernels in Tris-glycine buffer solution.
Soybean Kernels
Amino AcidOvidiu F Early (g%)Anduta F Semi-Early (g%)Florina F Semi-Early (g%)Fabiana F Semi-Late (g%)Crina F Semi-Early (g%)
L-Valine0.81 ± 0.020.80 ± 0.030.57 ± 0.011.07 ± 0.060.42 ± 0.01
L-Alanine2.09 ± 0.080.95 ± 0.041.10 ± 0.031.33 ± 0.050.73 ± 0.04
L-Leucine1.36 ± 0.081.31 ± 0.070.94 ± 0.061.85 ± 0.090.68 ± 0.08
L-Proline1.00 ± 0.040.68 ± 0.020.75 ± 0.031.05 ± 0.040.90 ± 0.03
L-Isoleucine1.12 ± 0.050.93 ± 0.020.68 ± 0.021.18 ± 0.040.29 ± 0.01
L-Serine0.96 ± 0.020.86 ± 0.030.69 ± 0.021.27 ± 0.050.46 ± 0.02
L-Threonine1.00 ± 0.030.71 ± 0.030.68 ± 0.021.04 ± 0.040.36 ± 0.01
Glycine6.37 ± 0.051.53 ± 0.022.69 ± 0.011.32 ± 0.021.55 ± 0.02
L-Aspartic acid2.54 ± 0.062.11 ± 0.041.74 ± 0.083.05 ± 0.081.11 ± 0.02
L-Glutamic acid3.57 ± 0.022.80 ± 0.032.35 ± 0.024.49 ± 0.061.45 ± 0.02
DL-Phenyl alanine0.72 ± 0.020.52 ± 0.020.49 ± 0.020.81 ± 0.030.23 ± 0.01
N-Acetyl lysine5.96 ± 0.063.85 ± 0.023.12 ± 0.045.52 ± 0.021.66 ± 0.02
Tyrosine0.19 ± 0.010.12 ± 0.010.11 ± 0.010.28 ± 0.010.06 ± 0.01
Pea Kernels
Amino AcidAutumn Spectral F (g%)Afila-Type Aurora (g%)Afila-Type Evelina F (g%)Afila-Type Nicoleta (g%)
L-Valine0.38 ± 0.020.28 ± 0.010.30 ± 0.020.48 ± 0.01
L-Alanine0.95 ± 0.060.54 ± 0.021.28 ± 0.061.00 ± 0.08
L-Leucine0.55 ± 0.020.46 ± 0.040.46 ± 0.020.72 ± 0.04
L-Proline0.57 ± 0.040.39 ± 0.020.59 ± 0.040.73 ± 0.04
L-Isoleucine0.35 ± 0.040.28 ± 0.020.16 ± 0.010.29 ± 0.01
L-Serine0.37 ± 0.010.27 ± 0.010.19 ± 0.010.48 ± 0.02
L-Threonine0.34 ± 0.020.26 ± 0.020.31 ± 0.020.51 ± 0.01
Glycine0.65 ± 0.041.20 ± 0.068.53 ± 0.141.25 ± 0.08
L-Aspartic acid0.95 ± 0.040.66 ± 0.040.90 ± 0.041.18 ± 0.08
L-Glutamic acid1.06 ± 0.060.72 ± 0.061.16 ± 0.061.49 ± 0.08
DL-Phenyl alanine0.21 ± 0.010.15 ± 0.010.20 ± 0.010.29 ± 0.01
N-Acetyl lysine2.22 ± 0.061.07 ± 0.082.73 ± 0.083.32 ± 0.10
Tyrosine0.05 ± 0.010.04 ± 0.010.07 ± 0.010.08 ± 0.01
Disclaimer/Publisher’s Note: The statements, opinions and data contained in all publications are solely those of the individual author(s) and contributor(s) and not of MDPI and/or the editor(s). MDPI and/or the editor(s) disclaim responsibility for any injury to people or property resulting from any ideas, methods, instructions or products referred to in the content.