Article

Development and Characterization of N/S-Carbon Quantum Dots by Valorizing Greek Crayfish Food Waste

by
Achilleas Kechagias
1,
Christos Lykos
1,
Vassilios K. Karabagias
2,
Stavros Georgopoulos
2,
Viktoria Sakavitsi
3,
Areti Leontiou
2,
Constantinos E. Salmas
3,*,
Aris E. Giannakas
2,* and
Ioannis Konstantinou
1,4,*
1
Department of Chemistry, University of Ioannina, 45110 Ioannina, Greece
2
Department of Food Science and Technology, University of Patras, 30100 Agrinio, Greece
3
Department of Material Science and Engineering, University of Ioannina, 45110 Ioannina, Greece
4
University Research and Innovation Center, Institute of Environment and Sustainable Development, University of Ioannina, 451110 Ioannina, Greece
*
Authors to whom correspondence should be addressed.
Appl. Sci. 2023, 13(15), 8730; https://doi.org/10.3390/app13158730
Submission received: 19 June 2023 / Revised: 24 July 2023 / Accepted: 25 July 2023 / Published: 28 July 2023
(This article belongs to the Special Issue Novel Approaches for Food Processing and Preservation)

Abstract

:
The valorization of food industry byproducts has become a significant issue worldwide because of the drive towards a circular economy. The “zero waste target” in human activities seems to be a dominant objective in the design of future products by enterprises. In this work, food waste from the crayfish processing industry was converted into useful products (quantum dots), as nowadays, biowaste-derived materials tend to be more attractive than conventionally produced materials with a similar structure due to their lower production costs and environmentally friendly development processes. More specifically, shell waste from the crayfish industry was treated hydrothermally and, after a freeze-drying process, was transformed to useful quantum dots. Instrumental and chemical techniques, such as XRD, SEM-EDS, AFM, XPS, elemental analysis, fluorescence spectroscopy, TG, Microtox bioassay, and DPPH antioxidant activity, were employed to characterize the final product. The results indicated the existence of thermally stable spherical particles, with a diameter of 5–8 nm, which were mainly composed of carbon, oxygen, nitrogen, calcium, and sulfur. Their external surface was rough and rich with various functional groups that further contributed to their overall optical properties. The final product presented low ecotoxicity, as studied by the Microtox assay. The superior antioxidant activity of this product compared to other similar materials reported elsewhere renders it a potential material for, e.g., food packaging applications. In addition, for the first time, N/S-Carbon QDs were applied as an antioxidant/antibacterial agent for strawberry preservation, showing promising results as the coated strawberries maintained their color and weight for three consecutive days with no mold growth observed on their surface.

1. Introduction

Nowadays, to follow the trend for a circular economy, researchers have been giving their best efforts to recover raw materials from biomass and/or food waste [1,2]. A novel category of materials recovered from biomass that show lot of promise are carbon quantum dots (Carbon QDs). Carbon QDs, first detected during the purification of single-walled carbon nanotubes (SWNTs) in 2004 [3], are carbon-based nanomaterials, typically with almost spherical shape [4] and a diameter below 10 nanometers [5]. Their structure is based on an amorphous or nanocrystalline core, mainly consisting of double bonded carbon atoms and carboxyl groups on the dots’ surface [6]. Carbon QDs exhibit a series of useful properties that may be beneficial for various scientific and industrial fields. Such properties include not only small size, but also low cost, chemical stability, good biocompatibility, and high photoluminescence (PL) intensity, which is dependent on the wavelength of the exciting radiation [6,7,8,9]. Although Carbon QDs mostly consist of carbon, they have high aqueous solubility [5,7], which can be enhanced by the presence of nitrogen-containing functional groups on the surface of the dots [10].
The versatility of Carbon QDs’ properties renders them as potential candidate materials in a plethora of applications. Firstly, their fluorescent abilities make them ideal for use in electrochemical luminescence, optronics, and sensors, as well as in photocatalysis [5,8]. In addition, they can be applied in the field of biosciences and specifically in biosensing, bioimaging, and biological labeling [5,6,8,11]. Alternatively, they can be also applied as nanocarriers for biomolecules or drugs [5,8,11], as well as antibacterial agents [9]. One of their most interesting applications concerns the chemical sensing of metal ions and is based on their fluorescence properties. The sensing of Hg2+ ions can be considered as the prime example of this utilization of Carbon QDs [11], which is very important considering the toxicity of Hg to humans and the environment. CQD-based chemical sensing can be also applied for other ions, such as Fe3+ [12], Ag+ [13], and Cu2+ [14]. Recently, Carbon QDs have been suggested as excellent candidates for food preservation applications due to their low price, low toxicity, and significant antioxidant and antibacterial properties [15,16]. Carbon QDs, due to their water solubility, can be applied directly as food preservatives or incorporated in water-soluble polymers and biopolymers [17,18]. Water-soluble polymers, such as poly-vinyl alcohol, and water-soluble biopolymers, such as gelatin and chitosan, are ideal matrices to incorporate carbon QDs in active films and coatings for the preservation of various foods [7,18,19,20].
In the field of carbon QDs synthesis, a variety of preparation methods are used, which can be divided in two categories: (i) top-down and (ii) bottom-up [7,21]. Top-down methods require higher temperatures and pressures, whilst bottom-up methods are performed in milder conditions. Top-down methods operate by breaking down larger carbon structures to form the dots [22], while bottom-up methods focus on converting small, carbon-rich biomolecules into Carbon QDs [7,22]. Top-down preparation approaches includes arc discharge and laser ablation, which are quick, but result in a low quantum yield (QY) and poor size control. Additionally, electrochemical carbonization is performed in a single step and provides good size control, but is not suitable for many precursors [5]. Some commonly known bottom-up synthetic routes are microwave irradiation, which is quick and cost-effective but provides little control over the dots’ sizes; ultrasound; conventional heating; and hydrothermal/solvothermal treatment [7]. In this research, the hydrothermal route was followed because of the low cost, eco-friendliness, and non-toxicity, so it can be easily used on biomass-based raw materials such as crayfish shell. Previously synthesized Carbon QDs using this method have a diameter of 1.5 to 4.5 nm [5].
The properties of Carbon QDs can be enhanced by doping with a variety of elements including nitrogen, sulfur, phosphorus, and calcium [5,23]. Doping Carbon QDs with nitrogen is a very effective way to upgrade their photoluminescence characteristics and to increase their QY, while metal ion sensing is performed more efficiently [23]. Phosphorus and nitrogen co-doped dots also display improved PL properties and higher efficiency in electrocatalysis [5,23].
The raw materials that have been studied as precursors for the carbon QD synthesis include a variety of carbon-rich biomass and food waste. Tea leaves, coffee grounds, and fruit peels [7], for example watermelon peels [24], are cheap and easily accessible. Other sources for the synthesis of carbon QDs are sweet potatoes [21,25], milk [21,26], fruit juices and garlic [21,27]. Crayfish shell has garnered research attention recently due to the discovery of the various components it contains, such as chitin and its derivatives, astaxanthin, proteins, and N-Acetyl-d-glucosamine, which can be used in many fields. Alternatively, crayfish shells can be converted to functional materials such calcium-rich biochar and N-doped carbon QDs [10]. Recently, Chen et al. [10] prepared N,S-Carbon QDs from crayfish waste by using L-cysteine as source of S atoms. Simultaneously, Chen et al. [28] prepare N-doped carbon QDs without any chemical addition by using pure crayfish waste powder.
In the current study, a simple hydrothermal route was adopted to prepare sulfur and nitrogen co-doped carbon QDs (N/S-Carbon QDs) using waste crayfish shells from a Greek fish processing factory for the first time. Considering that Greece is a country with vast access to marine biomass, the purpose of this article is to raise interest into the industrial and commercial prospects of crayfish shell. The prepared N/S-Carbon QDs were morphologically and structurally characterized by applying various microscopic and spectrometric techniques. The optical and thermal properties of the material were also investigated to evaluate its applicability in food packaging as well as other processes with environmental significance, such as photocatalysis, etc. In this regard, its ecotoxicity was assessed in vitro while its antioxidant capability was also evaluated.

2. Materials and Methods

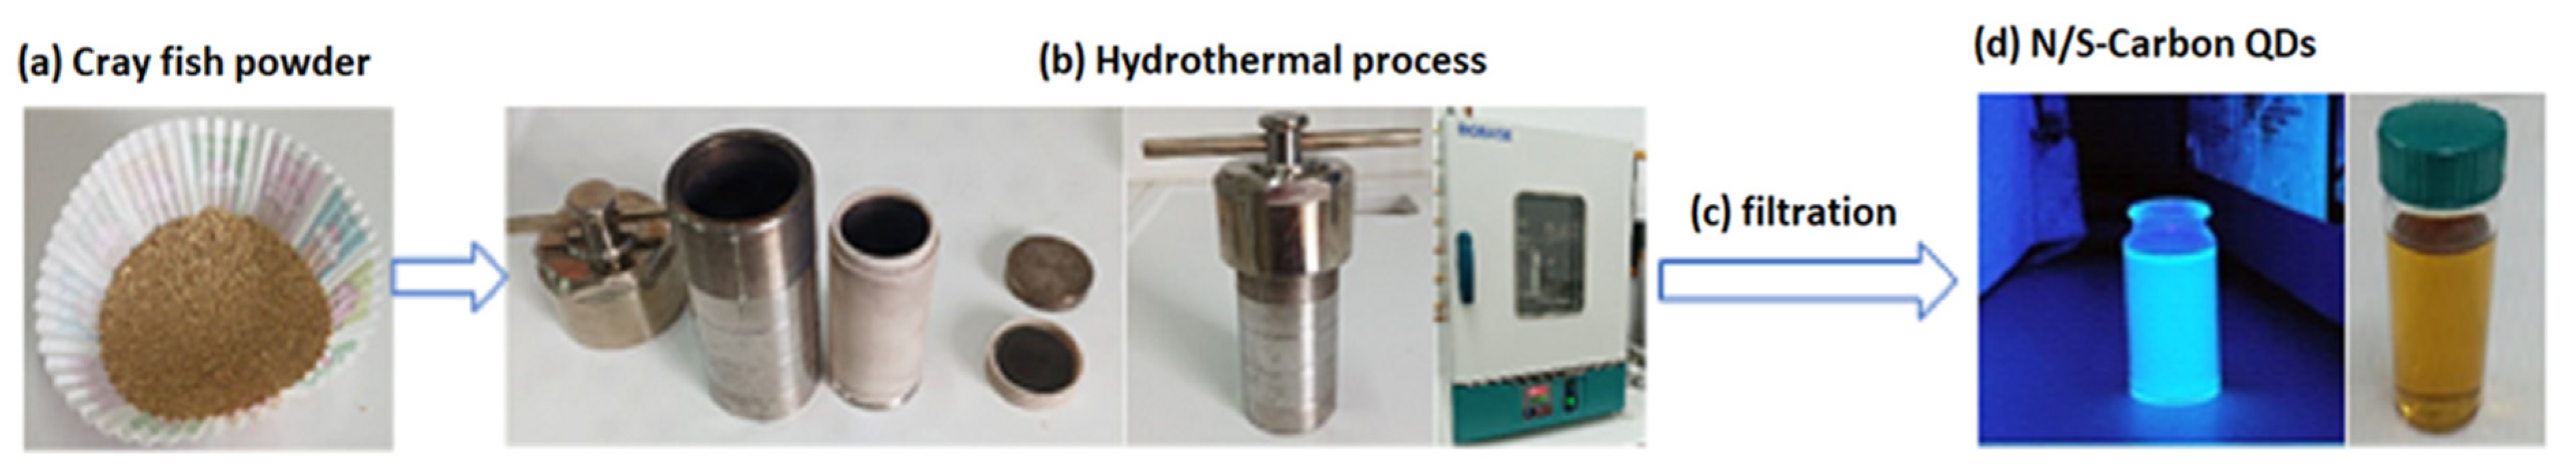
2.1. Preparation of N/S-Carbon QDs from Crayfish Waste

Absolute ethanol for analysis and acetate buffer (CH3COONa·3H2O) were purchased from Merck (Rahway, NJ, USA). 2,2-Diphenyl-1-picrylhydrazyl (DPPH) was purchased from Sigma-Aldrich (St. Louis, MO, USA). The crayfish (Nephrops norvegicus) waste was generously donated by Flerianos S.A., a fish and seafood processing company. Crayfish waste was delivered by the company to the lab in an ice bath within 2 h from collection. It was then dried at 120 °C for 24 h and ground to fine powder (Figure 1a). Next, 2 g of ground, dry crayfish waste powder was added to 60 mL of deionized water and the suspension was placed in a stainless steel kettle vessel (100 mL) with a PTFE-lined autoclave reactor. The autoclave reactor was placed inside a furnace (Biobase BOV-V65F furnace—Jinan, China) and the hydrothermal process was performed at 220 °C for 8 h (Figure 1b). After the hydrothermal process, the aqueous dispersion of crayfish waste was filtered (Figure 1c) through a 0.22 μm PTFE filter to obtain a brownish solution. This solution was dialyzed (MW, 1000 Da) for 48 h as a purification step and finally the obtained solution was freeze-dried at −80 °C to obtain the N/S-Carbon QDs powder.

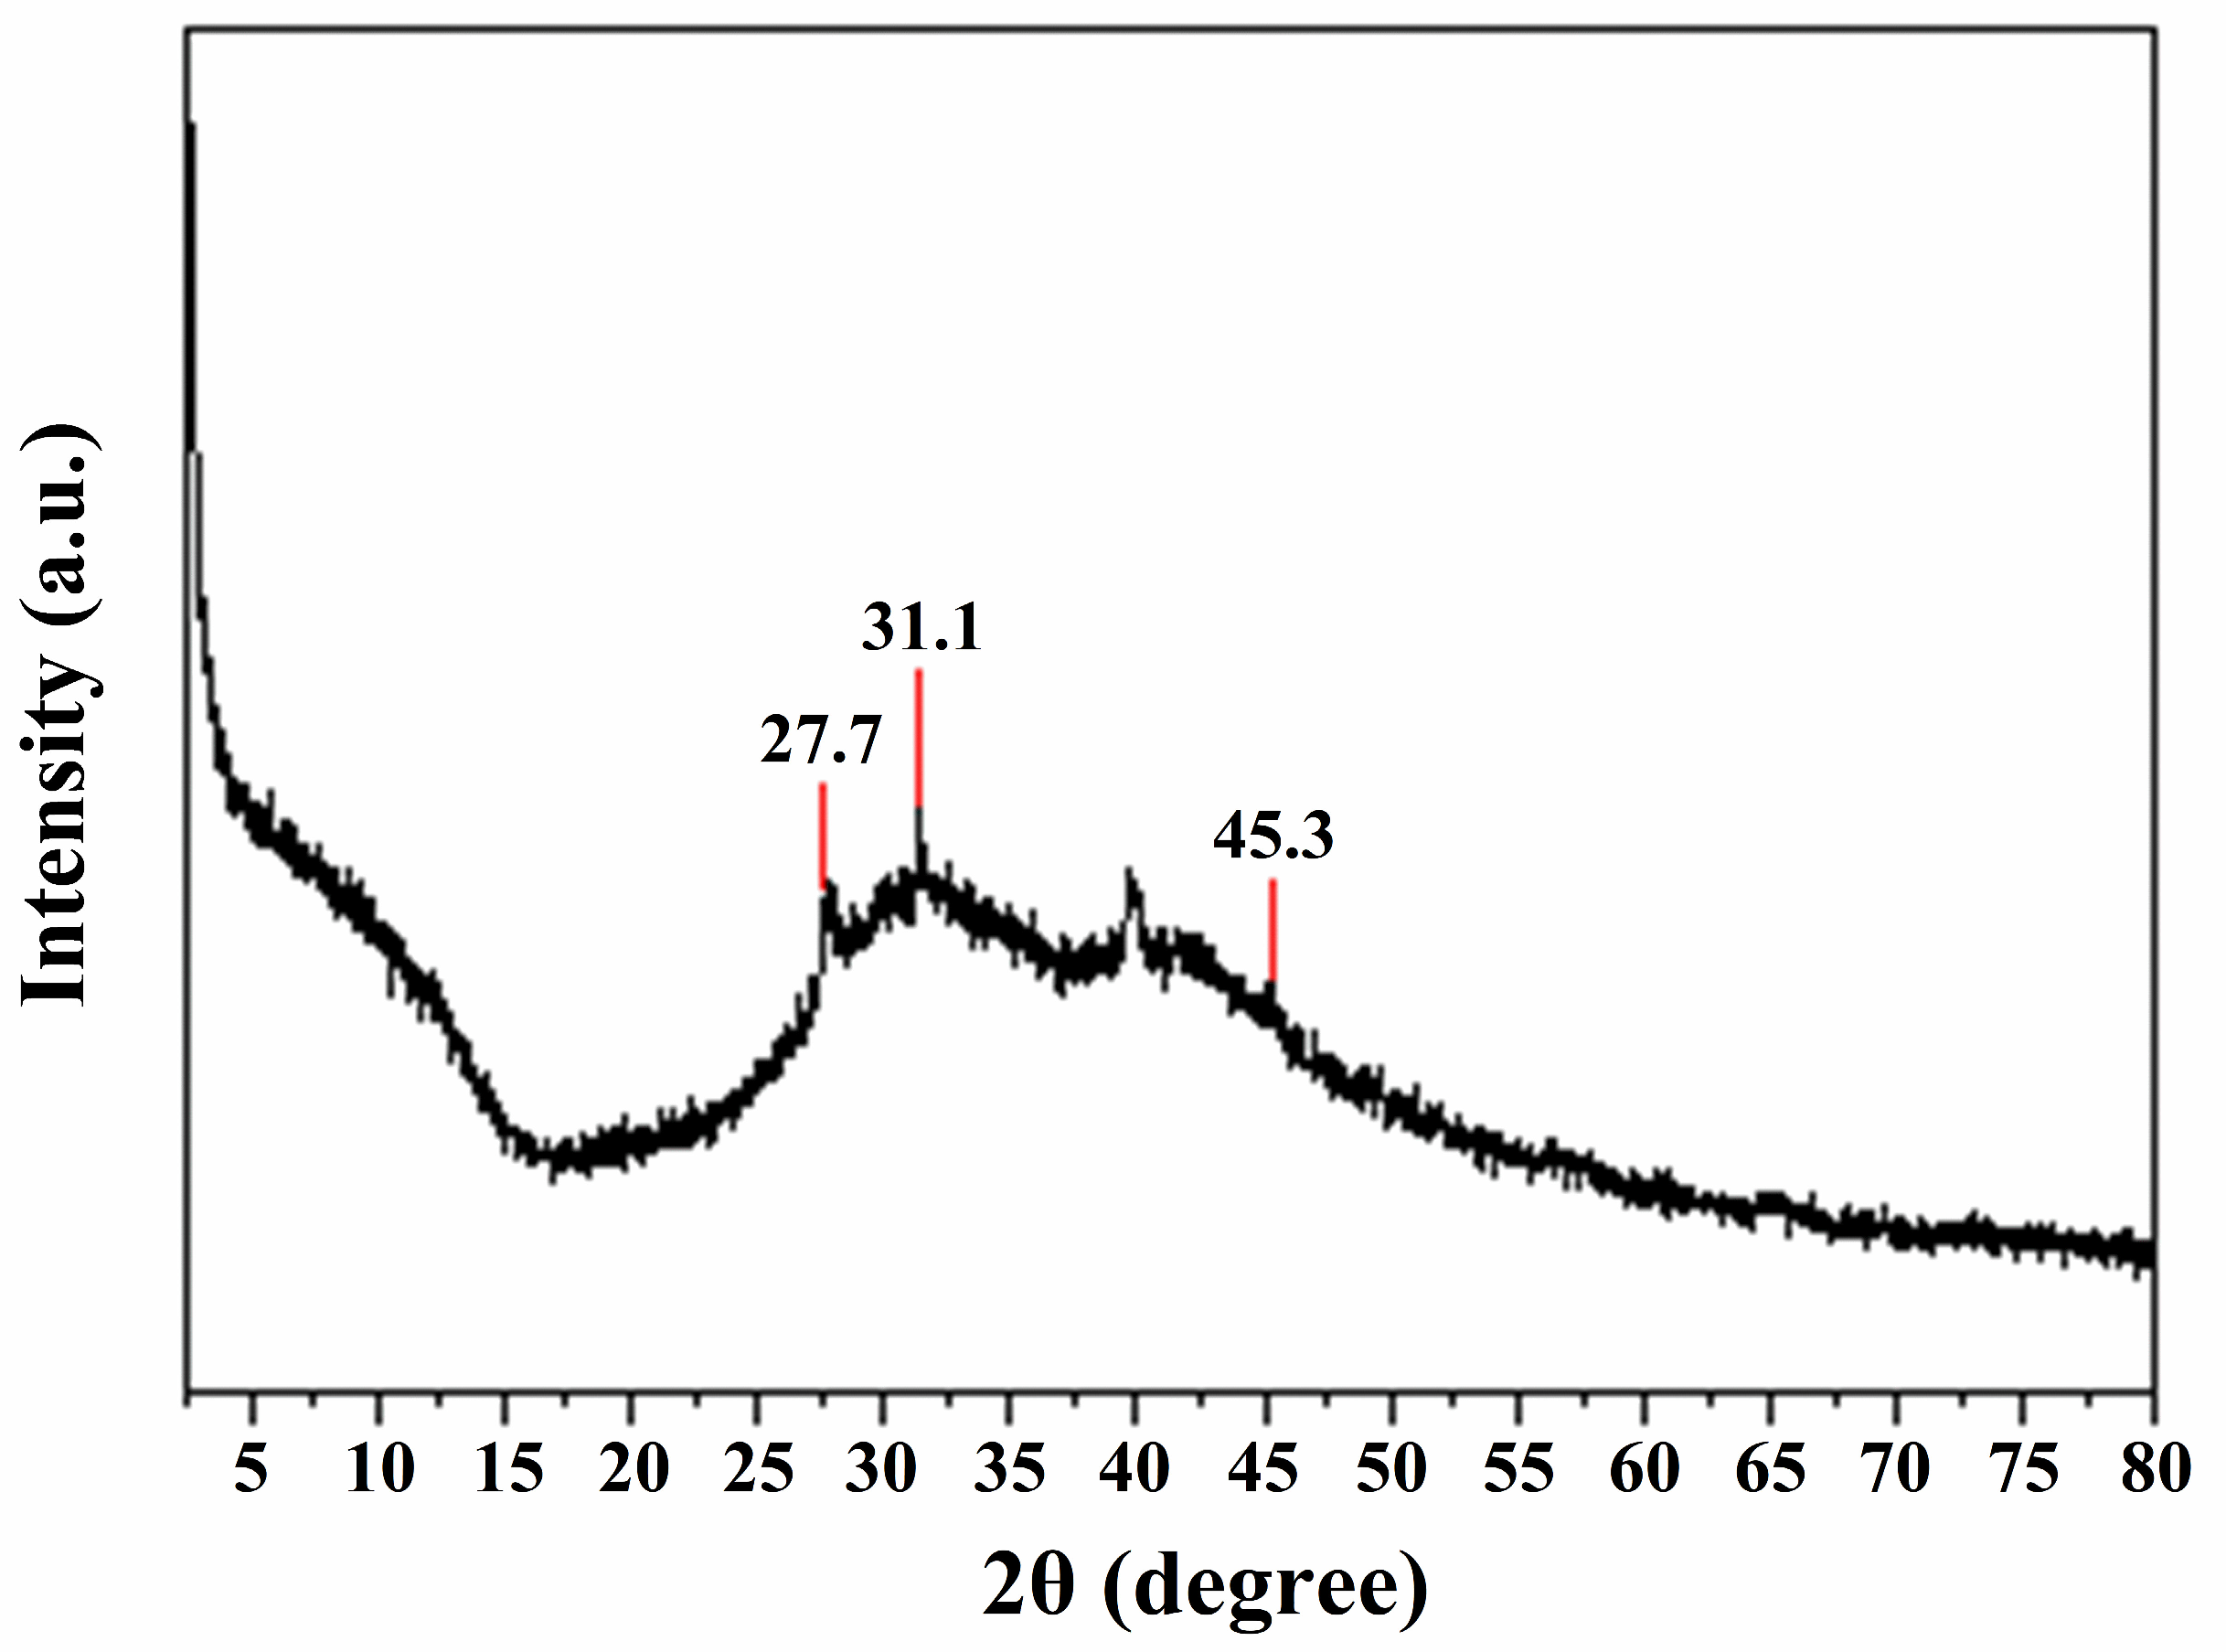
2.2. X-ray Powder Diffraction (XRD) Analysis

The determination of the crystalline phases of N/S-Carbon QDs was performed by XRD analysis. Diffractograms were acquired using a Bruker D8 Advance (Billerica, PA, USA) instrument and scanning was performed from 0.5° to 80° (2θ values).

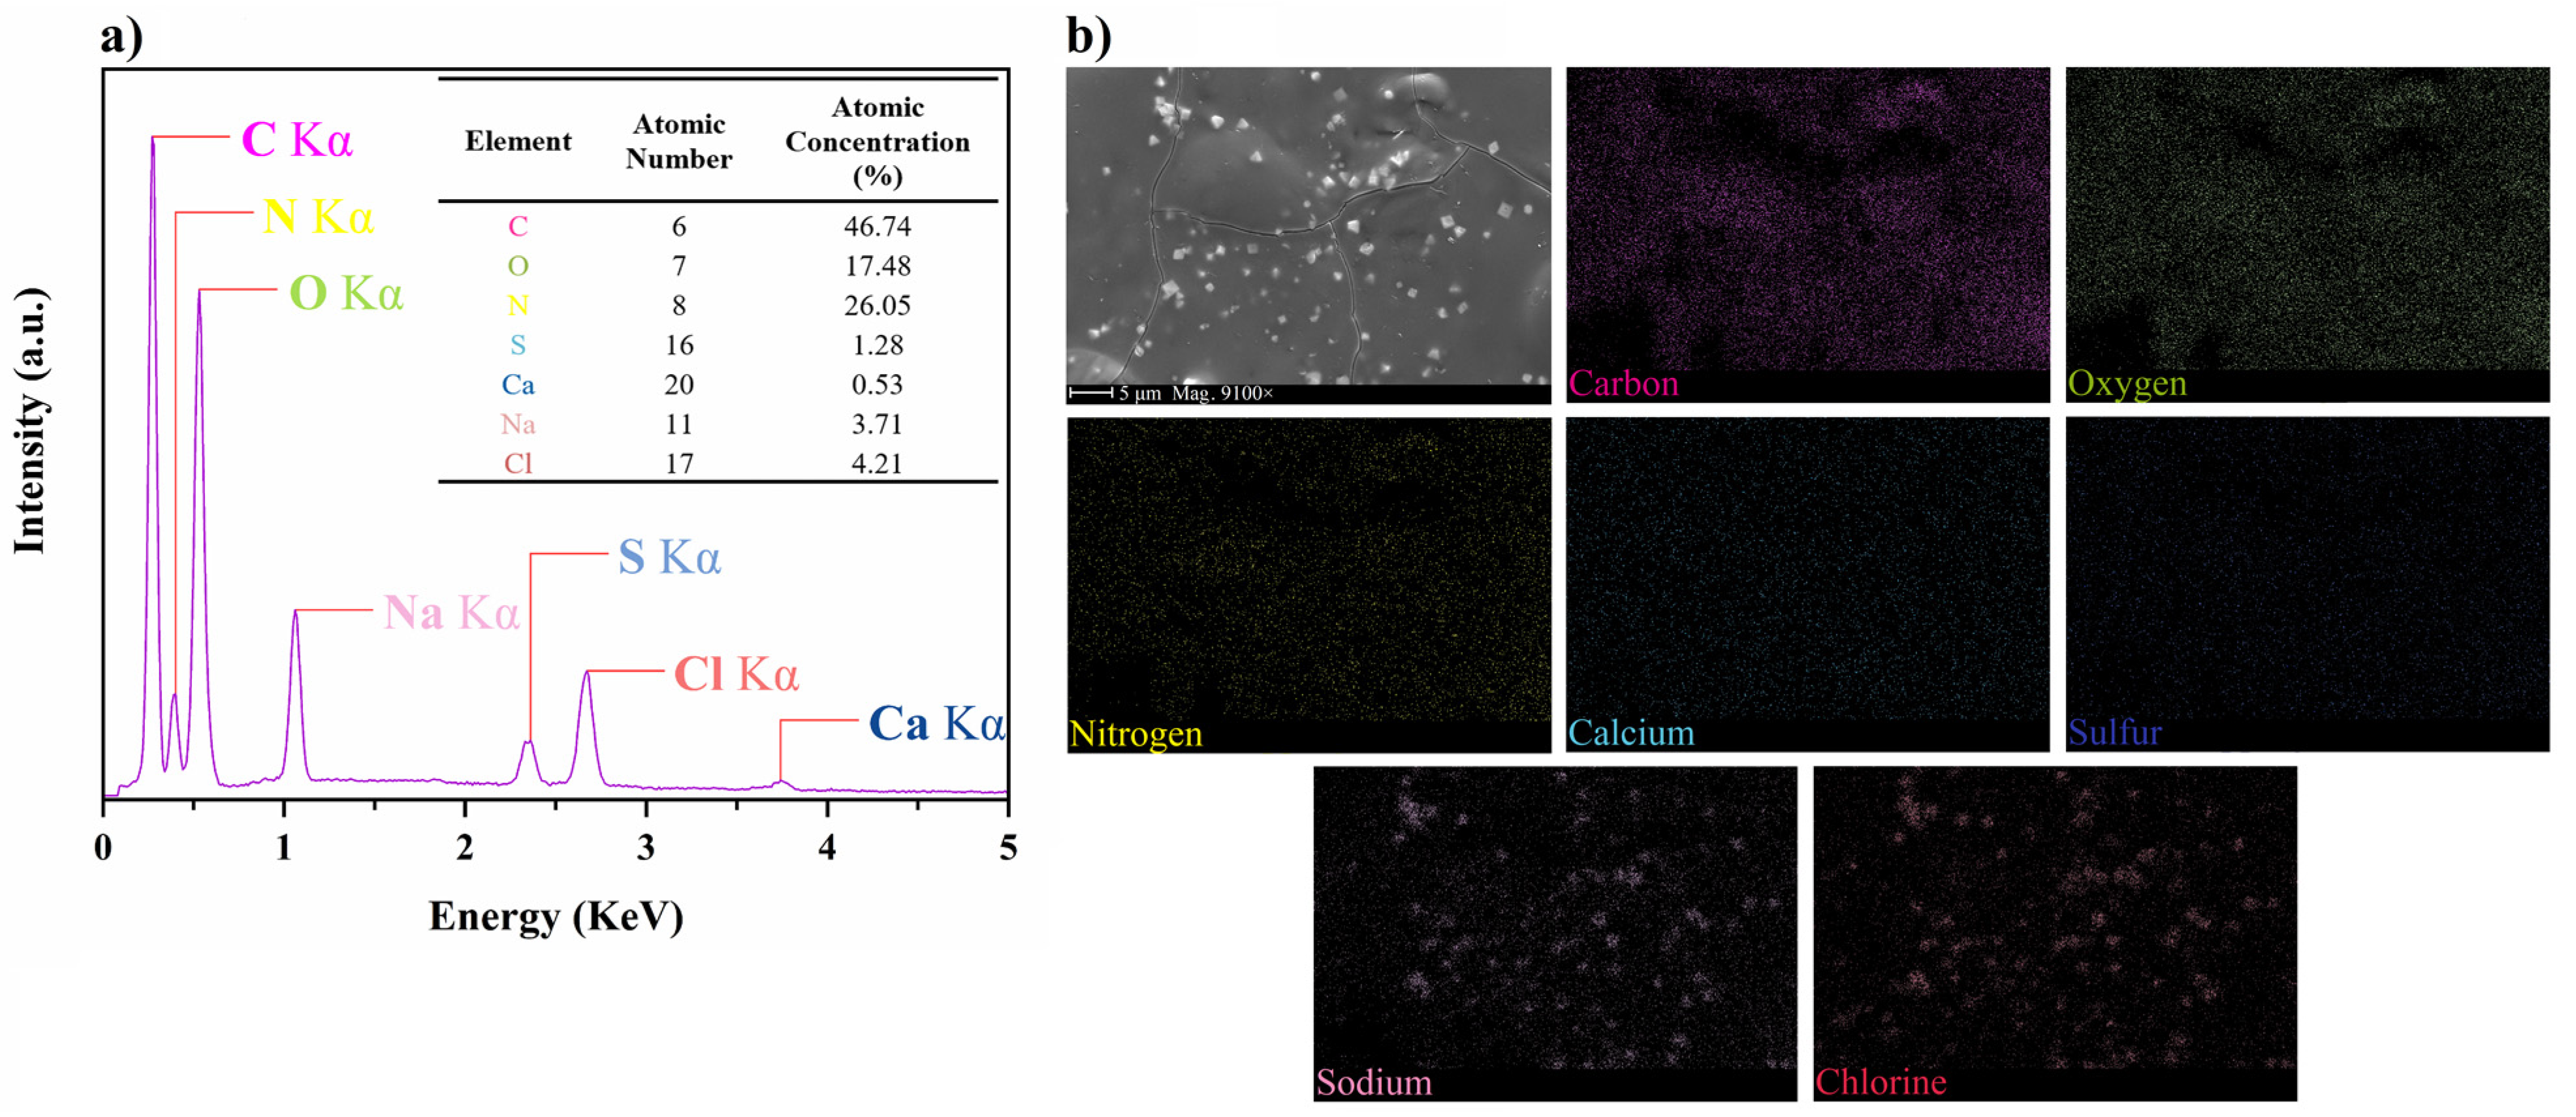
2.3. Scanning Electron Microscopy (SEM) and Energy-Dispersive X-ray Spectroscopy (EDS)

The surface morphology of bulk N/S-Carbon QDs was studied by applying SEM. Before analysis, the sample was coated with a few nm of chromium under a thin argon atmosphere (high vacuum) using a Quantum Design Q150T Plus sputter coater (Darmstadt, Germany). Micrographs were acquired using a Thermo Fisher Pharos Phenom G2 FEG-SEM (Waltham, MA, USA) operated at an accelerating voltage of 10 kV using both backscatter and secondary detectors (25:75) under high vacuum (0.1 Pa). Additionally, the surface elemental composition of the sample was determined by EDS analysis using the same instrumentation.

2.4. Atomic Force Microscopy (AFM) Analysis

The size of the N/S-Carbon QDs was measured using AFM. Images were recorded on silicon wafer substrates using tapping mode with a Bruker Multimode 3D Nanoscope (Billerica, PA, USA).

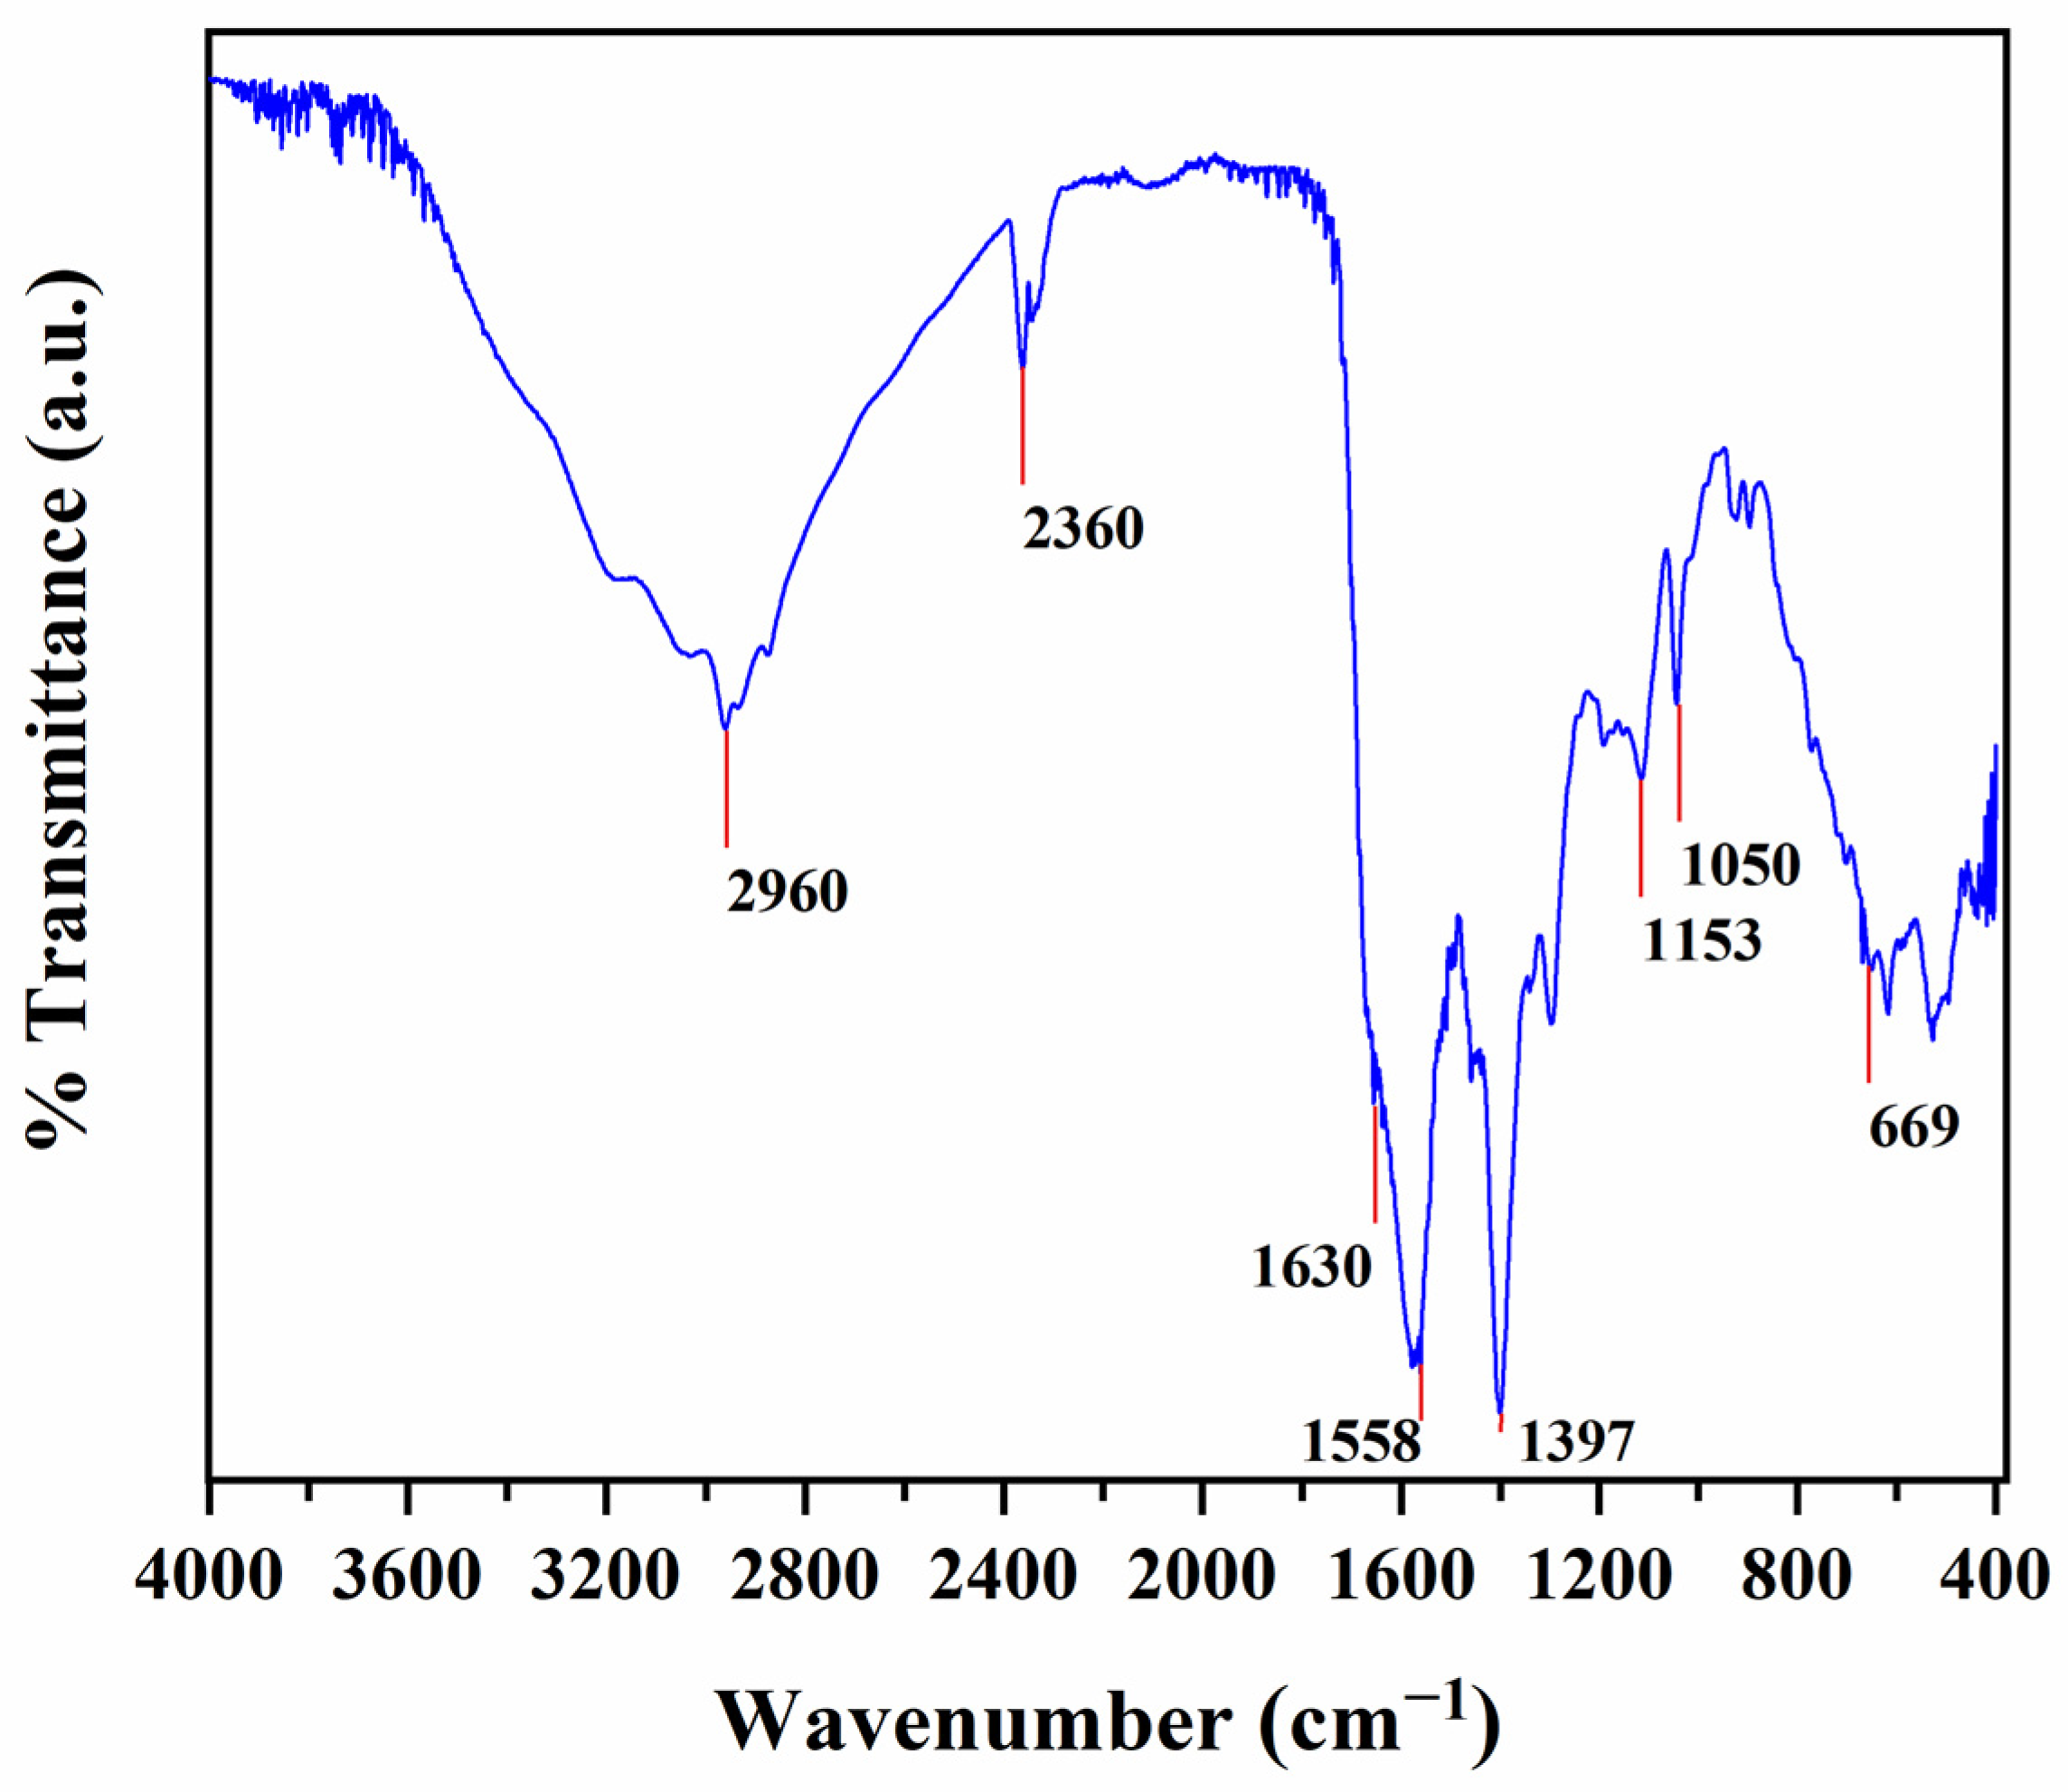
2.5. Attenuated Total Reflectance Fourier Transform Infrared (ATR-FT-IR) Spectrometry

The functional groups of the N/S-Carbon QDs were determined by ATR-FT-IR spectroscopy using a Shimadzu IR Spirit QATR-S spectrometer (Tokyo, Japan). The wavenumber range was set from 4000 to 400 cm−1 and the spectrum obtained was the average of 45 scans at 2 cm−1 resolution.

2.6. X-ray Photoelecton (XPS) Spectroscopy

A more detailed interpretation of the N/S-Carbon quantum dots surface chemical composition was achieved using XPS spectroscopy. Ultra-high vacuum conditions were applied to conduct experimental measurements and a base pressure of 4 × 10⁻⁹ mbar was obtained using a SPECS company instrument (Berlin, Germany). A monochromatic MgKa source with hv = 1253.6 eV was mounted on this instrument and a Phoibos-100 hemispherical electron analyzer was used for spectra recording and acquisition. The energy resolution target of 1.18 eV was reached with an energy step of 0.05 eV and a dwell time of 1 s. The center at 284.6 eV C1s core level was the reference for all measurable binding energies. The achieved spectra were corrected by subtracting a Shirley or linear background. Sequentially, the corrected spectra were fitted using the least squares curve-fitting program WinSpec (University of Namur, Belgium). Finally, a peak deconvolution method was used to obtain the results involving mixed Gaussian–Lorentzian functions.

2.7. Elemental Analysis

The elemental composition (molar/weight ratio of H, C, N, and S) of N/S-Carbon QDs was determined utilizing a Eurovector EA 3100–Elemental Analyzer (Pavia, Italy). The analysis was carried out by placing 1 mg of N/S-Carbon QDs in an aluminum crucible that was then heated at 950 °C in the presence of oxygen, resulting in combustion of the sample.

2.8. UV–Vis Diffuse Reflectance Spectroscopy (DRS)

The optical properties of N/S-Carbon QDs were studied utilizing UV–Vis DRS spectroscopy. The diffuse reflectance spectrum of the nanomaterial was obtained with a Shimadzu UV-2600 spectrophotometer in the wavelength range of 200 to 800 nm. Prior to measurement, extra-pure BaSO4 supplied by Nacalai Tesque (Kyoto, Japan) was used as a reference sample.

2.9. Fluorescence Spectroscopy

The fluorescence (emission properties) of the prepared N/S-Carbon QDs was studied using a Horiba FluoroMax-4 spectrofluorometer. Excitation wavelengths ranged from 300 to 492 nm with a step of 4 nm per acquired spectrum. Furthermore, the photoluminescence quantum yield of the material was also calculated using the same instrumentation. Specifically, for the measurement, a suspension (2.5 mg L−1) of N/S-Carbon QDs in distilled water and an aqueous solution containing an appropriate amount of the reference compound of known quantum yield (QYR = 4.0%) were prepared. The determination was carried out at an excitation wavelength of λΕΧ = 350 nm. Furthermore, the concentrations of both suspension and solution were properly adjusted so that their absorbance at the applied excitation wavelength was less than 0.1. Prior to measurement, the N/S-Carbon QDs suspension was sonicated for 10 min to achieve better distribution of the nanoparticles.

2.10. Thermogravimetric Analysis

The thermogravimetric behavior of the N/S-Carbon QDs was investigated using a NETZCH STA 449C thermobalance. Specifically, 7.5 mg of N/S-Carbon QDs were placed in an uncovered aluminum oxide (Al2O3) crucible and the TG signals were recorded from 10 °C to 600 °C with a heating rate of 10 °C min−1.

2.11. Ecotoxicity Assessment of N/S@Carbon QDs by Microtox Bioassay

The potential aquatic ecotoxicological effect of N/S-Carbon QDs was evaluated utilizing the Microtox bioassay. The assessment was performed using the bacterium Vibrio fischeri as a reference microorganism and the Azur Environmental m500 Analyzer (Carlsbad, CA, USA). The bacterium (Acute Reagent) in frozen form along with the reconstitution solution used for its activation were supplied by Modern Water (New Castle, DE, USA). The 81.9% Basic Test with 4 dilutions was applied according to the manufacturer’s instructions to a suspension containing 100 mg L−1 N/S-Carbon QDs, which showed no obvious coloration. Before the assessment, a phenol solution was used as a positive control sample and the determined EC50 value was equal to 25 mg L−1, in accordance with the manufacturer’s recommended range.

2.12. In Vitro Determination of Antioxidant Activity

2.12.1. Preparation of DPPH Free Radical Standard Solution

For all antioxidant activity experiments, a [DPPH] radical standard solution was prepared by dissolving 0.0212 g of DPPH in 250 mL ethanol to obtain 2.16 × 10⁻³ mol L−1 or 84.7 mg L−1 DPPH in ethanol solution. The volumetric flask was wrapped with foil to protect the [DPPH] radical from photooxidation and was stirred for 4 h. The obtained solution had a neutral pH (pH = 7.02) and was kept in the refrigerator for 2 h for stabilization [28,29].

2.12.2. Preparation of DPPH Free Radical Calibration Curve

First, a calibration curve of DPPH was prepared as follows: The as-prepared standard ethanolic solution of DPPH with initial concentration 2.16 × 10⁻³ mol L−1 was diluted to obtain 10, 20, 30, 40, 50, and 60 mg L−1. The resulting solutions were vortexed, kept in the dark, and the absorbance was measured with a Jasco V-530 UV/VIS Spectrometer at λmax = 517 nm. The calibration curve of absorbance (y) as a fraction of [DPPH] concentration (x) was determined according to the following equation:
y = 0.0401x − 0.0352; R2 = 0.9976

2.12.3. Determination of the Effective Concentration (EC50) of N/S-Carbon QDs

An appropriate quantity of the obtained N/S-Carbon QDs was dissolved in 10 mL of deionized water to obtain 0.2, 0.4, 0,6, 0,8 % (w/v) concentration levels, respectively. Thereafter, 1.8 mL of the [DPPH] ethanolic solution (0.037 mg mL−1, 9.42 × 10⁻⁵ mol L−1) and 1.2 mL of acetate buffer 100 mM (pH = 7.10) were placed in a cuvette and the absorbance of the [DPPH] radical was measured at t = 0 (A0 = 1.507). Subsequently, 1 mL of the N/S-Carbon QDs solution (2, 4, 6, and 8 mg of N/S-Carbon QDs) was added to a cuvette along with 1.8 mL of ethanol solution of [DPPH] and 0.2 mL of acetate buffer. The absorbance of the reaction mixture was measured at 517 nm. The % inhibition of [DPPH] was calculated using the following equation:
% Inhibition = At/A0 × 100
where A0 is the initial absorbance of the DPPH standard solution and At is the absorbance of remaining [DPPH] free radical after reaction for 20 min with N/S-Carbon QDs samples. The effective concentration of aqueous N/S-Carbon QDs solution that is the specific concentration that could decrease the [DPPH] concentration by 50% was estimated based on the following equation:
y = −4.0179x + 66.645; R2 = 0.9970
A blank sample with ethanol and acetate buffer (2:1, v/v) was used. Reported results are the average ± standard deviation values of three replicates (n = 3).

2.13. Testing N/S-Carbon QDs in the Preservation of Fresh Strawberries

For testing the possible application of obtained N/S-Carbon QDs as antioxidant/antibacterial agent in food preservation, a solution (0.1 wt. %) of N/S-Carbon QDs was used as a coating for fresh strawberries. Fresh strawberries are known as highly perishable foods with short shelf-life. Their high water content makes them very susceptible to mold growth. So, six fresh strawberries with similar sizes, purchased from the local fruit market, were washed with water, dried gently, and separated into two subgroups of three strawberries each. The first group of three strawberries was uncoated while the other group with three strawberries was coated with the 0.1 wt. % aqueous solution of N/S-Carbon QDs. Both groups of strawberries were left in open air at 20 °C and 50% RH for two days and weighed periodically.

3. Results and Discussion

3.1. Material Characteriazation

3.1.1. Morphological and Structural Characteristics of N/S-Carbon QDs

From the diffractogram (Figure 2) of N/S-Carbon QDs, two broad peaks around 30° and 40° can be observed, which correspond to the amorphous phase of graphitic carbon structure, according to previous reports [28,29]. In addition, the peaks located at 27.7°, 31.3° and 45.3° correspond to the Fm-3m cubic calcium crystal structure (PDF 23-430) [30], thus indicating the existence of calcium particles in the material after synthesis.
SEM-EDS analysis and surface mapping were performed on the low-magnification image of the chromium-sputtered sample in order to elucidate the surface elemental composition of the N/S-Carbon QDs. The results (Figure 3) showed that the surface structure of N/S-Carbon QDs is mainly composed of carbon, oxygen, and nitrogen atoms while sulfur atoms were found to be present although at a low concentration. Interestingly, according to the same results, calcium is also present on the surface of the material in a very low atomic ratio. This finding is in agreement with the aforementioned XRD results, confirming the existence of residual calcium particles in the material after synthesis, which could be attributed to the calcium content of the precursor (crayfish shells). Additionally, the white-colored endogenous particle spots appear to be sodium chloride particles since the elemental mapping showed that both sodium and chlorine atoms are the only ones present in these areas while the rest of the aforementioned atoms are absent. Moreover, the fact that their atomic ratios were found to be quite close further confirms the above claim.
AFM images (Figure 4) show that N/S-Carbon QDs are spherical, with a diameter varying between 5 and 8 nm (average size = 6.56 nm), thus confirming their “quantum” morphology. In particular, N/S-Carbon QDs were found to have thicknesses of 5.362, 7.633, 7.923, and 8.026 nm, which were higher than the average of 3 nm recently reported for N-doped Carbon QDs [13].
The ATR-FT-IR spectrum of N/S-Carbon QDs is presented in Figure 5. As can be observed, the characteristic peak at 2960 cm−1 is assigned to the stretching vibration of C-H bonds [28,31], while the broad band between 3000 and 3500 cm−1 confirms the presence of O-H and/or N-H bonds (bending vibration) [31,32]. Additionally, the peak at 669 cm−1 is assigned to the stretching vibration of N-H bonds while the sharp peak at 1397 cm−1 is related to the stretching vibration of C-N bonds [31,33]. The peak at 1630 cm−1 is attributed to the double bond vibration of C=O as well as C=C [31,33,34] while the peak at 1558 cm−1 corresponds to the stretching vibration of the N=O double bond [31,33,34]. Lastly, the bands at 1050 cm−1 and 1153 cm−1 are related to the stretching vibrations of C-O and C-S groups [31] and the band at 2360 cm−1 is observed as a result of the stretching vibration of the S–H bond thus confirming further the presence of sulfur. Overall, the ATR-FT-IR results are in agreement with the data obtained from EDS analysis as they confirm the presence of carbon, oxygen, nitrogen, and sulfur in the N/S-Carbon QDs structure and are consistent with previous reports [31,32,33,34].
XPS studies (Figure 6a), such as EDS, revealed that the surface of N/S-Carbon QDs is mainly composed of carbon (76.2%), oxygen (9.9%), and nitrogen (13.9%). However, the atomic concentrations of those elements differed significantly between the results of those two techniques, which could be attributed to the fact that EDS focuses only on a relatively small area/particle of the material while XPS is employed to analyze a much larger, bulk quantity.
In order to provide further insight regarding the chemical composition of N/S-Carbon QDs, high-resolution XPS analysis of the C1s, N1s, and O1s core levels was employed. From C1s, it was deduced that the material possesses high functionality on its surface including as C-N and C-O bonds as well as C-O-C and carboxyl groups (Figure 6b). In addition, the main carbon frame was revealed to be composed of C-C/C=C. The N1s spectrum (Figure 6c) demonstrated the amount and type of nitrogen dopants on the carbon structure. The highest amount of doping was found to be in the form of graphitic nitrogen (63.6%), and pyrrolic (23.8%) and quaternary nitrogen (14.9%) also contributed to a lesser extent. Finally, the O1s spectra (Figure 6d) verified the findings from the C1s peak since both carboxyl (531.3 eV) and C-OH (532.1 eV) groups were found to be present. In addition, at 533.3 eV the fitted peak was attribute to epoxy and OH groups.
Elemental analysis (Table 1) confirmed once again that N/S-Carbon QDs are mainly composed of carbon, which is doped with nitrogen and sulfur atoms. These findings are consistent with the results of EDS, ATR-FT-IR, and XPS. Interestingly, the data on carbon were found to be proportionally closer to that of EDS than that of XPS, while the opposite was revealed for nitrogen. These differences could be attributed to the fact that elemental analysis provides information regarding the atomic composition of the material as a whole (mass), while EDS and XPS are used to determine only the surface composition.

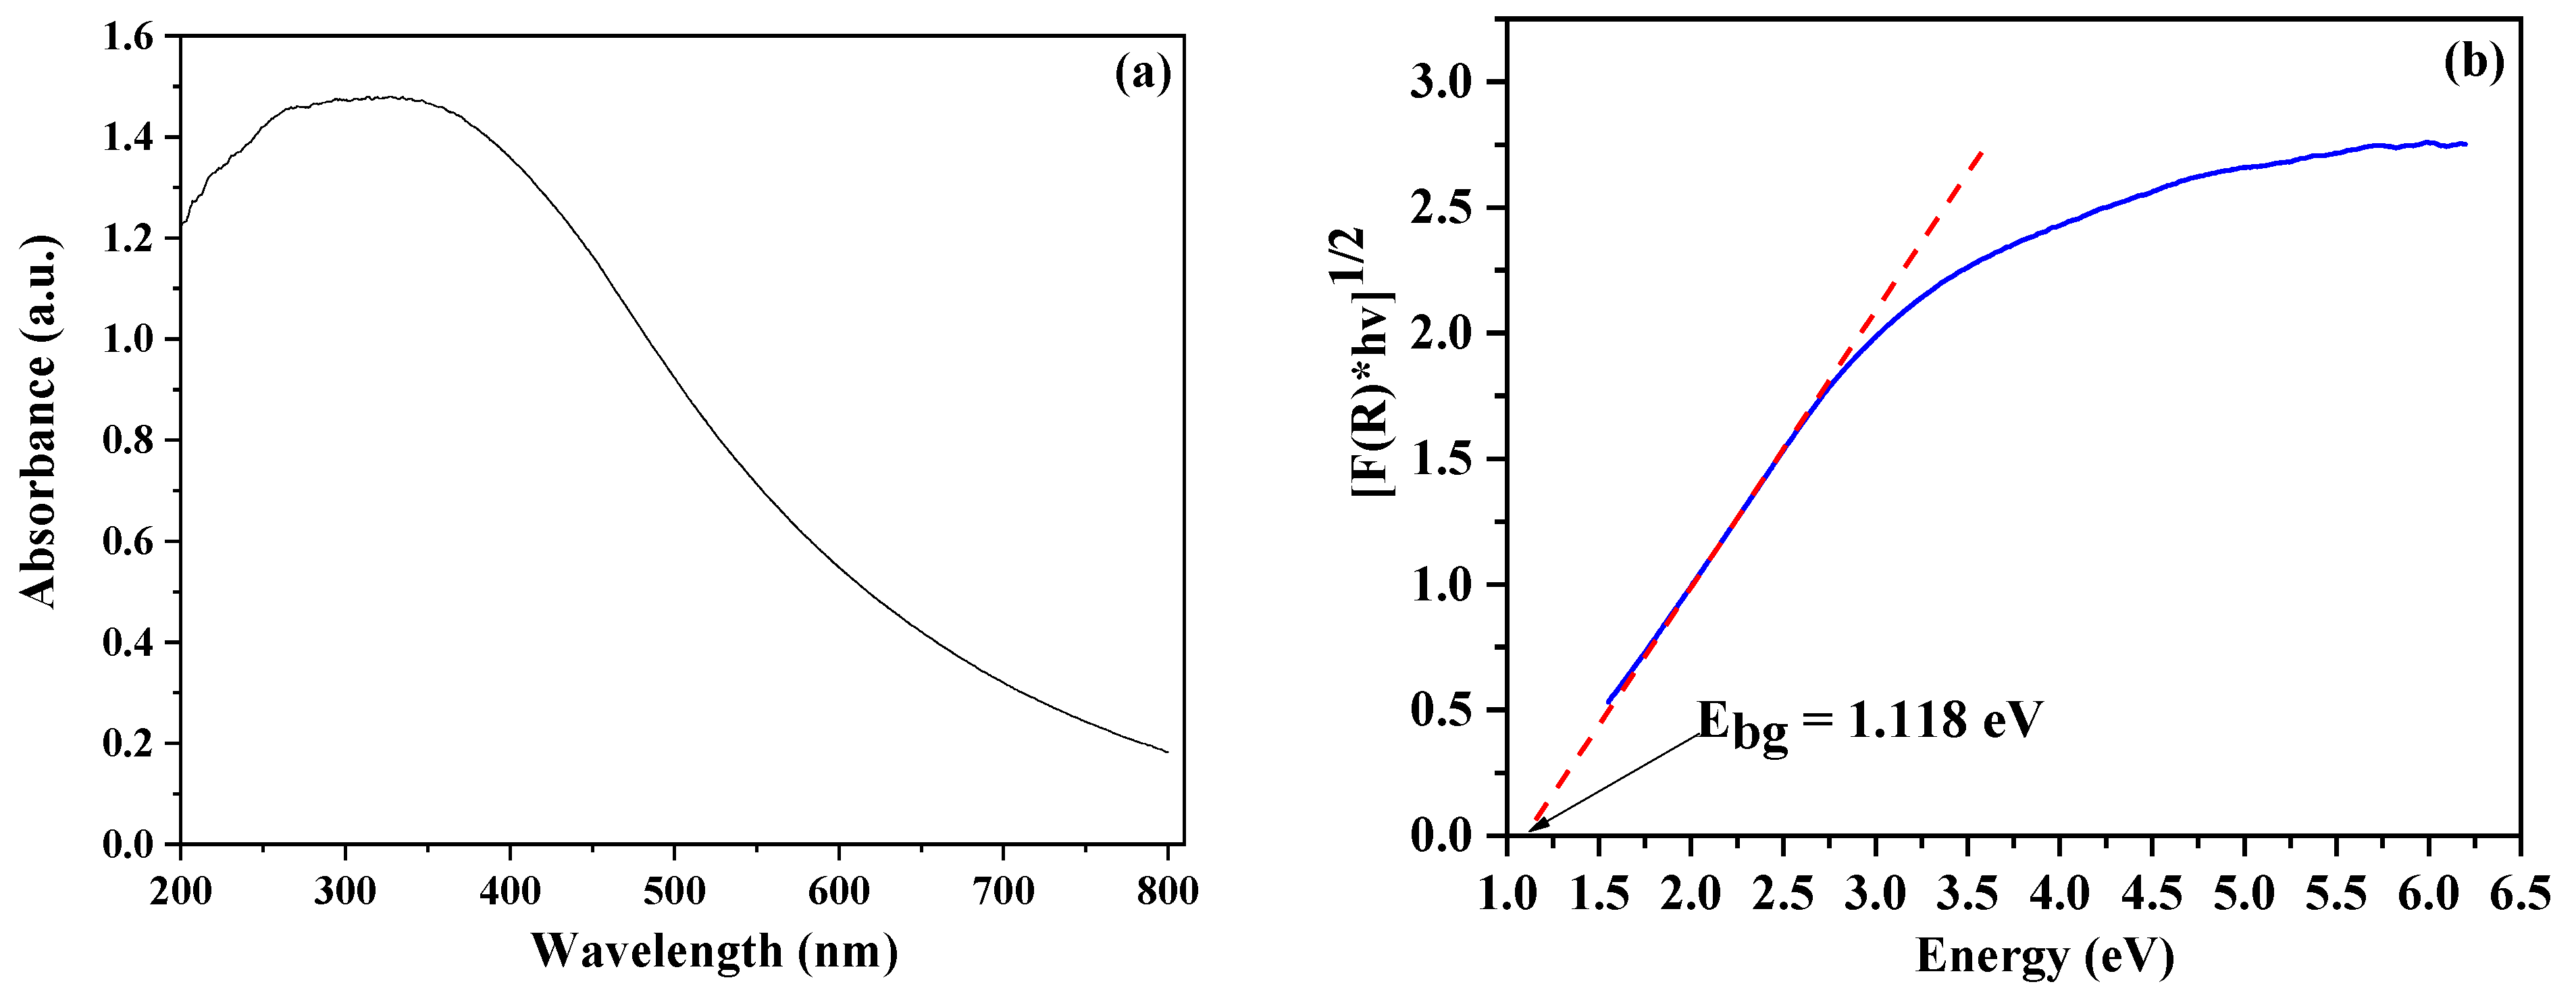
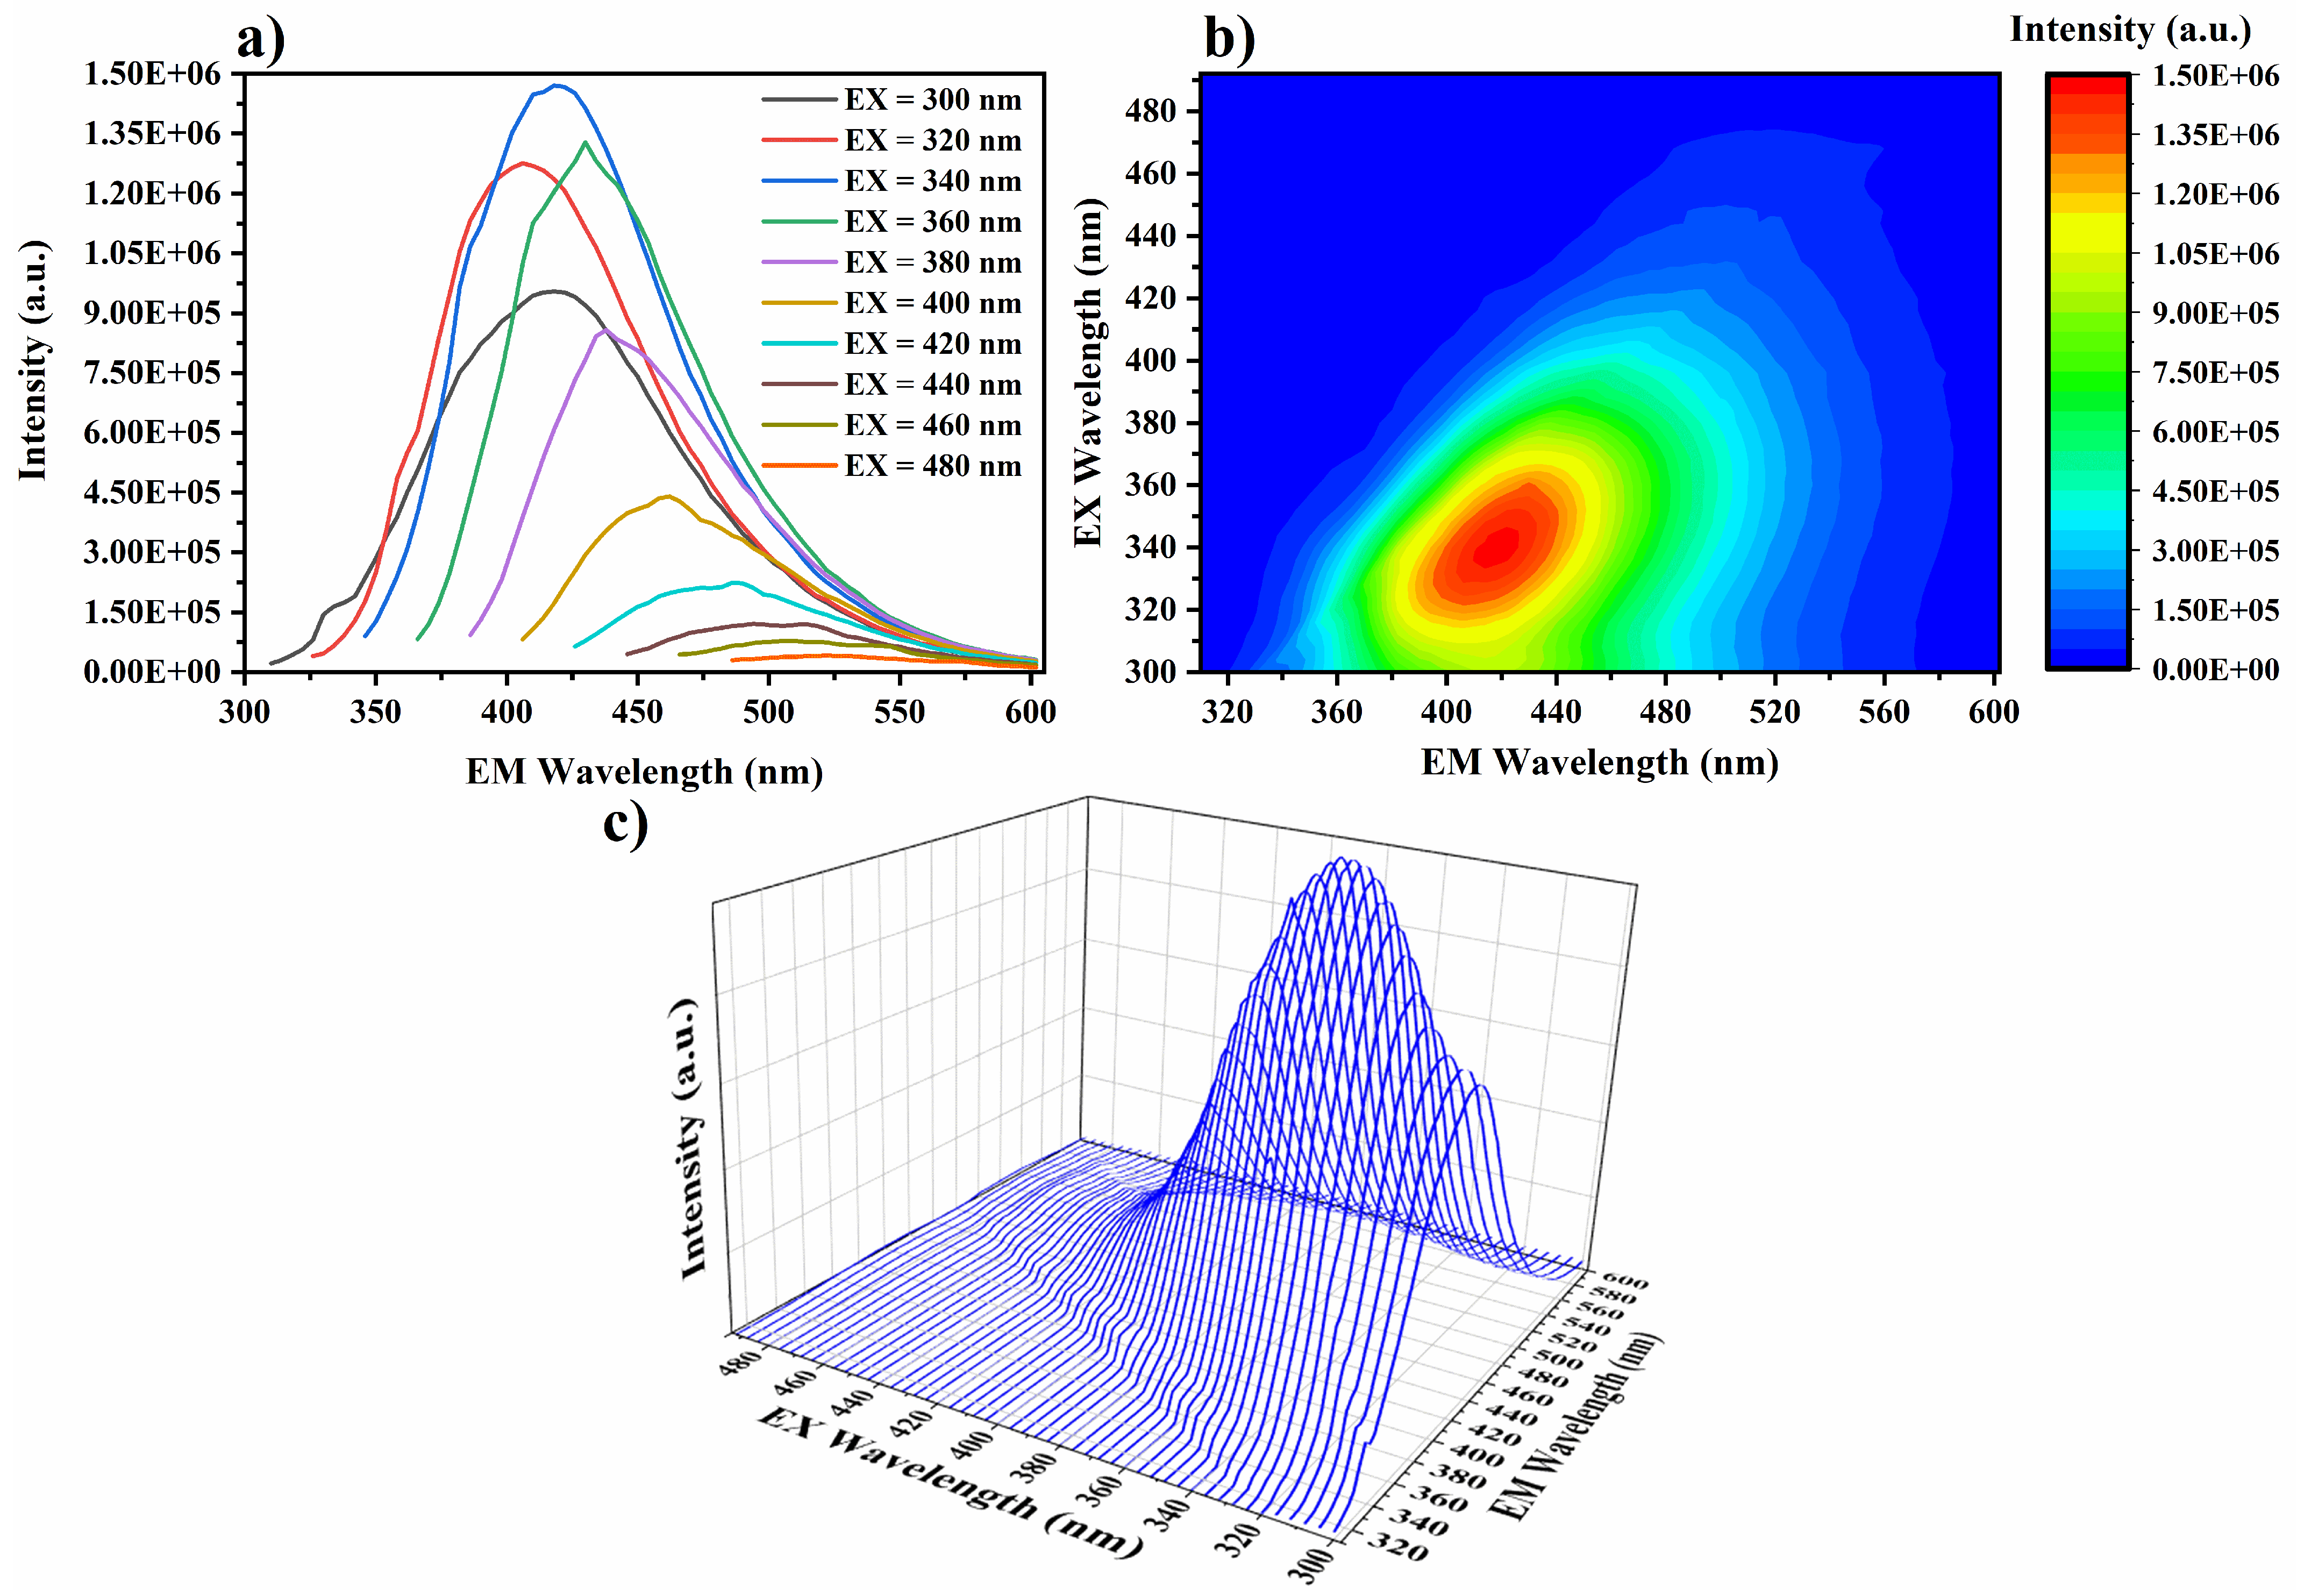
3.1.2. Optical Properties of N/S-Carbon QDs

As can be observed in Figure 7a, the absorbance of N/S-Carbon QDs extended towards the visible region at around 700 nm [35,36]. This absorption in the visible spectrum is probably related to the presence of calcium in the structure of the material, as revealed by XRD and EDS. Similar results were reported by Ren et al. [36], who prepared calcium-capped carbon QDs with absorbance in the visible light region with a maximum at 405 nm. In the case of the as-prepared N/S-Carbon QDs, the maximum absorbance for N/S-Carbon QDs was displayed at 334 nm and could be attributed to the n → π* transition of conjugated C=O or C=N.
The indirect band-gap energy (Eg) for N/S-Carbon QDs was calculated by plotting the transformed Kübelka–Münk function [37] versus the band gap energy as shown in Figure 7b. The calculated Eg value (1.118 eV) was found to be much lower than those calculated for carbon QDs obtained from shrimp shell chitin and chitosan [38]. This is related to the aforementioned absorbance in the visible spectrum, which is possibly due to the presence of calcium atoms.
Fluorescence spectroscopy results (Figure 8a) revealed that when the N/S-Carbon QDs are excited at λEX = 300 nm they emit at λEM = 418 nm. From Figure 8b,c, it becomes evident that as the excitation wavelength increases, so does the intensity of the emission peak, with the emission wavelength showing little to no variation. However, after λEX = 340 nm, the intensity of the emission peak starts to gradually decrease. Furthermore, as the excitation wavelength increases beyond this point, a shift in the emission peak to higher wavelengths is observed, which is a phenomenon known as red shift [39]. Therefore, for λEX > 340 nm, the emission wavelength of N/S-Carbon QDs appears highly dependent on the applied excitation wavelength. These results are in agreement with the findings of other photoluminescence studies on crayfish-derived CQDs, according to which the emission wavelength and the emission intensity depend on the emission wavelength [40]. This photoluminescence behavior of the N/S-Carbon QDs could be the result of the differences between the material’s particle sizes and the surface defects caused by the presence of various functional groups [40].
The quantum yield of the as-prepared N/S-Carbon QDs was calculated using the equation [40]: QYS = QYR ( S S S R × A R A S × n S 2 n R 2 ), where QYS and QYR are the quantum yields of the sample and reference compound, respectively; AS and AR are their absorptions at the excitation wavelength (350 nm); SS and SR are the integrated areas of their corresponding emission peaks; and nS and nR are the refractive indices of the solvent, which in both cases is distilled water. N/S-Carbon QDs demonstrated a QYS of ~8 %, which is very close to the QY values of other crayfish-derived QDs [40], as well as fruit-derived QDs [40]. The presence of heteroatoms such as nitrogen and sulfur on the material surface seems to play an important role in its photoluminescence properties, as shown in similar studies [40]. Specifically, the functional groups that contain nitrogen are known to be capable of passivating the active sites on the material surface by stabilizing the excitons and improving its overall photoluminescence capabilities [40]. Therefore, the existence of nitrogen- and sulfur-containing functional groups on the N/S-Carbon QDs surface might explain why the measured QY was higher than that of other nitrogen-doped CQDs containing lower quantities of heteroatoms [40].

3.1.3. Thermal Stability of N/S-Carbon QDs

Figure 9 depicts the thermogravimetric (TG) and differential scanning calorimetry (DSC) analyses of the obtained N/S-Carbon QDs. The TG curve displays two mass loss steps. The first is an endothermic process that starts at 50 °C and ends at 150 °C, corresponding to the evaporation/desorption of water molecules. The second starts at 200 °C and ends at 500 °C and consists of several exothermic processes that are related to the thermal degradation of the different moieties of the material [41]. Based on the differential TG (DTG) curve, discrete peaks were recorded at about 216, 238, 250, 264 and 355 °C. As a result, the prepared N/S-Carbon QDs show good thermal stability regarding their applicability under common environmental and storage conditions.

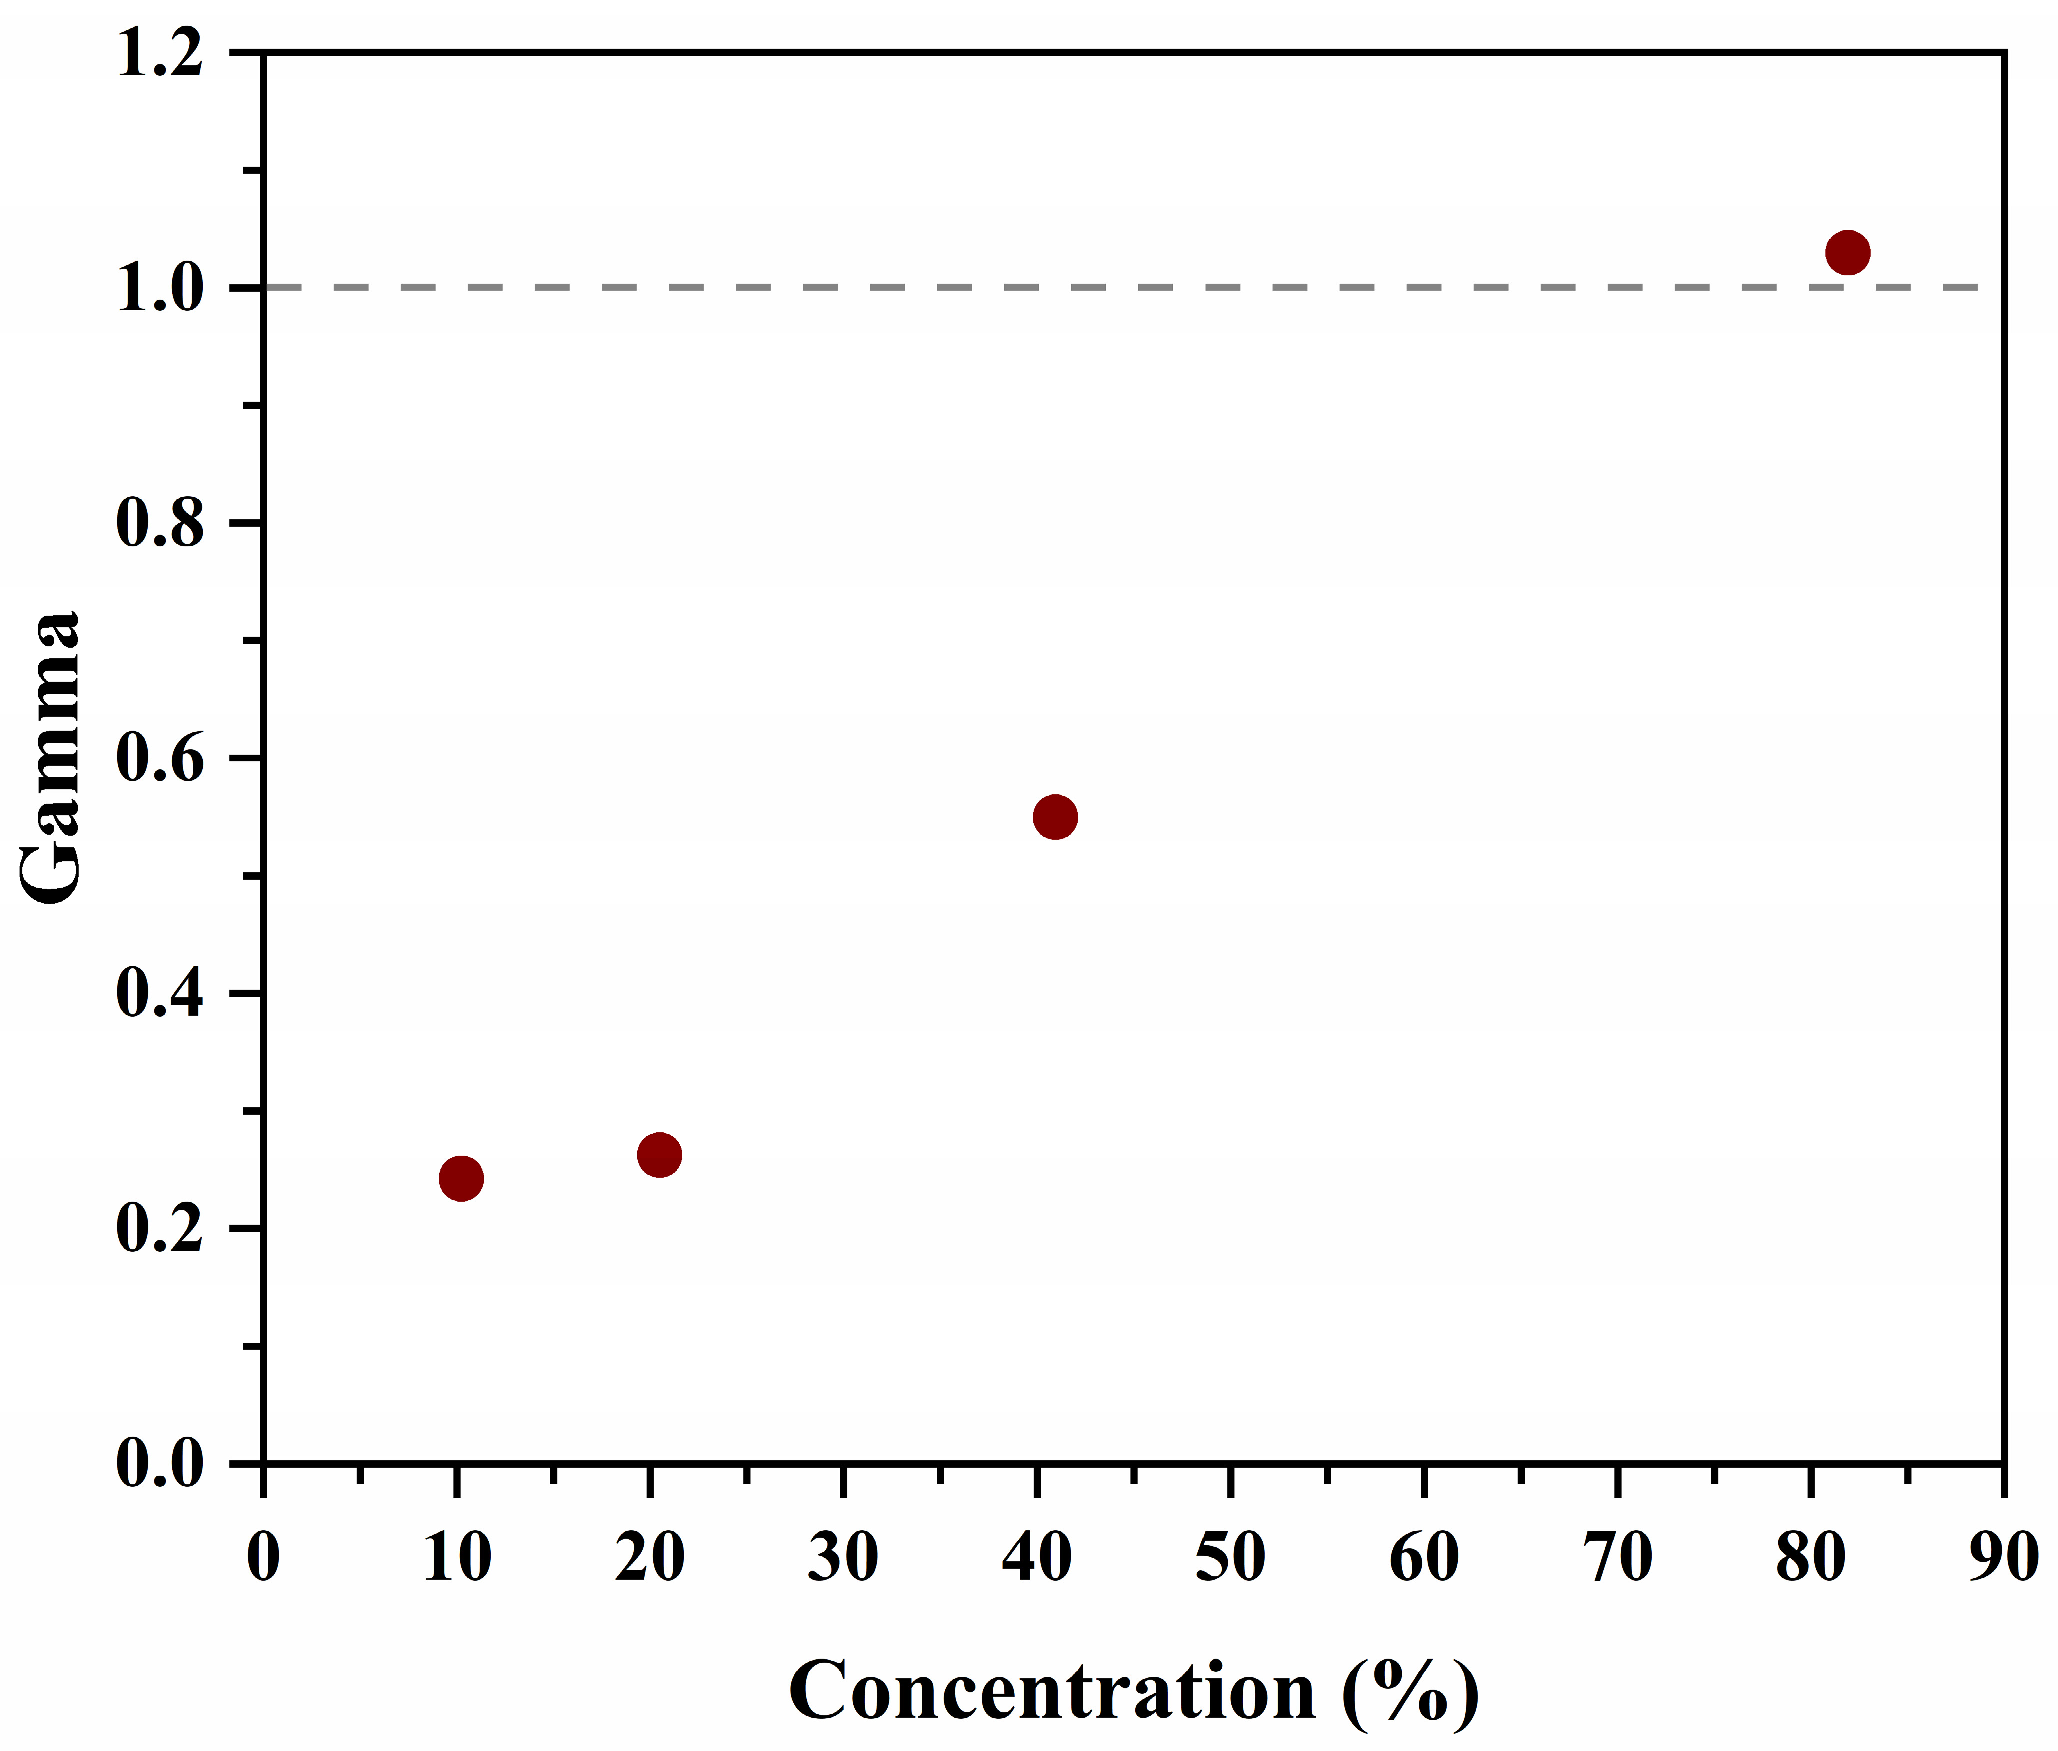
3.1.4. Ecotoxicity Assessment of N/S-Carbon QDs

The potential ecotoxicological impact of nanomaterials is of utmost importance when their potential applications focus on issues such as environmental remediation or food processing/packaging. According to the results of the Microtox bioassay presented in Figure 10, the EC50 for N/S-Carbon QDs in Vibrio fischeri is equal to 82.58% of the material’s initial concentration (100 mg L−1), i.e., 82.58 mg L−1. This value, in accordance to the Globally Harmonized System of Classification and Labeling of Chemicals (GHS) [36], qualifies the material as “Harmful” to the reference microorganism and not as toxic. However, since the “Harmful” category ranges for EC50 values between 10 and 100 mg L−1, it becomes apparent that N/S-Carbon QDs are not particularly dangerous for this microorganism.

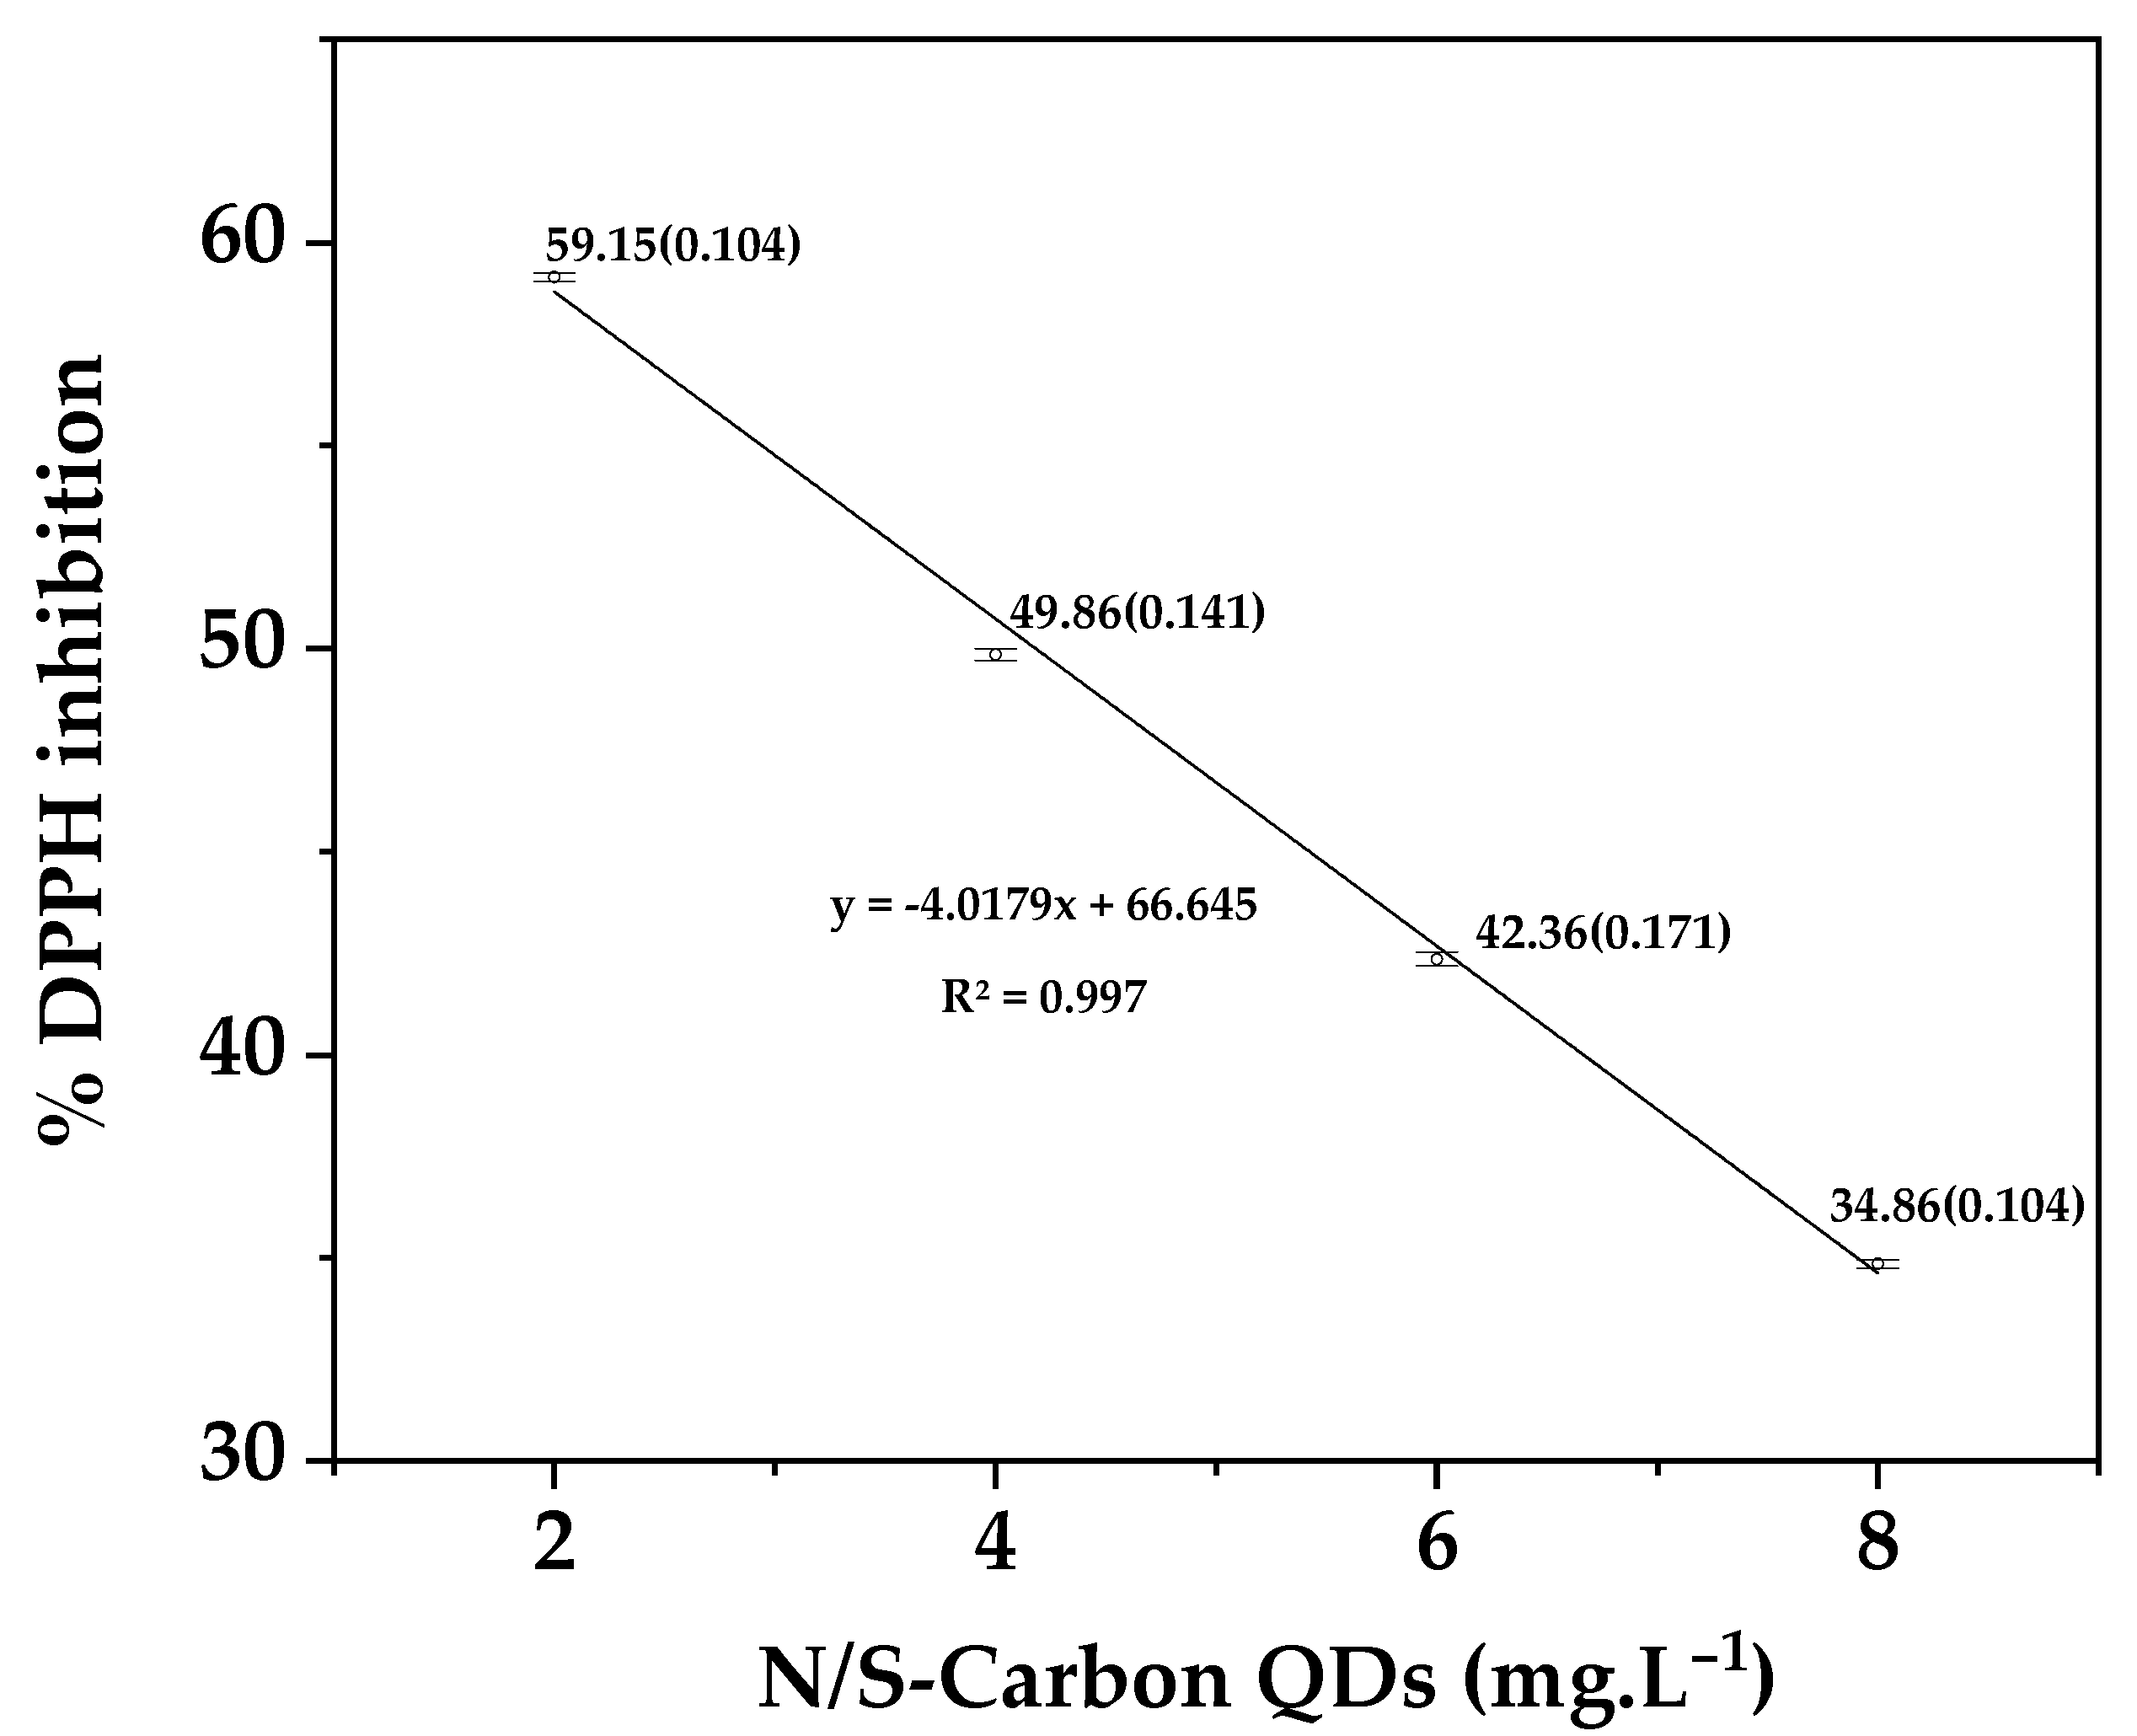
3.1.5. Antioxidant Activity of N/S-Carbon QDs

In Figure 11, the values of % DPPH radical inhibition calculated from Equation (2) are plotted as a function of N/S-Carbon QDs concentration. From the plotted values, the linear Equation (3) was fitted. From Equation (3), the effective concentration of aqueous N/S-Carbon QDs (EC50) solution that decreases the [DPPH] concentration by 50% was calculated as equal to 4.14 mg L−1 or 4.14 μgmL−1. This value is much lower than the EC50 values reported previously for other carbon QDs [41,42,43,44] and implies a superior antioxidant activity of the obtained N/S-Carbon QDs. The [DPPH] antioxidant activity mechanism is reported to act through [DPPH] quenching by hydrogen atom transfer from the carboxyl, hydroxyl, and/or amino groups located in the surface of N/S-Carbon QDs [42,45]. In our case, it is suggested that the mechanism of [DPPH] quenching by the hydrogen atoms of N/S-Carbon QDs is boosted further by the presence of calcium atoms. This significant antioxidant activity of obtained N/S-Carbon QDs indicate the potential use of such QDs in food preservation applications.

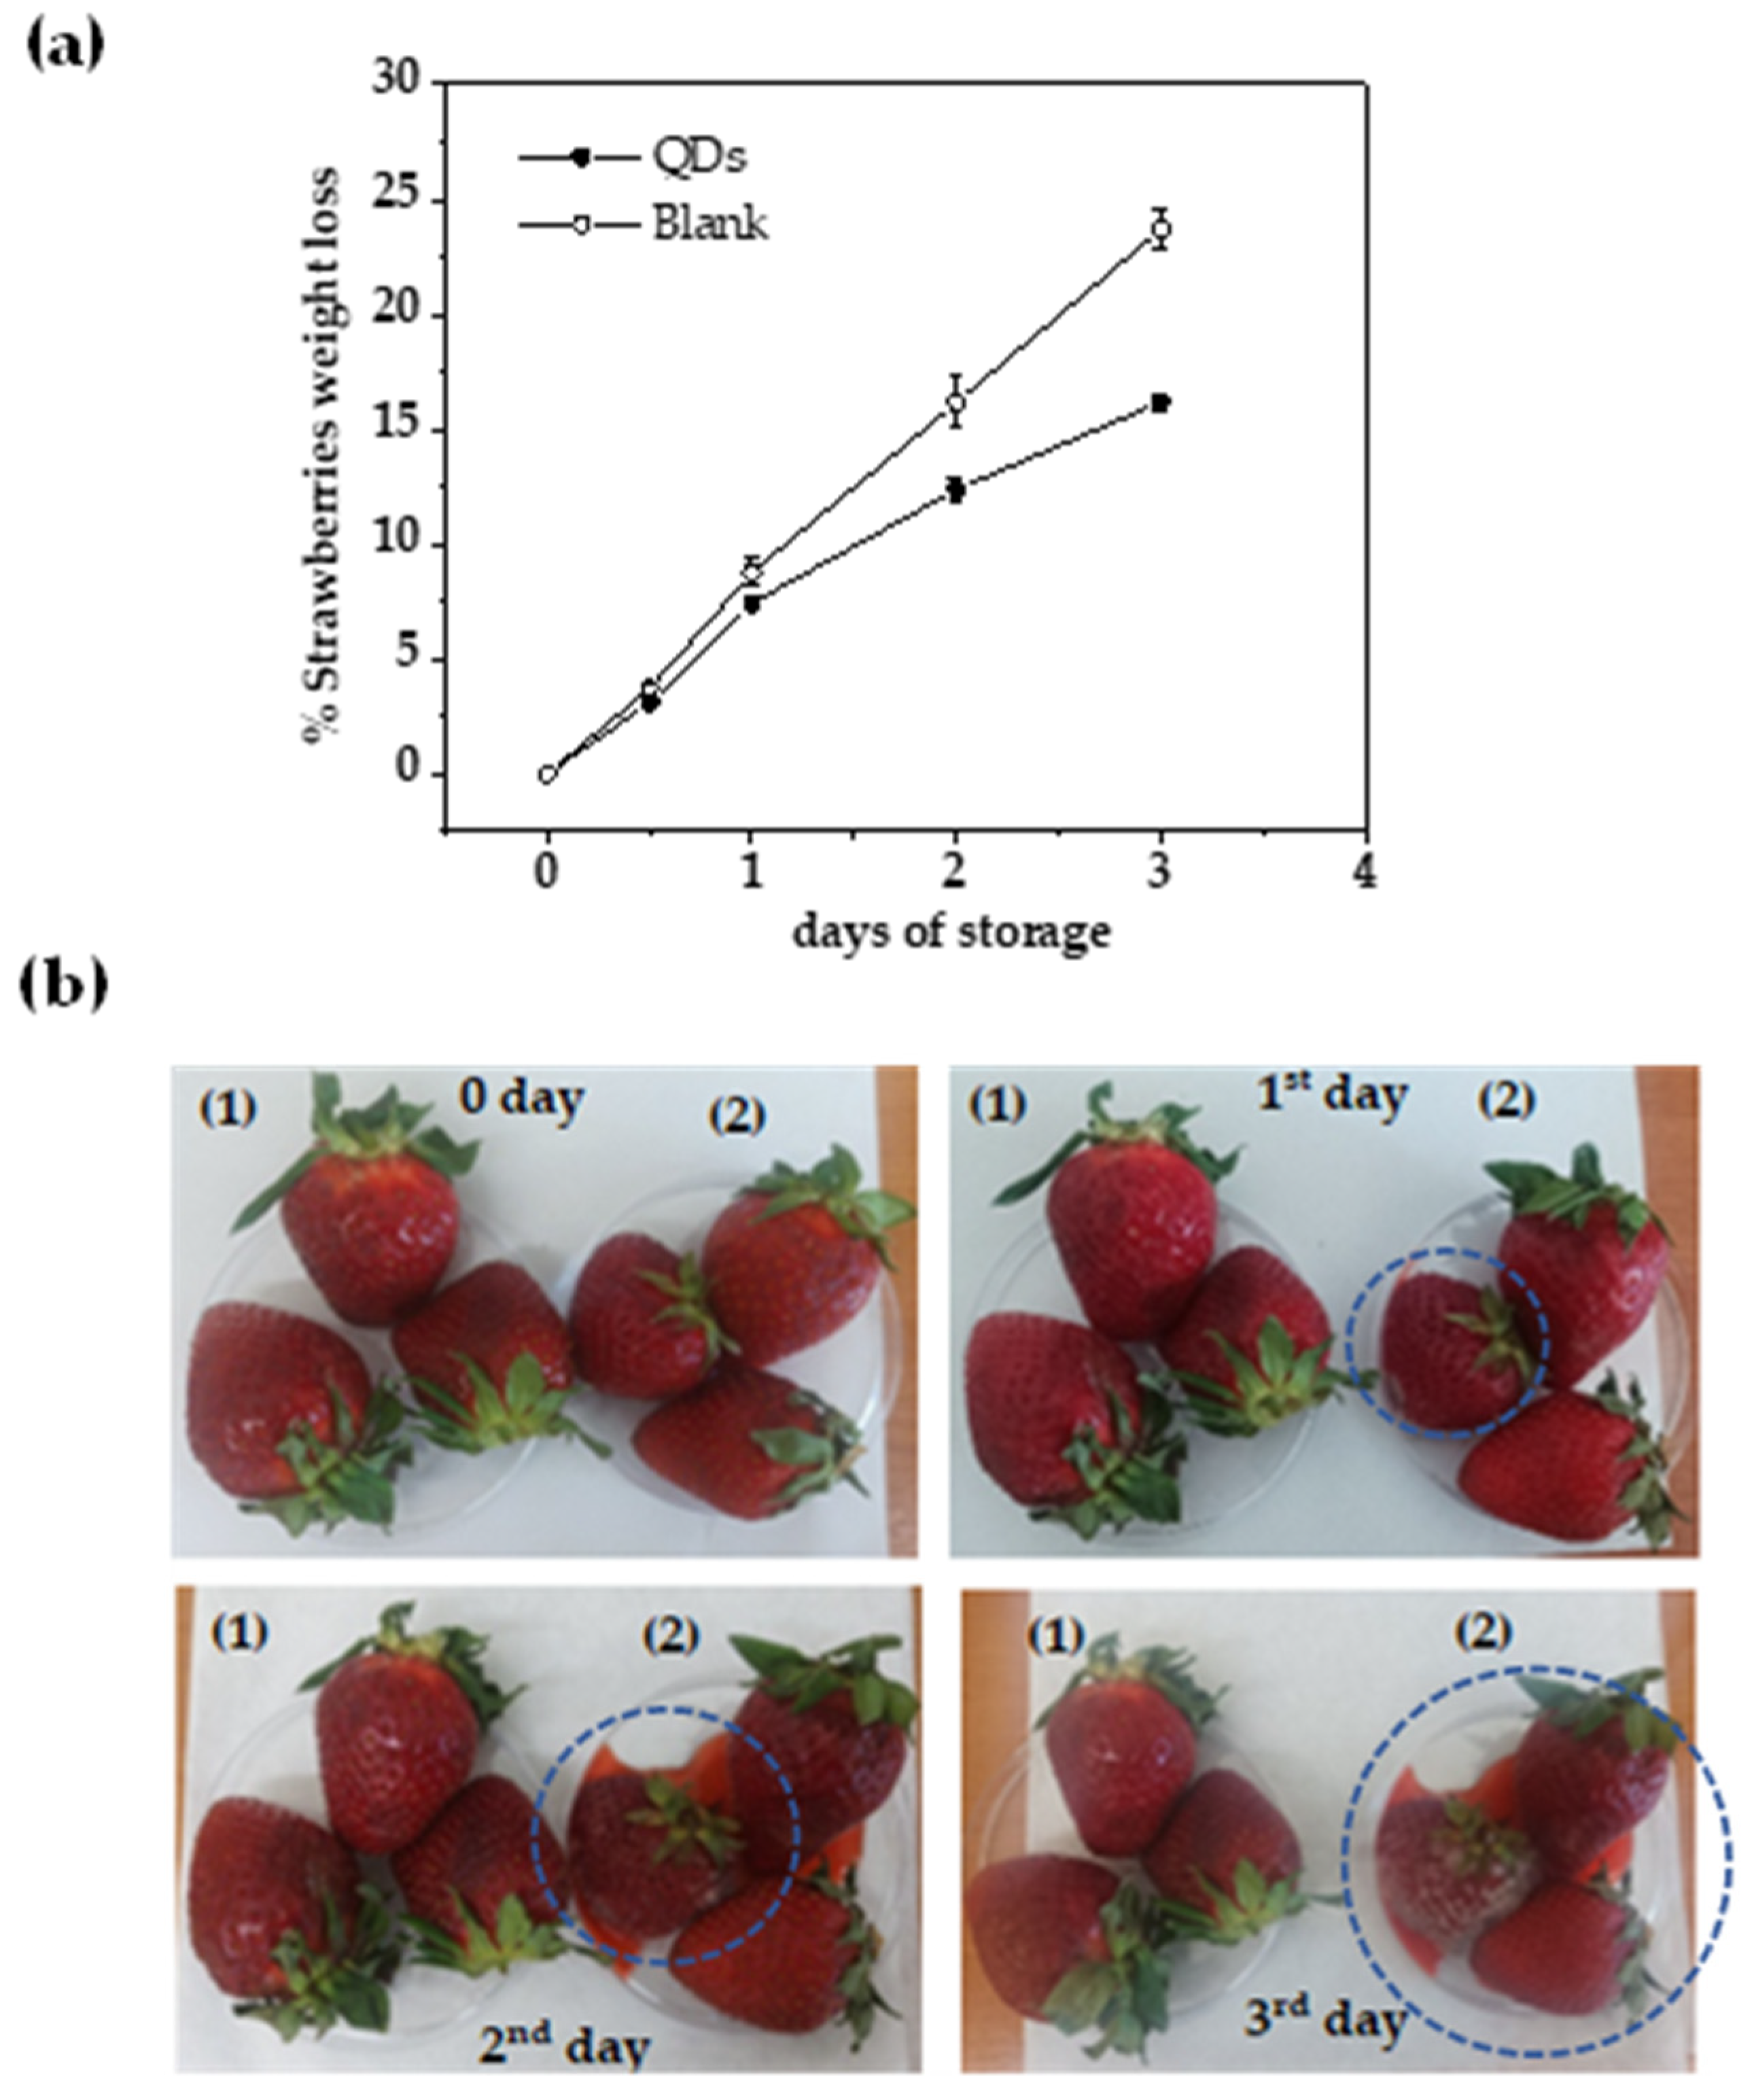
3.2. Testing N/S-Carbon QDs for the Preservation of Fresh Strawberries

Figure 12 shows a weight loss plot of fresh strawberries as a function of storage day (Figure 12a), along with the images of stored strawberries after 0, 1, 2, and 3 days of storage (Figure 12b).
The rate of weight loss of strawberries coated with N/S-Carbon QDs is much lower than the weight loss rate of uncoated strawberries (Figure 12a). In the images in Figure 12b it is evident that the growth of mold starts on the uncoated strawberries on day 1 of storage (see the blue circles). On days 2 and 3 of storage, the loss of strawberry juice is obviously high and the growth of mold fungi increased further. On the contrary, the strawberries coated with N/S-Carbon QDs better retain their shape and color, and no evidence of mold growth is observed during 3 days of storage.

4. Conclusions

Based on the results obtained from multi-instrumental analysis and characterization, the experimental approach reported herein achieved the successful preparation of nitrogen- and sulfur-doped carbon quantum dots from the food biowaste crayfish shell. The functional groups of the external rough surface of the spherical particles exhibited fluorescence under specific UV light wavelengths while the ecotoxicity of the material was relatively low. Furthermore, the superior antioxidant activity of the N/S-Carbon QDs, as compared to other similar materials, indicates that they are a potentially suitable material for food packaging applications.

Author Contributions

Conceptualization, I.K., A.E.G. and C.E.S.; methodology, I.K., A.E.G. and C.E.S.; formal analysis, A.K., C.L. and V.K.K.; investigation, A.K., C.L., V.K.K., S.G. and V.S.; resources, I.K., A.E.G. and C.E.S.; data curation, A.K., C.L., V.S. and A.L.; writing—original draft preparation, A.K., C.L., C.E.S., A.E.G. and I.K.; writing—review and editing, I.K., C.L., A.E.G. and C.E.S.; visualization, A.K., C.L. and S.G.; supervision, I.K. All authors have read and agreed to the published version of the manuscript.

Funding

This research received no external funding.

Data Availability Statement

Data are presented in the manuscript.

Acknowledgments

The authors acknowledge Flerianos S.A. fish and seafood processing company as well as Athina Evmorfopoulou.

Conflicts of Interest

The authors declare no conflict of interest.

References

  1. Hamam, M.; Chinnici, G.; Di Vita, G.; Pappalardo, G.; Pecorino, B.; Maesano, G.; D’Amico, M. Circular Economy Models in Agro-Food Systems: A Review. Sustainability 2021, 13, 3453. [Google Scholar] [CrossRef]
  2. Fan, H.; Zhang, M.; Bhandari, B.; Yang, C. Food Waste as a Carbon Source in Carbon Quantum Dots Technology and Their Applications in Food Safety Detection. Trends Food Sci. Technol. 2020, 95, 86–96. [Google Scholar] [CrossRef]
  3. Xu, X.; Ray, R.; Gu, Y.; Ploehn, H.J.; Gearheart, L.; Raker, K.; Scrivens, W.A. Electrophoretic Analysis and Purification of Fluorescent Single-Walled Carbon Nanotube Fragments. J. Am. Chem. Soc. 2004, 126, 12736–12737. [Google Scholar] [CrossRef] [PubMed]
  4. Tan, X.W.; Romainor, A.N.B.; Chin, S.F.; Ng, S.M. Carbon Dots Production via Pyrolysis of Sago Waste as Potential Probe for Metal Ions Sensing. J. Anal. Appl. Pyrolysis 2014, 105, 157–165. [Google Scholar] [CrossRef]
  5. Wang, Y.; Hu, A. Carbon Quantum Dots: Synthesis, Properties and Applications. J. Mater. Chem. C 2014, 2, 6921. [Google Scholar] [CrossRef] [Green Version]
  6. Liu, W.; Diao, H.; Chang, H.; Wang, H.; Li, T.; Wei, W. Green Synthesis of Carbon Dots from Rose-Heart Radish and Application for Fe3+ Detection and Cell Imaging. Sens. Actuators B Chem. 2017, 241, 190–198. [Google Scholar] [CrossRef]
  7. Janus, Ł.; Piątkowski, M.; Radwan-Pragłowska, J.; Bogdał, D.; Matysek, D. Chitosan-Based Carbon Quantum Dots for Biomedical Applications: Synthesis and Characterization. Nanomaterials 2019, 9, 274. [Google Scholar] [CrossRef] [Green Version]
  8. Das, R.; Bandyopadhyay, R.; Pramanik, P. Carbon Quantum Dots from Natural Resource: A Review. Mater. Today Chem. 2018, 8, 96–109. [Google Scholar] [CrossRef]
  9. Khairol Anuar, N.K.; Tan, H.L.; Lim, Y.P.; So’aib, M.S.; Abu Bakar, N.F. A Review on Multifunctional Carbon-Dots Synthesized From Biomass Waste: Design/Fabrication, Characterization and Applications. Front. Energy Res. 2021, 9, 67. [Google Scholar]
  10. Chen, S.; Jiang, S.; Jiang, H. A Review on Conversion of Crayfish-Shell Derivatives to Functional Materials and Their Environmental Applications. J. Bioresour. Bioprod. 2020, 5, 238–247. [Google Scholar] [CrossRef]
  11. Lim, S.Y.; Shen, W.; Gao, Z. Carbon Quantum Dots and Their Applications. Chem. Soc. Rev. 2015, 44, 362–381. [Google Scholar] [CrossRef] [PubMed]
  12. Qu, K.; Wang, J.; Ren, J.; Qu, X. Carbon Dots Prepared by Hydrothermal Treatment of Dopamine as an Effective Fluorescent Sensing Platform for the Label-Free Detection of Iron(III) Ions and Dopamine. Chem.—A Eur. J. 2013, 19, 7243–7249. [Google Scholar] [CrossRef]
  13. Qian, Z.; Ma, J.; Shan, X.; Feng, H.; Shao, L.; Chen, J. Highly Luminescent N-Doped Carbon Quantum Dots as an Effective Multifunctional Fluorescence Sensing Platform. Chem.—A Eur. J. 2014, 20, 2254–2263. [Google Scholar] [CrossRef]
  14. Liu, S.; Tian, J.; Wang, L.; Zhang, Y.; Qin, X.; Luo, Y.; Asiri, A.M.; Al-Youbi, A.O.; Sun, X. Hydrothermal Treatment of Grass: A Low-Cost, Green Route to Nitrogen-Doped, Carbon-Rich, Photoluminescent Polymer Nanodots as an Effective Fluorescent Sensing Platform for Label-Free Detection of Cu(II) Ions. Adv. Mater. 2012, 24, 2037–2041. [Google Scholar] [CrossRef]
  15. Zhao, L.; Zhang, M.; Mujumdar, A.S.; Wang, H. Application of Carbon Dots in Food Preservation: A Critical Review for Packaging Enhancers and Food Preservatives. Crit. Rev. Food Sci. Nutr. 2022, 17, 1–19. [Google Scholar] [CrossRef]
  16. Moradi, M.; Molaei, R.; Kousheh, S.A.; Guimarães, J.T.; McClements, D.J. Carbon Dots Synthesized from Microorganisms and Food By-Products: Active and Smart Food Packaging Applications. Crit. Rev. Food Sci. Nutr. 2023, 63, 1943–1959. [Google Scholar] [CrossRef]
  17. Ezati, P.; Rhim, J.-W.; Molaei, R.; Priyadarshi, R.; Roy, S.; Min, S.; Kim, Y.H.; Lee, S.-G.; Han, S. Preparation and Characterization of B, S, and N-Doped Glucose Carbon Dots: Antibacterial, Antifungal, and Antioxidant Activity. Sustain. Mater. Technol. 2022, 32, e00397. [Google Scholar] [CrossRef]
  18. Ezati, P.; Rhim, J.-W.; Molaei, R.; Rezaei, Z. Carbon Quantum Dots-Based Antifungal Coating Film for Active Packaging Application of Avocado. Food Packag. Shelf Life 2022, 33, 100878. [Google Scholar] [CrossRef]
  19. Zhao, L.; Zhang, M.; Mujumdar, A.S.; Adhikari, B.; Wang, H. Preparation of a Novel Carbon Dot/Polyvinyl Alcohol Composite Film and Its Application in Food Preservation. ACS Appl Mater Interfaces 2022, 14, 37528–37539. [Google Scholar] [CrossRef]
  20. Khoshkalampour, A.; Ghorbani, M.; Ghasempour, Z. Cross-Linked Gelatin Film Enriched with Green Carbon Quantum Dots for Bioactive Food Packaging. Food Chem. 2023, 404, 134742. [Google Scholar] [CrossRef]
  21. Sun, C.; Zhang, Y.; Wang, P.; Yang, Y.; Wang, Y.; Xu, J.; Wang, Y.; Yu, W.W. Synthesis of Nitrogen and Sulfur Co-Doped Carbon Dots from Garlic for Selective Detection of Fe3+. Nanoscale Res. Lett. 2016, 11, 110. [Google Scholar] [CrossRef] [PubMed] [Green Version]
  22. Zhang, J.; Wang, H.; Xiao, Y.; Tang, J.; Liang, C.; Li, F.; Dong, H.; Xu, W. A Simple Approach for Synthesizing of Fluorescent Carbon Quantum Dots from Tofu Wastewater. Nanoscale Res. Lett. 2017, 12, 611. [Google Scholar] [CrossRef] [PubMed] [Green Version]
  23. Wu, P.; Li, W.; Wu, Q.; Liu, Y.; Liu, S. Hydrothermal Synthesis of Nitrogen-Doped Carbon Quantum Dots from Microcrystalline Cellulose for the Detection of Fe 3+ Ions in an Acidic Environment. RSC Adv. 2017, 7, 44144–44153. [Google Scholar] [CrossRef] [Green Version]
  24. Zhou, J.; Sheng, Z.; Han, H.; Zou, M.; Li, C. Facile Synthesis of Fluorescent Carbon Dots Using Watermelon Peel as a Carbon Source. Mater. Lett. 2012, 66, 222–224. [Google Scholar] [CrossRef]
  25. Lu, W.; Qin, X.; Asiri, A.M.; Al-Youbi, A.O.; Sun, X. Green Synthesis of Carbon Nanodots as an Effective Fluorescent Probe for Sensitive and Selective Detection of Mercury(II) Ions. J. Nanopart. Res. 2012, 15, 1344. [Google Scholar] [CrossRef]
  26. Wang, L.; Zhou, H.S. Green Synthesis of Luminescent Nitrogen-Doped Carbon Dots from Milk and Its Imaging Application. Anal. Chem. 2014, 86, 8902–8905. [Google Scholar] [CrossRef]
  27. Barati, A.; Shamsipur, M.; Arkan, E.; Hosseinzadeh, L.; Abdollahi, H. Synthesis of Biocompatible and Highly Photoluminescent Nitrogen Doped Carbon Dots from Lime: Analytical Applications and Optimization Using Response Surface Methodology. Mater. Sci. Eng. C 2015, 47, 325–332. [Google Scholar] [CrossRef]
  28. Chen, S.; Ouyang, W.; Zhu, Y.; He, L.; Zou, L.; Ao, X.; Liu, S.; Yang, Y.; Li, J. Facile Synthesis of N, S-Doped Carbon Quantum Dots from Food Waste as Fluorescent Probe for Sensitive Detection of Thiamphenicol and Its Analogues in Real Food Samples along with an Application in Bioimaging. Foods 2022, 11, 2414. [Google Scholar] [CrossRef]
  29. Ding, C.; Deng, Z.; Chen, J.; Jin, Y. One-Step Microwave Synthesis of N,S Co-Doped Carbon Dots from 1,6-Hexanediamine Dihydrochloride for Cell Imaging and Ion Detection. Colloids Surf. B Biointerfaces 2020, 189, 110838. [Google Scholar] [CrossRef]
  30. Smith, J.F.; Carlson, O.N.; Carlson, R.W. Allotropic Modifications of Calcium. J. Electrochem. Soc. 1956, 103, 409–413. [Google Scholar] [CrossRef]
  31. Elango, D.; Packialakshmi, J.S.; Manikandan, V.; Jayanthi, P. Sustainable Synthesis of Carbon Quantum Dots from Shrimp Shell and Its Emerging Applications. Mater. Lett. 2022, 312, 131667. [Google Scholar] [CrossRef]
  32. Chandrasekaran, P.; Arul, V.; Sethuraman, M.G. Ecofriendly Synthesis of Fluorescent Nitrogen-Doped Carbon Dots from Coccinia grandis and Its Efficient Catalytic Application in the Reduction of Methyl Orange. J. Fluoresc. 2020, 30, 103–112. [Google Scholar] [CrossRef] [PubMed]
  33. Chen, Y.; Wu, Y.; Weng, B.; Wang, B.; Li, C. Facile Synthesis of Nitrogen and Sulfur Co-Doped Carbon Dots and Application for Fe(III) Ions Detection and Cell Imaging. Sens. Actuators B Chem. 2016, 223, 689–696. [Google Scholar] [CrossRef]
  34. Liao, S.; Zhao, X.; Zhu, F.; Chen, M.; Wu, Z.; Song, X.; Yang, H.; Chen, X. Novel S, N-Doped Carbon Quantum Dot-Based “off-on” Fluorescent Sensor for Silver Ion and Cysteine. Talanta 2018, 180, 300–308. [Google Scholar] [CrossRef]
  35. Jiang, K.; Wang, Y.; Cai, C.; Lin, H. Conversion of Carbon Dots from Fluorescence to Ultralong Room-Temperature Phosphorescence by Heating for Security Applications. Adv Mater 2018, 30, e1800783. [Google Scholar] [CrossRef]
  36. Ren, S.; Liu, B.; Han, G.; Zhao, H.; Zhang, Y. Surface Chemistry in Calcium Capped Carbon Quantum Dots. Nanoscale 2021, 13, 12149–12156. [Google Scholar] [CrossRef] [PubMed]
  37. Xu, P.; Mi, L.; Wang, P.-N. Improved Optical Response for N-Doped Anatase TiO2 Films Prepared by Pulsed Laser Deposition in N2/NH3/O2 Mixture. J. Cryst. Growth 2006, 289, 433–439. [Google Scholar] [CrossRef]
  38. Gomes, M.F.; Gomes, Y.F.; Lopes-Moriyama, A.; de Barros Neto, E.L.; de Souza, C.P. Design of Carbon Quantum Dots via Hydrothermal Carbonization Synthesis from Renewable Precursors. Biomass Convers. Bioref. 2019, 9, 689–694. [Google Scholar] [CrossRef]
  39. Tadesse, A.; Rama Devi, D.; Hagos, M.; Battu, G.; Basavaiah, K. Facile Green Synthesis of Fluorescent Carbon Quantum Dots from Citrus Lemon Juice for Live Cell Imaging. Asian J. Nanosci. Mater. 2018, 1, 36–46. [Google Scholar] [CrossRef]
  40. Pourmadadi, M.; Soleimani Dinani, H.; Saeidi Tabar, F.; Khassi, K.; Janfaza, S.; Tasnim, N.; Hoorfar, M. Properties and Applications of Graphene and Its Derivatives in Biosensors for Cancer Detection: A Comprehensive Review. Biosensors 2022, 12, 269. [Google Scholar] [CrossRef] [PubMed]
  41. Wen, F.; Li, P.; Zhang, Y.; Zhong, H.; Yan, H.; Su, W. Preparation, Characterization of Green Tea Carbon Quantum Dots/Curcumin Antioxidant and Antibacterial Nanocomposites. J. Mol. Struct. 2023, 1273, 134247. [Google Scholar] [CrossRef]
  42. Murru, C.; Badía-Laíño, R.; Díaz-García, M.E. Synthesis and Characterization of Green Carbon Dots for Scavenging Radical Oxygen Species in Aqueous and Oil Samples. Antioxidants 2020, 9, 1147. [Google Scholar] [CrossRef] [PubMed]
  43. Li, F.; Li, T.; Sun, C.; Xia, J.; Jiao, Y.; Xu, H. Selenium-Doped Carbon Quantum Dots for Free-Radical Scavenging. Angew. Chem. Int. Ed. 2017, 56, 9910–9914. [Google Scholar] [CrossRef]
  44. Šafranko, S.; Stanković, A.; Hajra, S.; Kim, H.-J.; Strelec, I.; Dutour-Sikirić, M.; Weber, I.; Bosnar, M.H.; Grbčić, P.; Pavelić, S.K.; et al. Preparation of Multifunctional N-Doped Carbon Quantum Dots from Citrus Clementina Peel: Investigating Targeted Pharmacological Activities and the Potential Application for Fe3+ Sensing. Pharmaceuticals 2021, 14, 857. [Google Scholar] [CrossRef] [PubMed]
  45. Gulcin, İ. Antioxidants and Antioxidant Methods: An Updated Overview. Arch. Toxicol. 2020, 94, 651–715. [Google Scholar] [CrossRef] [PubMed] [Green Version]
Figure 1. Hydrothermal preparation route for N/S-Carbon QDs from crayfish waste.
Applsci 13 08730 g001
Figure 2. XRD plot of N/S-Carbon QDs.
Applsci 13 08730 g002
Figure 3. (a) EDS spectrum of the identified elements on the surface of N/S-Carbon QDs and (b) EDS surface mapping images for N/S-Carbon QDs.
Applsci 13 08730 g003
Figure 4. AFM images, AFM section analysis, and size distribution of N/S-Carbon QDs.
Applsci 13 08730 g004
Figure 5. ATR-FT-IR spectrum of N/S@Carbon QDs.
Applsci 13 08730 g005
Figure 6. (a) XPS spectrum of N/S-Carbon QDs and high-resolution XPS spectra of (b) C1s, (c) N1s, and (d) O1s.
Applsci 13 08730 g006
Figure 7. (a) UV–vis DRS spectra of N/S-Carbon QDs and (b) Kübelka–Münk plot.
Applsci 13 08730 g007
Figure 8. (a) Fluorescence emission spectra at specified excitation wavelengths, (b) excitation–emission contour plot; (c) 3D excitation-emission spectra and of N/S-Cthe sciarbon QDs.
Applsci 13 08730 g008
Figure 9. TG plot of N/S-Carbon QDs.
Applsci 13 08730 g009
Figure 10. Microtox bioassay gamma versus concentration plot.
Applsci 13 08730 g010
Figure 11. Plot of calculated % DPPH radical inhibition values as a function of N/S-Carbon QDs concentration.
Applsci 13 08730 g011
Figure 12. (a) Weight loss plot of fresh strawberries as a function of storage day; (b) images of strawberries coated with N/S-Carbon QDs (1), and untreated strawberries (2) after 0, 1, 2, and 3 days of storage.
Applsci 13 08730 g012
Table 1. Elemental composition of N/S-Carbon QDs.
N%C%H%S%C/N
10.353.67.16.35.2
Disclaimer/Publisher’s Note: The statements, opinions and data contained in all publications are solely those of the individual author(s) and contributor(s) and not of MDPI and/or the editor(s). MDPI and/or the editor(s) disclaim responsibility for any injury to people or property resulting from any ideas, methods, instructions or products referred to in the content.

