

Numerical Analysis of Perforated Symmetric Fissures on Mechanical Properties of Hole-Containing Sandstone

 ,
,  ,
,
Abstract
:1. Introduction
2. Construction of a Numerical Model of Particle Flow
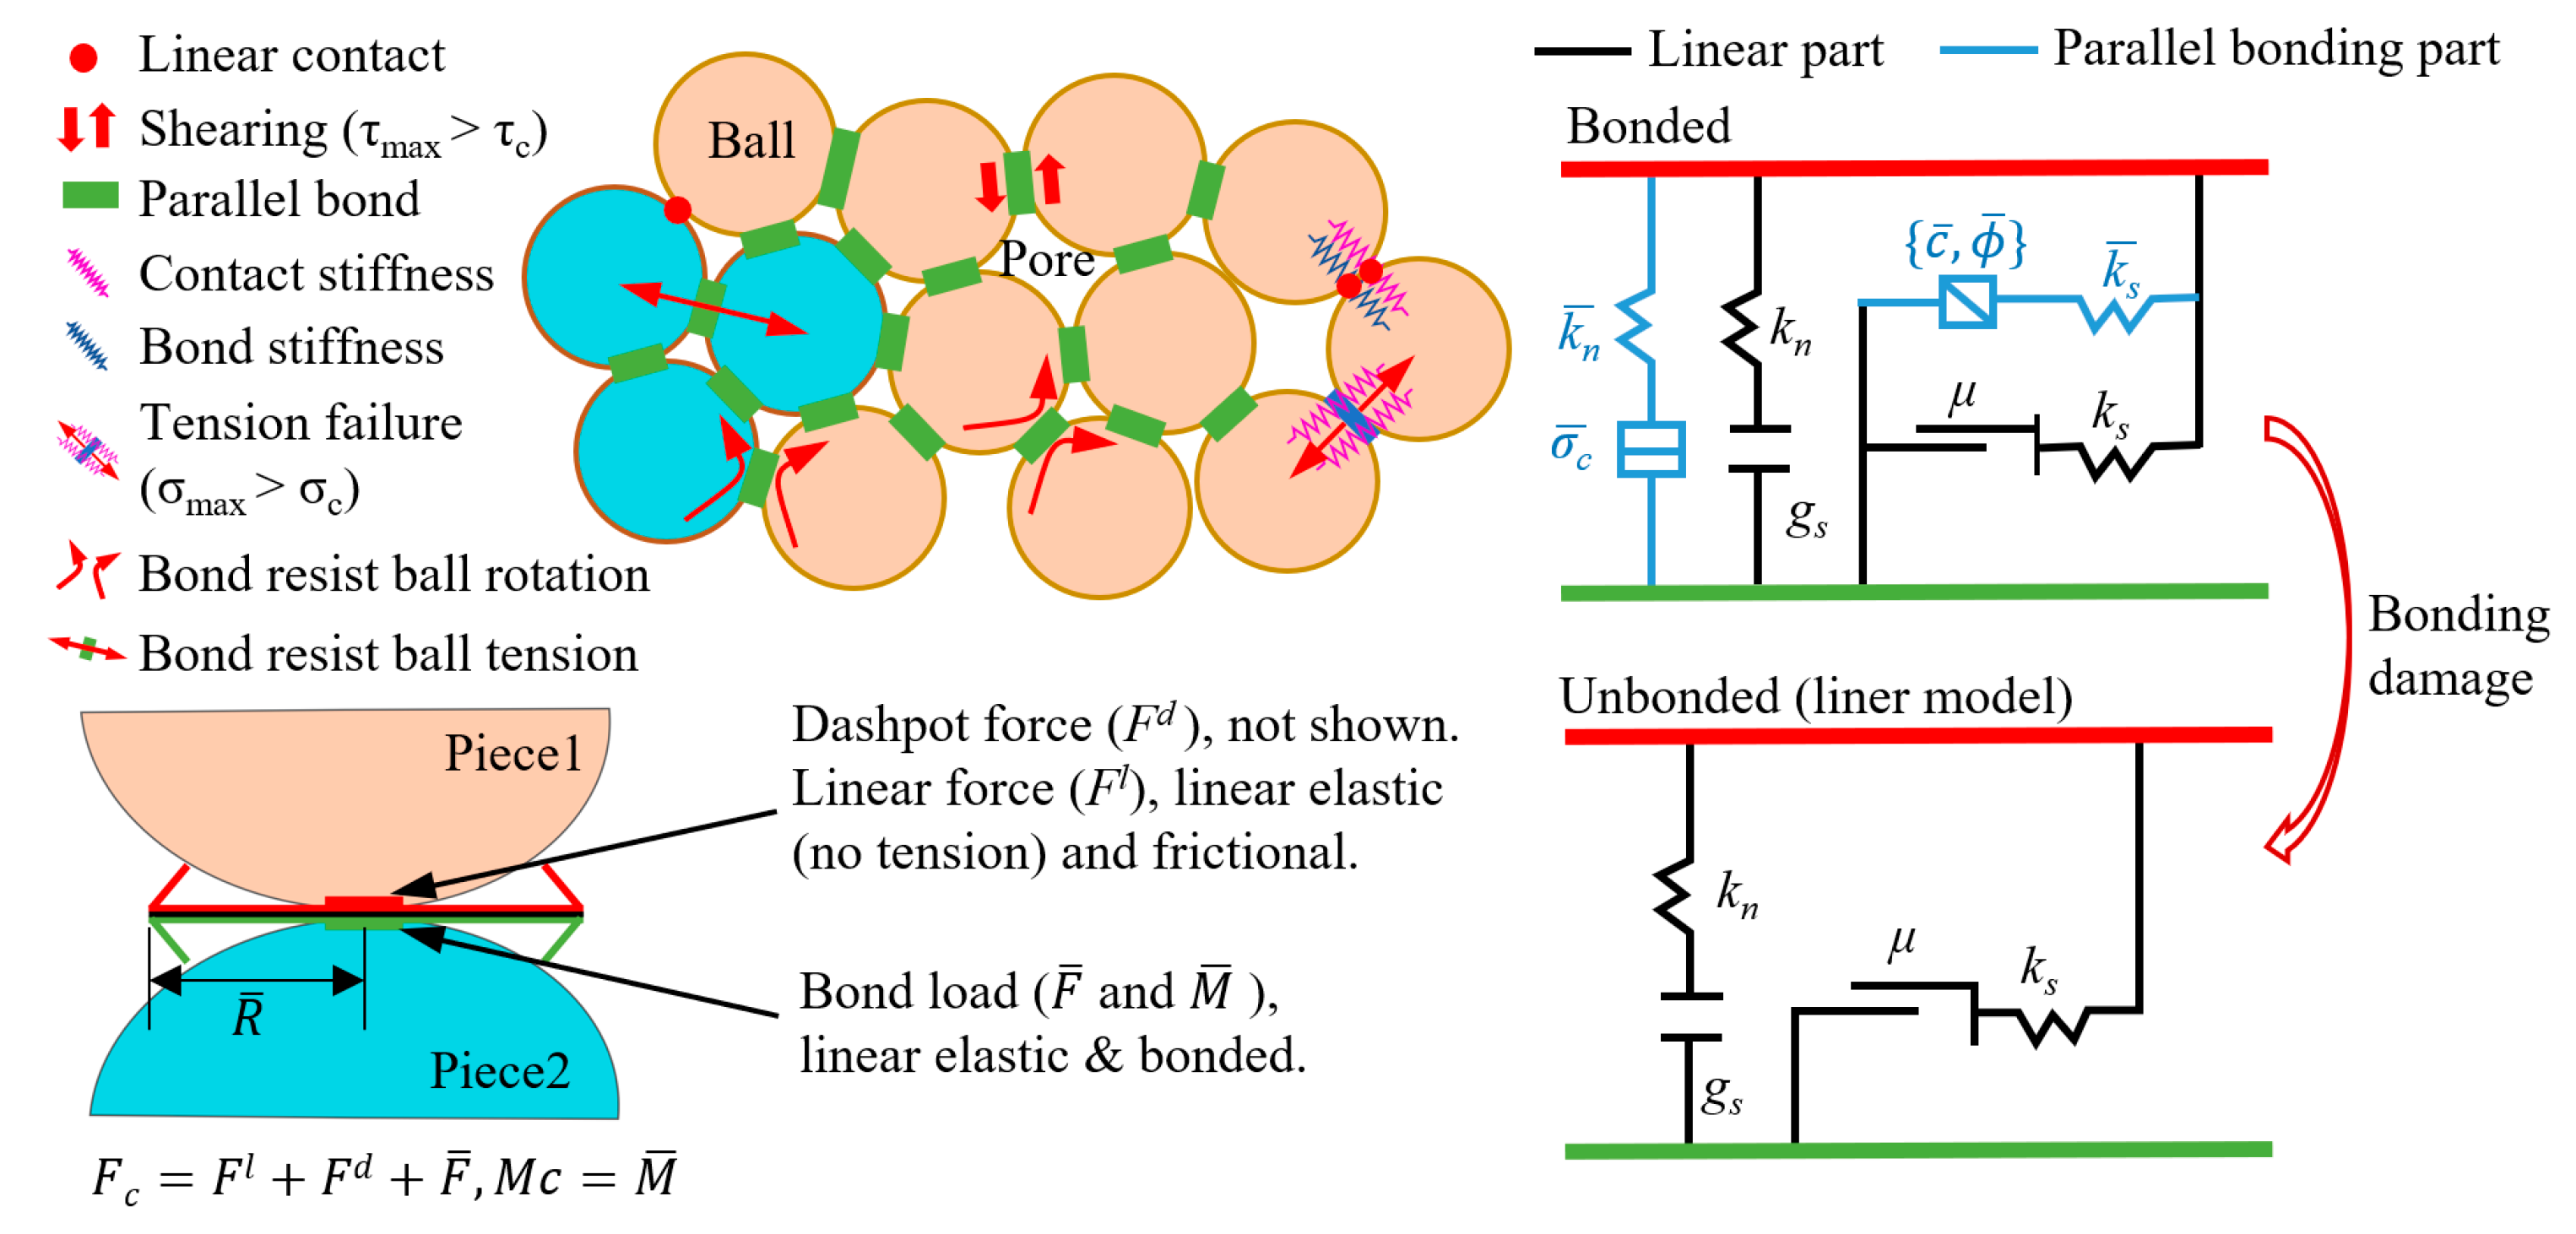
2.1. Introduction to Particle Flow Code Simulation Methods
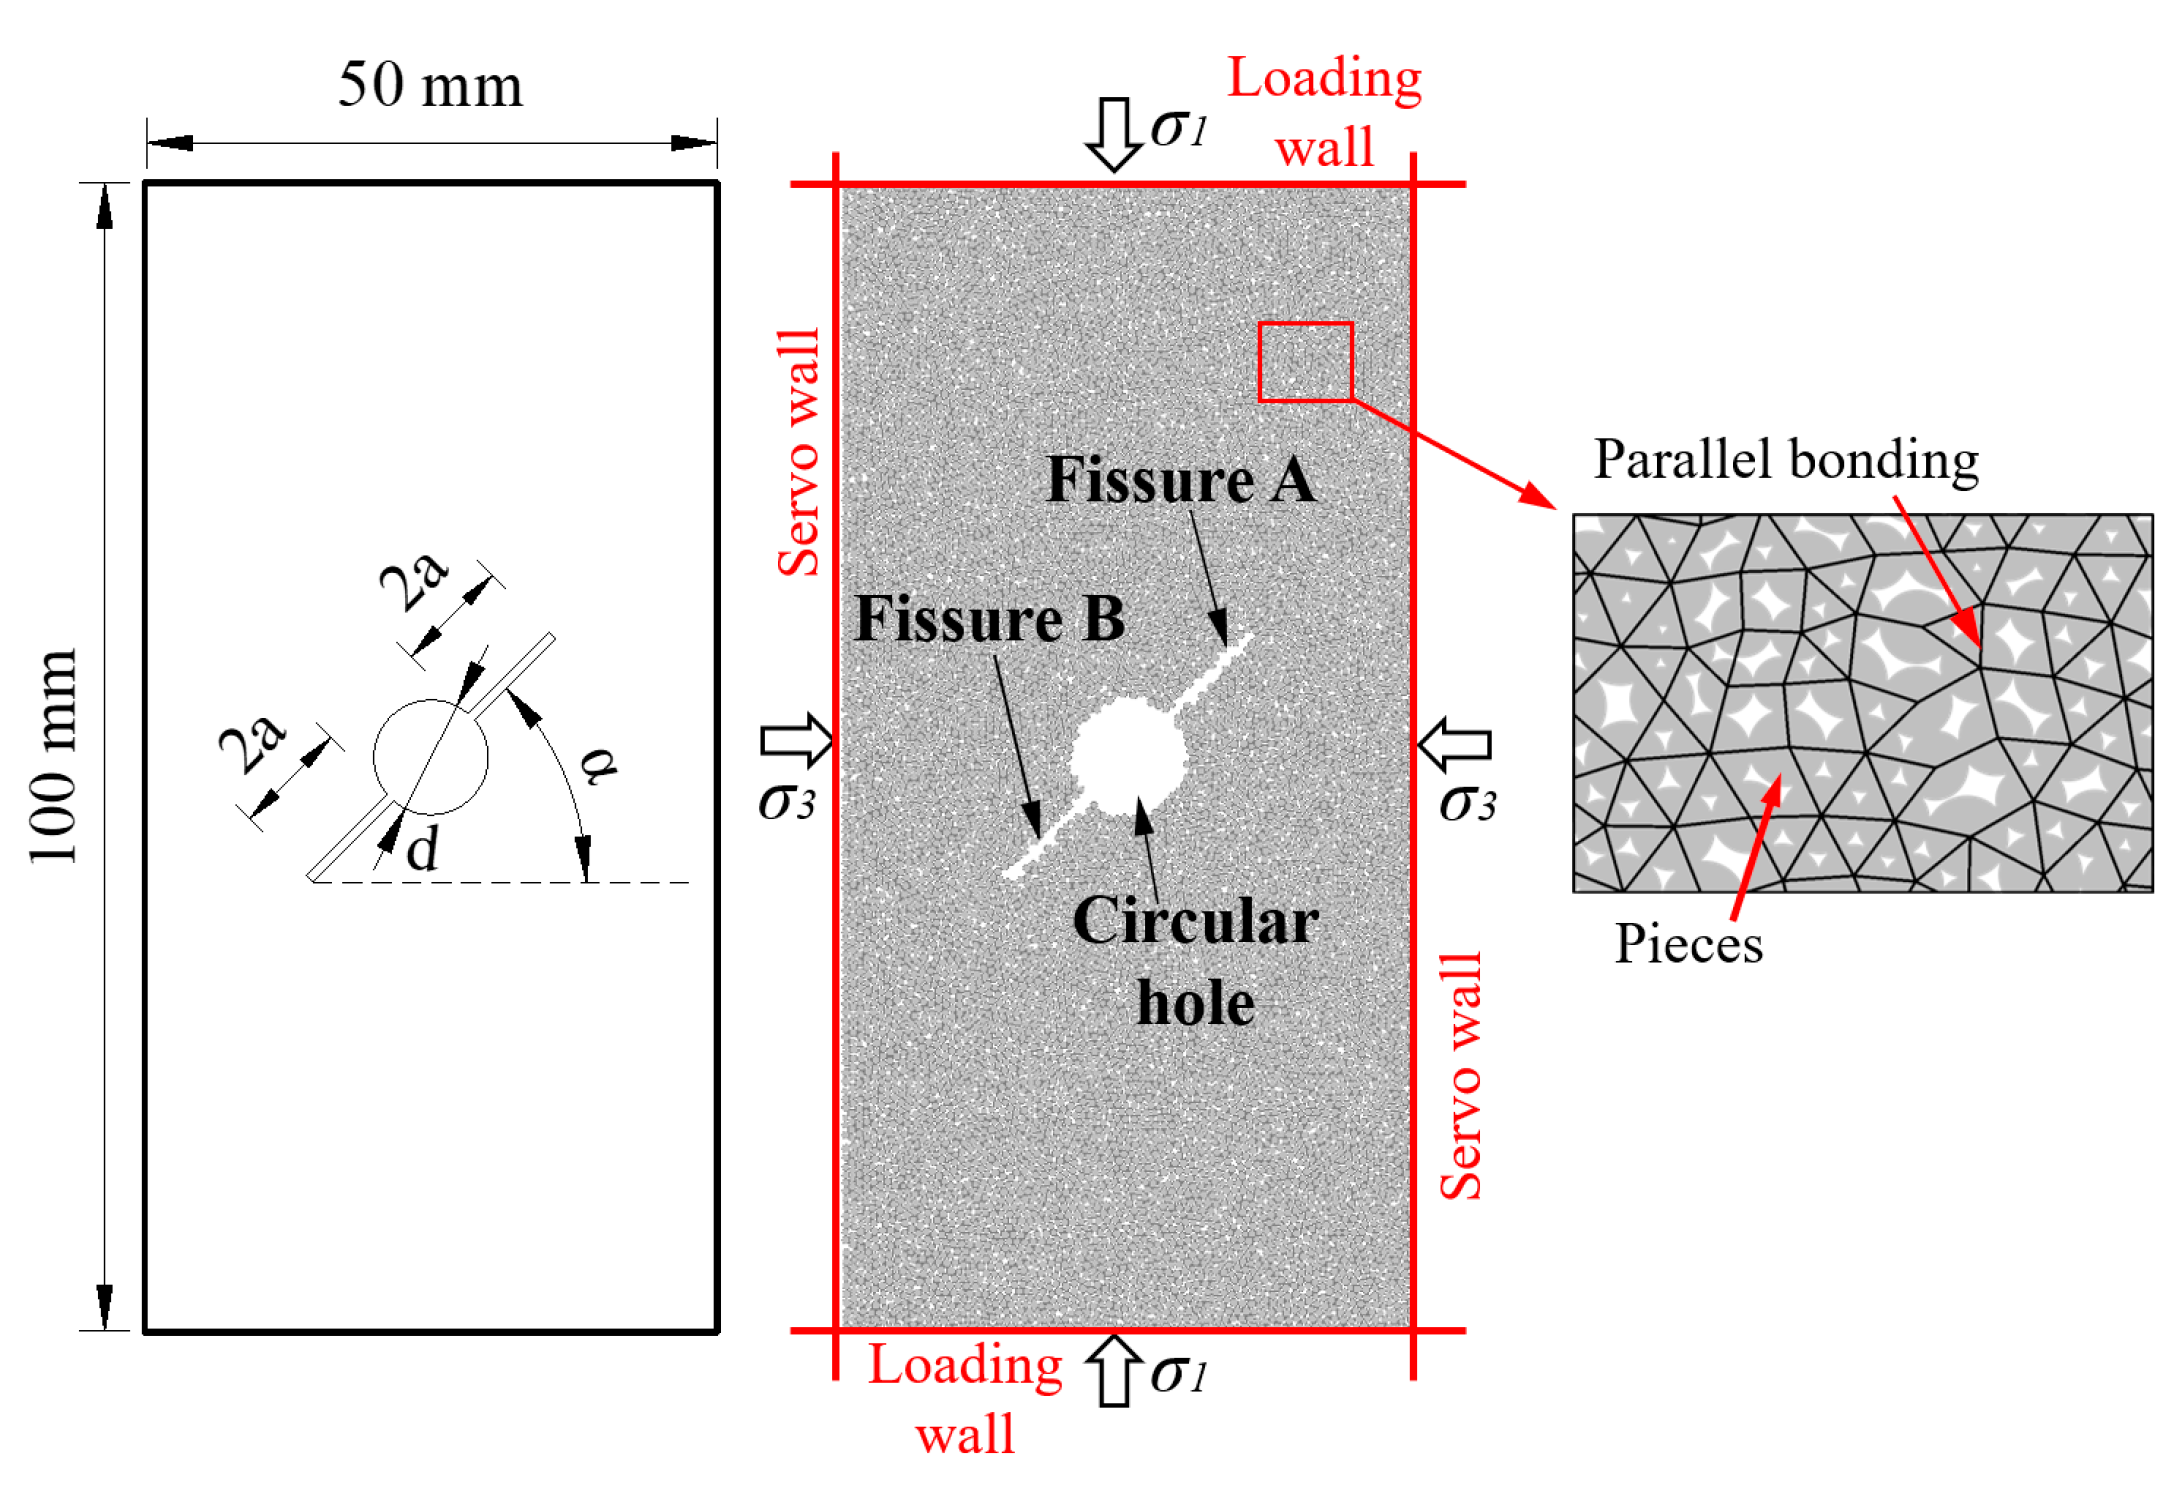
2.2. Model Building
3. Calibration and Verification of Model Mesoscopic Parameters
3.1. Calibration of Mesoscopic Parameters
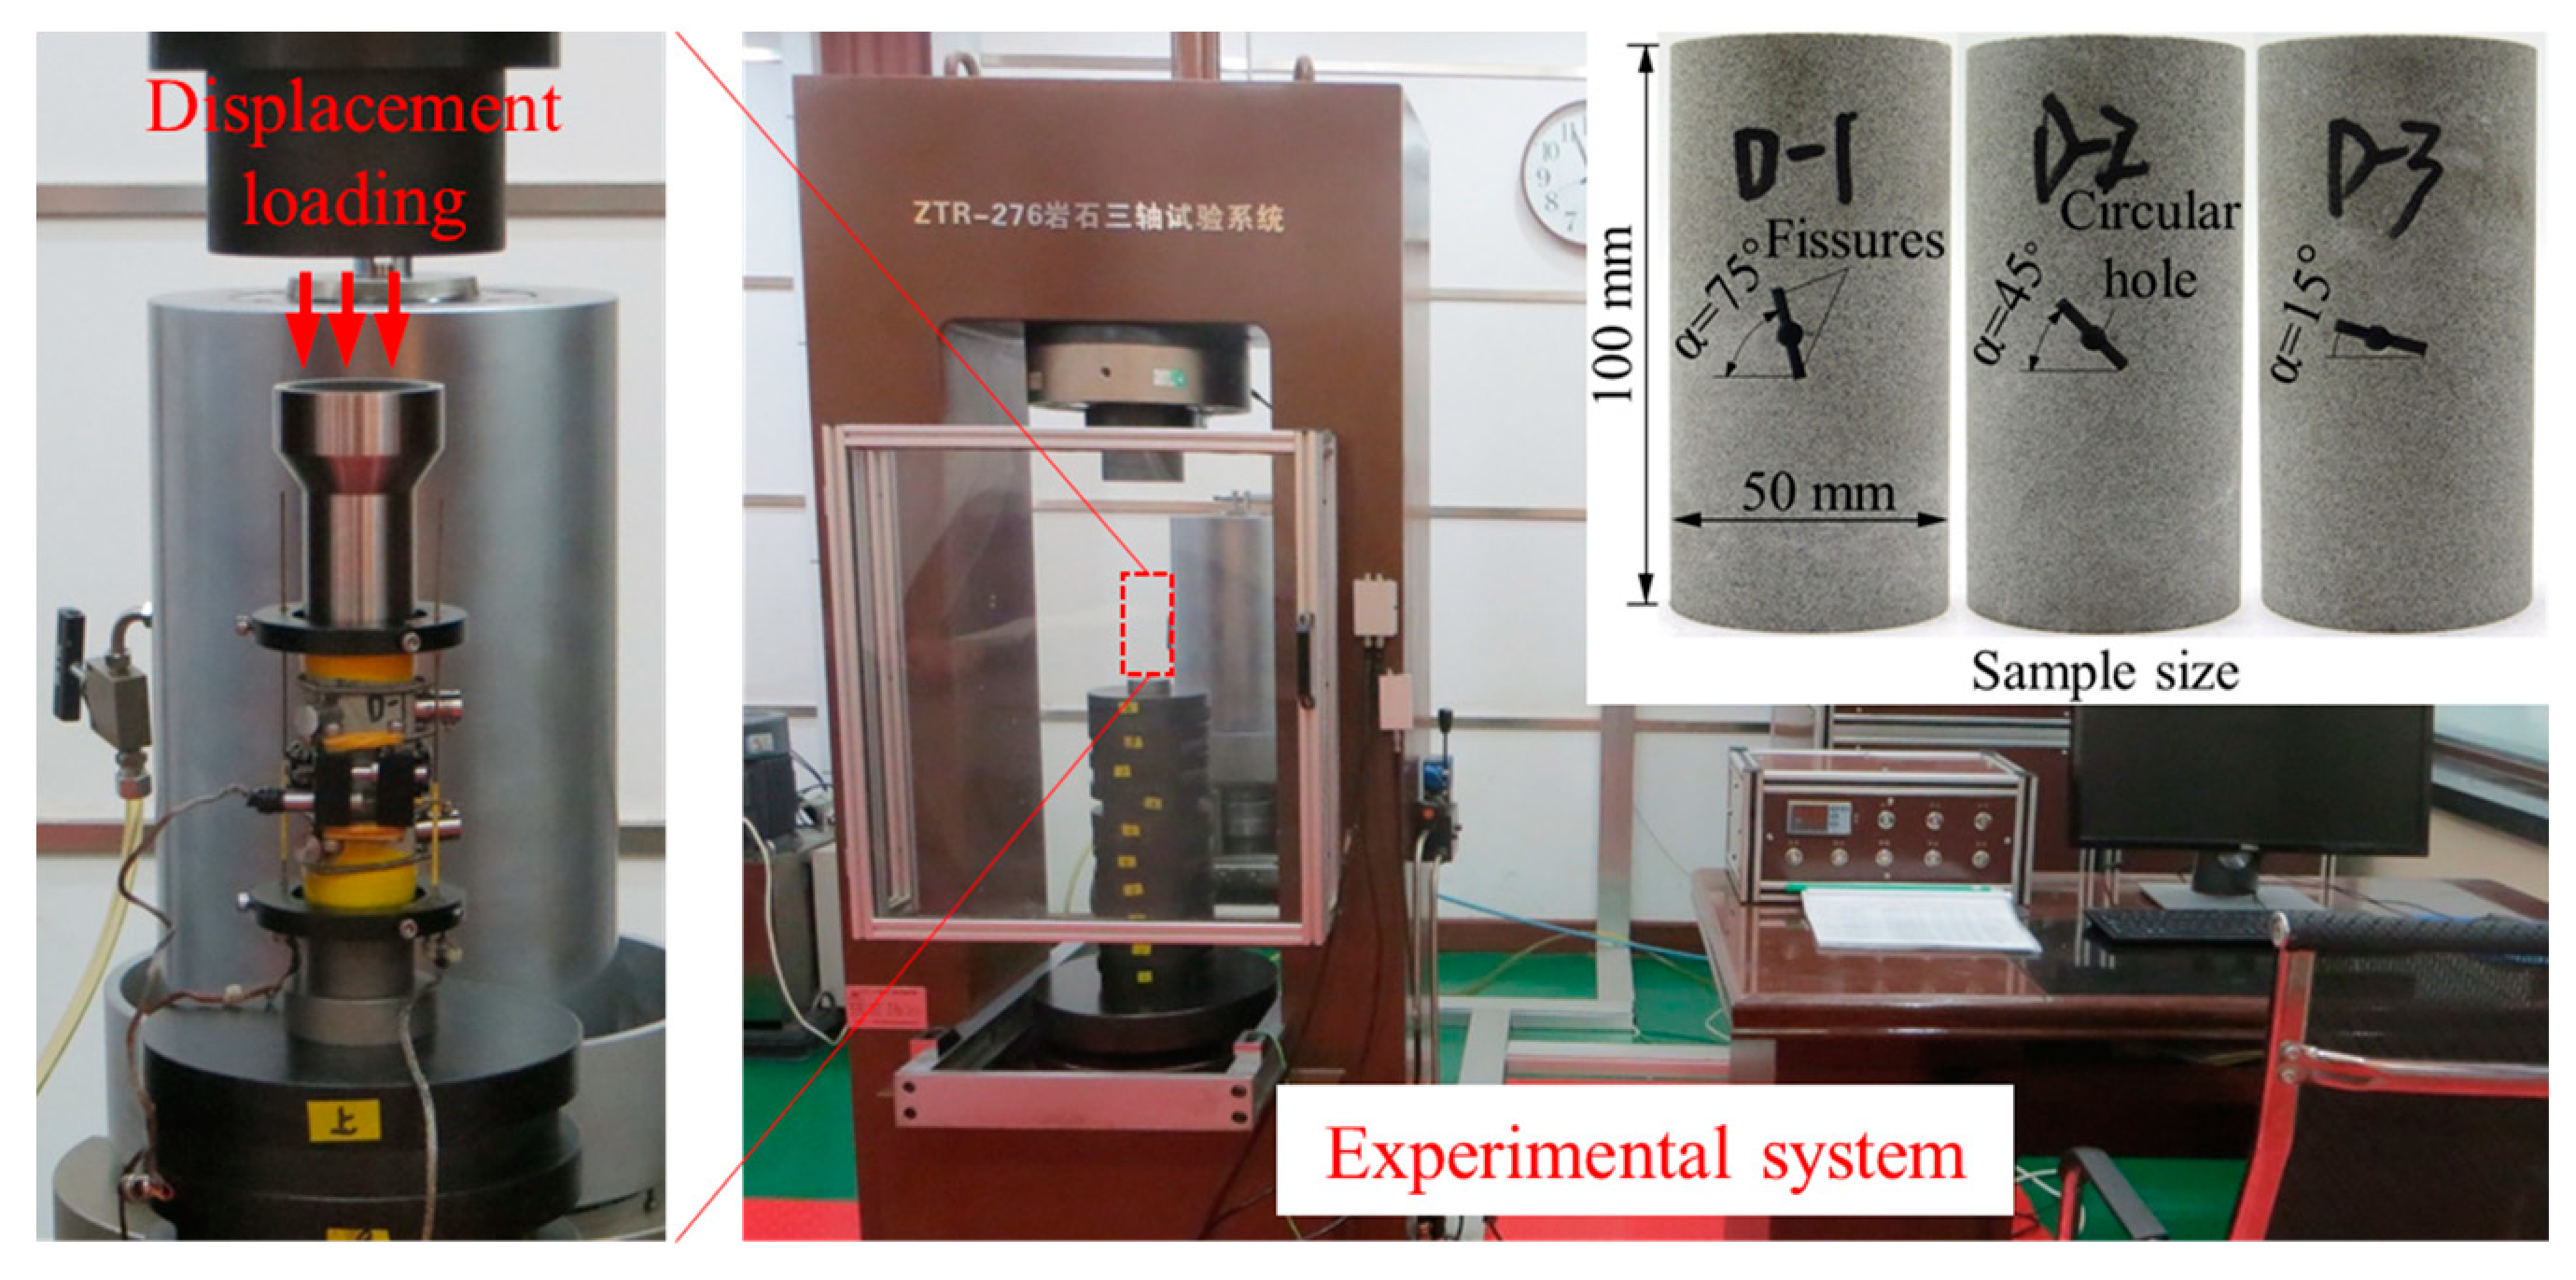
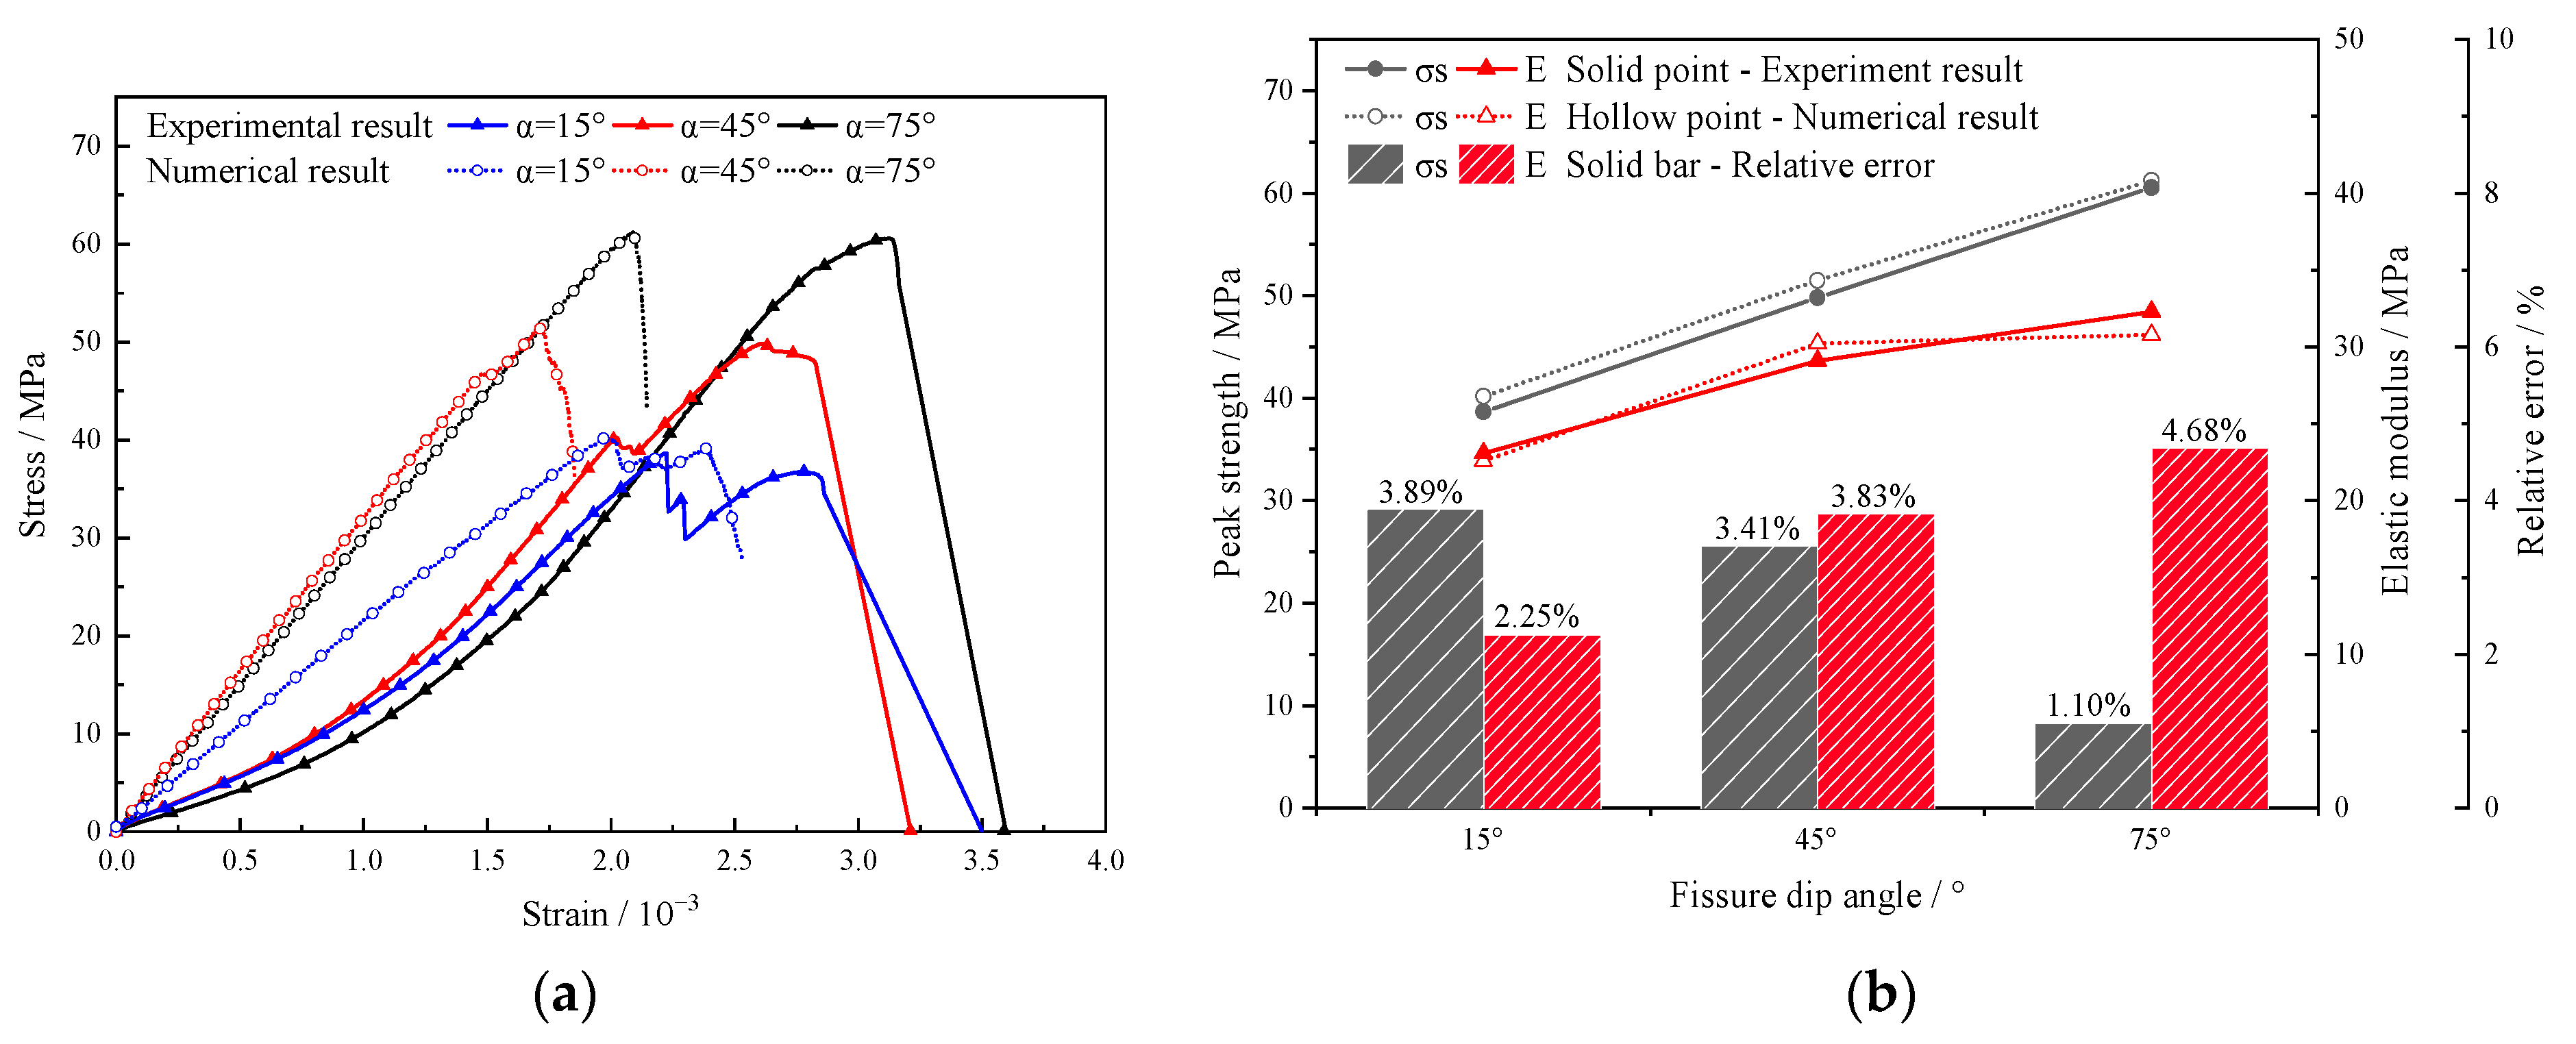
3.2. Verification of Mesoscopic Parameters
4. Numerical Simulation Results and Analysis
4.1. Characterization of Mechanical Parameters
4.2. Displacement Field Analysis
4.3. Failure Mode Analysis
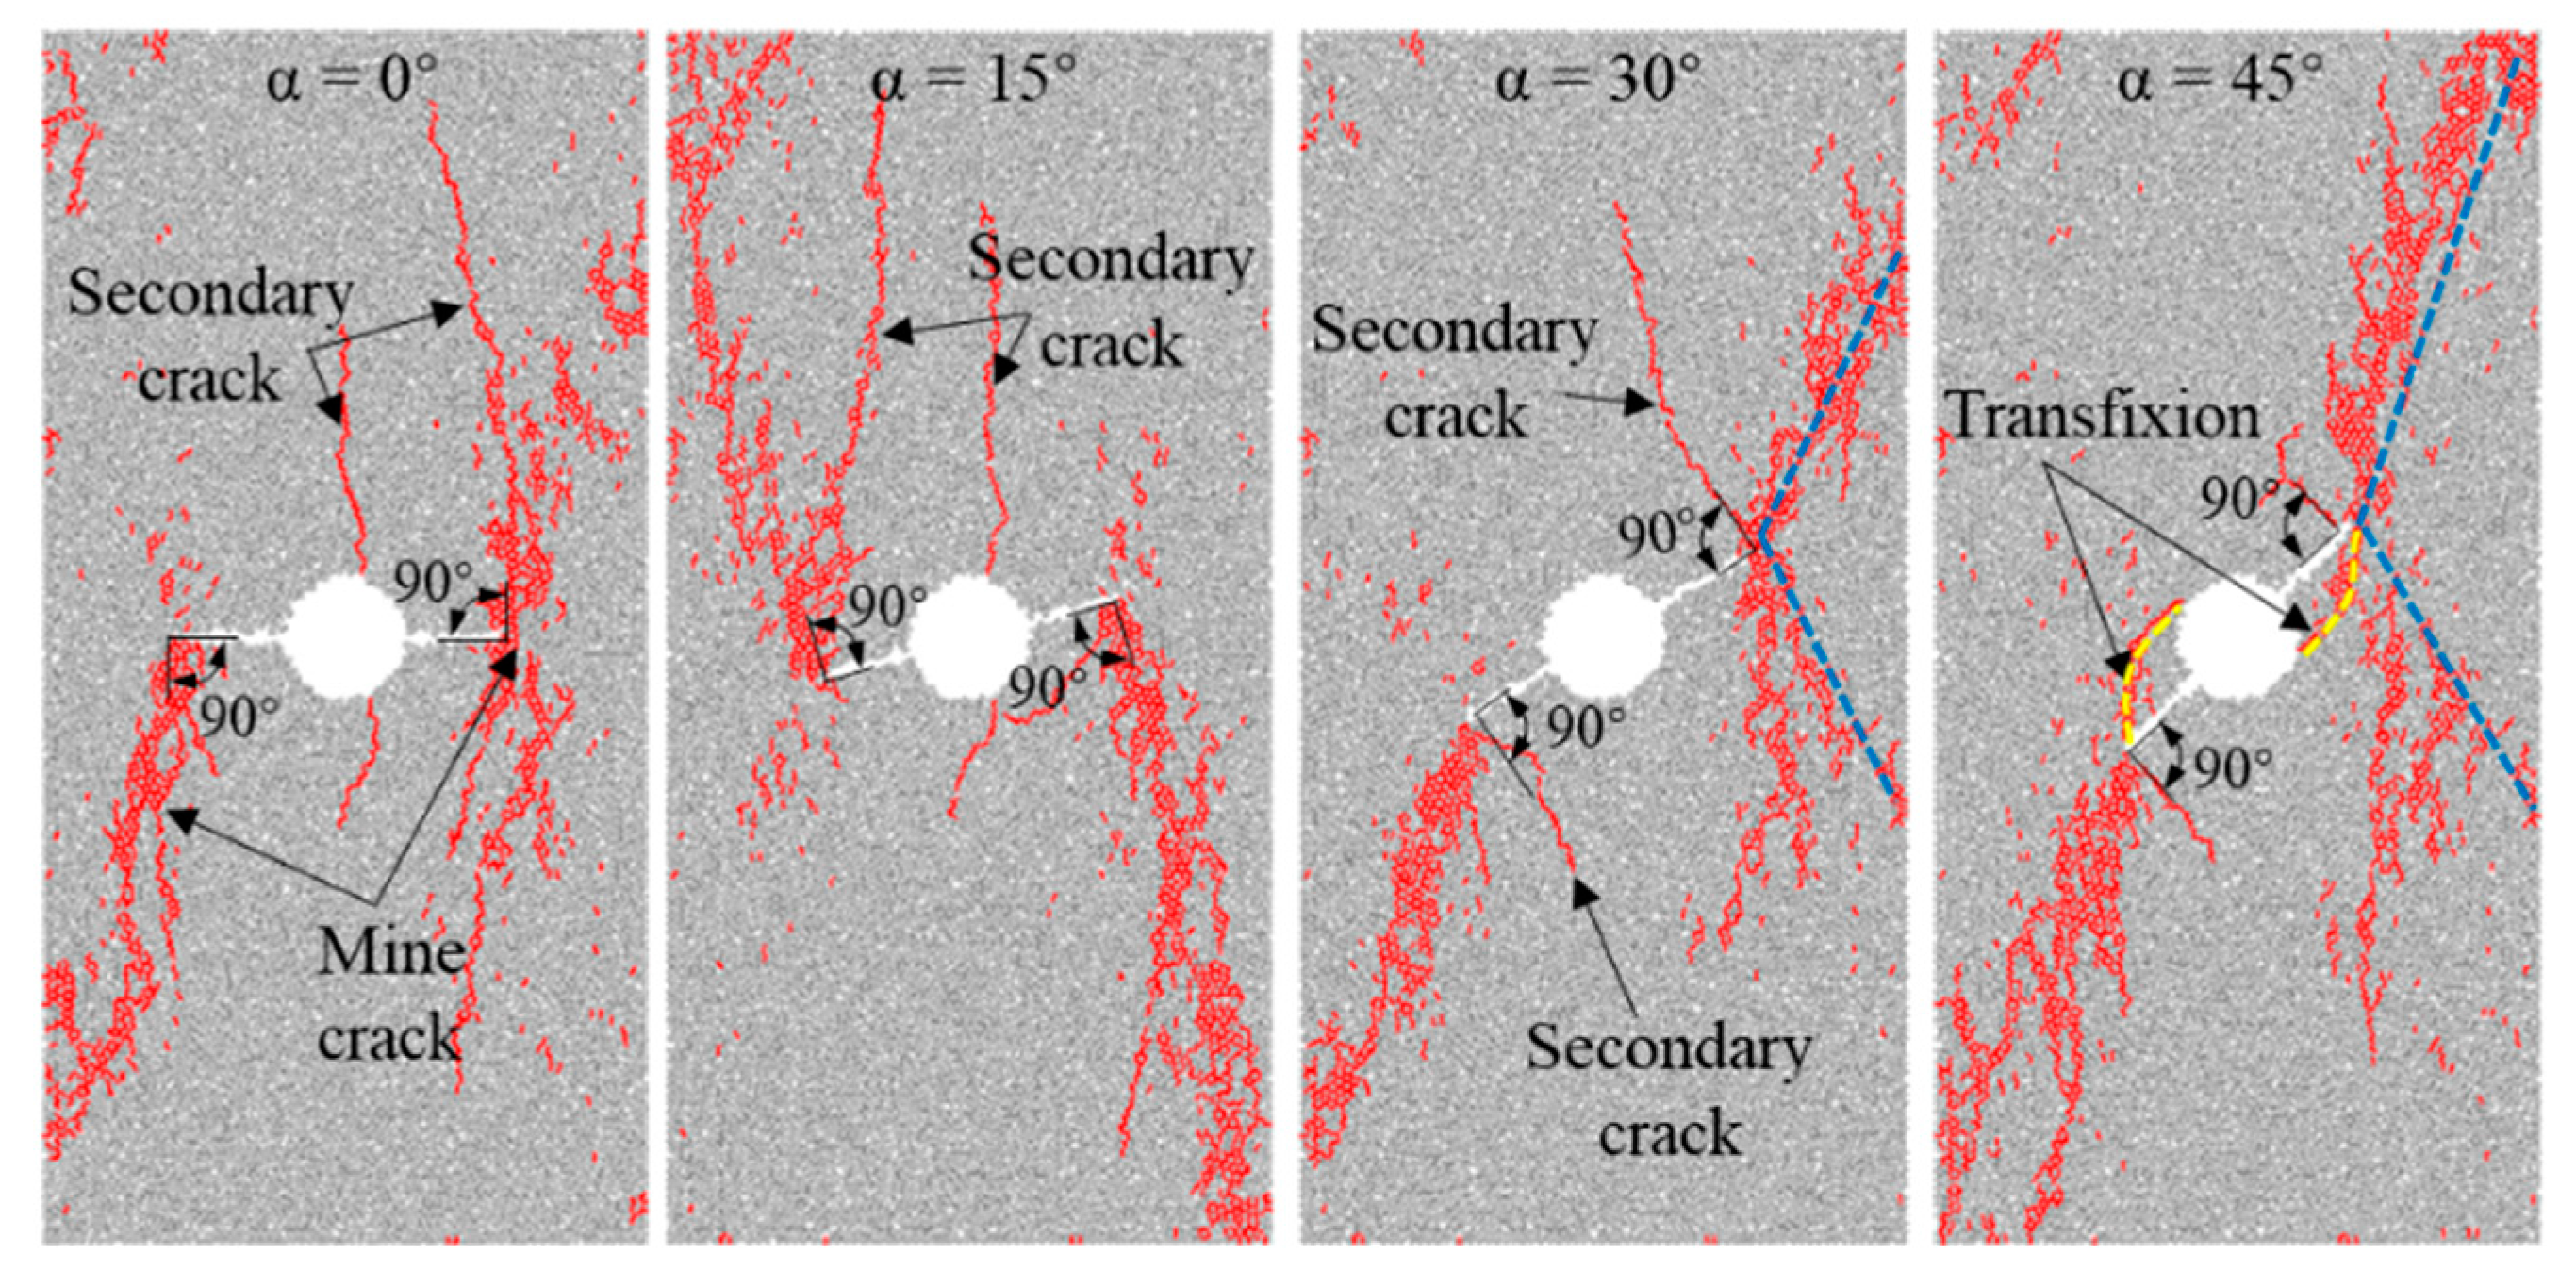
- At α = 0°, 15°, the prominent cracks all crack along the direction perpendicular to the symmetrical fissures and then respectively expand obliquely up (down) to the specimen boundary, showing mixed shear-tensile failure. In addition, secondary cracks sprouted on the upper and lower sides of the fissure tips and hole wall, and the secondary cracks all expanded roughly in the direction of the principal axial stress, which aggravated the tensile failure of the specimen.
- At α = 30°, 45°, the proper main crack obliquely extends upward (downward) to the specimen boundary, forming a triangular fragment. Moreover, the secondary cracks all crack from the fissure tip along the direction perpendicular to the fissure, and then the extension direction turns toward the axial main stress direction. Compared with α = 0°, 15°, the specimen’s tensile failure degree is weakened, and the degree of shear failure is enhanced.
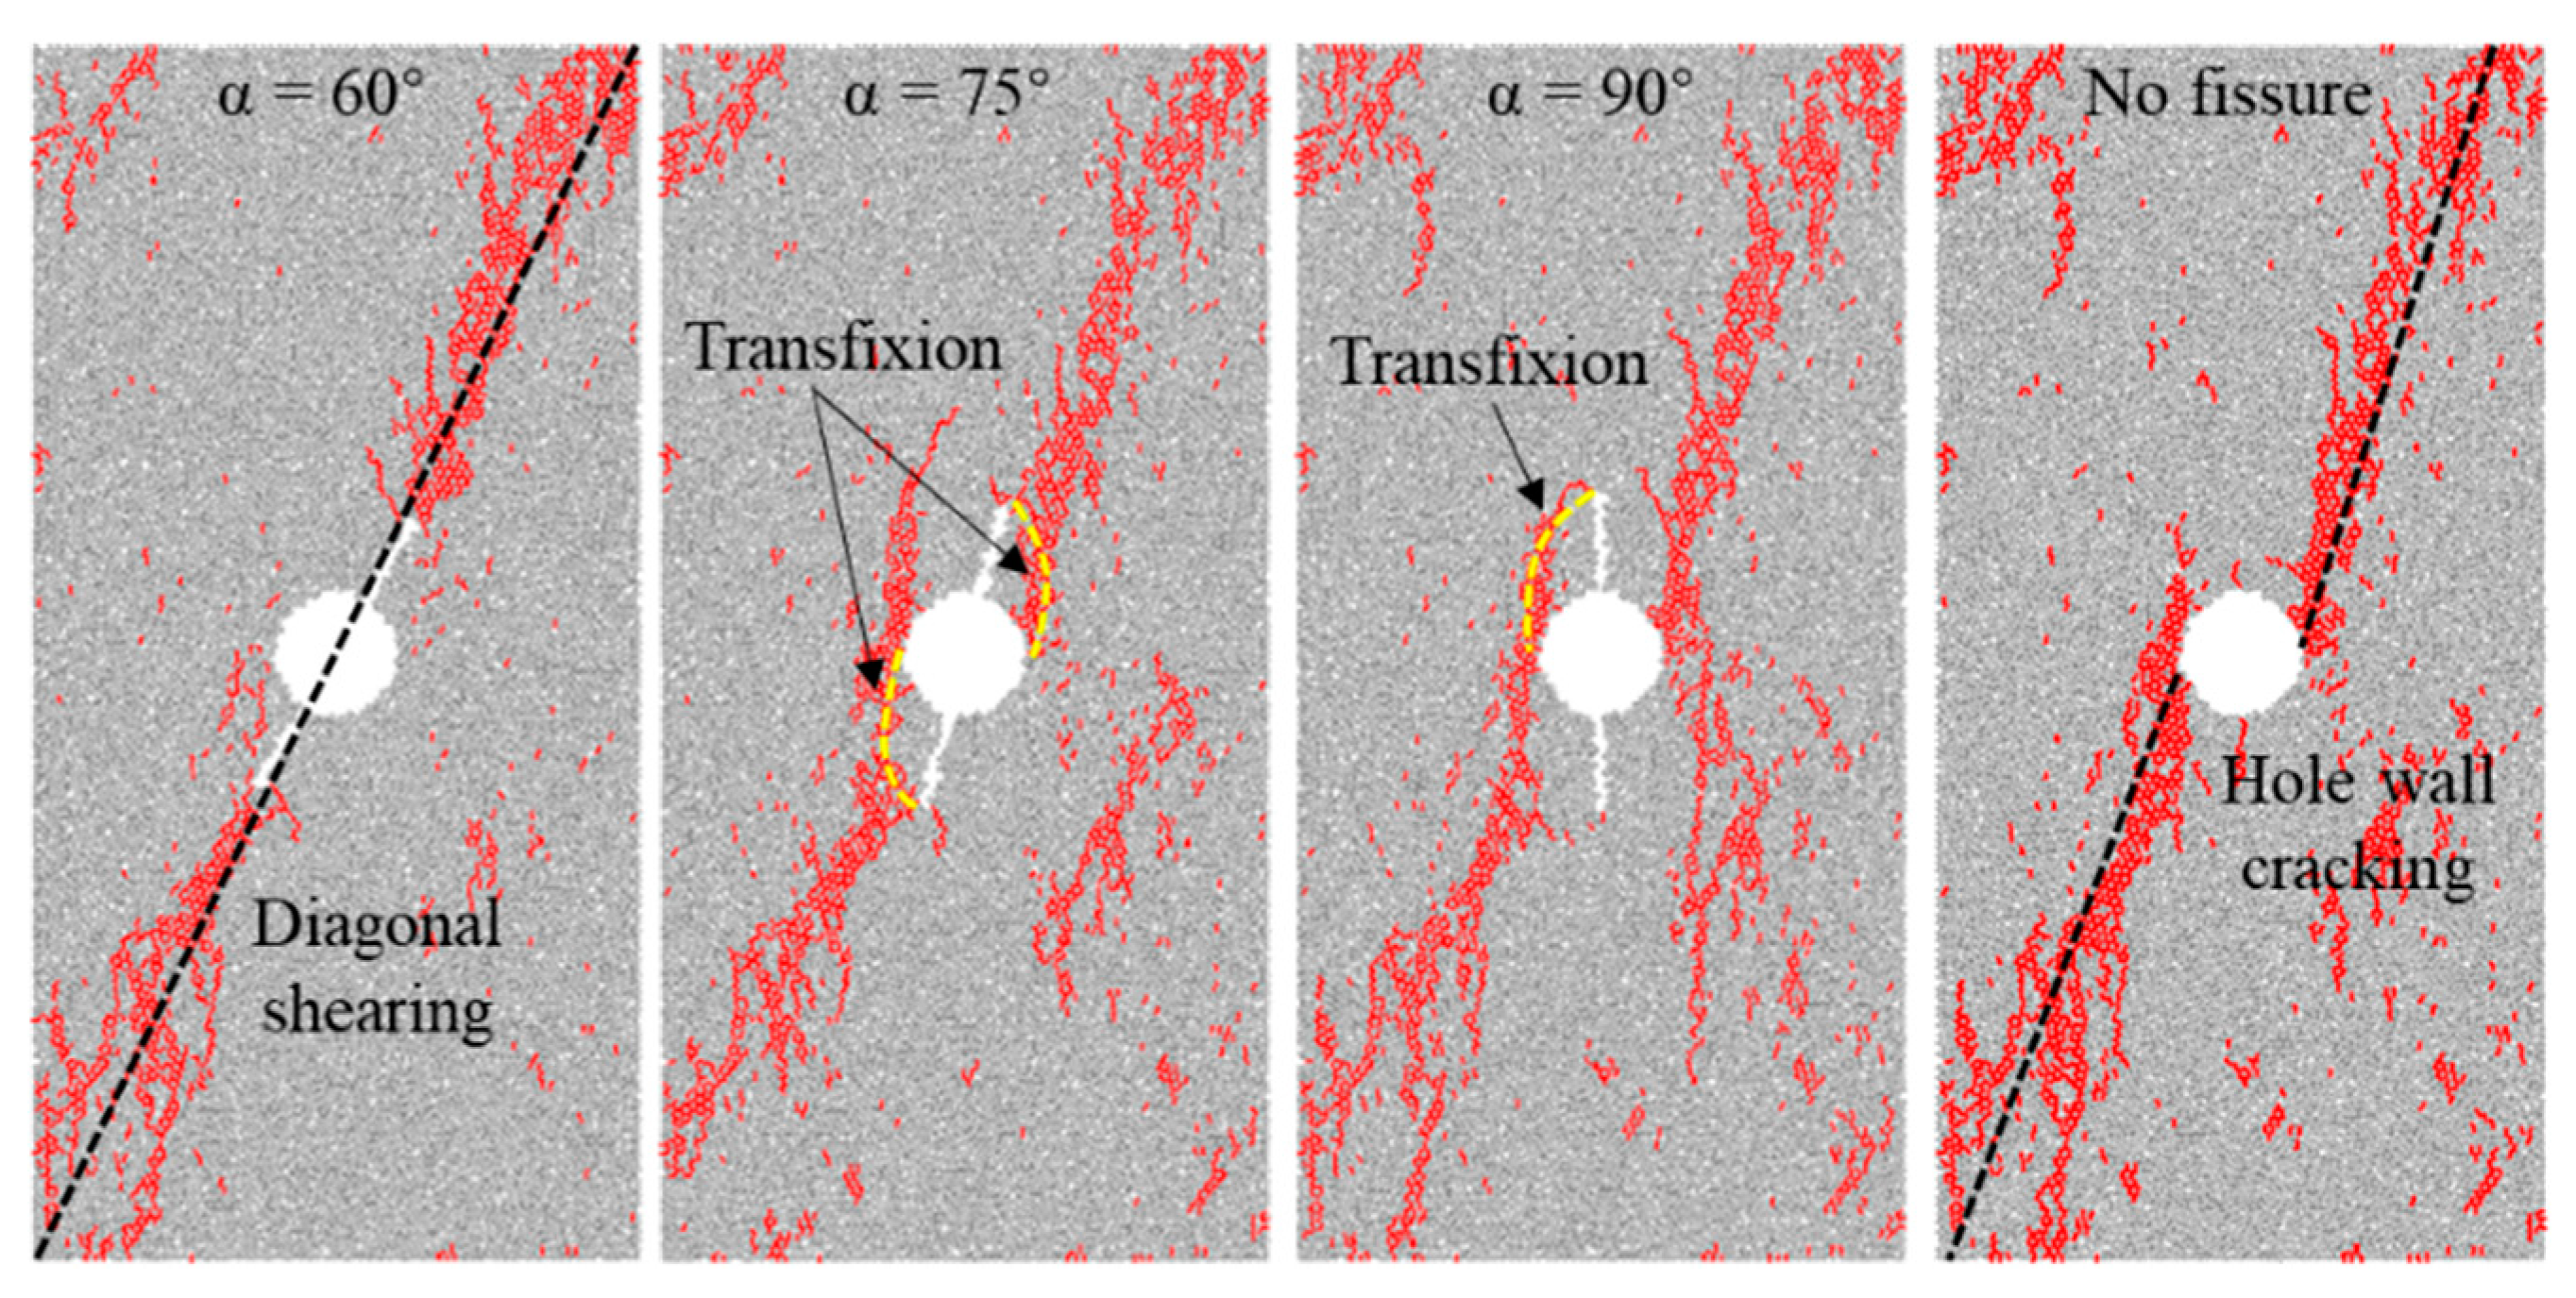
- At α = 60°, the main crack is co-linear with the symmetric fissures, and the specimen eventually produces shear failure along the diagonal.
- At α = 75° and 90°, the failure modes of the specimens are similar to those of the single-hole fissure-free specimen, with the prominent cracks starting from the right (left) side of the hole wall and then expanding obliquely upward (downward), leading to shear failure of the specimens, however, due to the compressive stress, some of the tensile cracks penetrate the fissure tip to the hole wall, which is also reflected in the α = 45° specimen, and the tensile failure of the specimens is slightly enhanced.
5. Discussion
5.1. Relationship between Mechanical Properties and Crack Expansion
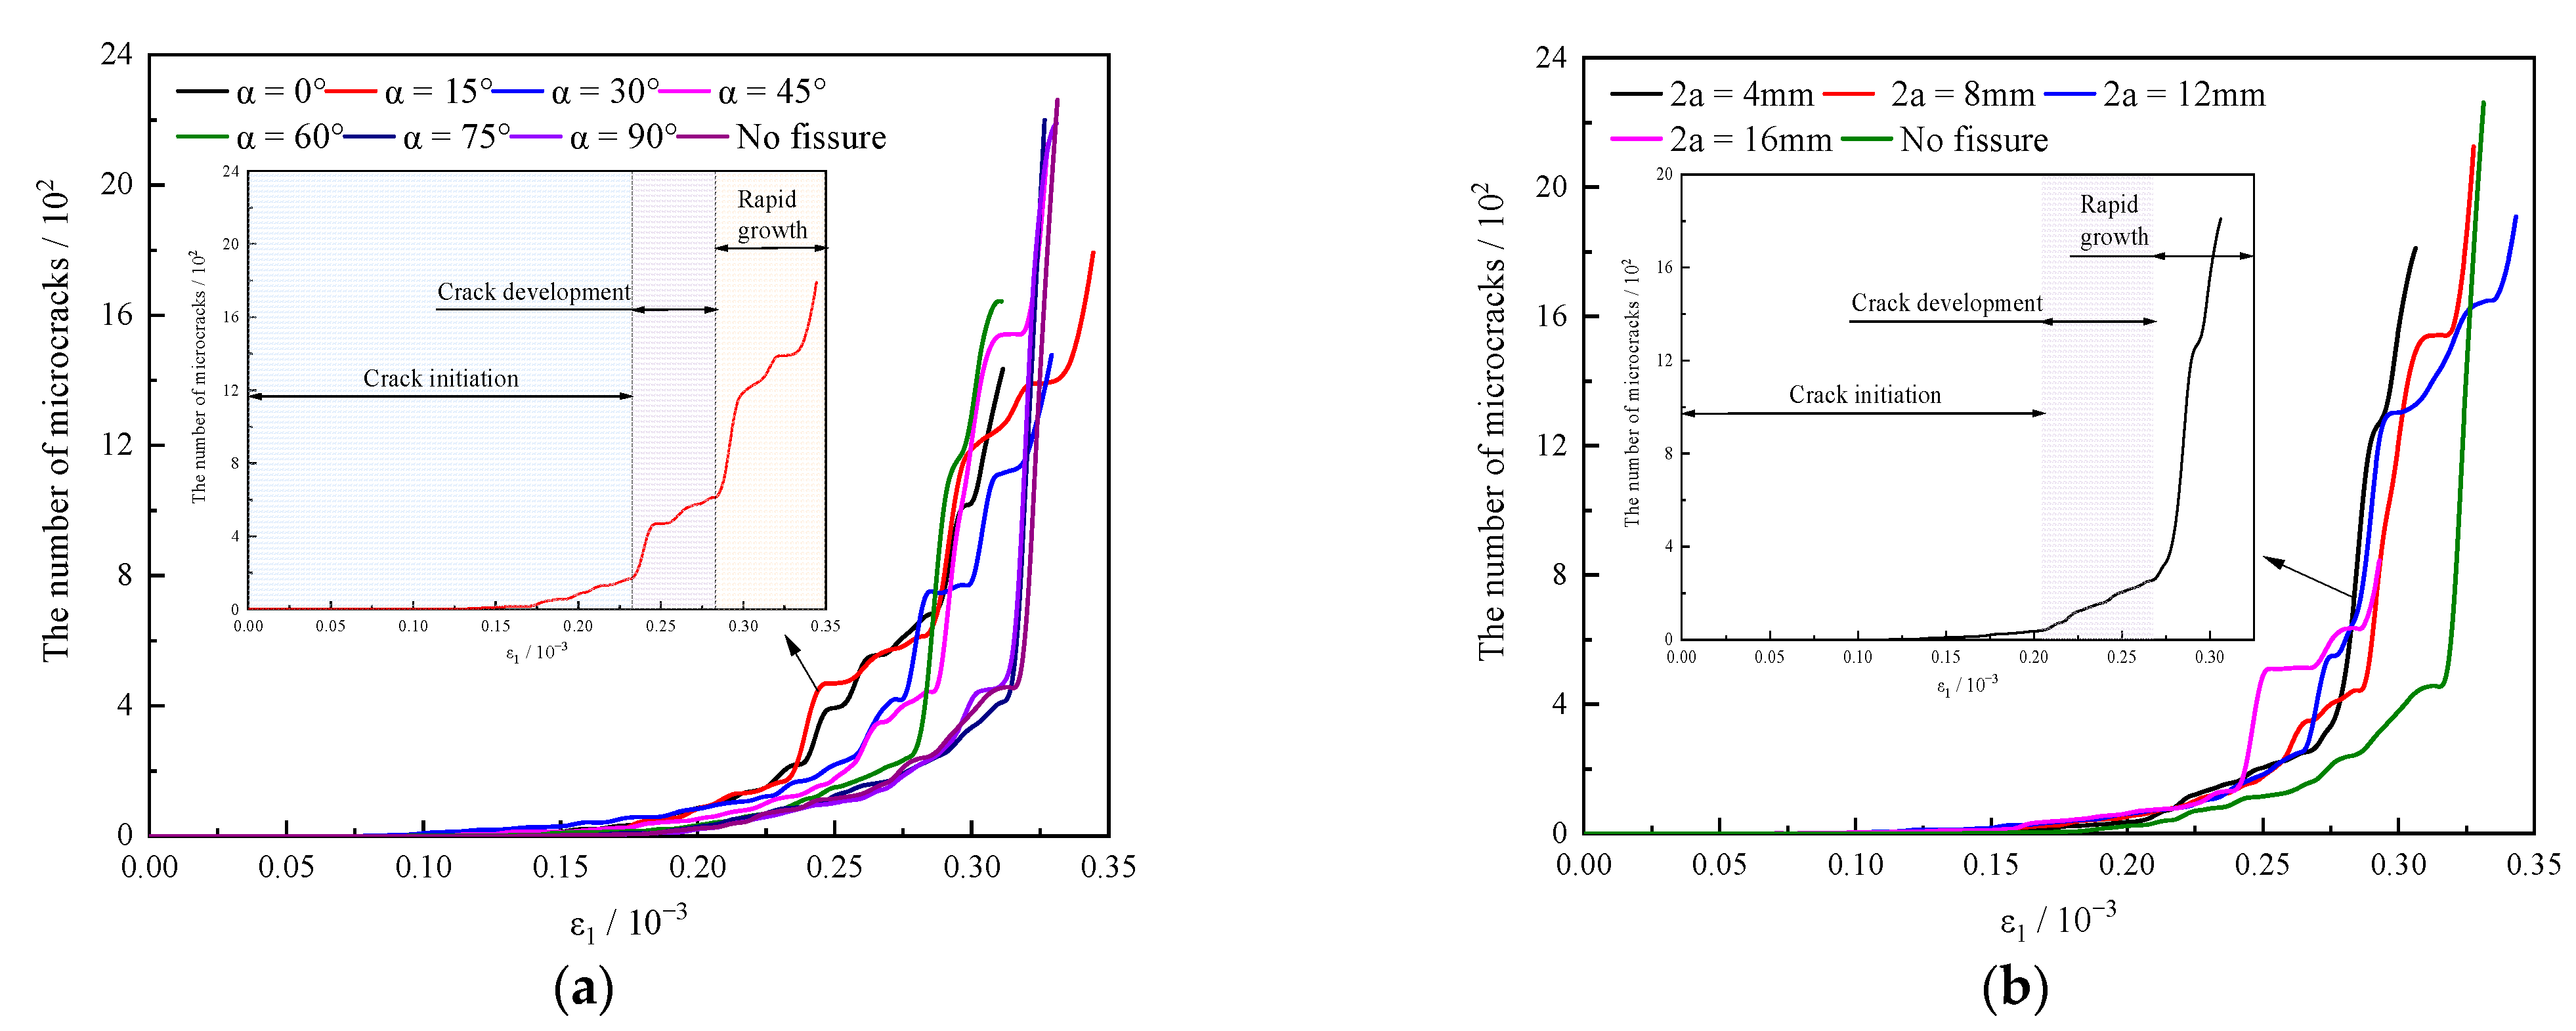
5.2. Evolution Law of Microcrack Number
6. Conclusions
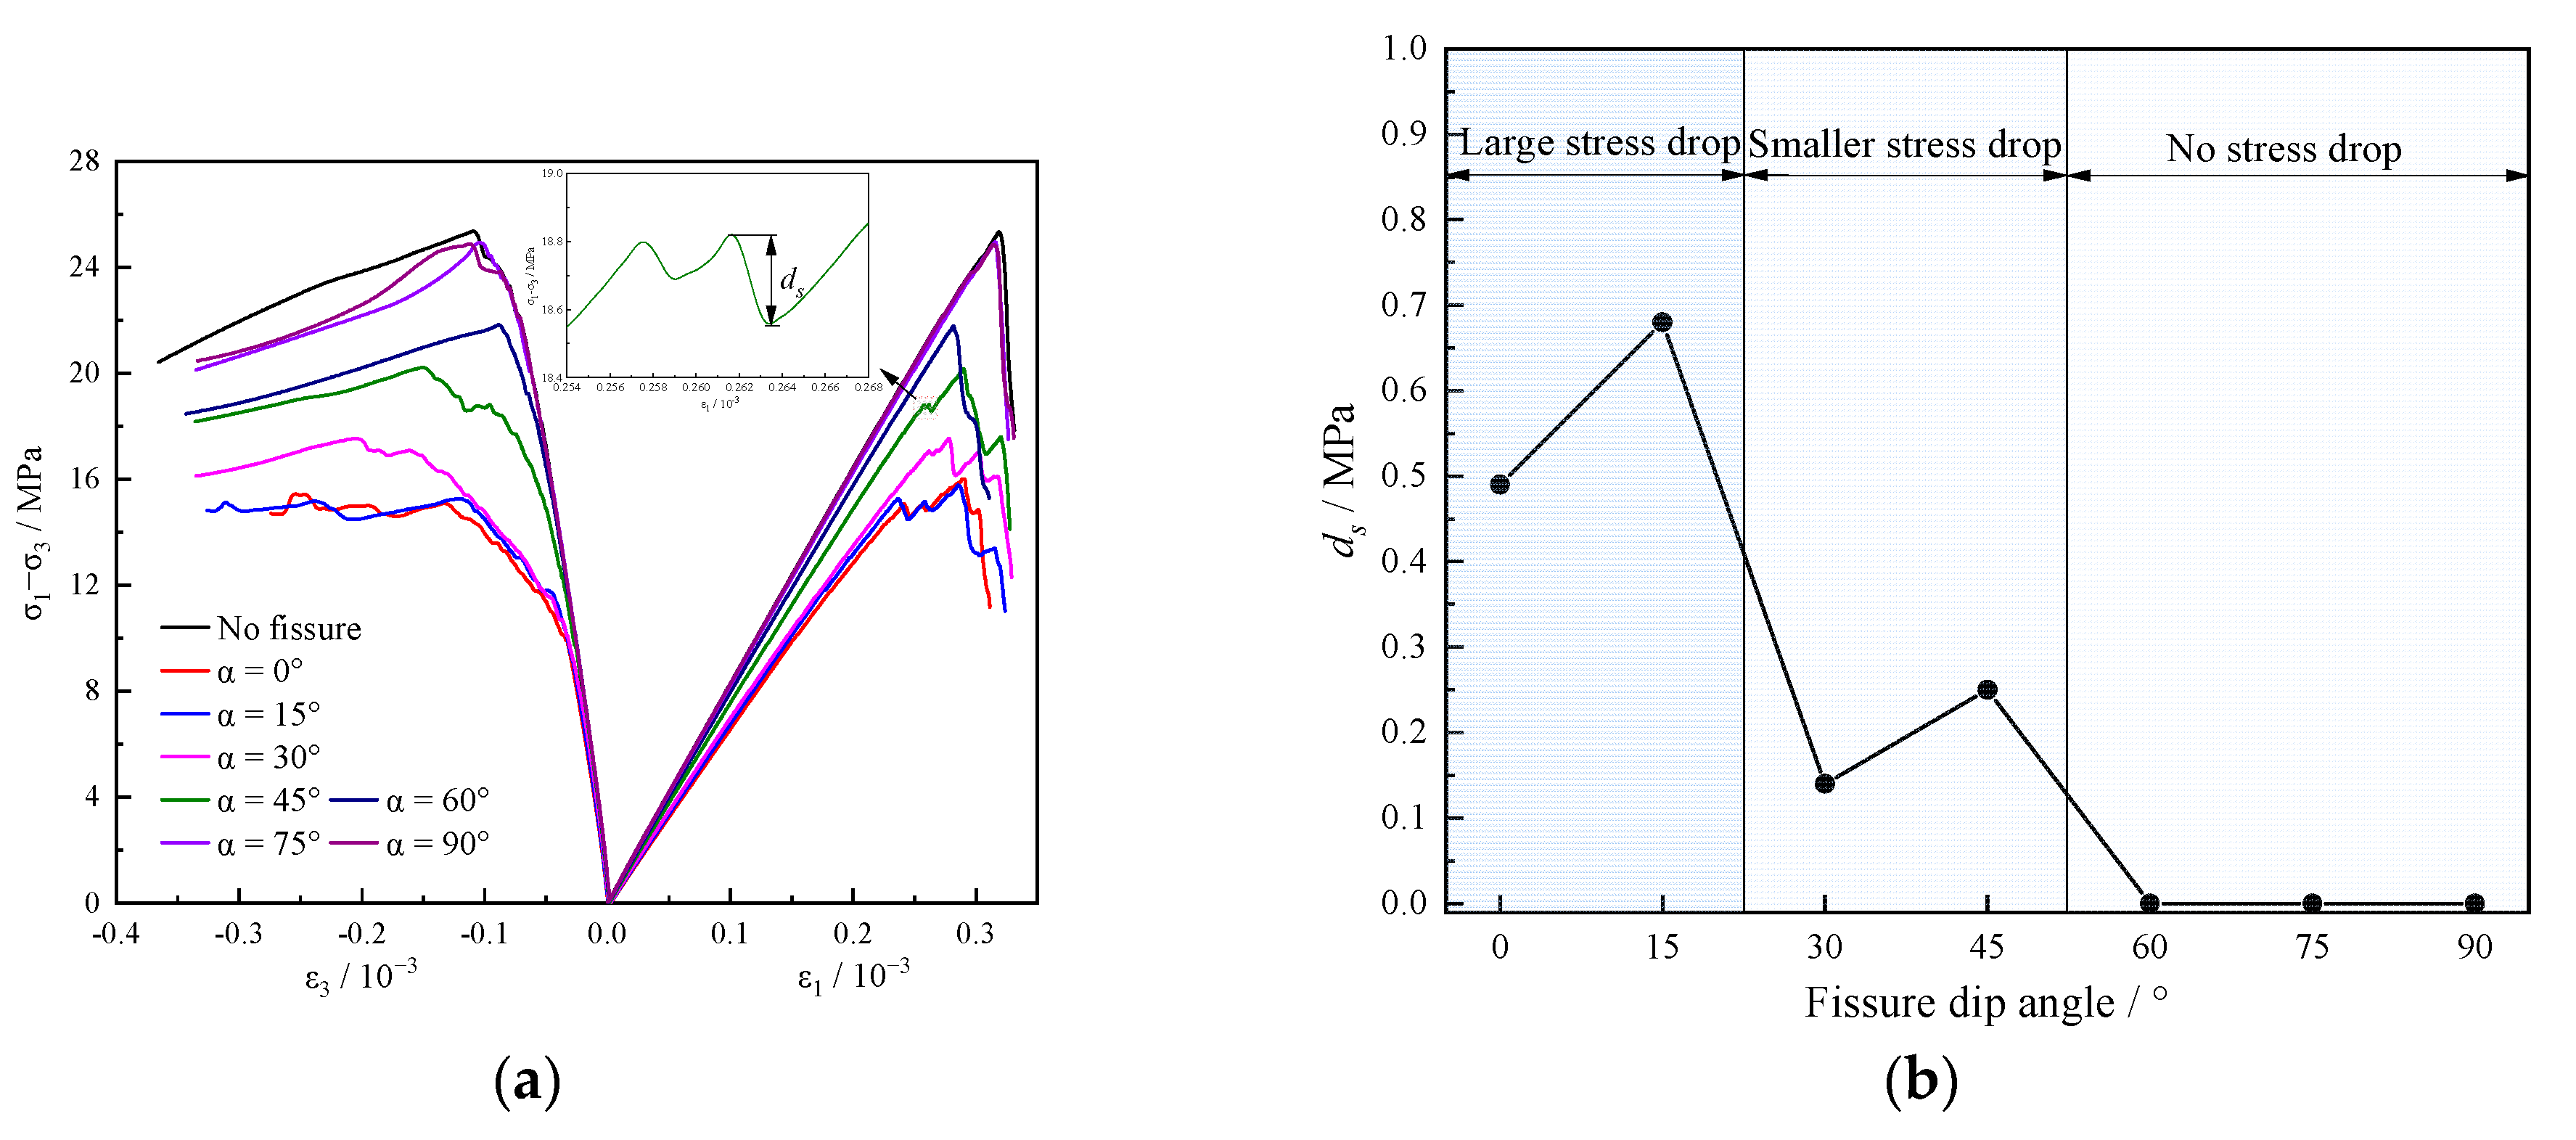
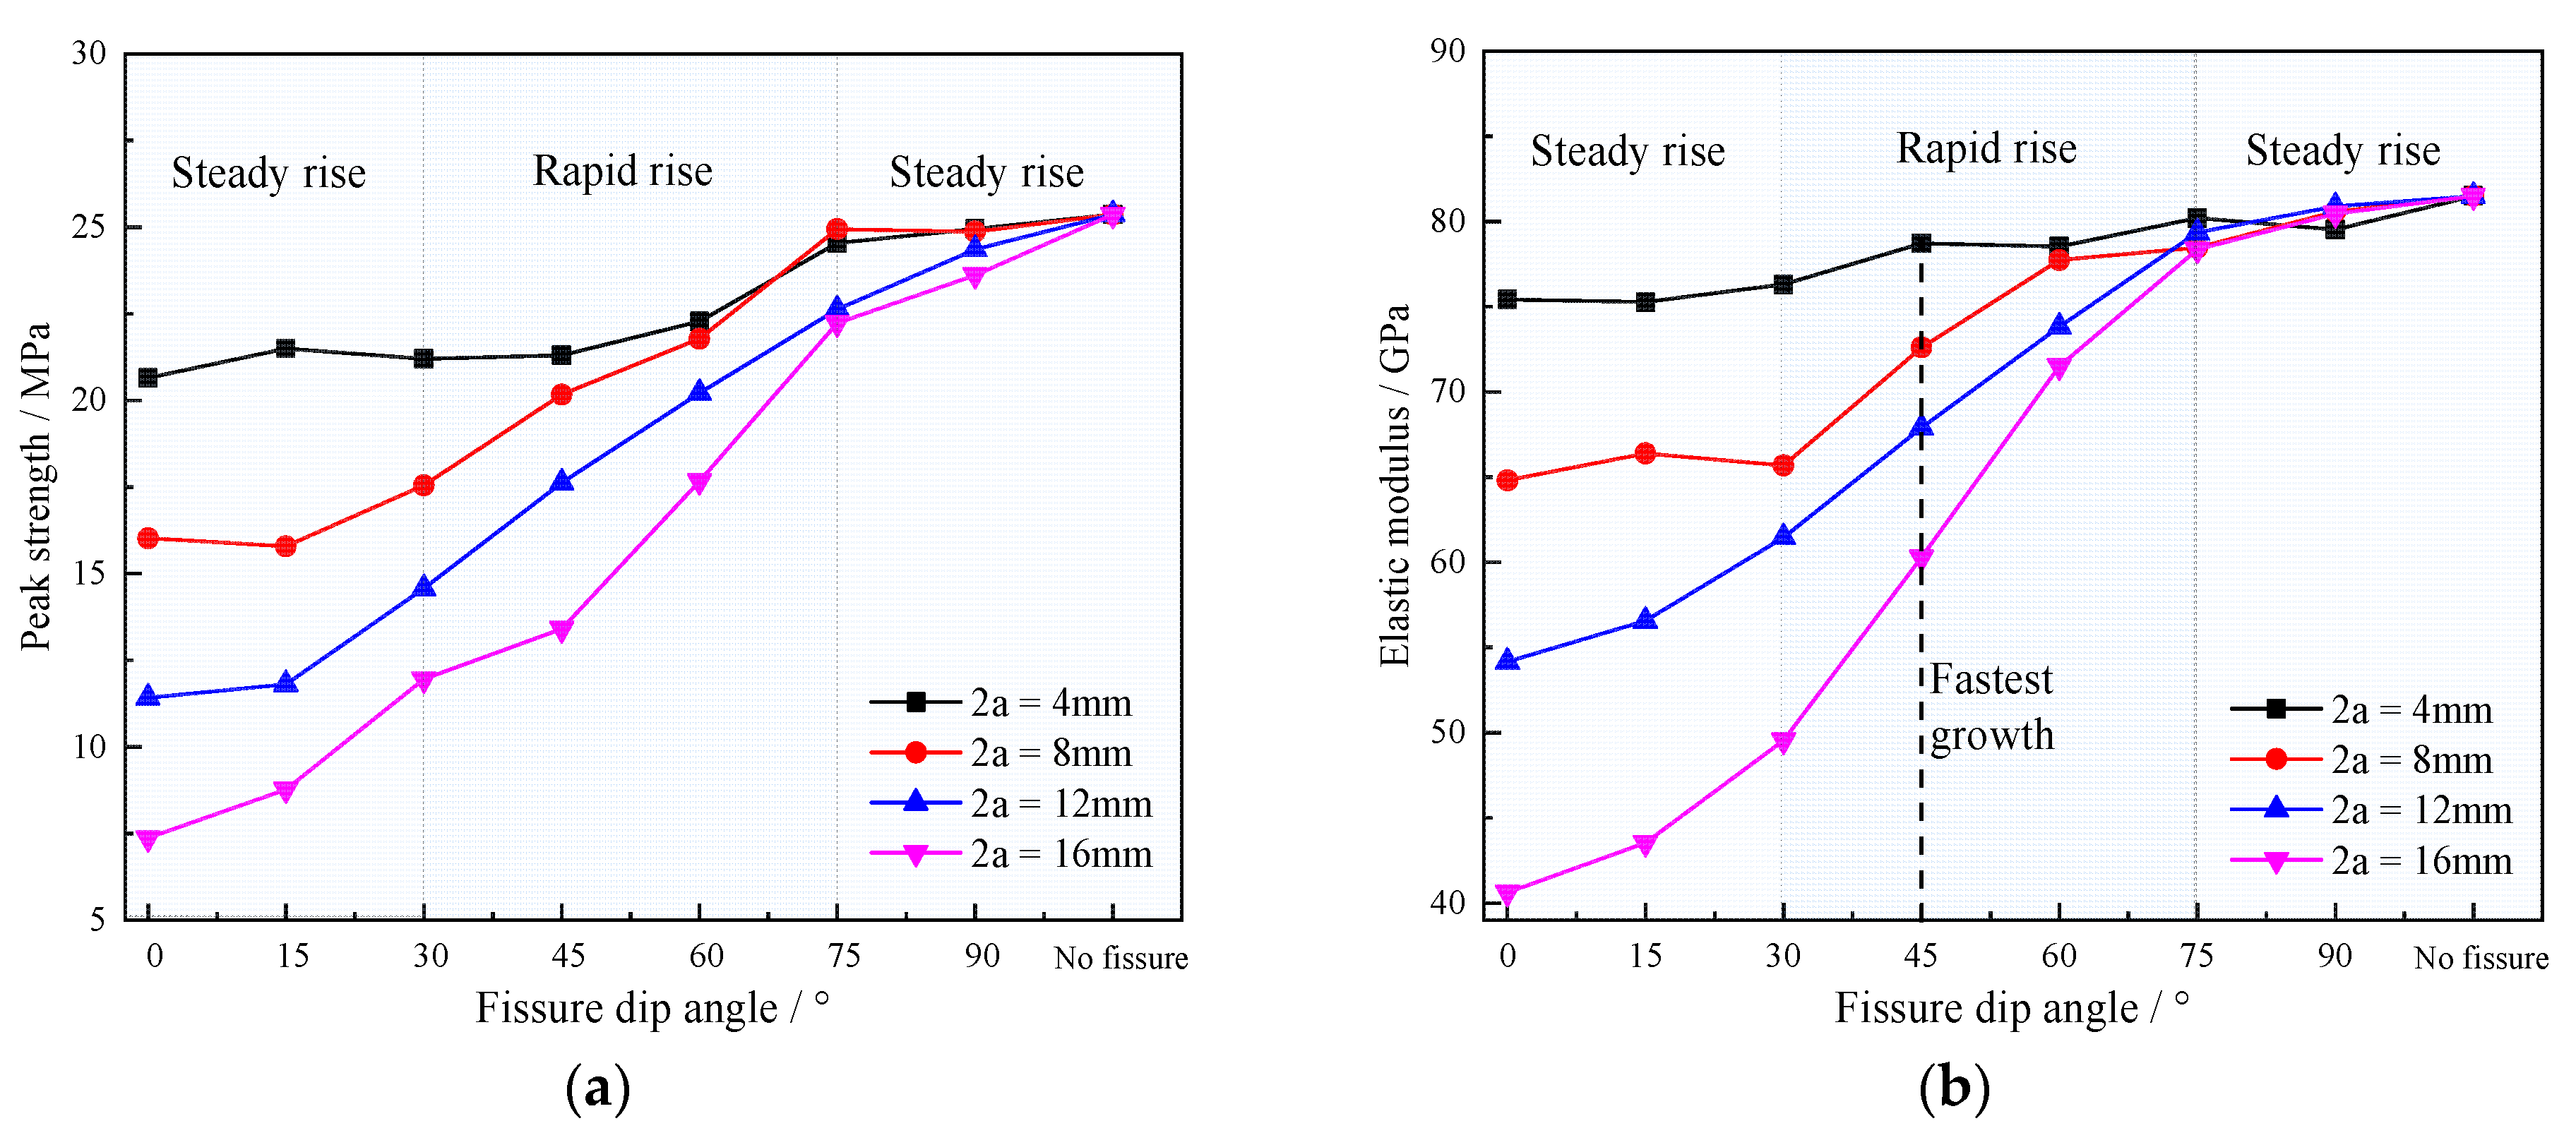
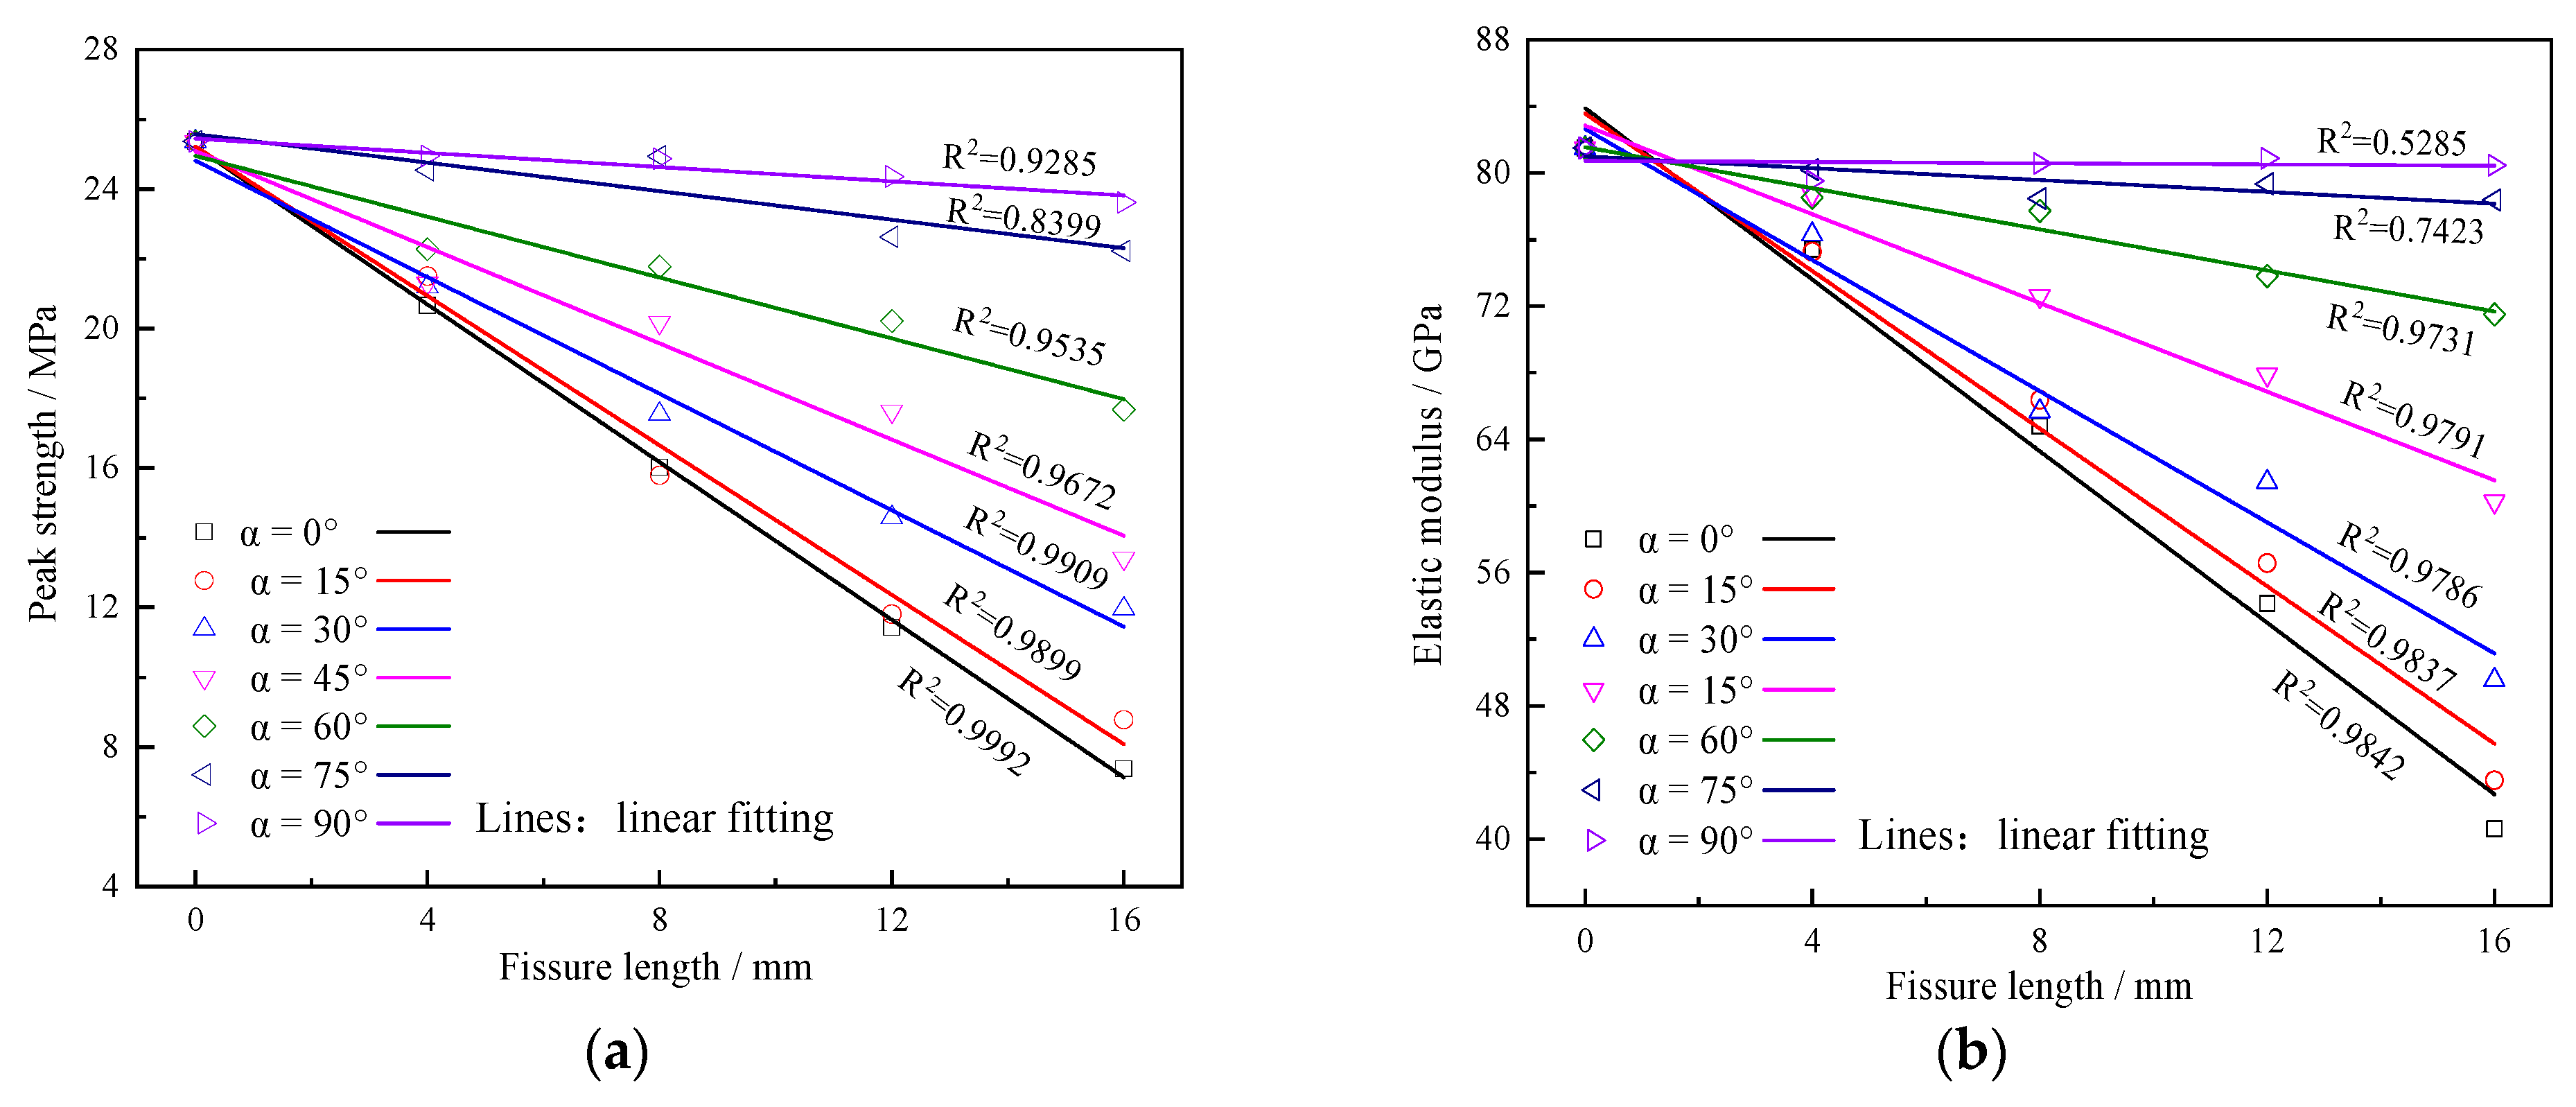
- The deterioration effect of symmetric fissures on hole-containing sandstone can be controlled by increasing the fissure dip angle, suppressing the stress drop phenomenon. However, increasing the fissure length exacerbates the deterioration effect. The experimental findings indicate that the peak strength and elastic modulus of symmetrical fissure-hole sandstone are positively correlated with the fissure dip angle and negatively correlated with the fissure length within the experimental range.
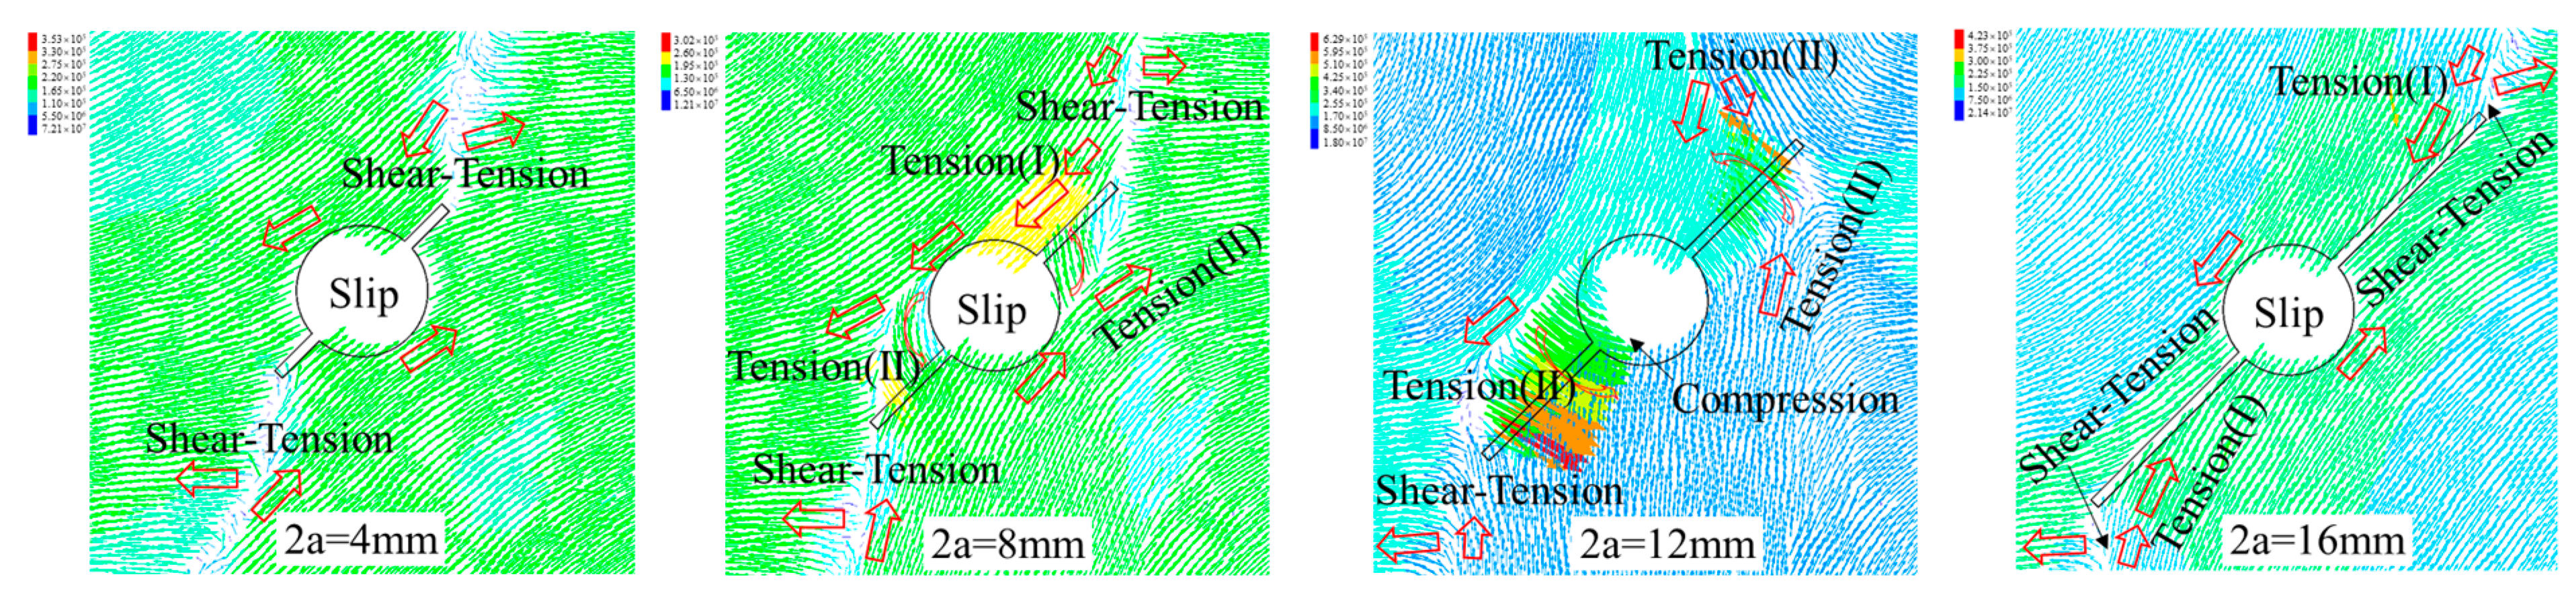
- The effect of a symmetrical fissure dip angle on the displacement field near the hole decreases with increasing dip angle while increasing fissure length exacerbates the effect of a fissure on the displacement field; the opposing transverse displacement of particles is the dominant factor for local tensile failure of the specimens and fissure penetration with the hole; as the fissure inclination increases, three damage patterns of compression, slip, and spalling occur in the hole in turn.
- The symmetrical fissure-hole sandstone failure modes under conventional triaxial compression are all mixed shear-tension failures. As the angle between the fissures and the principal vertical stress increases, the degree of tensile failure weakens while the degree of shear failure increases. Moreover, the location of crack initiation shifts from the fissure tip towards the hole wall.
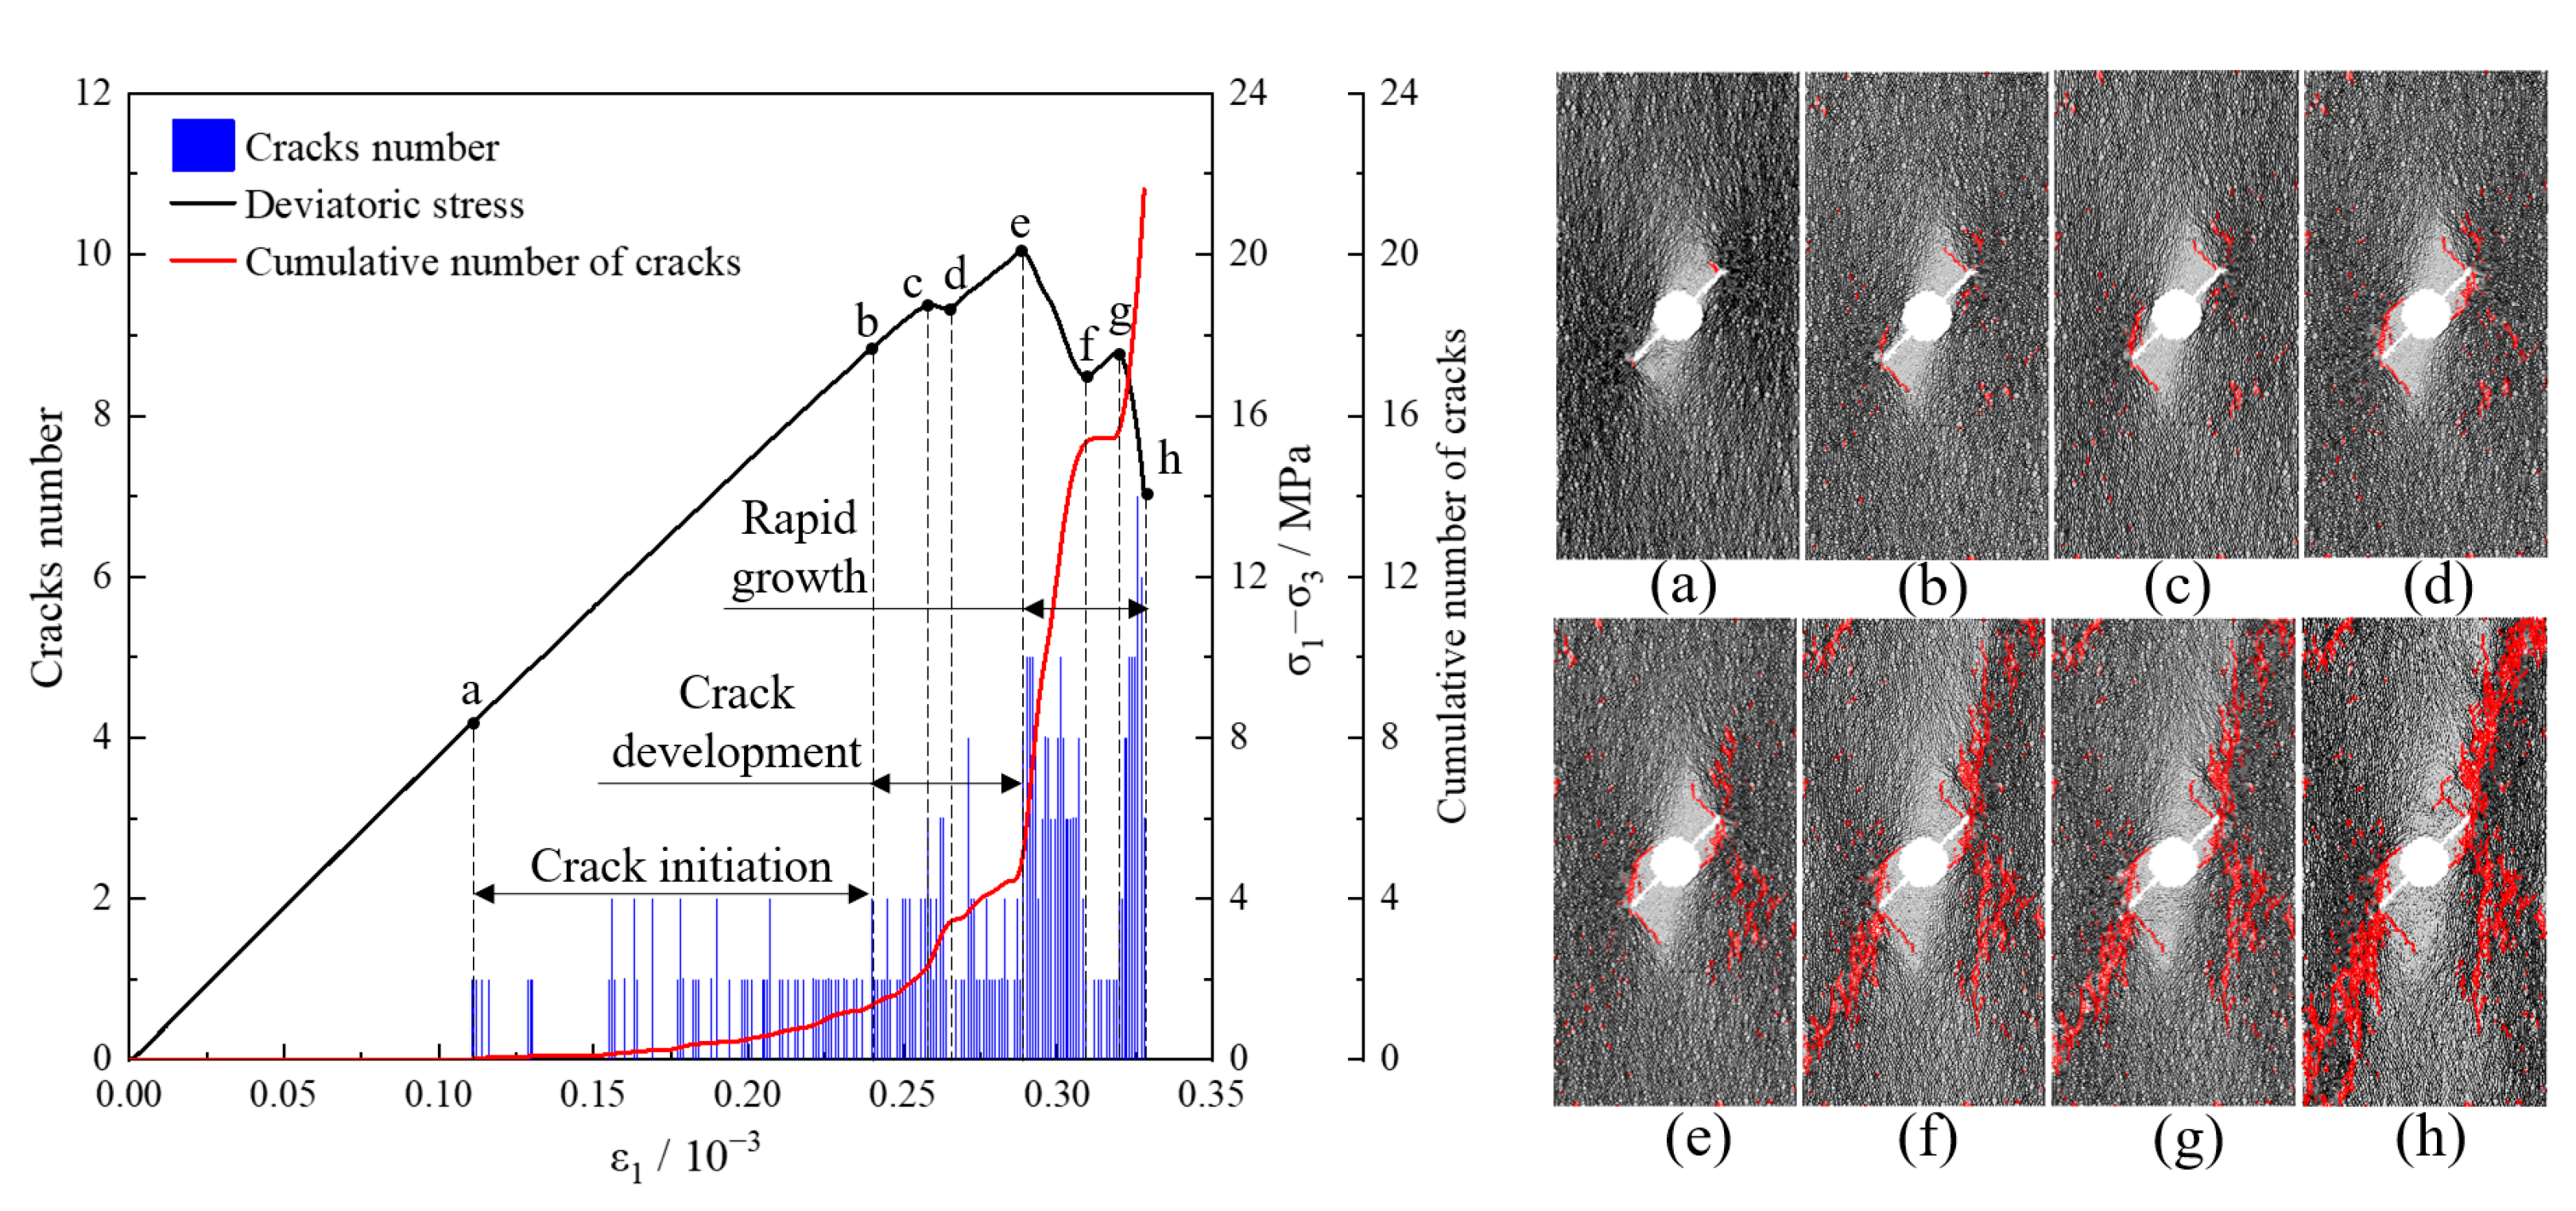
- During the crack development stage of symmetrical fissure-hole sandstone specimens, the extension of the stress concentration zone drives rapid crack growth. It exhibits a stress drop in the macroscopic mechanical properties, followed by the evolution of the stress field with loading and rapid expansion of microcracks, eventually leading to destabilization and damage of the specimen.
Author Contributions
Funding
Data Availability Statement
Conflicts of Interest
References
- Zhao, E.B.; Li, K.N.; Yang, X.; Deng, N. Speculum Observation and Trajectory Measurement in Gas Extraction Drilling: A Case Study of Changling Coal Mine. Geofluids 2021, 2021, 5545067. [Google Scholar] [CrossRef]
- Shuchen, L.; Tengfei, M.; Yujing, J.; Shucai, L.; Luchen, Z. Model tests on deformation and failure laws in excavation of deep rock mass with multiple fracture sets. Chin. J. Geotech. Eng. 2016, 38, 987–995. [Google Scholar]
- Ze, Z.; Chuanqu, Z.; Qingfeng, L. Failure mechanism and stability control of roof roadway in fractured zone. J. China Coal Soc. 2017, 42, 1400–1407. [Google Scholar] [CrossRef]
- Junhua, Z.; Kun, Y.; Kai, F.; Tongbin, Z.; Dongwei, Q. Effect of fissure on mechanical and damage evolution characteristics of sandstone containing hole defect. J. Cent. South Univ. 2019, 50, 968–975. [Google Scholar]
- Chaojiong, H.; Xiangyu, W.; Jianbiao, B.; Ningkang, M.; Wenda, W. Basic theory and technology study of stability control for surrounding rock in deep roadway. J. China Univ. Min. Technol. 2021, 50, 1–12. [Google Scholar] [CrossRef]
- Bobet, A.; Einstein, H.H. Fracture coalescence in rock-type materials under uniaxial and biaxial compression. Int. J. Rock Mech. Min. Sci. 1998, 35, 863–888. [Google Scholar] [CrossRef]
- Chuang, Z.; Jianxin, T.; Junyang, T.; Chenlin, L. Experimental study of influences of pore number and pore size on mechanical properties of marble. Rock Soil Mech. 2017, 38, 41–50. [Google Scholar] [CrossRef]
- Lajtai, E.Z.; Lajtai, V.N. The collapse of cavities. Int. J. Rock Mech. Min. Sci. Geomech. Abstr. 1975, 12, 81–86. [Google Scholar] [CrossRef]
- Lin, P.; Wong, R.H.C.; Tang, C.A. Experimental study of coalescence mechanisms and failure under uniaxial compression of granite containing multiple holes. Int. J. Rock Mech. Min. Sci. 2015, 77, 313–327. [Google Scholar] [CrossRef]
- Wong, R.H.C.; Tang, C.A.; Chau, K.T.; Lin, P. Splitting failure in brittle rocks containing pre-existing flaws under uniaxial compression. Eng. Fract. Mech. 2002, 69, 1853–1871. [Google Scholar] [CrossRef]
- Yanhua, H.; Shengqi, Y.; Yang, J.; Xiaoping, Z.; Feng, G. Experimental study on mechanical behavior of rock-like materials containing pre-existing intermittent fissures under triaxial compression. Chin. J. Geotech. Eng. 2016, 38, 1212–1220. [Google Scholar]
- Yu, Z.; Daguo, Q.; Chaolin, W.; Mingyang, T.; Jing, B. Experimental study and particle flow modeling on 3D cracking behavior of rock-like samples with an embedded flaw. Eur. J. Environ. Civ. Eng. 2022, 26, 6897–6913. [Google Scholar]
- Zhaohui, W.; Wenchao, S.; Yanting, S.; Hao, G. Surface deformation field and frature propagationg mechanism of rock-like samples with pre-existing fracture. Coal Sci. Technol. 2022, 1–11. [Google Scholar] [CrossRef]
- Yang, S.-Q.; Liu, X.-R.; Li, Y.-S. Experimental analysis of mechanical behavior of sandstone containing hole and fissure under uniaxial compression. Chin. J. Rock Mech. Eng. 2012, 31, 3539–3546. [Google Scholar]
- Modiriasari, A.; Bobet, A.; Pyrak-Nolte, L.J. Active Seismic Monitoring of Crack Initiation, Propagation, and Coalescence in Rock. Rock Mech. Rock Eng. 2017, 50, 2311–2325. [Google Scholar] [CrossRef]
- Zhu, T.-T.; Jing, H.-W.; Su, H.-J.; Yin, Q. Experimental investigation on mechanical behavior of sandstone with coupling effects under uniaxial compression. J. China Coal Soc. 2015, 40, 1518–1525. [Google Scholar] [CrossRef]
- Li, X.-H.; Niu, Z.-J.; Yao, Q.-L.; Wang, W.-N.; Yu, L.-Q. Particle flow analysis of crack propagation characteristics of hole-type trident cracks sandstone. J. China Coal Soc. 2020, 45, 3735–3747. [Google Scholar] [CrossRef]
- Zeinab, A.; Mansour, S.; Faham, T.; Luming, S. Experimental and numerical investigations on crack development in 3D printed rock-like specimens with pre-existing flaws. Eng. Fract. Mech. 2020, 241, 107396. [Google Scholar]
- Sharafisafa, M.; Nazem, M. Application of the distinct element method and the extended finite element method in modelling cracks and coalescence in brittle materials. Comput. Mater. Sci. 2014, 91, 102–121. [Google Scholar] [CrossRef]
- Wang, X.-F.; Xia, Z.-J.; Li, P.; Liu, H.-N. Numerical Study on Strength and Failure Behavior of Rock with Composite Defects under Uniaxial Compression. Energies 2021, 14, 4418. [Google Scholar] [CrossRef]
- Yao, D.-H.; Jiang, N.; Wang, X.-J.; Jia, X.-D.; Lv, K. Mechanical behaviour and failure characteristics of rocks with composite defects of different angle fissures around hole. Bull. Eng. Geol. Environ. 2022, 81, 290. [Google Scholar] [CrossRef]
- Sherong, Z.; Bo, S.; Chao, W.; Lei, Y. Discrete element analysis of crack propagation in rocks under biaxial compression. Chin. J. Rock Mech. Eng. 2013, 32, 3083–3091. [Google Scholar]
- Chong, S.; Weiya, X. Particle Flow Numerical Simulation Skills and Practice; China Building Industry Press: Beijing, China, 2015; pp. 6–15. [Google Scholar]
- Itasca, C. PFC (particle flow code in 2 and 3 dimensions), version 5.0 [User’s manual]. Numer. Anal. Methods Geomech. 2014, 32, 189–213. [Google Scholar]
- Huiqiang, D. Study on the Fatigue Failure and Fractal Characteristics of Coal Subjected to Triaxial Cyclic Loading; Shandong University of Science and Technology: Qingdao, China, 2018. [Google Scholar]
- Jiang, M.-J.; Chen, H.; Zhang, N.; Fang, R. Distinct element numerical analysis of crack evolution in rocks containing pre-existing double flaw. Rock Soil Mech. 2014, 35, 3259–3268+3288. [Google Scholar] [CrossRef]
- Yuchi, W.; Yong, Y.; Zhongzheng, Z.; Jun, H.; Zhiguo, X.; Bing, Y. Mechanical properties and failure characteristics of combined hole rocks with different dip angles based on PFC2D. Min. Metall. 2022, 31, 132–139. [Google Scholar]
- Yang, S.-Q.; Yin, P.-F.; Zhang, Y.-C.; Chen, M.; Zhou, X.-P.; Jing, H.-W.; Zhang, Q.-Y. Failure behavior and crack evolution mechanism of a non-persistent jointed rock mass containing a circular hole. Int. J. Rock Mech. Min. Sci. 2019, 114, 101–121. [Google Scholar] [CrossRef]


| Parameters | Numerical Values |
|---|---|
| Number of particles | 11137 |
| Hole diameter (d) | 10 mm |
| Fissure width | 0.8 mm |
| Fissure length (2a) | 0 mm,4 mm,8 mm,12 mm,16 mm |
| Fissure dip angle (α) | 0°, 15°, 30°, 45°, 60°, 75°, 90° |
| Parameters | Compressive Strength (MPa) | Elastic Modulus (GPa) | Natural Density (kg/m3) | Saturated Density (kg/m3) | Porosity (%) |
|---|---|---|---|---|---|
| Values | 75.92 | 38.87 | 2.51 × 10³ | 2.65 × 10³ | 1.6% |
| Sample Number | d (mm) | 2a (mm) | Fissure Width (mm) | α (°) |
|---|---|---|---|---|
| D-1 | 5.0 | 7.1 | 2.5 | 75 |
| D-2 | 5.1 | 7.0 | 2.5 | 45 |
| D-3 | 5.0 | 7.0 | 2.5 | 15 |
| Mesoscopic Parameters | Value | Mesoscopic Parameters | Value |
|---|---|---|---|
| Particle size range, (mm) | 0.2~0.3 | Particle friction coefficient μ | 0.5 |
| Particle size ratio Rmax/Rmin | 1.5 | Particle Young’s modulus E (GPa) | 50 |
| Particle density ρ, (kg/m3) | 2500 | Bond strength pb_σt (MPa) | 10 |
| Particle stiffness ratio k | 2.0 | Bond stiffness ratio pb_k | 2.0 |
| Radius factor | 1.0 | Bond Young’s modulus pb_E (GPa) | 50 |
| Particle dissipation energy Damp | 0.7 |
| Fissure Dip Angle (°) | 15° | 45° | 75° | |||
|---|---|---|---|---|---|---|
| Experimental Result | Numerical Result | Experimental Result | Numerical Result | Experimental Result | Numerical Result | |
| Failure modes | 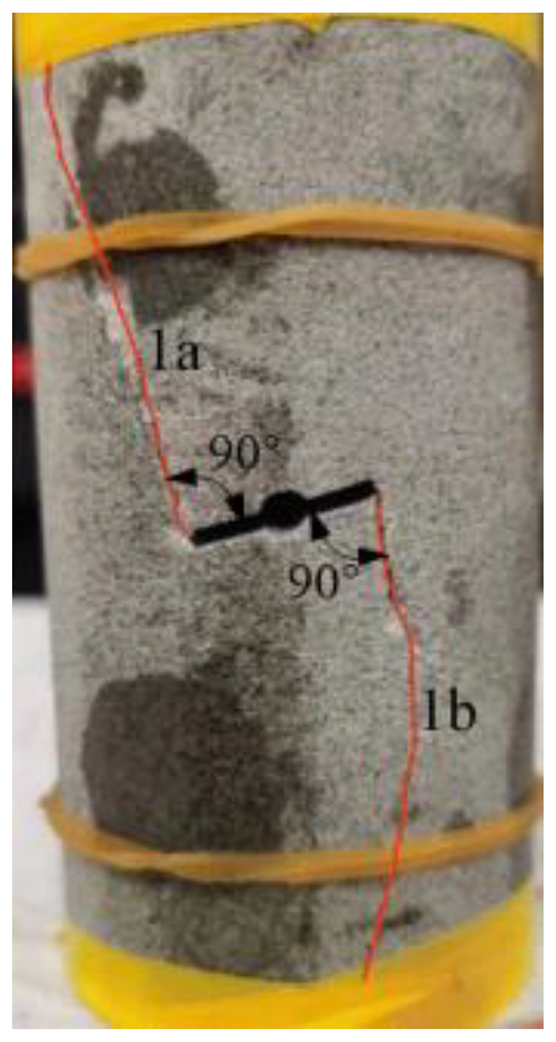 | 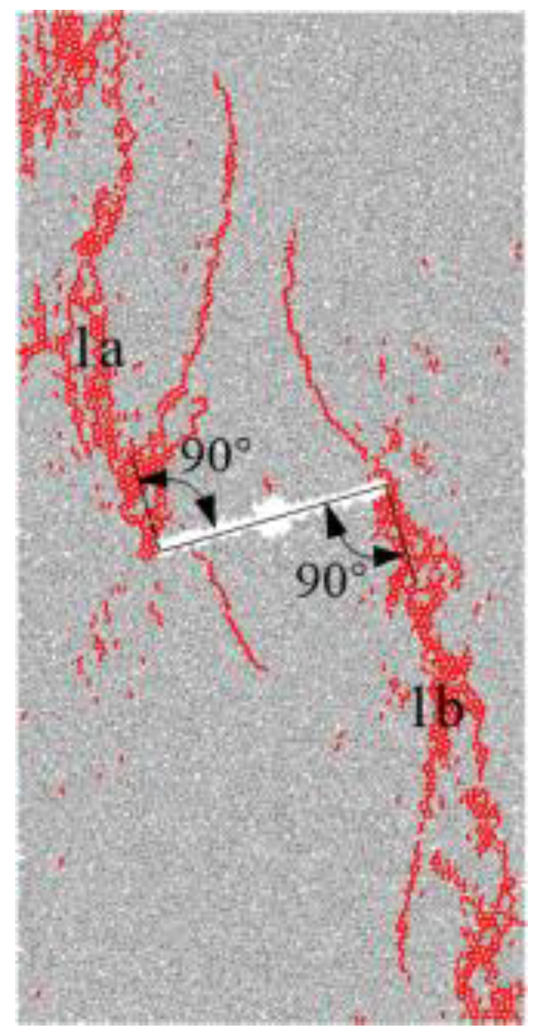 | 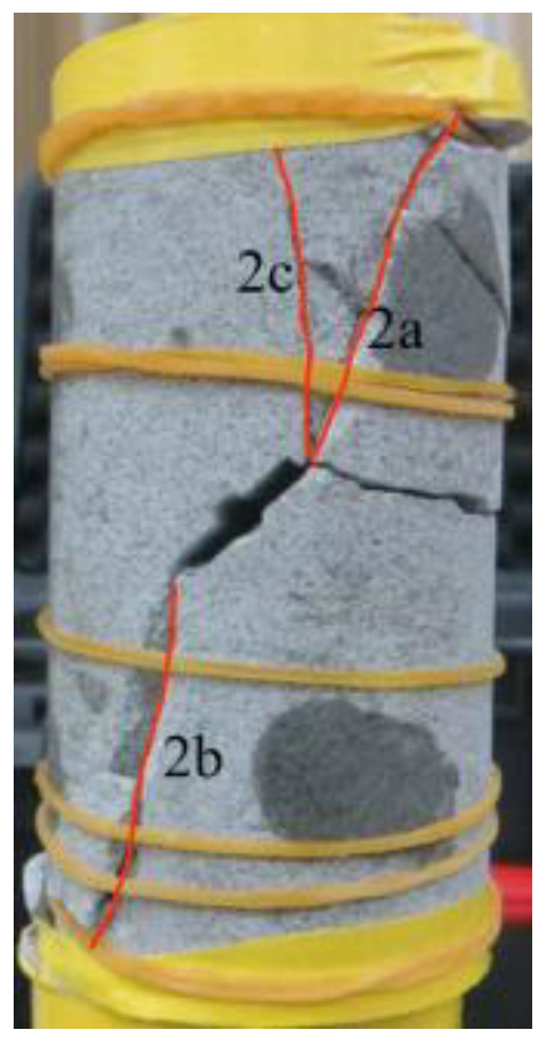 | 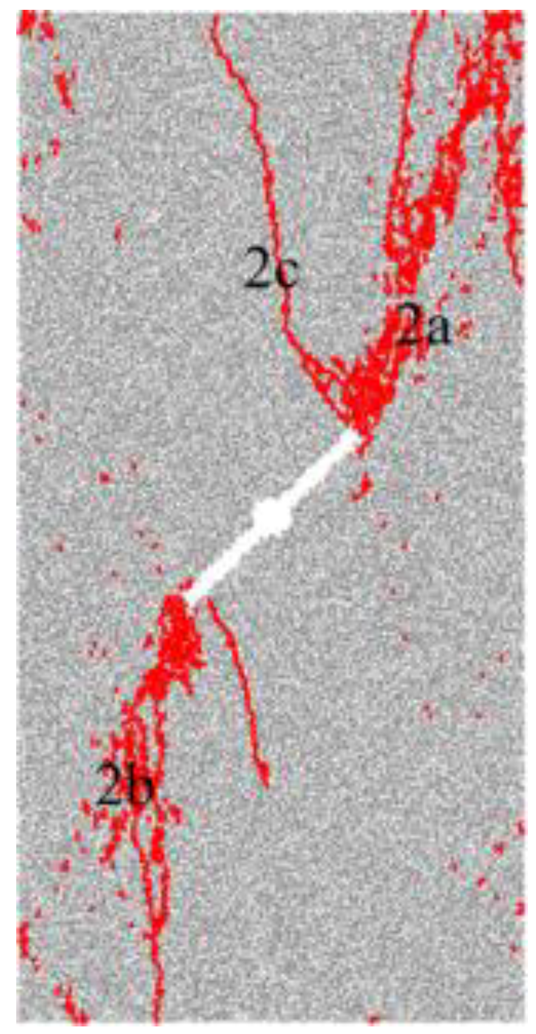 |  | 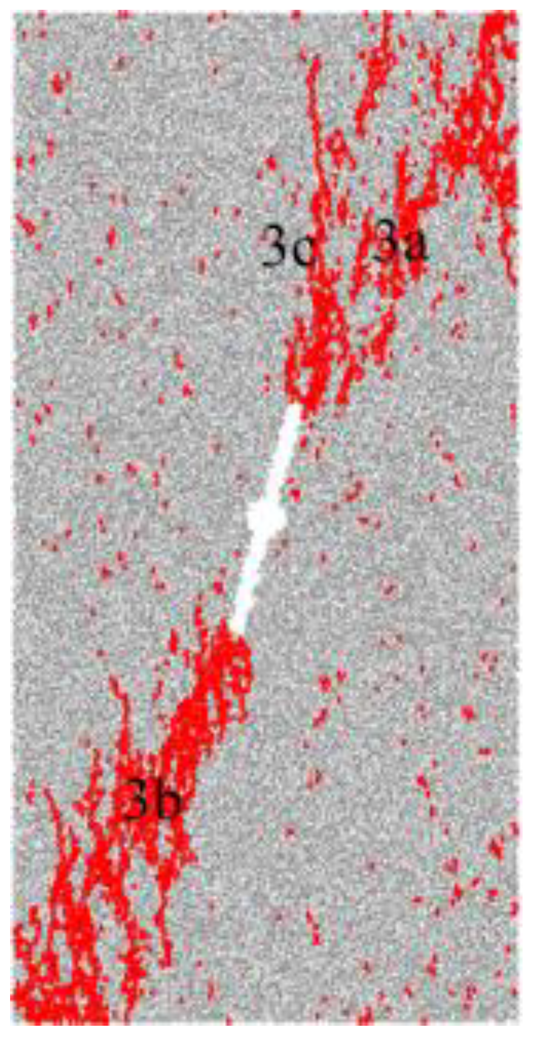 |
| Parameter | α = 0° | α = 15° | α = 30° | α = 45° | α = 60° | α = 75° | α = 90° |
|---|---|---|---|---|---|---|---|
| 2a = 4 mm | C | C | C | C | C | C | H |
| 2a = 8 mm | C | C | C | C | C | H | H |
| 2a = 12 mm | C | C | C | C | C | H | H |
| 2a = 16 mm | C | C | C | C | C | H | H |
Disclaimer/Publisher’s Note: The statements, opinions and data contained in all publications are solely those of the individual author(s) and contributor(s) and not of MDPI and/or the editor(s). MDPI and/or the editor(s) disclaim responsibility for any injury to people or property resulting from any ideas, methods, instructions or products referred to in the content. |
© 2023 by the authors. Licensee MDPI, Basel, Switzerland. This article is an open access article distributed under the terms and conditions of the Creative Commons Attribution (CC BY) license (https://creativecommons.org/licenses/by/4.0/).
Share and Cite
Gou, H.; Shi, P.; Wan, Z.; Xiong, L.; Fan, B.; Zhen, Z. Numerical Analysis of Perforated Symmetric Fissures on Mechanical Properties of Hole-Containing Sandstone. Appl. Sci. 2023, 13, 8780. https://doi.org/10.3390/app13158780
Gou H, Shi P, Wan Z, Xiong L, Fan B, Zhen Z. Numerical Analysis of Perforated Symmetric Fissures on Mechanical Properties of Hole-Containing Sandstone. Applied Sciences. 2023; 13(15):8780. https://doi.org/10.3390/app13158780
Chicago/Turabian StyleGou, Hong, Peng Shi, Zhijun Wan, Luchang Xiong, Bowen Fan, and Zheng Zhen. 2023. "Numerical Analysis of Perforated Symmetric Fissures on Mechanical Properties of Hole-Containing Sandstone" Applied Sciences 13, no. 15: 8780. https://doi.org/10.3390/app13158780
APA StyleGou, H., Shi, P., Wan, Z., Xiong, L., Fan, B., & Zhen, Z. (2023). Numerical Analysis of Perforated Symmetric Fissures on Mechanical Properties of Hole-Containing Sandstone. Applied Sciences, 13(15), 8780. https://doi.org/10.3390/app13158780