Abstract
Greece is among the European Union members topping the list of deaths related to coronary artery disease. Myocardial Perfusion Imaging (MPI) with Single-Photon Emission Computed Tomography (SPECT) is a non-invasive test used to detect abnormalities in CAD screening. The study proposes an explainable deep learning (DL) method for characterising MPI SPECT Polar Map images in patients with suspected CAD. Patient data were recorded at the Department of Nuclear Medicine of the University Hospital of Patras from 16 February 2018 to 28 February 2022. The final study population included 486 patients. An attention-based feature-fusion network (AFF-VGG19) was proposed to perform the diagnosis, and the Grad-CAM++ algorithm was employed to reveal potentially significant regions. AFF-VGG19’s agreement with the medical experts was found to be 89.92%. When training and assessing using the ICA findings as a reference, AFF-VGG19 achieved good diagnostic strength (accuracy of 0.789) similar to that of the human expert (0.784) and with more balanced sensitivity and specificity rates (0.873 and 0.722, respectively) compared to the human expert (0.958 and 0.648, respectively). The visual inspection of the Grad-CAM++ regions showed that the model produced 77 meaningful explanations over the 100 selected samples, resulting in a slight accuracy decrease (0.77). In conclusion, this research introduced a novel and interpretable DL approach for characterising MPI SPECT Polar Map images in patients with suspected CAD. The high agreement with medical experts, robust diagnostic performance, and meaningful interpretability of the model support the notion that attention-based networks hold significant promise in CAD screening and may revolutionise medical decision-making in the near future.
1. Introduction
Coronary artery disease (CAD) is a leading cause of death worldwide. Greece is among the European Union members topping the deaths related to CAD [1]. It is a common cardiovascular disorder that results from the accumulation of plaques in the coronary arteries, which supply blood and oxygen to the heart muscle [2]. These plaques are composed of cholesterol, fat, and other substances and can cause narrowing or blockage of the coronary arteries, leading to reduced blood flow to the heart [2]. This reduced blood flow can cause chest pain, shortness of breath, or even a heart attack. CAD is a multifactorial disease, with risk factors including high blood pressure, high cholesterol, smoking, diabetes, and a family history of heart disease [3]. Preventative measures such as early detection, healthy lifestyle choices, and proper management of risk factors are essential for reducing the incidence and severity of CAD and promoting cardiovascular health [4].
The ultimate diagnosis and remedy of CAD involve invasive coronary angiography (ICA) and, subsequently [5], percutaneous coronary angioplasty (PCI) [6] or coronary artery bypass grafting (CABG) [7] in selected cases. Conservative treatment with appropriate medication opts for patients not eligible for PCI or CABG. Early diagnostic tests and clinical factors are employed to assess the CAD risk with low moderate predicting strength due to ambiguous results and the subjectivity of human experts. Myocardial Perfusion Imaging (MPI) with Single-Photon Emission Computed Tomography (SPECT) is a test used to evaluate the blood flow [8] to the heart muscle and to detect any abnormalities in CAD screening. The test is performed by injecting a small amount of radioactive material into the bloodstream and using a special camera to take pictures of the heart as it beats. This helps to determine if the heart muscle is receiving enough blood and oxygen.
Deep learning (DL) [9] is a type of artificial intelligence that has rapidly become a powerful tool in medical imaging analysis. In recent years, it has shown remarkable results in detecting, classifying, and segmenting images in various medical applications, including radiology, pathology, and ophthalmology [10,11,12]. DL algorithms are particularly suited to medical imaging, because they can automatically learn from large datasets and recognise complex patterns that might not be easily detectable by human experts [13]. DL algorithms have been used in various applications in medical imaging, including image classification, object detection, segmentation, and registration. In image classification, DL algorithms can recognise different types of images, such as X-rays or MRI scans, and classify them into specific categories [14].
One of the main benefits of DL in medical imaging is its ability to analyse large amounts of data quickly and accurately. Medical imaging produces large amounts of data, and DL algorithms can analyse these data more efficiently than human experts. For example, a DL algorithm can analyse thousands of mammography images in minutes, detecting subtle changes indicative of breast cancer.
Another benefit of DL in medical imaging is its ability to detect subtle changes that human experts might overlook. In some cases, radiologists may miss early signs of disease or fail to identify specific patterns in medical images, especially when analysing large volumes of data. On the other hand, DL algorithms can learn from large datasets and recognise complex patterns that humans may not detect easily. This ability to detect subtle changes early can lead to an earlier diagnosis and more effective treatment, improving patient outcomes.
DL in medical imaging also has the potential to improve the workflow and reduce costs. With the ability to analyse large volumes of data quickly and accurately, DL algorithms can automate many routine tasks currently performed manually by human experts. This can free up radiologists and other medical professionals to focus on more complex tasks and cases, reducing the workload and improving the efficiency. DL algorithms can also help reduce costs by reducing the need for expensive and invasive diagnostic tests and procedures.
In this study, a DL method is proposed for CAD diagnosis. The input of the proposed system is the four associated Polar Maps that aggregate the information of the MPI SPECT scan. Though MPI SPECT is not a definite diagnostic test, it is a reliable non-invasive method. The study’s methodology lies in an innovative attention-based network that performs hierarchical and non-hierarchical feature extraction and classification. The contributions of the present study can be clarified as follows:
- A novel attention-based modification of the VGG19 network is proposed that improves the identification of essential areas of the Polar Map and performs feature-fusion via concatenation.
- The network is evaluated with reference to the invasive coronary angiography (ICA) test results and shows high classification accuracy, sensitivity, and specificity.
- The network agrees with the medical experts, who visually inspected the Polar Maps and delivered their diagnostic yields.
- The post hoc explainability algorithm reveals the crucial areas of the Polar Map, which the medical experts assessed to verify the correctness of the model.
The rest of the paper is organized as follows. The literature review is presented in Section 1.1. The materials and methods of the study are introduced in Section 2. More specifically, Section 2.1 describes the DL method of the study, i.e., the Attention-based Feature-Fusion VGG19 network, Section 2.2 discusses about the explainability-enhancing method, Section 2.3 presents the dataset of the study, Section 2.4 the image preprocessing methodology, and Section 2.5 presents an overview of the experiments. The results are presented in Section 3, where the model is assessed based on its agreement with the human expert (Section 3.1) and its diagnostic efficiency (Section 3.2). Various comparisons are held in Section 3.3, Section 3.4 and Section 3.5. A discussion is held in Section 4, with the major remarks in Section 5.
1.1. Related Work
Papandrianos et al. [15] developed an RGB-CNN model to classify SPECT images as normal or ischemic, addressing a data scarcity issue with data augmentation. The model achieved impressive results, with 90.2% accuracy and a 93.77% AUC value, outperforming human reader interpretation as the ground truth. Despite the limited dataset, the model demonstrated remarkable predictive capabilities.
The same research team [13] aimed to diagnose ischemia and/or infarction using CNNs with a dataset comprising 224 patients who underwent stress and rest SPECT tests, followed by invasive coronary angiography (ICA) 40 days later. They explored two deep learning techniques: implementing an RGB-CNN from scratch and employing transfer learning with pretrained models like VGG16, DenseNet, MobileNet, and InceptionV3 to classify images as normal or abnormal. Comparing the results to visual assessments by medical experts, the proposed CNN demonstrated significant abilities, achieving an overall accuracy of 93.48% ± 2.81%. Once again, the CNN model showcased its potential in accurately diagnosing ischemia and infarction, even with a relatively limited dataset. This accuracy is significantly improved compared to the 90.2% initially obtained in [15].
Narges Zahiri et al. [16] investigated the capabilities of deep CNNs in distinguishing between normal and abnormal Polar Maps, using physician diagnoses as the reference. The dataset consisted of 3318 stress and rest Polar Maps, and data augmentation techniques were applied to expand the training dataset. The proposed deep learning model underwent thorough validation through a five-fold cross-validation procedure, achieving an AUC (Area Under the Curve) of 0.845. Notably, including rest perfusion, the maps led to a significant improvement in the DL model’s AUC (0.845) compared to using only stress polar maps (0.827).
Papandrianos et al. [17] aimed to explore the feasibility of automatically classifying polar maps as normal or abnormal using a custom RGB-CNN. The dataset comprised 314 polar maps in stress and rest representations, with AC (attenuation correction) and NAC (non-attenuation correction) formats. The RGB-CNN was trained using physician interpretations as the ground truth and was compared to the performance of the pretrained VGG-16 network. The results showed that the RGB-CNN achieved an accuracy of 92.07%, while VGG-16 achieved 95.83%. Although the RGB-CNN’s performance was slightly lower, it still competed effectively against robust state-of-the-art methods for polar map classification.
In some research, deep learning-based results are compared against quantifiable metrics recommended by medical guidelines. These metrics provide objective and standardised measures to evaluate the performances of deep learning models in various medical tasks. By comparing the DL-based results with these established metrics, researchers can assess the effectiveness and reliability of the proposed models in clinical settings, ensuring they align with the best practices and recommendations provided by medical experts.
For example, Yuka Otaki et al. [12] developed a DL model to identify CAD and evaluated its performance by comparing it with the total perfusion deficit (TPD) method. The dataset comprised 1160 patients and included raw upright and supine stress Myocardial Perfusion Imaging (MPI) polar maps. Both MPI and invasive coronary angiography (ICA) were conducted within a 6-month interval. The researchers employed a leave-one-centre-out approach with four different models for external validation. This validation method allowed them to assess the DL model’s generalisation and performance across various medical centres, enhancing the reliability of the results.
Julian Betancur et al. [18] developed a CNN to identify CAD. The study included 1160 participants, and the data comprised semi-upright and supine stress Polar Map representations. Obstructive disease classification was evaluated using the leave-one-centre-out cross-validation technique with four centres. All validated predictions were combined to avoid single-centre bias. Notably, the CNN model diagnosed without relying on predefined coronary territories. The CNN’s performance was compared against the combined perfusion quantification using TPD, achieving a sensitivity of 84.8%, surpassing the 82.6% sensitivity obtained with clinical reading.
In a subsequent study, Julian Betancur et al. [19] compared the automatic diagnosis of CAD using SPECT image inputs with a deep CNN against the TPD method. They examined 1638 patients without known CAD who underwent invasive coronary angiography within six months of MPI. The dataset included raw and quantitative polar maps in stress representations only. To evaluate their proposed deep learning model, they employed a stratified 10-fold cross-validation procedure. The AUC score for disease prediction using the DL model was superior to TPD (per patient: 0.80 vs. 0.78; per vessel: 0.76 vs. 0.73). When the DL threshold was set to the same specificity as TPD, the per-patient sensitivity improved from 79.8% (TPD) to 82.3%, and the per-vessel sensitivity improved from 64.4% (TPD) to 69.8%.
In addition to differentiating between normal and abnormal subjects, certain studies focused on region-based classification. Instead of considering the overall classification of the entire image, region-based classification involves identifying and classifying specific regions or regions of interest within the image. This approach allows researchers to gain more detailed insights into the particular areas or regions that may be affected by certain conditions or diseases.
Arvidsson et al. [20] developed a CNN to predict obstructive coronary artery disease in the left anterior artery, left circumflex artery, and right coronary artery using SPECT Polar Maps. The research involved 588 patients, and clinical data, including angina symptoms and age, were incorporated into the analysis. The proposed CNN framework demonstrated promising results, achieving an average AUC of 0.89 per vessel and an impressive 0.95 per patient, with the invasive coronary angiography (ICA) findings used as the reference standard. To provide visual insights into the basis of the predictions, the researchers employed gradient-weighted class activation mapping (Grad-CAM) to highlight the regions influencing the model’s output. Notably, the authors identified sex differences in the diagnostic performance of the deep learning model for predicting obstructive CAD from D-SPECT, with the CNN outperforming the visual and TPD methods in men but not in women. This finding underscores the importance of considering potential sex-specific variations when employing DL models for a CAD diagnosis.
There is a growing trend in research towards proposing explainable deep learning (DL)-based methods that perform image classification and provide insights into the suggested areas of interest, where the model bases its predictions. These methods aim to enhance the interpretability and transparency of DL models, addressing the “black box” nature of traditional deep learning algorithms. By incorporating explainable techniques, researchers seek to inform users about the specific regions or features in the input images that contribute to the model’s decision-making process. This builds trust in the model’s predictions and allows domain experts, such as doctors in medical imaging applications, to better understand and validate the results. Explainable DL methods are becoming increasingly important in various fields, including healthcare, where accurate and interpretable predictions are critical for decision-making and patient care.
Miller et al. [21] developed a DL model to enhance the diagnostic accuracy of CAD and aid in physical interpretation. The dataset consisted of 240 patients who underwent MPI examinations, with invasive coronary angiography used as the reference standard. The results showed that, when human readers used the DL’s predictions, they achieved an AUC of 0.779, whereas their interpretation without DL assistance reached an AUC of 0.747. It is worth noting that the DL model, when used independently, achieved an AUC of 0.793, showcasing its potential in improving the diagnostic performance for CAD. Incorporating the explainable DL model provided higher accuracy and facilitated the interpretation of the results, making it a valuable tool for assisting medical professionals in CAD diagnosis and decision-making.
Yuka Otaki et al. [22,23] introduced an explainable DL model to detect obstructive CAD. Their study included a large dataset of 3578 patients with suspected CAD from nine different centres. The authors proposed a hand-crafted CNN to process SPECT Polar Maps acquired under stress conditions. In the fully connected layer of the CNN, they incorporated additional features such as the patient’s sex and age to augment the model’s input. When evaluated against the invasive coronary angiography findings, this method achieved an impressive AUC score of 0.83 through a 10-fold cross-validation procedure, outperforming the quantitative analysis results by expert readers (AUC = 0.8). Moreover, attention maps were generated to highlight the regions and segments that contributed the most to the per-vessel predictions, providing insights into the model’s decision-making process and making it more interpretable for clinical application.
Singh et al. [24] developed an explainable deep learning model for predicting nonfatal myocardial infarction (MI) or death, highlighting image regions relevant to obstructive CAD. The study included 20,401 patients who underwent SPECT MPI procedures for training and internal testing, and an additional 9019 patients were included in the external testing group from two different sites to assess the generalisability. The dataset comprised stress and rest polar maps, age, sex, and cardiac volumes, which were added at the first fully connected layer. To enhance the explainability, the researchers developed Grad-CAM. For comparison, a logistic regression model was also developed using age, sex, stress TPD, rest TPD, stress left ventricular ejection fraction, and stress left ventricular end-systolic volume as the input features. The developed deep learning model achieved an impressive AUC of 0.76, outperforming stress TPD with an AUC of 0.63 and ischemic TPD with an AUC of 0.6. Moreover, it also improved upon the logistic regression model, which achieved an AUC of 0.72. The explainable deep learning model provided enhanced accuracy compared to traditional quantitative approaches and exhibited good calibration and robust results. These findings indicated the potential of the developed model for improved risk prediction and decision-making in the context of myocardial infarction and CAD.
Jui-Jen Chen et al. [25] examined 979 SPECT subjects from a local hospital for diagnosis; however, it was not specified whether the images were labelled based on experts’ visual inspections or ICA findings. A three-dimensional CNN was employed to classify the SPECT slices, and Grad-CAM heat maps were generated to identify myocardial defects in the images. The proposed model achieved impressive accuracy, sensitivity, and specificity metrics of 87.64%, 81.58%, and 92.16% in distinguishing between normal and abnormal images using a test set of 89 samples. These results demonstrated the model’s promising capabilities for the accurate and reliable classification of SPECT images to diagnose cardiovascular conditions.
Nathalia Spier et al. [26] explored using Graph Convolutional Neural Networks (Graph CNNs) for diagnosing CAD. They included 946 polar map images representing the stress and rest conditions of the heart and labelled them based on human observer interpretations. Heatmaps were generated to highlight the pathological segments of the heart. The results demonstrated the model’s strong performance in classifying unseen data during a four-fold cross-validation procedure, outperforming the clinical visual analysis, with 92.8% specificity for the rest data and 95.9% for the stress data. The proposed model agreed 89.3% with the human observer for rest test polar maps and 91.1% for the stress test polar maps. For localisation performed on a fine 17-segment division of the polar map, the agreement was 83.1% with the human observer. These findings indicate the model’s potential in aiding CAD diagnosis and its ability to accurately identify pathological segments in cardiac images.
Selcan Kaplan Berkaya et al. [27] developed a classification model for SPECT images to identify perfusion abnormalities, such as ischemia and infarction. The researchers investigated two different models. The first model was a deep learning (DL)-based approach that utilised state-of-the-art CNNs and fully connected support vector machine (SVM) layers to classify the deep-extracted image features. The second model involved image processing techniques, including segmentation, feature extraction, and colour thresholding, applied to the segmented parts of each SPECT slice. This method extracted five predefined image features that were classified using a rule-based algorithm. In terms of performance, the integrated CNN-SVM model achieved 92% accuracy, 84% sensitivity, and 100% specificity, based on the visual assessments conducted by experts.
On the other hand, the knowledge-based classification attained 93% accuracy, 100% sensitivity, and 86% specificity. These metrics were reported on a test dataset that included 17% of the total samples. The results demonstrated the potential of both DL-based and knowledge-based approaches in accurately classifying SPECT images and detecting perfusion abnormalities, with each model showing strengths in different performance aspects.
Hui Liu et al. [28] demonstrated a DL approach for automatically diagnosing myocardial perfusion abnormalities using stress MPI profile maps as the input, considering both abnormal and normal cases. The study included a substantial dataset of 37,243 patients who underwent stress-only and stress/rest SPECT MPI examinations using three SPECT/CT cameras. The DL model utilised the ResNet-34 architecture for feature extraction. In addition to the MPI data, six extra features, including gender, BMI, length, stress type, radiotracer, and the option of including or not including the attenuation correction, were incorporated into the model. The results were compared against the conventional quantitative perfusion defect size (DS) method. The DL model achieved an impressive AUC of 0.87, outperforming the DS method. Furthermore, the proposed network demonstrated robustness to variations in image acquisition devices, achieving 82% and 84% accuracy across all scanners. Notably, the model exhibited even greater performance in female participants, reaching an accuracy of 87%. These findings highlight the effectiveness and generalisability of the DL-based approach for diagnosing myocardial perfusion abnormalities, presenting a promising tool for improving cardiovascular diagnosis and patient care.
Apostolopoulos et al. [29] acquired Polar Maps under stress, and rest conditions were used to diagnose CAD by employing the pretrained VGG16 model. The research involved 216 participants, and both attenuation correction (AC) and non-attenuation correction (NAC) Polar Map images were merged into a single image per patient. With reference to the findings from invasive coronary angiography, the VGG16 model achieved an accuracy of 74.53%, a sensitivity of 75.00%, and a specificity of 73.43%. In comparison, experienced nuclear medicine physicians’ interpretations of the MPI yielded an accuracy of 75.00%, a sensitivity of 76.97%, and a specificity of 70.31%. The accuracy of a semi-quantitative polar map analysis using AC and NAC techniques was comparatively lower at 66.20% and 64.81%, respectively. Additionally, the VGG16 model demonstrated a robustness to variations in image acquisition devices. These results suggest the potential of the DL-based approach for CAD diagnosis, showing comparable performances to experienced physicians’ interpretations and outperforming the traditional semi-quantitative methods.
The same author team extended their study [30] by presenting a hybrid CNN–Random Forest approach proposed for classifying Polar Map images and clinical attributes into normal and abnormal classes, with ICA findings as the reference for CAD disease. The research involved 566 patient cases. The InceptionV3 pretrained model was used to predict the class of the input Polar Maps. The model’s output was combined with 22 clinical factors, including gender and age, and fed into the Random Forest classifier for outcome prediction. With reference to the ICA results, the model achieved an accuracy of 78.44%, sensitivity of 77.36%, and specificity of 79.25%.
Interestingly, the overall accuracy of the human cognitive process reached 79.15%, approximately 1% higher than the automatic model’s accuracy (78.43%). Furthermore, the overall agreement rating between the human experts and the model was 86% (Cohen’s Kappa = 72.24), indicating a strong level of agreement. The model was also tested on unseen data from a different SPECT scanner and achieved consistent results with an accuracy of 76.53%. These findings demonstrated the effectiveness of the hybrid approach for CAD diagnosis and its potential for practical clinical use.
Trung et al. [31] utilised polar maps and SPECT slices as the input data. The dataset consisted of 1413 heart SPECT images, which a nuclear expert labelled as either CAD or non-CAD. The performance of the CNN network, specifically using the VGG-16 architecture, was evaluated using a five-fold cross-validation procedure. The results revealed that SPECT images provided a better diagnosis than polar maps. The precision achieved using SPECT images was 86.14 ± 2.14%, while polar maps achieved a precision of 82.57 ± 2.33%. These findings demonstrated the potential superiority of SPECT images over polar maps in CAD diagnosis using the proposed CNN model.
2. Materials and Methods
2.1. Attention-Based Feature-Fusion VGG19
This section presents the major components of the Attention-based Feature-Fusion VGG19 (AFF-VGG19), which can be summarised as follows:
- Baseline VGG19 [32] network.
- Feature-fusion blocks [33,34].
- Attention modules [35,36,37].
2.1.1. Baseline VGG Network
VGG19 is a deep neural network architecture that researchers developed from the Visual Geometry Group (VGG) at the University of Oxford in 2014 [32].
The VGG19 architecture is a deep convolutional neural network with 19 layers, hence the name VGG19. The VGG19 architecture has 19 layers, including 16 convolutional layers and 3 fully connected layers. The first 13 layers are convolutional, and the remaining 6 are fully connected. The convolutional layers have a fixed kernel size of 3 × 3, and they use a stride of 1 and 0 padding to keep the spatial resolution of the feature maps the same. The max-pooling layers have a fixed kernel size of 2x2 and a stride of 2, which reduces the spatial resolution by half.
The VGG19 architecture has been used for many image recognition and classification tasks, including object recognition, scene classification, and image segmentation. It has achieved state-of-the-art performances on several benchmark datasets, including the ImageNet Large Scale Visual Recognition Challenge (ILSVRC) [38] and the CIFAR-10 [39] and CIFAR-100 [40] datasets.
When fine-tuning with the VGG19 architecture, the first few convolutional layers are typically frozen, while the later ones are fine-tuned. The intuition behind this approach is that the earlier layers learn lower-level features that are more general. In contrast, the later layers learn higher-level features that are more specific to the task.
The present study employs VGG19 and allows for domain adaption via retraining some of the model’s layers. In this way, the model retains sound feature-extracting knowledge from the ImageNet database domain and can extract powerful low-level features common in every image domain. Higher medical-specific features are expected to be mined by the deep convolutional layers of the network, which are trainable. With this conception, the total trainable parameters of the network are approximately 5 million.
2.1.2. Feature-Fusion Modification
Feature-fusion [34] is a technique used in CNNs to combine features learned from different layers or branches of the network. The goal is to improve the network’s performance by taking advantage of complementary information learned at different stages of the network.
Technically, feature-fusion is implemented by concatenating or adding the feature maps from different layers or branches of the network. The resulting feature maps are then passed through a nonlinear activation function and used as the input to the next network layer. The choice of fusion operation (concatenation or addition) and the specific layers to be fused can be designed based on the problem being solved.
Figure 1 illustrates the feature-fusion blocks connected to the final three max-pooling layers of the baseline VGG19. A feature-fusion block tracks the output of the max-pooling layer, performs a batch normalisation and a random 50% dropout, and connects the product directly to the concatenation layer.
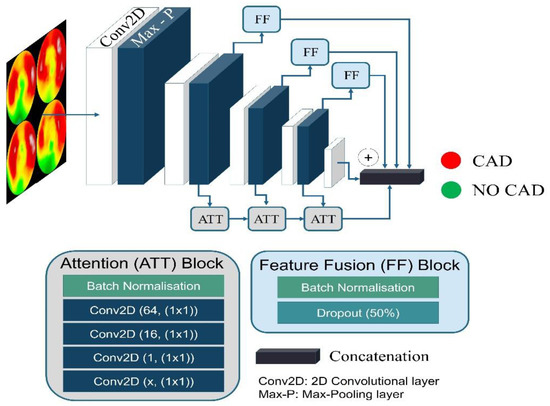
Figure 1.
Attention-based Feature-Fusion VGG19 architecture.
The concatenation layer consists of two components: (i) the global average pooling layer and (ii) the densely connected layer, which flattens the extracted features.
In this way, the low-level features are retained and not refiltered due to the hierarchical nature of the VGG19 network.
2.1.3. Attention Module
The attention module [37] is a critical component of CNNs that has gained widespread popularity recently, particularly in natural language processing (NLP). The attention mechanism is designed to help the network focus on the most relevant parts of the input data when making predictions. The attention mechanism is a method for selectively focusing on different parts of the input data when making predictions. In CNNs, this is typically accomplished by assigning weights to different regions of the input data. These weights are then used to compute a weighted sum of the input features, which is used to make the final prediction.
There are several ways to implement the attention mechanism in CNNs. One common approach is to use a soft attention mechanism, which involves computing a set of attention weights for each input feature. These attention weights are typically computed using a neural network, which takes the input feature and outputs a scalar value between 0 and 1 representing the attention weight.
Once the attention weights have been computed, they compute a weighted sum of the input features. The weights are applied to the input features using element-wise multiplication, and the resulting products are summed to produce the final output.
The attention module of the proposed network is presented in Figure 1. It consists of 4 convolutional blocks. We propose using five-layered attention modules located after the second, third, and fourth convolutional groups and connected to the output of the following max pooling layers. The first layer is a batch normalisation layer. The second, third, fourth, and fifth layers are convolutional operations utilising 64, 16, 1, and x filters of 1 × 1 kernel size. The x number depends on the convolution group to which the attention module belongs. The attention module in the second group has an x of 128. Accordingly, the third and fourth groups have an x of 256 and 512, respectively. The extracted features are multiplied with the output of the convolutional group and connected to the network’s top.
2.1.4. Training Parameters
The following parameters are selected for the specific task. Their selection require fine-tuning, performed before network training and evaluation.
- The dense layer at the top connects each of the neurons from the previous layers and allows the network to extract features from the input data. AF-VGG19 consists of one dense layer of 512 nodes.
- Loss function: The categorical cross-entropy loss function is commonly used in supervised learning tasks with multiple classes. It is used to measure the dissimilarity between the predicted probabilities of a model and the true class labels.
- Optimiser: An optimiser plays a crucial role in training a CNN [9]. It updates the model weights based on the gradients calculated during the forward and backward passes. The present version of our network uses the Adam optimiser.
- Early Stopping: We implemented two early stopping rules. Suppose the validation accuracy reaches 0.91 and does not improve for ten epochs, while the training accuracy remains above 0.91. In that case, the training stops, and the weights of the best epoch are restored.
- Data Augmentation: Data augmentation is an essential training technique, even when a large amount of data are available. Data augmentation aids in overfitting reduction when the model’s performance on the training data is substantially better than on unseen data. Data augmentation creates new data points by transforming existing data points to preserve the original data information. The latter helps improve the model’s generalisation ability and performance on unseen data. As advised by similar studies [27,28,29], slight data augmentations are applied for particular classification tasks. These include slight height and width shifts (by 10 pixels), random rotations (by a maximum of 10 degrees), and Gaussian noise injections.
2.2. Explainability-Enhancing Algorithm
Grad-CAM++ [41] is a visualisation technique for understanding the decision-making process of CNNs. It provides a heatmap highlighting the important regions in an image that the network used to make a prediction. As a result, the way the network is processing the input image and diagnosing any potential issues with the model is better understood.
Grad-CAM++ operates by computing the gradient of the target class with respect to the feature maps in the final convolutional layer of the network. These gradients represent each feature map’s importance in the network’s final decision.
The final step of Grad-CAM++ is to compute a weighted sum of the feature maps using the computed gradients. The result is a heatmap highlighting the important regions in the input image for the network’s prediction. The heatmap can be computed for any target class, providing insight into which regions of the input image the network uses to make its predictions.
2.3. Dataset
Patient data were recorded at the Department of Nuclear Medicine of the University Hospital of Patras from 16 February 2018 to 28 February 2022. Over this period, 2036 consecutive patients underwent gated-SPECT MPI with 99mTc-tetrofosmin. Two-hybrid SPECT/CT gamma camera systems (Varicam, Hawkeye and Infinia, Hawkey-4, GE Healthcare, Chicago, IL, USA) were employed for MPI imaging. Computed tomography-based attenuation correction (AC) was applied to stress and rest images in all subjects. Five hundred and six participants were subsequently subjected to ICA within sixty days from MPI for further investigation. Twenty patients were excluded from the dataset due to inconclusive MPI results or missing ICA reports. The final study population included 486 patients (CAD-positive cases refer to 43.82% of the total). Data collection was approved by the ethical committee of the University General Hospital of Patras (Ethical & Research Committee of University Hospital of Patras—protocol number 108/10-3-2022). The study’s retrospective nature waived the requirement to obtain informed consent from the participants. All data-related processes were performed anonymously. All procedures in this study followed the Declaration of Helsinki. Three experienced nuclear medicine physicians provided the diagnostic results of MPI SPECT by inspecting the study retrospectively and, independently, the Polar Maps. Between-reader inconsistencies were resolved by consensus.
Tomographic reconstruction of raw image data on a dedicated workstation (Xeleris 3, GE Healthcare) by the OSEM (ordered subset expectation maximisation) algorithm using two iterations and ten subsets. After reconstruction, a low-pass filter (Butterworth, with power of ten and a cut-off value of 0.40 for stress and 0.45 for rest images) was applied. Apart from 3-plane tomographic slices (in short, vertically long and horizontally long axes), the software automatically created polar maps. A polar map is an image that summarises the results of 3D tomographic slices into a single 2D circular presentation. Polar maps were extracted from the workstation in DICOM (Digital Imaging and Communications in Medicine) format for further processing.
2.4. Image Preprocessing
Image preprocessing is an essential step in medical image analysis. To process the extracted DICOM images, reading them into memory and applying some initial transformations were necessary. One such transformation was the application of colour maps (Figure 2). Colour maps are used to convert a grayscale image into a colour image. This can help visualise the different structures in the image, such as bones and soft tissue, with different colours. This can be particularly useful in medical imaging, where it is vital to identify and differentiate different structures. We used a library such as Matplotlib to apply a colour map, which provided several colour maps.
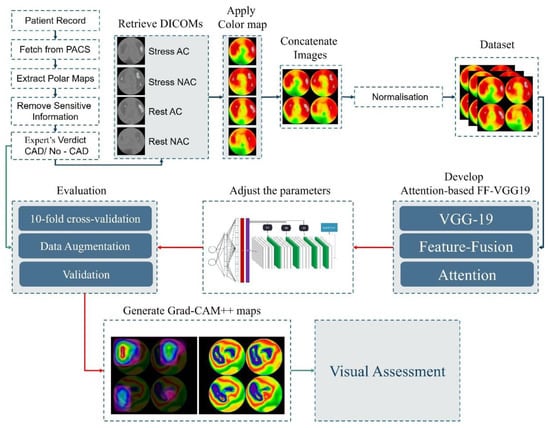
Figure 2.
Experiment design.
For each patient, we extracted four Polar Maps as follows:
- Polar map (with attenuation correction) in rest conditions.
- Polar map (with attenuation correction) in stress conditions.
- Polar map (without attenuation correction) in rest conditions.
- Polar map (without attenuation correction) in stress conditions.
The four Polar Maps were merged into a single image (Figure 2) in JPEG format for feeding AFF-VGG19.
Once the image was transformed with a colour map, it could be converted into a numerical array. This allowed us to perform numerical operations on the image, such as filtering, segmentation, and registration. Normalisation is a common preprocessing step that helps ensure that image data are in a consistent range. This can be particularly important for DL models, which are sensitive to the scale of the input data. Normalisation can be performed by dividing the image values by the maximum value or by subtracting the mean and dividing by the standard deviation.
2.5. Experiment Design
Figure 2 illustrates the experiment pipeline.
The experiments were performed using a workstation of the following properties: 11th Gen Intel® Core™ i9-11900KF @3.50GHz processor, equipped with an NVIDIA GeForce RTX 3080 Ti GPU and a 64-GB RAM for a 64-bit operating system. The Python 3.9 libraries TensorFlow 2.9.0 and Sklearn 1.0.2 were used.
The assessment of the models was done under a 10-fold cross-validation scheme. During each fold, the accuracy, sensitivity (or recall), specificity, positive predictive value (PPV) or precision, negative predictive value (NPV), false-positive rate (FPR), and F-1 score of the run were derived from the recorded true positives (TP), false positives (FP), true negatives (TN), and false negatives (FN) of each class. We used the following formulas to compute the metrics:
3. Results
3.1. Assessing the Agreement between the Model and the Human Expert
The model was trained using the nuclear medicine expert diagnostic yield as a reference. Therefore, the model was trained to mimic how the human reader reads and interprets the image. As a result, this experiment measured the agreement between the expert and the model and was irrelevant to the presence of CAD. The model strongly agreed with the expert (0.8992 accuracy, Table 1). The model exhibited 198 true-positive cases, 239 true-negative cases, 34 false positives, and 15 false negatives. The high F-1 score indicated no subjective class-related biases in the model.

Table 1.
AFF-VGG19 and human expert diagnostic efficiency.
3.2. Assessing the Model’s Robustness in CAD Diagnosis Based on ICA Findings
AFF-VGG19 was retrained using the ICA findings as the reference. Therefore, the model aimed to identify the presence of significant ischemic vessels related to CAD. The reader should note that the MPI test was an inherently weak predictor for CAD and often exhibited false-positive and false-negative findings [28,29,30,42].
The model attained a slightly better accuracy (0.7888) than the human expert (0.7840). The human expert was more biased towards the CAD class, exhibiting 96 false-positive cases, much higher than the model (76). As a result, the human expert had higher sensitivity (0.9577 versus 0.8732) and lower specificity (0.6484 versus 0.7216) rates. It is worth noticing that the human reader yielded a slightly higher F-1 score (0.7953 versus 0.7832) (Figure 3).
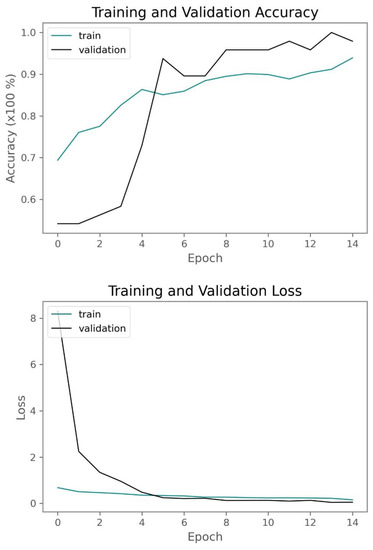
Figure 3.
Training and validation accuracy and loss of AFF-VGG19 when trained with the ICA findings as reference.
In conclusion, the results demonstrated an acceptable agreement rate between the model and the expert and similar diagnostic strength when evaluated based on the ICA findings. The model was less subjective, i.e., less biased towards the CAD class. This was an expected behaviour, because the human reader may overestimate ambiguous cases and suggest a patient undergo an invasive test (ICA) that serves as both a diagnostic examination and a remedy.
3.3. Comparison with Other VGG Approaches
The efficiency of AFF-VGG19 has also been assessed against other VGG approaches. More specifically, we employed the baseline VGG16 and VGG19 models, the Feature-Fusion VGG19 model [10], and an attention-based VGG19 model containing only the described attention module. AFF-VGG19 was superior to the other approaches. It improved the diagnostic accuracy of the baseline VGG19 by 9% (Table 2) and was better than the baseline FF-VGG19 (0.7881 accuracy versus 0.7119). These results highlighted that the feature-fusion and attention modules work well in cooperation and improve the performance.
Table 2.
Performance metrics of VGG approaches with reference to ICA findings.
3.4. Comparison with Pretrained State-of-the-Art
The selection of the VGG19 network as the baseline for integrating the feature-fusion block and the attention module was based on the recent literature [17,29] and the experiments provided in Table 3. Several baseline state-of-the-art pretrained models were trained using the ICA findings to determine the best-performing one.
Table 3.
Performance metrics of CNN approaches with reference to ICA findings.
VGG16, VGG19, Xception, and EfficientNetB6 provided the top four accuracies. The minor differences in the accuracy of the four best models were not investigated for statistical significance. Instead, the most uniform network was chosen (VGG).
3.5. Comparison with the Literature
Table 4 presents the related literature employing Polar Map images and DL methods for diagnosing CAD or measuring the agreement with human readers.
Table 4.
Performance metrics of the literature approaches.
The results of the study were consistent with the literature. There were studies reporting a similar or higher diagnostic efficiency. This discrepancy was caused by training data variations related to scale and class distribution.
3.6. Visual Assessment
Grad-CAM++ was implemented to visualise important areas on the Polar Maps, as suggested by the AFF-VGG19 network. The nuclear medicine specialists of the authors group performed a visual assessment regarding the highlighted areas on the Polar Maps.
Based on the visual inspection, the model was reassessed. Figure 4 illustrates a sample of true-positive findings. Figure 5 illustrates true-negative, false-positive, and false-negative samples.
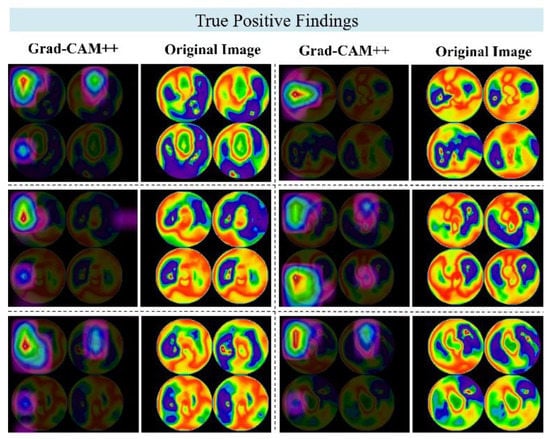
Figure 4.
Grad-CAM++ examples of true-positive findings. Each row represents a different patient case, and each image pair represents the original image (right) and the Grad-CAM++ map (right).
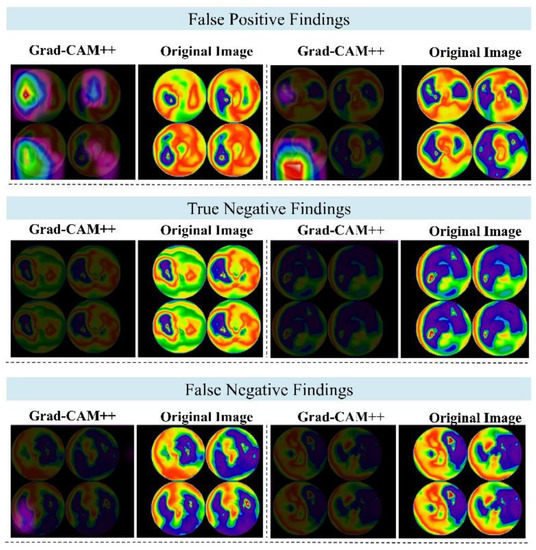
Figure 5.
Grad-CAM++ examples of false-positive, true-negative, and false-negative findings. Each row represents a different patient case, and each image pair represents the original image (right) and the Grad-CAM++ map (right).
The model revealed and highlighted important segments of the Polar Maps correctly. The suggested regions were relevant to the evidence of artery stenosis but of a greater spatial extent than the extent of the positive findings. Also, some maps were quite vague about the exact locations they dictated in the images and were considered incorrect. The inspection of 100 Polar Maps and the suggested regions of interest (the produced Grad-CAM++ heat maps) indicated a slight performance decrease, as Table 5 suggests.
Table 5.
Results of the examination of the produced Grad-CAM++ heatmaps. An asterisk (*) indicates that, though the image classification yielded a false positive, the produced heatmap correctly pointed to the location of interest.
The 100 samples included 45 TP cases, 35 TN cases, 12 FP cases, and 8 FN cases. These metrics corresponded to a 0.8 accuracy in CAD identification. Of the 45 TP cases, 43 had meaningful suggested regions, 1 had an ambiguous region (too large), and 1 had an irrelevant suggested region.
Of the 35 TN cases, 34 generated a meaningful heat map, and 1 an ambiguous (too large area). For the 12 FP cases, 4 heat maps located the suspected artery correctly, but the classification was wrong. In addition, eight of the twelve irrelevant suggestions were in the right locations, but the suggested class was not expected. The eight FN cases did not contain any highlighted areas. Therefore, these cases were considered to be irrelevant. Considering the number of meaningful explanations, the model’s accuracy reached 77%, 3% less than the obtained accuracy without inspecting the suggested areas.
4. Discussion
DL can substantially contribute to medical image processing and medical image analysis for diagnostic purposes. In the case of CAD, the significance of DL in the analysis of MPI SPECT scans and MPI SPECT Polar Maps is already highlighted [13,17,22,26,29,30].
In this study, we proposed an advanced deep learning (DL) methodology that incorporated feature-fusion and attention modules to enhance the localisation abilities of the baseline VGG19 network. Additionally, we implemented the Grad-CAM++ algorithm to enable a visual assessment of the regions where VGG19 focused on its most critical features.
We initiated our discussion by examining the agreement between AFF-VGG19 and the medical experts. We trained the model using the human reader’s diagnostic yield as a reference to achieve this. The results demonstrated a high level of agreement, with an impressive 89.92% alignment between the model’s predictions and the classifications assigned by the human reader to the images. This finding underscored the model’s capacity to capture relevant features and make clinically meaningful predictions, providing valuable insights for medical practitioners.
Furthermore, we performed training and assessment using the ICA findings as a reference, simulating real-world diagnostic scenarios. AFF-VGG19 displayed a robust diagnostic strength, boasting an accuracy of 0.78881, closely mirroring the performance of the human expert (0.7840). Notably, the model exhibited more balanced sensitivity (0.8732) and specificity (0.7216) rates, outperforming the human expert in this regard (0.9577 and 0.6484, respectively). Human readers, particularly nuclear medicine physicians, may exhibit bias towards the positive class of CAD due to several reasons. First, they may encounter cases with ambiguous diagnostic test results, where the findings are not definitive, leading them to err on the side of caution and lean towards diagnosing CAD to avoid missing potential cases, even if the evidence is inconclusive. Second, there may be a preference for false-positive results, because they allow for follow-up with invasive procedures like invasive coronary angiography (ICA) to confirm the presence of CAD. Missing CAD cases (false negatives) can be risky for patients, and this preference for false positives may contribute to the bias towards the CAD class.
Additionally, the bias can be related to the dataset used, as nuclear medicine physicians typically select symptomatic patients for SPECT/MPI testing in clinical practice. As a result, the dataset used for training and validation may have a higher proportion of patients with CAD, reflecting the real-world scenario where doctors encounter more patients with cardiac symptoms. To mitigate the impact of bias, training the machine learning model on a balanced dataset during the training and validation phases is essential. A balanced dataset allows the model to handle both positive and negative cases effectively without becoming skewed towards the majority class. Nevertheless, despite using a balanced dataset, the model may still face challenges in real-world scenarios due to inherent biases in data collection and human decision-making. Therefore, evaluating the model on diverse and unbiased datasets is crucial to ensure its generalisability and reliability. Moreover, raising awareness among human experts about potential biases and encouraging them to be mindful of their decision-making process can contribute to the improved performance and fairness of AI models in real-world applications.
These results indicate that AFF-VGG19 has the potential to be a valuable tool in assisting medical experts in making more reliable and accurate diagnoses.
However, it is essential to consider the interpretability of the model’s predictions. We visually inspected the Grad-CAM++ regions to gain insights into the decision-making process of AFF-VGG19. Among the 100 selected samples, the model produced 77 meaningful explanations, offering valuable information on the regions it focused on for classification. While this interpretability was advantageous, it came with a slight trade-off in accuracy, resulting in a marginal decrease of 0.77. We attributed this reduction to the presence of irrelevant region suggestions even when the model correctly classified the image. Therefore, future research may further refine the model’s interpretability while maintaining its diagnostic performance.
Our study contributes to the growing body of research on DL applications in CAD screening. The combination of feature-fusion and attention mechanisms in AFF-VGG19 demonstrates the potential for improving localisation abilities, making it a promising candidate for CAD diagnosis. Moreover, the high level of agreement with medical experts and competitive diagnostic strength compared to human experts indicate that the model could be a valuable asset in clinical practice. The study results are consistent with the literature compared to studies employing similar datasets for the same purpose (Table 4).
However, we acknowledge some limitations in our study. The dataset was collected from a single institution, and future investigations should include multi-centre data to enhance the generalisability. Additionally, addressing the issue of irrelevant region suggestions in the Grad-CAM++ analysis could further enhance the model’s interpretability without compromising the accuracy. Substantial performance improvements may be achieved by experimenting with more sophisticated attention and feature-fusion modules or by substituting the baseline CNN model with more problem-specific approaches, such as the RBG-CNN network [17]. More state-of-the-art pretrained networks can be benchmarked for fine-tuning. However, such experiments would be reasonable, providing that a larger-scale dataset was collected. The study needs to perform external validation to inspect the robustness of the models to acquisition device variations and variations regarding the acquisition parameters. More precise localisation outcomes may also be obtained using alternative post hoc explainability-enhancing methods besides Grad-CAM++. The 17-segment Polar Map can constrain the region of interest for the model and force it to seek important features in reasonable areas. Former studies have suggested this methodology [26]. Finally, the integration of clinical factors is expected to have a significant contribution [30]. Feature selection algorithms can highlight the most vital clinical factors to be combined with the CNN output and provide a more precise diagnosis.
5. Conclusions
In this study, we proposed an innovative and explainable DL method aimed at characterising MPI SPECT Polar Map images in patients with suspected CAD. The cornerstone of our method was an attention-based feature-fusion network (AFF-VGG19) designed to perform accurate diagnoses. To unveil potentially significant regions, we employed the Grad-CAM++ algorithm, contributing to the interpretability of our model. We were pleased to find that AFF-VGG19 demonstrated substantial agreement (89.92%) with medical experts, showcasing its competence in CAD diagnosis. Upon evaluating the model’s performance using the ICA findings as a reference, we observed that AFF-VGG19 achieved strong diagnostic capabilities. Our findings validated the utility of DL methodologies, particularly attention-based networks, in the context of CAD screening. The results aligned with the existing literature and offered promising evidence that such models are likely to play a pivotal role in future CAD diagnosis and screening practices.
Author Contributions
Conceptualisation, I.D.A.; Data curation, N.D.P.; Formal analysis, N.D.P., N.P., E.P. and D.J.A.; Investigation, E.P.; Methodology, I.D.A., N.D.P., N.P. and D.J.A.; Project administration, E.P.; Resources, N.P.; Software, I.D.A.; Supervision, E.P. and D.J.A.; Validation, N.D.P.; Visualisation, N.P.; and Writing—original draft, I.D.A. All authors have read and agreed to the published version of the manuscript.
Funding
This research project was supported by the Hellenic Foundation for Research and Innovation (HFRI) under “2nd Call for HFRI Research Projects to support Faculty Members & Researchers” (Project Number: 3656).
Institutional Review Board Statement
Data collection was approved by the ethical committee of the University General Hospital of Patras (Ethical & Research Committee of University Hospital of Patras—protocol number 108/10-3-2022).
Informed Consent Statement
The retrospective nature of the study waived the requirement to obtain informed consent from the participants.
Data Availability Statement
The data of the study are not publicly available due to ethical reasons. However, they can be communicated upon reasonable request.
Conflicts of Interest
The authors declare no conflict of interest.
References
- Michas, G.; Karvelas, G.; Trikas, A. Cardiovascular disease in Greece; the latest evidence on risk factors. Hell. J. Cardiol. 2019, 60, 271–275. [Google Scholar] [CrossRef] [PubMed]
- Malakar, A.K.; Choudhury, D.; Halder, B.; Paul, P.; Uddin, A.; Chakraborty, S. A Review on Coronary Artery Disease, Its Risk Factors, and Therapeutics. J. Cell. Physiol. 2019, 234, 16812–16823. [Google Scholar] [CrossRef] [PubMed]
- Hajar, R. Risk Factors for Coronary Artery Disease: Historical Perspectives. Heart Views 2017, 18, 109. [Google Scholar] [CrossRef] [PubMed]
- Winzer, E.B.; Woitek, F.; Linke, A. Physical Activity in the Prevention and Treatment of Coronary Artery Disease. J. Am. Heart Assoc. 2018, 7, e007725. [Google Scholar] [CrossRef]
- Takx, R.A.; Blomberg, B.A.; Aidi, H.E.; Habets, J.; de Jong, P.A.; Nagel, E.; Hoffmann, U.; Leiner, T. Diagnostic accuracy of stress myocardial perfusion imaging compared to invasive coronary angiography with fractional flow reserve meta-analysis. Circ. Cardiovasc. Imaging 2015, 8, e002666. [Google Scholar] [CrossRef]
- Canfield, J.; Totary-Jain, H. 40 Years of Percutaneous Coronary Intervention: History and Future Directions. J. Pers. Med. 2018, 8, 33. [Google Scholar] [CrossRef]
- Alexander, J.H.; Smith, P.K. Coronary-Artery Bypass Grafting. N. Engl. J. Med. 2016, 374, 1954–1964. [Google Scholar] [CrossRef]
- Dorbala, S.; Ananthasubramaniam, K.; Armstrong, I.S.; Chareonthaitawee, P.; DePuey, E.G.; Einstein, A.J.; Gropler, R.J.; Holly, T.A.; Mahmarian, J.J.; Park, M.-A.; et al. Single Photon Emission Computed Tomography (SPECT) Myocardial Perfusion Imaging Guidelines: Instrumentation, Acquisition, Processing, and Interpretation. J. Nucl. Cardiol. 2018, 25, 1784–1846. [Google Scholar] [CrossRef]
- Goodfellow, I.; Bengio, Y.; Courville, A. Deep Learning; MIT Press: Cambridge, MA, USA, 2016. [Google Scholar]
- Apostolopoulos, I.D.; Papathanasiou, N.D. Classification of lung nodule malignancy in computed tomography imaging utilising generative adversarial networks and semi-supervised transfer learning. Biocybern. Biomed. Eng. 2021, 41, 1243–1257. [Google Scholar] [CrossRef]
- Apostolopoulos, I.D.; Papathanasiou, N.D.; Apostolopoulos, D.J. A Deep Learning Methodology for the Detection of Abnormal Parathyroid Glands via Scintigraphy with 99mTc-Sestamibi. Diseases 2022, 10, 56. [Google Scholar] [CrossRef]
- Otaki, Y.; Singh, A.; Kavanagh, P.; Miller, R.J.H.; Parekh, T.; Tamarappoo, B.K.; Sharir, T.; Einstein, A.J.; Fish, M.B.; Ruddy, T.D.; et al. Clinical Deployment of Explainable Artificial Intelligence of SPECT for Diagnosis of Coronary Artery Disease. JACC Cardiovasc. Imaging 2022, 15, 1091–1102. [Google Scholar] [CrossRef]
- Papandrianos, N.; Papageorgiou, E. Automatic Diagnosis of Coronary Artery Disease in SPECT Myocardial Perfusion Imaging Employing Deep Learning. Appl. Sci. 2021, 11, 6362. [Google Scholar] [CrossRef]
- Cheng, J.-Z.; Ni, D.; Chou, Y.-H.; Qin, J.; Tiu, C.-M.; Chang, Y.-C.; Huang, C.-S.; Shen, D.; Chen, C.-M. Computer-Aided Diagnosis with Deep Learning Architecture: Applications to Breast Lesions in US Images and Pulmonary Nodules in CT Scans. Sci. Rep. 2016, 6, 24454. [Google Scholar] [CrossRef]
- Papandrianos, N.; Feleki, A.; Papageorgiou, E. Exploring Classification of SPECT MPI Images Applying Convolutional Neural Networks. In Proceedings of the 25th Pan-Hellenic Conference on Informatics; ACM, Volos, Greece, 26 November 2021; pp. 483–489. [Google Scholar]
- Zahiri, N.; Asgari, R.; Razavi-Ratki, S.-K.; Parach, A.-A. Deep Learning Analysis of Polar Maps from SPECT Myocardial Perfusion Imaging for Prediction of Coronary Artery Disease. In Review, 2021. Available online: https://www.researchsquare.com/article/rs-1153347/v1 (accessed on 1 June 2023).
- Papandrianos, N.I.; Apostolopoulos, I.D.; Feleki, A.; Apostolopoulos, D.J.; Papageorgiou, E.I. Deep Learning Exploration for SPECT MPI Polar Map Images Classification in Coronary Artery Disease. Ann. Nucl. Med. 2022, 36, 823–833. [Google Scholar] [CrossRef]
- Betancur, J.; Hu, L.-H.; Commandeur, F.; Sharir, T.; Einstein, A.J.; Fish, M.B.; Ruddy, T.D.; Kaufmann, P.A.; Sinusas, A.J.; Miller, E.J.; et al. Deep Learning Analysis of Upright-Supine High-Efficiency SPECT Myocardial Perfusion Imaging for Prediction of Obstructive Coronary Artery Disease: A Multicenter Study. J. Nucl. Med. 2019, 60, 664–670. [Google Scholar] [CrossRef]
- Betancur, J.; Commandeur, F.; Motlagh, M.; Sharir, T.; Einstein, A.J.; Bokhari, S.; Fish, M.B.; Ruddy, T.D.; Kaufmann, P.; Sinusas, A.J.; et al. Deep learning for prediction of obstructive disease from fast myocardial perfusion SPECT: A multicenter study. JACC Cardiovasc. Imaging 2018, 11, 1654–1663. [Google Scholar] [CrossRef]
- Arvidsson, I.; Overgaard, N.C.; Astrom, K.; Heyden, A.; Figueroa, M.O.; Rose, J.F.; Davidsson, A. Prediction of Obstructive Coronary Artery Disease from Myocardial Perfusion Scintigraphy Using Deep Neural Networks. In Proceedings of the 2020 25th International Conference on Pattern Recognition (ICPR), Milan, Italy, 10 January 2021; IEEE: London, UK, 2021; pp. 4442–4449. [Google Scholar]
- Miller, R.J.H.; Kuronuma, K.; Singh, A.; Otaki, Y.; Hayes, S.; Chareonthaitawee, P.; Kavanagh, P.; Parekh, T.; Tamarappoo, B.K.; Sharir, T.; et al. Explainable Deep Learning Improves Physician Interpretation of Myocardial Perfusion Imaging. J. Nucl. Med. 2022, 63, 1768–1774. [Google Scholar] [CrossRef] [PubMed]
- Otaki, Y.; Tamarappoo, B.; Singh, A.; Sharir, T.; Hu, L.-H.; Gransar, H.; Einstein, A.; Fish, M.; Ruddy, T.; Kaufmann, P.; et al. Diagnostic Accuracy of Deep Learning for Myocardial Perfusion Imaging in Men and Women with a High-Efficiency Parallel-Hole-Collimated Cadmium-Zinc-Telluride Camera: Multicenter Study. J. Nucl. Med. 2020, 61, 92. [Google Scholar]
- Miller, R.J.H.; Singh, A.; Otaki, Y.; Tamarappoo, B.K.; Kavanagh, P.; Parekh, T.; Hu, L.-H.; Gransar, H.; Sharir, T.; Einstein, A.J.; et al. Mitigating Bias in Deep Learning for Diagnosis of Coronary Artery Disease from Myocardial Perfusion SPECT Images. Eur. J. Nucl. Med. Mol. Imaging 2022, 50, 387–397. [Google Scholar] [CrossRef] [PubMed]
- Singh, A.; Miller, R.J.H.; Otaki, Y.; Kavanagh, P.; Hauser, M.T.; Tzolos, E.; Kwiecinski, J.; Van Kriekinge, S.; Wei, C.-C.; Sharir, T.; et al. Direct Risk Assessment From Myocardial Perfusion Imaging Using Explainable Deep Learning. JACC Cardiovasc. Imaging 2022, 16, 209–220. [Google Scholar] [CrossRef]
- Chen, J.-J.; Su, T.-Y.; Chen, W.-S.; Chang, Y.-H.; Lu, H.H.-S. Convolutional Neural Network in the Evaluation of Myocardial Ischemia from CZT SPECT Myocardial Perfusion Imaging: Comparison to Automated Quantification. Appl. Sci. 2021, 11, 514. [Google Scholar] [CrossRef]
- Spier, N.; Nekolla, S.; Rupprecht, C.; Mustafa, M.; Navab, N.; Baust, M. Classification of Polar Maps from Cardiac Perfusion Imaging with Graph-Convolutional Neural Networks. Sci. Rep. 2019, 9, 7569. [Google Scholar] [CrossRef]
- Kaplan Berkaya, S.; Ak Sivrikoz, I.; Gunal, S. Classification Models for SPECT Myocardial Perfusion Imaging. Comput. Biol. Med. 2020, 123, 103893. [Google Scholar] [CrossRef] [PubMed]
- Liu, H.; Wu, J.; Miller, E.J.; Liu, C.; Yaqiang, L.; Liu, Y.-H. Diagnostic Accuracy of Stress-Only Myocardial Perfusion SPECT Improved by Deep Learning. Eur. J. Nucl. Med. Mol. Imaging 2021, 48, 2793–2800. [Google Scholar] [CrossRef] [PubMed]
- Apostolopoulos, I.D.; Papathanasiou, N.D.; Spyridonidis, T.; Apostolopoulos, D.J. Automatic characterisation of myocardial perfusion imaging polar maps employing deep learning and data augmentation. Hell. J. Nucl. Med. 2020, 23, 125–132. [Google Scholar]
- Apostolopoulos, I.D.; Apostolopoulos, D.I.; Spyridonidis, T.I.; Papathanasiou, N.D.; Panayiotakis, G.S. Multi-input deep learning approach for Cardiovascular Disease diagnosis using Myocardial Perfusion Imaging and clinical data. Phys. Med. 2021, 84, 168–177. [Google Scholar] [CrossRef]
- Trung, N.T.; Ha, N.T.; Thuan, N.D.; Minh, D.H. A Deeplearning Method for Diagnosing Coronary Artery Disease Using SPECT Images of Heart. J. Sci. Technol. 2020, 144, 022–027. [Google Scholar]
- Simonyan, K.; Zisserman, A. Very Deep Convolutional Networks for Large-Scale Image Recognition. arXiv 2015, arXiv:1409.1556. [Google Scholar]
- Haq, I.U.; Ali, H.; Wang, H.Y.; Lei, C.; Ali, H. Feature Fusion and Ensemble Learning-Based CNN Model for Mammographic Image Classification. J. King Saud Univ.-Comput. Inf. Sci. 2022, 34, 3310–3318. [Google Scholar] [CrossRef]
- Amin, S.U.; Muhammad, G.; Abdul, W.; Bencherif, M.; Alsulaiman, M. Multi-CNN Feature Fusion for Efficient EEG Classification. In Proceedings of the 2020 IEEE International Conference on Multimedia & Expo Workshops (ICMEW), London, UK, 6–10 July 2020; IEEE: London, UK, 2020; pp. 1–6. [Google Scholar]
- Tian, C.; Xu, Y.; Li, Z.; Zuo, W.; Fei, L.; Liu, H. Attention-Guided CNN for Image Denoising. Neural Netw. 2020, 124, 117–129. [Google Scholar] [CrossRef]
- Mou, L.; Zhu, X.X. Learning to Pay Attention on Spectral Domain: A Spectral Attention Module-Based Convolutional Network for Hyperspectral Image Classification. IEEE Trans. Geosci. Remote Sens. 2020, 58, 110–122. [Google Scholar] [CrossRef]
- Jetley, S.; Lord, N.A.; Lee, N.; Torr, P.H.S. Learn To Pay Attention. arXiv 2018, arXiv:1804.02391. [Google Scholar] [CrossRef]
- Deng, J.; Dong, W.; Socher, R.; Li, L.-J.; Li, K.; Fei-Fei, L. Imagenet: A large-scale hierarchical image database. In Proceedings of the 2009 IEEE Conference on Computer Vision and Pattern Recognition, Miami, FL, USA, 20–25 June 2009; IEEE: London, UK, 2009; pp. 248–255. [Google Scholar]
- Krizhevsky, A.; Nair, V.; Hinton, G. The CIFAR-10 Dataset. 2014, 55. Available online: http://www.cs.toronto.edu/kriz/cifar.Html (accessed on 1 June 2023).
- Krizhevsky, A.; Nair, V.; Hinton, G. CIFAR-100 (Canadian Institute for Advanced Research). Available online: http://www.cs.toronto.edu/kriz/cifar.html (accessed on 1 June 2023).
- Chattopadhyay, A.; Sarkar, A.; Howlader, P.; Balasubramanian, V.N. Grad-CAM++: Improved Visual Explanations for Deep Convolutional Networks. In Proceedings of the 2018 IEEE Winter Conference on Applications of Computer Vision (WACV), Lake Tahoe, NV, USA, 12–15 March 2018; pp. 839–847. [Google Scholar]
- Betancur, J.; Otaki, Y.; Motwani, M.; Fish, M.B.; Lemley, M.; Dey, D.; Gransar, H.; Tamarappoo, B.; Germano, G.; Sharir, T.; et al. Prognostic Value of Combined Clinical and Myocardial Perfusion Imaging Data Using Machine Learning. JACC Cardiovasc. Imaging 2018, 11, 1000–1009. [Google Scholar] [CrossRef] [PubMed]
- Rahmani, R.; Niazi, P.; Naseri, M.; Neishabouri, M.; Farzanefar, S.; Eftekhari, M.; Derakhshan, F.; Mollazadeh, R.; Meysami, A.; Abbasi, M. Precisión diagnóstica mejorada para la imagen de perfusión miocárdica usando redes neuronales artificiales en diferentes variables de entrada incluyendo datos clínicos y de cuantificación. Rev. Esp. Med. Nucl. E Imagen Mol. 2019, 38, 275–279. [Google Scholar] [CrossRef] [PubMed]


Disclaimer/Publisher’s Note: The statements, opinions and data contained in all publications are solely those of the individual author(s) and contributor(s) and not of MDPI and/or the editor(s). MDPI and/or the editor(s) disclaim responsibility for any injury to people or property resulting from any ideas, methods, instructions or products referred to in the content. |
© 2023 by the authors. Licensee MDPI, Basel, Switzerland. This article is an open access article distributed under the terms and conditions of the Creative Commons Attribution (CC BY) license (https://creativecommons.org/licenses/by/4.0/).