Article

Optimization for Asphalt Pavement Maintenance Plans at Network Level: Integrating Maintenance Funds, Pavement Performance, Road Users, and Environment

1
The Key Laboratory of Road and Traffic Engineering, Ministry of Education, Tongji University, 4800 Cao’an Road, Shanghai 201804, China
2
Postdoctoral Station of Mechanical Engineering, Tongji University, Shanghai 201804, China
3
Shandong Provincial Communications Planning and Design Institute, Jinan 250101, China
*
Author to whom correspondence should be addressed.
Appl. Sci. 2023, 13(15), 8842; https://doi.org/10.3390/app13158842
Submission received: 14 June 2023 / Revised: 28 July 2023 / Accepted: 29 July 2023 / Published: 31 July 2023
(This article belongs to the Section Transportation and Future Mobility)

Abstract

:
As an infrastructure project, the cost and benefits of road maintenance should be measured through social costs. In order to fully consider user interests and make road maintenance decisions more reasonable, two types of user costs that may affect road maintenance benefits have been quantified through analysis of existing literature. At the same time, environmental issues have gradually become the focus of various industries, and in optimizing road maintenance decisions, the impact of environmental issues on decision making should also be considered. This article first analyzes and quantifies the user costs that affect the effectiveness of road maintenance. Secondly, based on the concept of sustainable development of roads, the optimization of road maintenance decisions is divided into two steps: the first step is to determine the minimum maintenance budget funds, and the second step is to determine the optimal plan. The specific optimization method is to use the 0-1 mathematical programming method to establish a network-level pavement maintenance decision optimization model based on a quantitative model. The most reasonable maintenance optimization plan is determined from four aspects: maintenance funds, maintenance performance improvement value, user benefit improvement, and reducing environmental impact. Finally, a provincial road network for a case study is selected. The applicability of the new model is verified through a case study. This study can help decision makers deal with asphalt pavement maintenance arrangements at the network level with four decision objectives: maintenance funds, pavement performance, road users, and environmental impacts.

1. Introduction

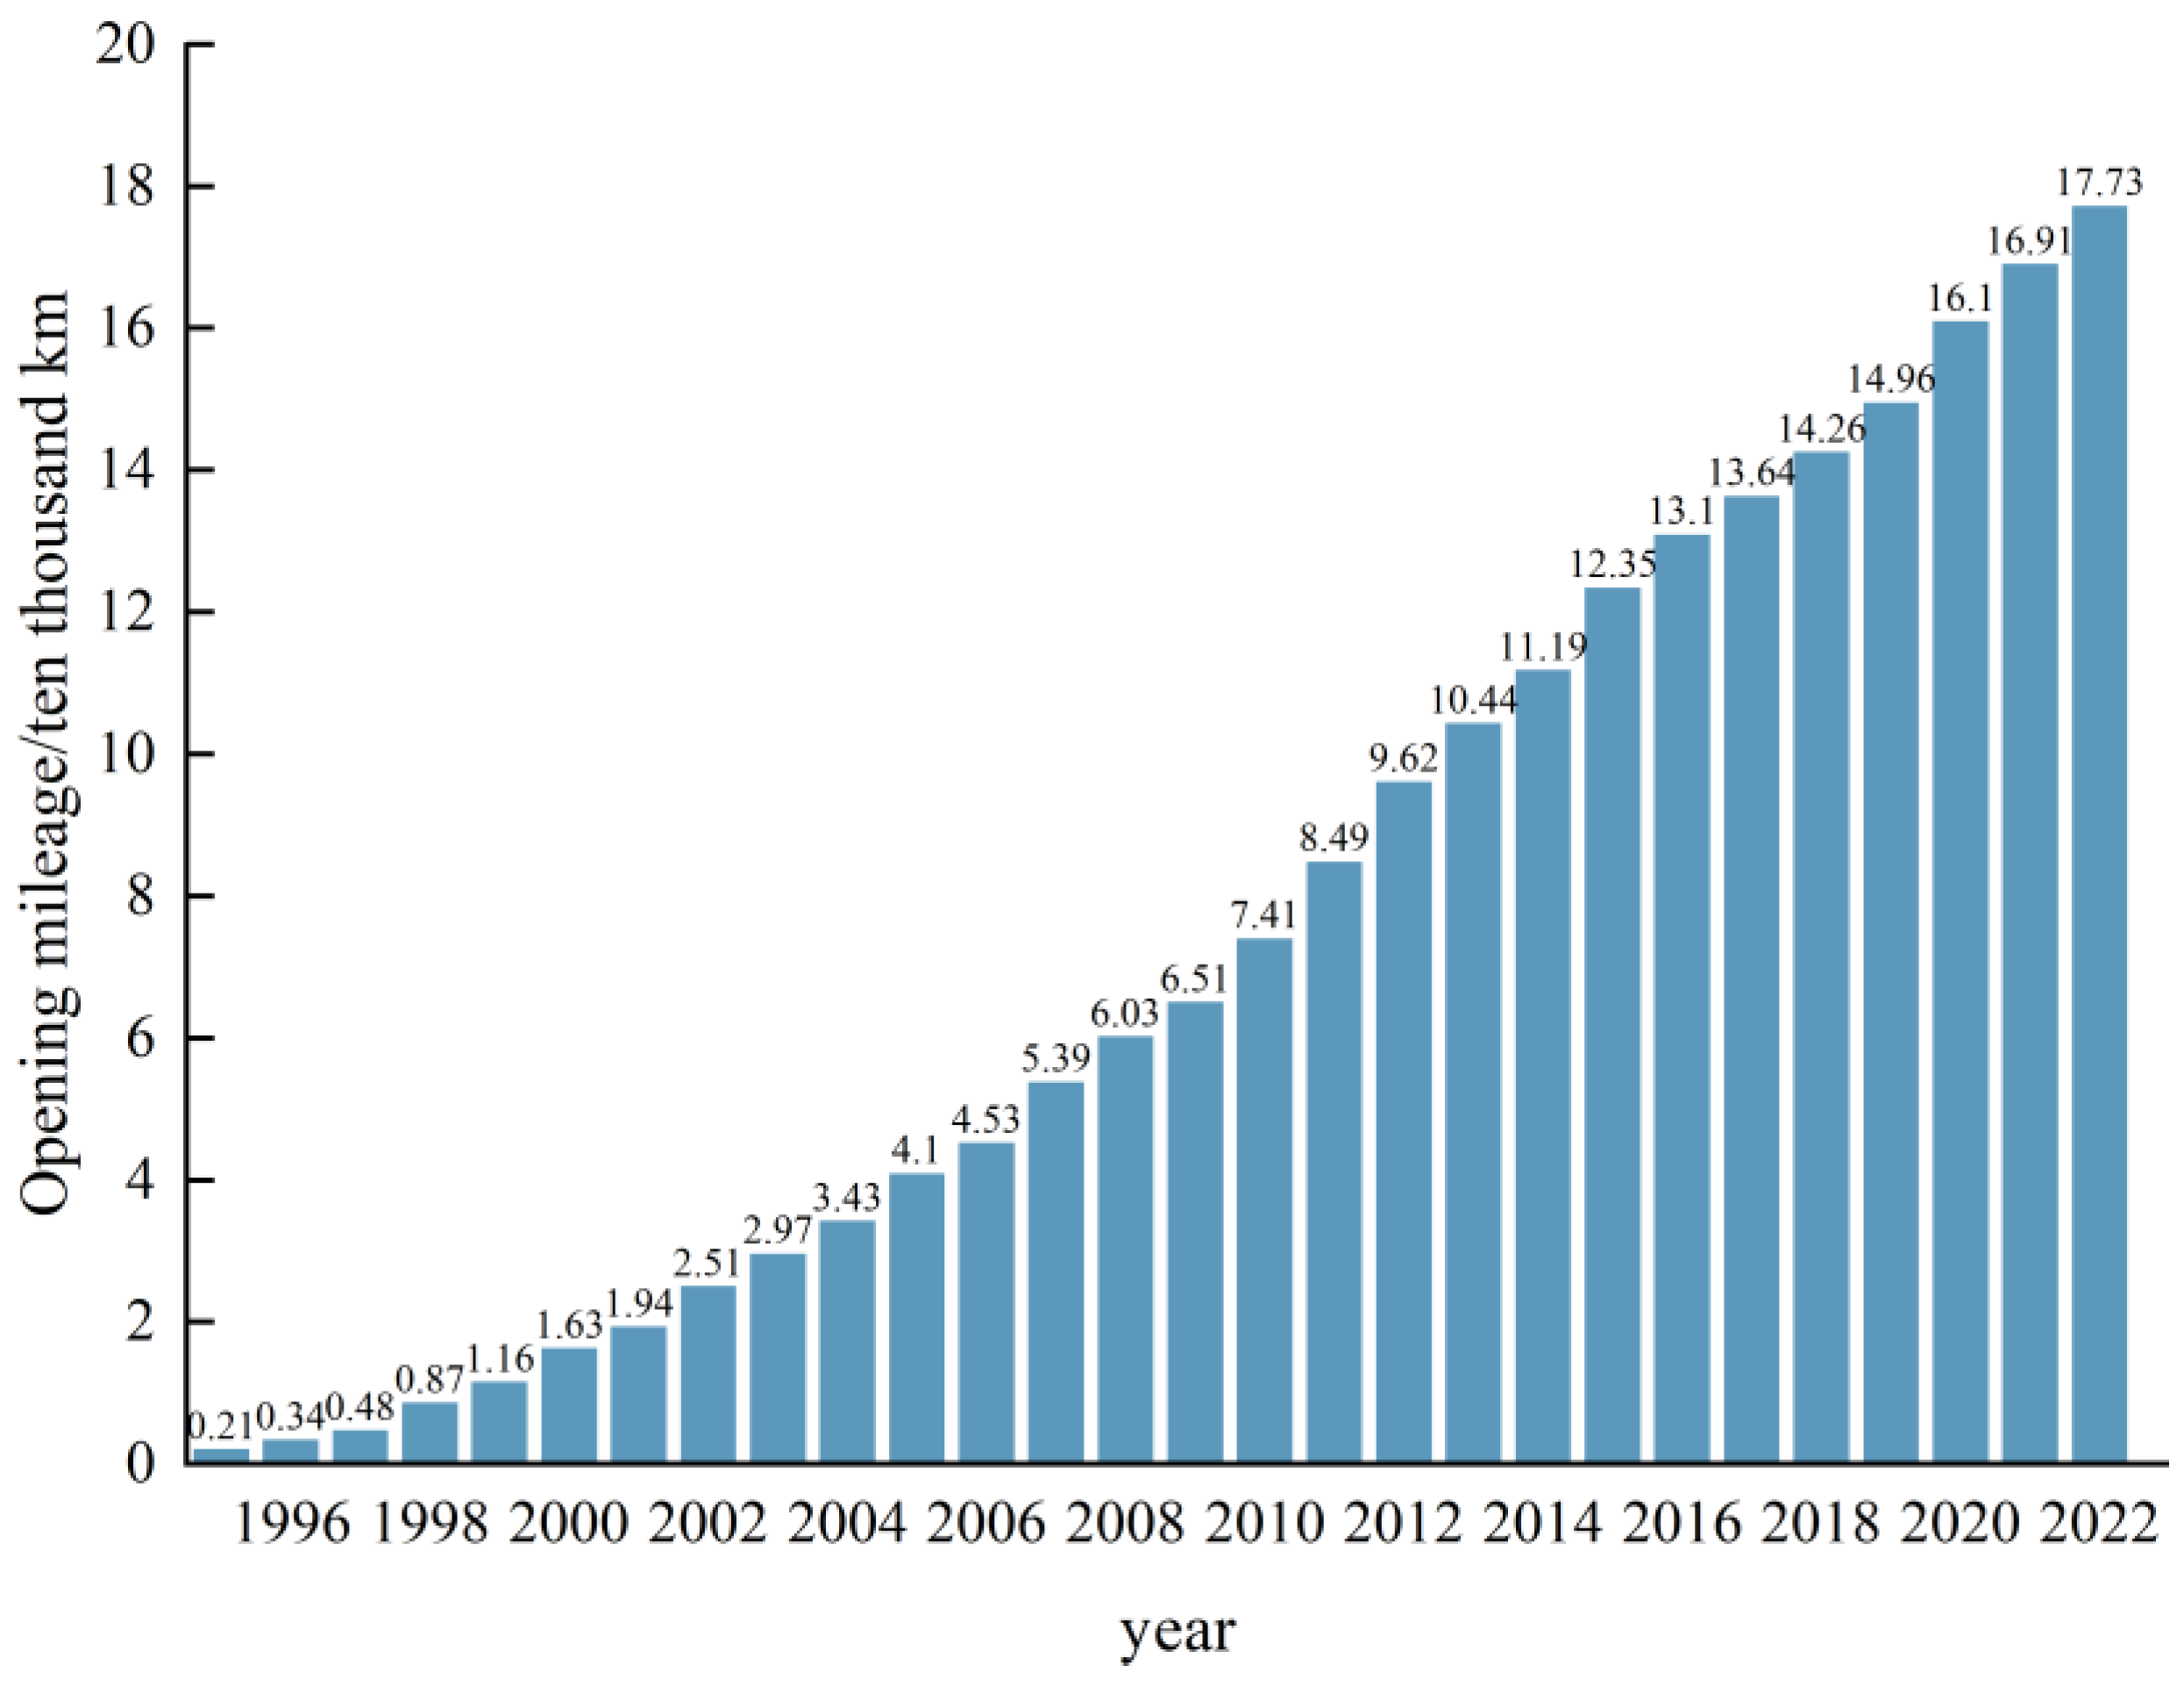
Since its reform and opening up, China has made tremendous achievements in highway construction. According to the Statistical Bulletin on the Development of the Transportation Industry, the development process of high-speed highways in China in recent years is shown in Figure 1.
With the continuous development of the highway industry, under the combined effects of traffic loads and natural environmental factors, the road surface has experienced varying degrees of diseases, and the performance of the road surface has also declined. The maintenance task of the road surface is also becoming increasingly heavy. The focus of China’s highway work has gradually shifted from construction to maintenance and management. On the basis of such a large road network scale, facing such a large number of road mileage, effectively managing, improving the efficiency of maintenance fund utilization, and ensuring the level of road service have become important tasks for China’s highway maintenance and management department.
Unlike project-level road maintenance decisions that aim to maximize the benefits of specific road sections, network-level decision optimization generally focuses on a certain scale of the road network as the research object. Under budget and other resource constraints, it seeks the optimal combination of maintenance strategies and fund allocation schemes to maximize the benefits objectives (such as road performance); alternatively, under certain pavement performance requirements and resource constraints, seeking the optimal maintenance strategy to minimize cost objectives (maintenance costs, user costs, etc.) [1]. With the rapid growth of China’s highway pavement maintenance scale, the contradiction between limited maintenance funds and huge maintenance mileage has become more prominent. How to reasonably allocate funds for each section of the road network has become more difficult. Meanwhile, due to the long-term period of reconstruction and light maintenance, the investment in maintenance funds is relatively small. The occurrence of road surface diseases mostly relies on the experience of on-site construction personnel. However, due to a lack of maintenance funds and unscientific maintenance decisions, some road sections that require maintenance have not received timely maintenance and repair, resulting in accelerated degradation of road performance [2].
Currently, the main decision-making methods for network-level pavement maintenance are the sorting method and the optimization method. In the research of pavement maintenance decision making based on the sorting method, most scholars construct project or road section value functions by comprehensively considering various factors that affect decision making, or use methods such as the Analytic Hierarchy Process, Cluster Analysis, Matter Element Model, and Benefit Cost Analysis to rank the importance of projects and select projects based on priority [3,4,5]. However, decision-making methods based on priority ranking often provide the sum of a set of project decisions, and decision makers cannot consider trade-offs between projects when selecting projects. Optimization rules can simultaneously consider the maintenance plan and maintenance time of each section of the road network to obtain a better maintenance plan. Many achievements have been made in the research of pavement maintenance decision making based on the optimization method at home and abroad. Zhang et al. [6] established a multi-objective optimization model of pavement maintenance based on Dynamic programming with the objective of minimizing the cost of pavement maintenance and greenhouse gas emissions as the optimization goal; Elhaddy et al. [7] established a multi-objective pavement maintenance optimization model based on a genetic algorithm with the goal of minimizing maintenance costs and maximizing pavement performance; Bryce et al. [8] proposed a multi-objective optimization-based road maintenance analysis and decision-making method, and used this method to balance maintenance costs, road conditions, and energy consumption; Peng et al. [1] proposed a project two-layer network-level pavement maintenance decision-making optimization model consisting of a multiyear fund allocation model and a project selection model with the goal of maintenance efficiency; Xie [9] established a multi-objective decision model for pavement maintenance with the minimum maintenance cost and maximum maintenance benefit as the maintenance goal under the financial constraints; Mao [10] constructed a two-layer optimization model for network-level road surface decision making, with the maximum sum of vehicle travel cost savings and traffic revenue increase, and the minimum generalized cost of vehicle travel as the upper and lower objectives, respectively; Feng [2] established a multi-objective network-level pavement maintenance decision optimization model under both deterministic and uncertain conditions, with the goal of achieving the average pavement performance and the percentage of road length that meets a certain pavement performance index threshold. In summary, existing research mostly establishes decision optimization models from the perspective of operating units, with objective functions mostly targeting maintenance costs, road network performance, investment benefit ratio, etc., and less considering optimization of user costs and the environmental impact of maintenance. There is a lack of comprehensive consideration of maintenance costs, road network performance, user costs, and the environmental impact of maintenance.
In summary, based on the review of the existing literature, this article first analyzes and quantifies the user costs that affect the effectiveness of road maintenance. Secondly, through the concept of sustainable development of roads, the optimization of road maintenance decision making is divided into two steps: the first step is to determine the minimum maintenance budget funds, and the second step is to determine the optimal plan. The specific optimization method adopts the 0-1 mathematical programming method, establishes a network-level pavement maintenance decision optimization model based on a quantitative model, and identifies the most reasonable maintenance optimization plan among the four aspects of maintenance funds, maintenance performance improvement value, user benefit improvement, and environmental impact reduction. Finally, a road network in a province is selected for the case study. This study can help decision makers consider the diversity of practical problems from the perspectives of managers, users, and the environment, and make road maintenance decisions from a more reasonable perspective as China is about to enter a new era of “focusing on maintenance”.

2. Theoretical Basis

2.1. Performance Evaluation Indicators for Asphalt Pavement

According to the Highway Technology Evaluation Standard [11], the evaluation indicators for road surface technical conditions are mainly divided into two categories: single indicators and comprehensive indicators. Among them, single indicators include road surface damage, smoothness, skid resistance, and structural strength. The comprehensive evaluation indicators are established on the basis of each single evaluation indicator and are calculated by assigning a certain weight to each indicator and adding them together. The relationship between various pavement performance indicators and evaluation indicators is analyzed, as shown in Figure 2.
According to Figure 2, the specific evaluation indicators for each individual indicator are PCI (pavement damage), RQI (smoothness), PSSI (structural strength), and SRI (slip resistance coefficient). To comprehensively reflect the relationship between pavement performance and each individual indicator, the pavement performance index PQI is used to comprehensively evaluate pavement performance. The sum of the weighted values of each individual indicator is used as the result of the pavement performance index PQI, and the specific calculation formula is as follows [12].
P Q I = w P C I P C I + w R Q I R Q I + w S R I S R I + w P S S I P S S I
The weight w of each indicator is not fixed, depending on the actual road conditions and different maintenance strategies. This can be appropriately adjusted within the scope of recommendation given in technical specifications, but four parameters of 0.35, 0.35, 0.1, and 0.2, respectively, are generally recommended.
Pavement condition index (PCI)
The damage condition of the pavement structure reflects the degree to which the pavement structure remains intact or intact under the influence of driving and natural factors. The pavement condition index reflects the structural performance of the road surface. In the current “Highway Technical Condition Evaluation Standard” (JTG H20-2007), the pavement damage condition index PCI is used to represent it, and the calculation formula is [13]:
P C I = 100 i = 1 n j = 1 m i D P i j W i j
where
  • i , j —counters for distress types and severity levels, respectively;
  • n —the total number of observed distress types;
  • m i —the number of severity levels for the distress type i ;
  • D P i j —the deducted value that varies with distress type i and severity j ;
  • W i j —an adjustment weight when the pavement with distress type i reaches the severity level m .
Ride quality index (RQI)
Driving comfort is the most direct reflection of road service level and also the subjective feeling of road users towards the public service level. The driving comfort index is one of the important evaluation indicators for road maintenance quality, which is mainly affected by road smoothness. The current “Highway Performance Evaluation Standard“ (JTG H20-2007) [11] uses the ride quality index (RQI) for evaluation, and the international roughness index (IRI) is measured using a continuous roughness meter. The ride quality index is calculated according to Formula (3):
R Q I = 100 1 + a 0 e ( a 1 I R I )
where a 0 ,   a 1 model parameters, using 0.026 and 0.65, respectively.
Skid resistance index (SRI)
Anti-slip performance is one of the important indicators reflecting road safety performance. At high speeds, the decrease in anti-slip performance leads to a decrease in the braking capacity of the car, resulting in accidents. Anti-slip performance is adopted based on the lateral force coefficient (SFC) for evaluation, and is calculated according to Equation (4):
S R I = 100 S R I min 1 + a 0 e ( a 1 S F C ) + S R I min
where S R I m i n —calibrate parameters using 35.0.
a0, a1—model parameters, using 28.6 and −0.105, respectively.
Pavement structure strength index (PSSI)
The bearing capacity of a pavement structure refers to the number of vehicle loads it can withstand in the event of damage to the pavement. It can be used to determine the remaining lifespan of the road surface. The pavement structure strength index (PSSI) for pavement structure strength evaluation is calculated according to Equation (5):
P S S I = 100 1 + 15.71 e 5.19 S S I SSI = l d / l 0
where
  • SSI—strength coefficient of pavement structure, which is the ratio of the designed deflection value of the pavement to the measured representative deflection value;
  • l d pavement design deflection (mm);
  • l 0 measured representative deflection (mm);
  • a0, a1—model parameters, using 15.71 and −5.19, respectively.

2.2. Optimization of Pavement Performance Evaluation Method

The evaluation of road performance includes multiple indicators such as RQI, PSSI, PCI, and SRI and is a comprehensive evaluation system. The PQI can reflect the comprehensive maintenance situation of the road, but when making specific maintenance plans, it is necessary to consider the performance advantages and disadvantages of each individual item. Therefore, using the PQI alone to develop specific maintenance measures is not very targeted. This requires combining several individual indicators of pavement performance for analysis, which leads to a new concept—the combined state of pavement performance, which is graded and conducive to the optimization of maintenance decisions in the future.
The current regulations in our country classify four indicators, including the RQI, PCI, SRI, and PSSI, into five levels: excellent, good, medium, secondary, and poor. Based on the combination of pavement performance states mentioned above, there are 54=625 combination states of pavement performance, each with different maintenance measures, resulting in thousands of possible situations. The scale of decision-making optimization is too large, which is not conducive to solving. Therefore, it is necessary to analyze and study the combination state of road performance, reduce unnecessary combination states, and reduce the decision-making scale. After analyzing the specific state combinations and relevant technical specifications of highways in China, the simplified pavement performance state combinations currently used are shown in Table 1:
After simplification, there are a total of 36 levels and combinations, effectively reducing the size of the combination state and achieving the goal of simplifying decision making. In order to facilitate game analysis of combination states, we introduce the decision tree method for auxiliary decision analysis. Among the four indicators of the RQI, PSSI, PCI, and SRI, the PSSI holds the most important position. If the structural strength does not meet the requirements, it is necessary to forcibly adopt major repair and reinforcement measures to repair the road surface. The road surface anti-slip index SRI has the second priority, and when the road surface meets the structural strength, we need to consider whether the anti-slip performance of the road surface meets the requirements. The RQI ranks third in priority, and only when both structural and anti-slip performance is met can the impact of the RQI be considered, while the PCI has the lowest priority. In terms of maintenance measures, we divide them into five categories: routine maintenance, paving of the overlay, paving of the anti-skid layer, paving reconstruction, and structural reinforcement. Table 2 shows the maintenance strategies for each combination of conditions. As can be seen in Table 2, only 11 condition combinations are of practical significance for the pavement performance for the maintenance decision optimization problem.

2.3. Estimating User Costs

When making network-level road maintenance decisions, the road maintenance management department always tends to choose low-cost and cost-effective maintenance plans [14]. The National Association of Highways and Transportation Officials (AASHO) defines road maintenance benefits as reducing user-related travel costs through road maintenance, which mainly includes reducing vehicle travel costs and reducing vehicle travel time costs [15], Domestic and foreign scholars’ relevant research also mainly considers these two aspects [4,16,17], and it can be seen that the cost of vehicle travel time and vehicle travel cost have a significant impact on the efficiency of road maintenance. Based on this, this article takes providing convenient and comfortable services to users as the starting point and determines the user costs that affect the efficiency of road maintenance as the cost of vehicle travel time and vehicle travel cost.

2.3.1. Cost Savings in User Travel Time

The user travel time cost is the value that arises due to the existence of an opportunity cost of the time consumed by the vehicle during the trip [18,19]. The savings in user travel time cost after implementing pavement maintenance ΔT can be expressed by Equation [10]:
Δ T = θ Q ( T 0 T 1 )
where
  • θ—the time value coefficient, usually related to the personal income of regional travelers [20].
  • Q—the traffic volume of the road section((pcu/d)).
  • T0—the travel time of a single vehicle before maintenance.
  • T1—the travel time of a single vehicle after maintenance.
The calculation of Equation (6) requires a functional relationship between the user travel time of the road section and the pavement condition. The PCI is then adopted as an indicator of the pavement condition. The functional relationship between v and the PCI can be obtained through tests on a large number of road sections, which is expressed as follows:
T = l v = l 0.82 P C I + 16.5
where l is the section distance (km), v is the vehicle speed (km/h).
Therefore, the savings in user travel time costs after the pavement maintenance can be represented as follows:
Δ T = Q θ ( l v 0 l v 1 ) = Q θ ( l 0.76 P C I 0 + 0.35 l 0.76 P C I 1 + 0.35 )
where P C I 0 represents the PCI value of the road before maintenance and P C I 1 represents the PCI value of the road after maintenance.

2.3.2. Cost Savings in Vehicle Travel Fuel Consumption

Fuel consumption cost refers to energy expenses consumed by the vehicle in the travel process [13,21,22,23]. According to [24], for a minivan, which is selected as the standard vehicle in this study, the relationship between the fuel consumption, the vehicle speed, and the IRI can be expressed by the following equation:
O = 0.22 × V + 0.0013 × V 2 + 0.25 × I R I + 15.37
where O is the fuel consumption L/100 km and V is the vehicle speed. When assuming that the vehicle is traveling at a speed of 80 km/h, the relationship between the fuel consumption and the IRI can be described by the following equation:
O = 0.25 I R I + 15.37
Based on Equation (10), the cost savings in fuel consumption after pavement maintenance can be expressed as
Δ O = 0.25 g ( I R I 0 I R I 1 ) l Q
where
  • g—the fuel price,
  • I R I 0 —the IRI value of the road before maintenance (m/km).
  • I R I 1 —the IRI value of the road after maintenance (m/km).

3. Development of Network-Level Pavement Maintenance Optimization Model

3.1. Basic Hypotheses

To simplify the problem, this article makes the following assumptions when establishing the model:
There is no significant change in traffic volume before and after the implementation of maintenance on the road section.
Do not consider the impact on users during road closure or semi-closure caused by road maintenance construction.
The implementation of the same maintenance measures by each construction unit has the same impact on improving road performance.
Only one maintenance measure will be implemented for each section during the analysis period.
Based on the literature research and analysis [25], the improvement effects of five maintenance measures on the road surface are obtained, as follows:
a.
Routine maintenance cannot improve the level of pavement performance evaluation indicators;
b.
Increase the RQI of the paving of the overlay by one level and PCI by two levels;
c.
Paving of the anti-skid layer to restore the SRI to the optimal level;
d.
Restoration of the RQI and PCI to optimal levels during paving reconstruction;
e.
All indicators of paving reconstruction and structural reinforcement have been restored to the optimal level.

3.2. Development of the Optimization Model

3.2.1. Determining the Minimum Maintenance Budget Funds

In the whole life cycle of a road, we must keep the road performance and service level in a sustainable premise so that the road can provide better service throughout its life cycle. So, we will consider the entire life cycle of the road. The road performance and service level will not decline throughout the life of the road, that is, the decision makers of this year’s road maintenance funds for the budget must refer to the previous year’s road performance and service level so that this year’s maintenance goals are not lower than the value of the same period last year in order to determine the Minimum Budget Funds B.
The problem of minimum maintenance budget funding can be described as:
M i n B t = i = 1 n k = 1 11 j = 1 5 a i , k , j L i D i , k b i , j
The constrains are as follows:
j = 1 5 a i , j , k 1 , i = 1 , 2 , n ; k = 1 , 2 , 11 ; i = 1 n k = 1 11 j = 1 5 a i , k , j L i D i , k C k , j Z t Z t 1 a i , 10 , 1 = a i , 10 , 2 = a i , 10 , 4 = a i , 10 , 5 = 0 , a i , 10 , 3 = 1 a i , 11 , 1 = a i , 11 , 2 = a i , 11 , 3 = a i , 10 , 4 = 0 , a i , 11 , 5 = 1 a i , k , j = { 0 , 1 }
where:
  • B t —the value of the decision objective function, indicating the budgeted funds for road maintenance in year t.
  • a i , k , j —the main decision variable, indicating that if the i-th road is in the k-th combination state of the road section using the j-th maintenance measure, a i , k , j =1, otherwise a i , k , j = 0, (i = 1, 2,..., n; k = 1, 2,..., 11: j = 1, 2, 3, 4, 5)
  • L i —the total mileage of the i-th road in the road network (km).
  • D i , k —the proportion of the i-th road in the road network that is in the k-th road performance combination state.
  • b i , j —the cost per kilometer of the i-th road in the road network to take the j-th maintenance measure (million CNY/km).
  • C k , j —the value of the road performance improvement if the j-th maintenance measure is applied when the road is in the k-th road performance combination state.
  • Z t —the PQI value of pavement in year t.

3.2.2. Determine the Optimal Solution

The purpose of optimizing road maintenance decisions before was to achieve the best road performance under certain financial conditions, with less consideration given to the improvement of user comfort and the environmental climate caused by maintenance and repair. Therefore, this article selects performance benefit indicators, user benefit indicators, and environmental benefit indicators for maintenance benefit evaluation.
Based on the various asphalt pavement maintenance benefit evaluation indicators mentioned above, the AHP model is applied to determine the weight coefficients of each indicator and a highway asphalt pavement maintenance benefit evaluation system is established.
The establishment of a model using AHP is generally divided into the following steps:
Hierarchy Model
AHP reflects the hierarchical relationship of the model through the established hierarchical structure model. Figure 3 shows the AHP hierarchical structure model for evaluating maintenance benefits.
Constructing a judgment matrix
The construction of a judgment matrix first requires a clear scaling method for the importance of each element in the judgment matrix. At present, the commonly used judgment matrix scaling method is the 1–9 ratio scaling method, and the specific quantitative judgment indicators are shown in Table 3.
  • Criterion layer judgment matrix
In the construction of the judgment matrix of the criterion layer, it is mainly divided into economic benefits, social benefits, and environmental benefits. The judgment matrix of the criterion layer is shown in Table 4:
b.
Indicator layer judgment matrix
In the construction of the indicator layer judgment matrix, the economic benefit indicator adopts the performance improvement value. The user benefit indicators adopt cost savings in vehicle operation and cost savings in vehicle travel time. The environmental benefit indicators adopt the cost savings of energy consumption and greenhouse gas emissions, and the judgment matrix of the indicator layer is constructed as shown in Table 5 and Table 6.
Model weight calculation results
The eigenvectors calculated based on the above judgment matrix are the corresponding weights of the model. The weight coefficients of each layer in the comprehensive benefit calculation model are shown in Table 7.
Determination of the optimal solution problem
According to the above calculation results, the optimal decision model proposed in this paper is as follows:
M a x Z = i = 1 n k = 1 11 j = 1 5 a i , k , j ( 0.2 × Δ T i , k , j + 0.05 × Δ O i , k , j ) i = 1 n k = 1 11 j = 1 5 a i , k , j L i D i , k ( 0.0825 × E i , j + 0.1675 × G i , j ) + i = 1 n k = 1 11 j = 1 5 0.5 × a i , k , j L i D i , k C k , j
The constrains are as follows:
j = 1 5 a i , j , k 1 , i = 1 , 2 , n ; k = 1 , 2 , 11 ; i = 1 n k = 1 11 j = 1 5 a i , k , j L i D i , k b i , j B t a i , 10 , 1 = a i , 10 , 2 = a i , 10 , 4 = a i , 10 , 5 = 0 , a i , 10 , 3 = 1 a i , 11 , 1 = a i , 11 , 2 = a i , 11 , 3 = a i , 10 , 4 = 0 , a i , 11 , 5 = 1 a i , k , j = { 0 , 1 }
where
  • B t , a i , k , j , L i , D i , k , C k , j , and variable b i , j have the same meaning as in the equation for minimum funding determination.
  • E i , j —the cost of energy consumption per kilometer for the j-th maintenance measure for the i-th road (million CNY/km).
  • G i , j —the cost of greenhouse gas emissions per kilometer for the j-th maintenance measure for the i-th road (million CNY/km).
  • Δ T i , k , j —the cost of user travel time saved by applying the j-th maintenance measure when the i-th road is in the k-th road performance combination.
  • Δ O i , k , j —the cost of user travel fuel saved by applying the j-th maintenance measure when the i-th road is in the k-th road performance combination.
Other parameters are consistent with the above model.
Referring to Section 2.3, Δ T i , k , j , Δ O i , k , j can be determined by following equations:
Δ T i , k , j = θ Q i Δ t i , k , j
Δ O i , k , j = Q i Δ o i , k , j
where
  • Q i —the traffic volume of i-th road section
  • Δ t i , k , j —the saved user travel time from each vehicle after applying the j-th maintenance strategy for the i-th road section under the k-th combination condition
  • Δ o i , k , j —the saved fuel consumption from each vehicle after applying the j-th maintenance strategy for the i-th road section under the k-th combination condition
  • Δ t i , k , j and Δ o i , k , j can be obtained through
Δ t i , k , j = L i D i , k t k , j
Δ o i , k , j = L i D i , k g o k , j
where
t k , j and o k , j —the saved user travel time and saved fuel consumption from each vehicle after applying the j-th maintenance strategy for the k-th combination condition in kilometers, respectively.
By adopting Equations (8) and (11), t k , j and o k , j can be determined with following equations:
t k , j = 1 0.82 P C I 0 + 16.5 1 0.82 P C I 1 + 16.5 o k , j = 0.24808 ( IRI 0 - IRI 1 )
where
  • P C I 1 —the pavement condition index of the road under the k-th combination condition after applying the j-th maintenance strategy,
  • P C I 0 —the pavement condition index of the road under the k-th combination condition before applying the k-th maintenance strategy,
  • I R I 1 —the international roughness index of the road under the k-th combination condition after applying the j-th maintenance strategy
  • I R I 0 —the international roughness index of the road under the k-th combination condition before applying the j-th maintenance strategy.
For Equation (13), in order to eliminate the impact of differences in dimensions and value ranges between different indicators, the original data needs to be dimensionalized to solve the comparability between data indicators. The purpose of maximizing is to use the maximum value as a reference standard, dividing all data by the maximum value. The calculation formula is X/Max, which means taking the maximum value as the unit and removing all data to the maximum value.
Δ T i , k , j , Δ O i , k , j , E i , j , G i , j , C i , j —original data dimensionalized value.

3.3. Case Study

3.3.1. Expressway Condition

Select the following nine expressways in a certain province of China’s highway network as the research objects, and apply the model developed in this study to optimize maintenance plan decision making. The specific high-speed situation and mileage are shown in Table 8:
According to statistics, the distribution of pavement combination status of the above nine expressways at the beginning of the year is obtained, as shown in the Table 9 below:
Based on the pavement inspection data at the beginning of year t-1, the difference in PQI between the beginning of year t-1 and the beginning of year t was calculated using the PQI calculation method in this paper. The average PQI of the road surface decreased by six. According to the establishment idea of the above model, it can be seen that the goal of optimizing maintenance decisions in year t is to increase the average PQI of the nine highways by six.

3.3.2. Maintenance Decision Optimization

By conducting field investigations in different road sections, the b i , j , E i , j , and G i , j of five common maintenance strategies for different road sections in this network were determined, as listed in Table 10, Table 11 and Table 12.
Based on the above assumptions, the C k , j values after applying different maintenance strategies under different combinations are shown in Table 13. The corresponding coefficient matrices of t k , j and o k , j are shown in Table 14 and Table 15, respectively.
For the optimization model of highway pavement maintenance decision making established in this paper, as mentioned above, the 0–1 mathematical programming method is used, and the programming calculation is carried out using Lingo 18.0 software. The specific programming is as follows:
The first step is to determine the minimum maintenance budget funds. Part of the code is shown in Figure 4.
Obtain a minimum maintenance fund of CNY 107.26 million, as shown in Figure 5, and substitute it for the second step. The second step is to determine the optimal solution, and partial code of the result is shown in the Figure 6.
The specific maintenance plan is shown in Table 16.

4. Conclusions

This study is based on the analysis of the current research status of domestic network-level road maintenance decision making and establishes an optimization model for road maintenance decision making that comprehensively considers maintenance funds, road performance, user costs, and environmental costs. Based on case analysis, the following conclusions are drawn:
(1)
Based on existing research, the user costs that affect the effectiveness of road maintenance were determined as the cost of vehicle travel time and the cost of vehicle fuel consumption, and quantitative models were established for each.
(2)
Based on a user cost quantification model that affects the effectiveness of pavement maintenance, and applying the AHP model, an evaluation system for the effectiveness of highway asphalt pavement maintenance was established. A network-level pavement maintenance decision-making optimization model was established with the objective function of maximizing comprehensive maintenance benefits.
(3)
Taking a certain road network in a certain province as an example for network-level maintenance decision making, the final maintenance plan was obtained using Lingo software. The case results validate the effectiveness of the proposed optimization model, indicating that the research findings of this article can assist decision makers in making road maintenance decisions more reasonably by considering the diversity of practical problems from multiple perspectives.
In addition, this study also has the following shortcomings: Firstly, when analyzing the quantification of vehicle operating costs, this article only considers one type of passenger car. In order to construct a more comprehensive user cost quantification model from a more comprehensive perspective, future research can increase the consideration of other vehicle models. Secondly, when building the network-level pavement maintenance decision model, this paper does not consider the user costs caused by the closure or semi-closure of road sections due to construction barriers. Finally, for future research, more components of user costs (e.g., vehicle safety costs and vehicle tire wearing costs) and environmental costs (traffic noise pollution costs) can be incorporated into the optimization model.

Author Contributions

Conceptualization, X.G.; Methodology, X.G. and H.Z.; Software, X.Z.; Validation, X.Z.; Formal analysis, X.D.; Resources, X.D. and Y.B.; Data curation, M.S.; Writing—original draft, X.G.; Writing—review & editing, M.S. and Y.B.; Supervision, H.Z. All authors have read and agreed to the published version of the manuscript.

Funding

This research received no external funding.

Institutional Review Board Statement

Not applicable.

Informed Consent Statement

Not applicable.

Data Availability Statement

Not applicable.

Conflicts of Interest

The authors declare no conflict of interest.

References

  1. Peng, H.; Chen, C.; Sun, L.J. Double layer optimization of project optimization models in network level pavement management systems. J. Tongji Univ. (Nat. Sci. Ed.) 2010, 38, 380–385. [Google Scholar]
  2. Feng, S.K. Research on Multi-Objective Pavement Maintenance Decision-Making Optimization Considering Uncertainty Factors. Master’s Thesis, Chang’an University, Xi’an, China, 2020. [Google Scholar]
  3. Li, Z.; Sinha, K.C. Methodology for Multicriteria Decision Making in Highway Asset Management. Transp. Res. Rec. J. Transp. Res. Board 2004, 1885, 79–87. [Google Scholar] [CrossRef]
  4. Li, L. Model Optimization and Benefit Evaluation of Total Highway Maintenance Cost. Master’s Thesis, Chang’an University, Xi’an, China, 2018. [Google Scholar]
  5. Li, H.M. Research on Maintenance Decision of Asphalt Pavement of Network Expressway Based on Matter Element Model. Ph.D. Thesis, Southeast University, Nanjing, China, 2017. [Google Scholar]
  6. Zhang, H.; Keoleian, G.A.; Lepech, M.D.; Kendall, A. Life-Cycle Optimization of Pavement Overlay Systems. J. Infrastruct. Syst. 2010, 16, 310–322. [Google Scholar] [CrossRef] [Green Version]
  7. Elhadidy, A.A.; Elbeltagi, E.E.; Ammar, M.A. Optimum analysis of pavement maintenance using multi-objective genetic algorithms. HBRC J. 2015, 11, 107–113. [Google Scholar] [CrossRef] [Green Version]
  8. Bryce, J.M.; Flintsch, G.; Hall, R.P. A multi criteria decision analysis technique for including environmental impacts in sustainable infrastructure management business practices. Transp. Res. Part D Transp. Environ. 2014, 32, 435–445. [Google Scholar] [CrossRef]
  9. Xie, F. Research on Intelligent Decision Model of Highway Pavement Management Based on GIS. Ph.D. Thesis, Southwest Jiaotong University, Chengdu, China, 2012. [Google Scholar]
  10. Mao, X.H. Research on Improvement of Decision Model for Highway Pavement Maintenance. Ph.D. Thesis, Chang’an University: Xi’an, China, 2015. [Google Scholar]
  11. JTG H20-2007; Highway Performance Assessment Standards. Standard Prees of China: Beijing, China, 2007.
  12. JTJ 073; Technical Specifications for Maintenance of Highway Asphalt Pavement. Standard Prees of China: Beijing, China, 2001.
  13. Silva, C.M.; Farias, T.L.; Frey, H.C.; Rouphail, N.M. Evaluation of numerical models for simulation of real-world hot-stabilized fuel consumption and emissions of gasoline light-duty vehicles. Transp. Res. Part D Transp. Environ. 2006, 11, 377–385. [Google Scholar] [CrossRef]
  14. Flintsch, G.W.; Kuttesch, J. Engineering Economic Analysis Tools for Pavement Management. In Proceedings of the International Conference on Bituminous Mixtures & Pavements, Thessaloniki, Greece, 5 November 2002. [Google Scholar]
  15. American Association of State Highway and Transportation Officials. User Benefit Analysis for Highways Manual; American Association of State Highway and Transportation Officials: Washington, DC, USA, 2003. [Google Scholar]
  16. Hua, L. Research on Network Level Pavement Maintenance Fund Decision Based on NSGAII+DRSA Method. Master’s Thesis, Changsha University of Science and Technology. Changsha, China, 2020. [Google Scholar]
  17. Li, T.; Zhang, P.L.; Mao, X.H. Optimal decision-making for road maintenance considering the dynamic distribution of traffic flow. Chin. J. Highw. Eng. 2019, 32, 7. [Google Scholar]
  18. Becker, G.S. A theory of the allocation of time. Econ. J. 1965, 75, 93–517. [Google Scholar] [CrossRef] [Green Version]
  19. Mark, W. A review of British evidence on time and service quality valuations. Transp. Res. Part E 2001, 37, 107–128. [Google Scholar]
  20. Zong, F.; Juan, Z.C.; Zhang, H.Y.; Jia, H.F. Research on the Calculation and Application of Travel Time Value. Transp. Syst. Eng. Inf. 2009, 9, 6. [Google Scholar]
  21. Scora, G.; Barth, M. Comprehensive Modal Emissions Model (CMEM), Version 3.01. User Guide, Centre for Environmental Research and Technology; University of California: Riverside, CA, USA, 2006. [Google Scholar]
  22. Chau, K.T.; Wong, Y.S.; Chan, C.C. EVSIM—A PC-based simulation tool for an electric vehicle technology course. Int. J. Electr. Eng. Educ. 2000, 37, 167–179. [Google Scholar] [CrossRef]
  23. Frey, H.C.; Rouphail, N.M.; Zhai, H.; Farias, T.L.; Gonçalves, G.A. Comparing real-world fuel consumption for diesel- and hydrogen-fueled transit buses and implication for emissions. Transp. Res. Part D Transp. Environ. 2007, 12, 281–291. [Google Scholar] [CrossRef]
  24. Zhou, Y.; Zhang, H.R. Research on relation between of surface characteristics and fuel consumption. Highways 2005, 1, 30–36. [Google Scholar]
  25. Yao, Z.K. Research on Optimization Methods in Network Level Pavement Management System. J. China Highw. Eng. 1994, 7, 1–9. [Google Scholar]
Figure 1. National expressway mileage.
Applsci 13 08842 g001
Figure 2. Current pavement performance index evaluation system diagram.
Applsci 13 08842 g002
Figure 3. AHP maintenance benefit evaluation hierarchy model.
Applsci 13 08842 g003
Figure 4. Determination of minimum funds.
Applsci 13 08842 g004
Figure 5. Result of minimum funds.
Applsci 13 08842 g005
Figure 6. Result of the optimal solution.
Applsci 13 08842 g006
Table 1. Simplified combination of the pavement performance conditions.
Verbal Rating (Numerical Rating)
PCIGood [70–100]Fair [55–70)Poor [0–55)
RQIGood [80–100]Fair [62–80)Poor [0–62)
SRISufficient [62–100]Insufficient [0–62)
PSSISufficient [80–100]Insufficient [0–80)
Table 2. Condition combination of the expressway asphalt pavement performance.
CombinationPCIRQISRIPSSI
1GoodGoodSufficientSufficient
2FairGoodSufficientSufficient
3PoorGoodSufficientSufficient
4GoodFairSufficientSufficient
5FairFairSufficientSufficient
6PoorFairSufficientSufficient
7GoodPoorSufficientSufficient
8FairPoorSufficientSufficient
9PoorPoorSufficientSufficient
10 Insufficientsufficient
11 Insufficient
Table 3. Definition of judgment index scale.
ScaleDefinition
1Factor i is equally important as factor j
3Factor i is slightly more important than factor j
5Factor i is stronger and more important than factor j
7Factor i is more important than factor j
9Factor i and factor j are absolutely important
2, 4, 6, 8Judgment value between adjacent degrees
Count backwardsThe comparison between factor j and factor i shows a reciprocal relationship of 7 with the comparison between factor i and factor j
Table 4. Judgment matrix of criterion layer.
Maintenance BenefitsPerformance BenefitsUser BenefitsEnvironmental Benefit
Performance benefits122
User benefits1/211
Environmental benefit1/211
Table 5. Judgment matrix of user benefits.
User Benefit IndicatorsCost Savings in Vehicle Travel TimeVehicle Fuel Consumption Cost Savings
Cost savings in vehicle travel time14
Vehicle fuel consumption cost savings1/41
Table 6. Judgment matrix of environmental benefits.
Environmental Benefit IndicatorsConservation Measures for Greenhouse Gas Emissions SavingsEnergy Consumption Savings of Maintenance Measures
Conservation measures for greenhouse gas emissions savings12
Energy consumption savings of maintenance measures1/21
Table 7. Model weight coefficient.
Hierarchical StructureCriterion LayerIndicator LayerWeighted Results
Weight coefficient w P e r f o r m a n c e C r i t e r i o n = 0.500 w A I n d i c a t o r = 1 0.5
w U s e r C r i t e r i o n = 0.250 w t i m e I n d i c a t o r = 0.8 0.2
w f u e l I n d i c a t o r = 0.2 0.05
w E n v i r o n m e n t C r i t e r i o n = 0.250 w e m i s s i o n I n d i c a t o r = 0.67 0.1675
w e n e r g y I n d i c a t o r = 0.33 0.0825
Table 8. Information on mileage and traffic volume of the expressway in the road network.
Road Number123456789
Mileage (km)20874153214145874110788
Daily traffic volume30,00020,00016,00014,00013,00018,00011,00015,00012,000
Table 9. Distributions of different expressway pavement condition combinations in the road network.
CombinationRoad Number
123456789
10.920.56110.880.810.90.670.81
20.050.17000.080.110.060.140.1
3000000000
40.030.13000.040.050.040.110.09
500.070000.0300.060
600.010000000
7000000000
800.020000000
9000000000
1000.04000000.020
11000000000
Table 10. bi,j of different road sections with different maintenance strategies (10,000 CNY/km).
Road Number
123456789
Routine maintenance554.54.5444.544
Paving of overlay 202018181515181515
Paving of anti-skid layer151513131212131212
Paving reconstruction505045454040454040
Structural reinforcement404035353030353030
Table 11. Ei,j of different road sections with different maintenance strategies (10,000 CNY/km).
Road Number
123456789
Routine maintenance0.20.20.150.150.10.10.150.10.1
Paving of overlay 0.70.70.60.60.50.50.60.50.5
Paving of anti-skid layer0.50.50.40.40.40.40.40.40.4
Paving reconstruction1.71.71.51.51.31.31.51.31.3
Structural reinforcement1.31.31.11.1111.111
Table 12. Gi,j of different road sections with different maintenance strategies (10000 CNY/km).
Road Number
123456789
Routine maintenance0.50.50.450.450.40.40.450.40.4
Paving of overlay 2.12.11.91.91.51.51.71.41.4
Paving of anti-skid layer1.51.51.31.31.21.21.31.21.2
Paving reconstruction554.54,5444.544
Structural reinforcement443.53.5333.533
Table 13. Ck,j values after applying different maintenance strategies under different combinations.
CombinationRoutine MaintenancePaving of OverlayPaving of Anti-Skid LayerPaving ReconstructionStructural Reinforcement
108.751.912.6512.65
2016.6251.920.52520.525
3023.6351.932.77532.775
4011.91.919.319.3
5019.7751.927.17527.175
6026.7751.939.42539.425
7019.251.933.333.3
8027.1251.941.17541.175
9034.1251.953.42553.425
10019.7756.940.17540.175
11019.775540.27540.275
Table 14. The tk,j matrix used in the developed model.
Combination Routine MaintenancePaving of OverlayPaving of Anti-Skid LayerPaving ReconstructionStructural Reinforcement
100.00144900.0014490.001449
200.00460800.0046080.004608
300.01400700.0154560.015456
400.00144900.0014490.001449
500.00460800.0046080.004608
600.01400700.0154560.015456
700.00144900.0014490.001449
800.00460800.0046080.004608
900.01400700.0154560.015456
1000.00460800.0046080.004608
1100.00460800.0046080.004608
Table 15. The ok,j matrix used in the developed model.
Combination Routine MaintenancePaving of OverlayPaving of Anti-Skid LayerPaving ReconstructionStructural Reinforcement
101.0177301.017731.01773
201.0177301.017731.01773
301.0177301.017731.01773
400.7390401.756771.75677
500.7390401.756771.75677
600.7390401.756771.75677
700.96251802.7192882.719288
800.96251802.7192882.719288
900.96251802.7192882.719288
1000.7390401.756771.75677
1100.7390401.756771.75677
Table 16. Optimal maintenance methods on the different road sections under different combinations.
CombinationRoad Number
123456789
1 II IIII IIII
2IIII IIIIIIIIII
3
4IIII IIVVVV
5 II II V
6 V
7
8 V
9
10IIIIIIIIIIIIIIIIIIIIIIIIIII
11VVVVVVVVV
II represents paving of overlay, III indicates the paving of anti-skid layer, and V denotes the structural reinforcement.
Disclaimer/Publisher’s Note: The statements, opinions and data contained in all publications are solely those of the individual author(s) and contributor(s) and not of MDPI and/or the editor(s). MDPI and/or the editor(s) disclaim responsibility for any injury to people or property resulting from any ideas, methods, instructions or products referred to in the content.

