Article

Heavy-Duty Use and Charging of Power Tool Battery Packs: A Simulation-Based Study to Improve Cooling Strategies

Materials Research Institute, Aalen University, Beethovenstraße 1, 73430 Aalen, Germany
*
Author to whom correspondence should be addressed.
Appl. Sci. 2023, 13(15), 8848; https://doi.org/10.3390/app13158848
Submission received: 10 June 2023 / Revised: 26 July 2023 / Accepted: 27 July 2023 / Published: 31 July 2023
(This article belongs to the Special Issue Phase Change Materials: Design and Applications—Volume II)

Abstract

:

Featured Application

This article is a revised and expanded version of a paper entitled “Power tool battery packs: shortening intervals of operation and charging by improved cooling strategy”, which was presented at the COMSOL Conference Europe, Grenoble, 14–15 October 2020.

Abstract

In the fast-growing but also highly competitive market of battery-powered power tools, cell-pack-cooling systems are of high importance, as they guarantee safety and short charging times. A simulation model of an 18 V power tool battery pack was developed to be able to evaluate four different pack-cooling systems (two heat-conductive polymers, one phase change material, and non-convective air as reference) in an application scenario of practical relevance (the intensive use of a power tool followed by cooling down and charging steps). The simulation comprises battery models of 21700 cells that are commercially available as well as heat transfer models. The study highlights the performance of the different cooling materials and their effect on the maximum pack temperature and total charging cycle time. Key material parameters and their influence on the battery pack temperature and temperature homogeneity are discussed. Using phase change materials and heat-conductive polymers, a significantly lower maximum temperature during discharge (up to 26%) and a high shortening potential of the use/charging cycle (up to 32%) were shown. In addition to the cooling material sweep, a parameter sweep was performed, varying the external temperature and air movement. The high importance of the conditions of use on the cooling system’s performance was illustrated.

1. Introduction

Increasing power and energy densities in modern Li-ion battery cells allows for the electrification of energy-intensive power tools, such as chainsaws, drilling hammers, and angle grinders. However, these new application fields lead to new challenges in terms of cell pack design. In particular, adequate cooling is of high importance during intensive use [1,2,3], which involves high-energy consumption in very short time spans and (fast) charging, as cells can get damaged if a certain temperature is exceeded [4,5,6].
For commercially available round cells such as 18650 or 21700 format cells, which are used in most power tool battery packs, cell manufacturers provide the maximum currents as well as the temperature ranges for charging and discharging to prevent short- and long-term damage to the cells [7]. Power tool manufactures have to ensure, through pack design and management software, that these limits are not exceeded to guarantee the safety and long service life of their power tool battery packs [8]. Battery packs are controlled by the battery management system (BMS) [9,10]. Simple systems control the current flowing to the cells and monitor cell and pack voltage, thus ensuring that safety limits and cell balancing are maintained. More complex systems are also able to estimate the current battery state, such as the current state of charge and state of health, and predict battery behavior [11]. This allows for the battery to be controlled much more finely and thus also makes it possible, for example, to use improved (fast) charging protocols, which specifically accelerate the charging process and improve the aging behavior [12]. The BMS can be implemented as an intelligent overarching central system or as an individual system in each cell [13]. Depending on the architecture, there are also limitations with regard to the performance of the systems, especially in terms of computing power and the number and type of sensors. The battery management system works closely with the battery cooling system or they are combined into one system. This guarantees that both systems function optimally, that safety limits are complied with, and that the system is always in a safe state for cell aging [14]. It is essential to know the characteristics of the cooling system as precicly as possible, as this is the only way to ensure good control and to get the best possible performance and user-friendliness from the use of the battery pack.
A great variety of different Li ion battery cooling systems have been proposed and investigated so far [15,16,17,18]. In scientific studies dealing with battery cooling systems, experimental approaches are often linked with simulations to be able to predict their performance in various usage scenarios [19]. In most studies, active cooling systems are investigated, pumping air or cold liquids around the cells or through cooling plates adjacent to the cells [20,21,22], as these systems are mainly used in huge battery packs, e.g., in electric vehicles [23,24]. However, the effort in terms of the weight and complexity of implementing such systems is high.
Passive cooling systems by contrast are lightweight, small, and independent of external power sources, and therefore easily implemented in small battery packs [25]. They are widely used, e.g., in e-bikes or power tool batteries [26]. In passive cooling systems, cells are embedded in materials with high heat conduction to ensure the fast transport of the produced heat to the pack’s surface. Latent heat storage materials make additional use of the energy used up by the phase transition of the material and are often combined with heat-conductive materials [27,28,29,30]. The performance of passive battery cooling systems using phase change materials has been confirmed in many studies [19,31,32,33]. Lou et al. [34] provide an overview of recent developments. They compare the performance of composite phase change materials, phase change fluids, flexible phase change materials, and hybrid cooling systems. Paraffin wax is usually used as the phase transformation material, as it is characterized by high latent heat in the appropriate melting temperature range, in addition to being non-toxic and non-corrosive [35]. However, since the material is characterized by low thermal conductivity, in recent years, it has been combined with materials with high thermal conductivity, such as graphite, graphene, or carbon nanofibers [36,37,38,39,40]. Other researchers have used cooling fins or foam structures to enhance heat dissipation at the surface [41,42,43]. Recent studies also suggest a combination of passive and active cooling systems. Zheng et al. [44] describe a pack-cooling system combining liquid and phase change material cooling for fast-charging applications in which the phase change material takes up 10% and the liquid cooling system takes up 90% of the generated heat. Ranjbaran et al. [45] used a similar approach of combining passive cooling by phase change material with active cooling, but they used air cooling instead of liquid cooling. Different cooling duct structures and cold air stream pressure differences were simulated and studied.
Due to direct use by the end user, the small space inside the device, and safety and usability requirements, cooling systems in battery-powered portable power tools face different challenges compared to cooling systems in electric mobility or grid applications. For example, cooling systems have to have the following characteristics:
(1)
They must be powerful, as the comparatively small battery has to provide a lot of energy in a short time, especially when the tools are in use. This generates a lot of heat for a short time, which needs to be dissipated by the cooling system.
(2)
They must help achieve the shortest possible charging time. The duration of the charging process is determined on the one hand by the charging current (fast charging). In power tools, however, it is precisely the excessively high temperature at the start of the charging process that restricts charging. Charging cannot be started immediately as the battery pack has to cool down first, and thus, the charging process is significantly prolonged by this cool-down time. A charging process that is as short as possible and thus the short downtime of the devices are of great interest to the user.
(3)
They must be lightweight and take up very little space. Portability and user-friendliness can only be achieved this way [2].
(4)
They must be maintenance-free and have user-independent control of both the cooling system and the battery management system, as well as their interaction. It is essential that the control system is as simple and independent as possible, as the units are intended for end users.
(5)
They must be safe. Equipment should be designed to minimize the risk of personal injury and property damage from fires caused by overheated batteries [8,46].
(6)
They must promote the long battery life of the pack. This is important in order to maximize user acceptance, but also in terms of resource conservation and sustainability. This can be achieved through a cooling system which keeps the pack at the most comfortable temperature range for the cells [5].
Mastering these challenges is made possible by the interplay between the choice of the right cooling system and the correct design, tailored to the specific application, as well as the suitable control of the battery by the battery management system, which also controls the charging and discharging currents with regard to thermal development.
This study contributes to a better understanding of cooling systems in power tool battery packs. It helps to select a cooling material that fits our requirements exactly and thus supplies a solution tailored to our performance requirements. This makes it possible to find an optimal compromise between high performance, safety, user-friendliness through having a short charging time, and longevity with regard to cell aging. In particular, short charging times are addressed. By comparing different cooling materials with a phase change material, the behavior of the materials in battery cooling systems can be better understood. Our application-oriented simulation in the use/charge cycle allows for insight into the effects of the cooling material used at different typical loads (discharging, loads, etc.). This study also provides an example of how simulation methods can be used to play through the complex interaction of the cooling system, load sequence, and safety and ageing requirements as well as how they can identify adjusting screws for the targeted optimization of the system.
In most power tool battery packs used in handheld power tools, cooling is achieved by passive cooling systems. This study uses a Comsol battery and heat transfer simulation to evaluate three different materials that are in use in the passive cooling systems of battery packs. The performance of three different cooling materials—two heat-conductive polymers, one phase change material, and non-convective air as reference—are compared at typical working conditions (at 25 °C, with a low wind speed) in a material sweep study. To get further insights into their performance under other climatic conditions, an additional simulation study on the influence of the external temperature and wind speed was performed (a parameter sweep study).
The special focus of this study was on shortening the use/charge cycle (Figure 1). This cycle resembles the typical use scenario of a power tool battery pack, e.g., used by a professional craftsman working with a power tool at a construction site over several hours. It consists of intensive use (A), cool-down phase I (B), charging (C), and cool-down phase II (D). To prevent accelerated aging during charging, the maximum charging temperature is limited to 50 °C (as per the recommendation of the cell’s manufacturer), and therefore charging is implemented in a temperature window of 46 °C (the charging start temperature) and 50 °C (the charging stop temperature).
A long us phase, which is mainly limited by the pack energy density and size, is favorable for customers. However, cool down and charging phases B and C have to be as short as possible to guarantee an interruption-free workflow with low downtimes for the pack. In particular, cool-down intervals during phases B and C limit the use of the pack. Along with guaranteeing safety by not reaching pack temperatures that are too high, it is the task of a good battery pack cooling system to minimize these downtimes.
Few authors have investigated hand-held power tools with respect to their behavior in scenarios close to application and real-life conditions as carried out in this study. Vogiatzis et al. [47] investigated the transient behavior of hybrid hand-held tools in nearly real load conditions in a hybrid experimental and simulative study. They developed a simulation model for the energy management of the power tool but did not look at the cooling system and strategy.

2. Methods

A model of an 18 V power tool battery pack was developed using Comsol Multiyphysics V5.6. A special focus was set on the interaction of cell pack performance and the cooling system and their practical relevance for pack design and customer experience. It comprises battery models of 21700 commercially available cells as well as heat transfer models.

2.1. Battery Cell Model

The “lumped battery model” provided by Comsol was used to simulate the cell performance as well as the heating up of the cell pack (heat source). Key input parameters of the battery model are summed up in Appendix A. Cell parameters were determined by performing a parameter estimation study to fit experimental charge and discharge curves at different C rates. The parameter estimation was supported by interpretations of impedance measurements (EIS), pulsed discharge tests, and microstructural investigations (see Appendix A for further details), which were used as starting points for the parameter estimation study. A reasonable agreement between simulation and experimental data was achieved in terms of electrochemical and thermal behavior. An event interface was used to control battery mode (charging, discharging) and charging mode (CC, CV) with respect to state of charge. To link battery and thermal model, an electrochemical-thermal coupling model was used. Further documentation of the Comsol lumped battery model and the equations used can be found in Appendix B and in the Comsol documentation [48]. At the beginning of the use/charge cycle, the cells are in fully charged (SOC 1) state.
Electrochemical cell characterizations were carried out using a BaSyTec XCTS system (BaSyTec GmbH. Öllinger Weg 17, 89176 Asselfingen, Germany) and a Biologic VSP system (Biologic, Rue de Vaucanson 4, 38170 Seyssinet-Pariset, France) at controlled ambient temperature (climate chamber).

2.2. Material Properties and Heat Transfer Model

The heat transfer model is set up in Comsol by simplified 3D geometry of the cells and the surrounding passive cooling system (heat transfer material) as depicted in Figure 2. The geometry of the cooling system is inspired by the design of a power tool cell pack; however, it is reduced and simplified to increase computational efficiency. Heat transfer in the cells and the cooling material is computed by Comsol heat transfer in solid materials. Heat loss to the environment is taken into account by a convective heat flux surface boundary condition for all surfaces in contact with surrounding air. Ambient temperature was set to 25 °C and convection coefficient was set to 5 W/m2 K (moderate air movement). Event interfaces were used to control charge stop at “stop temperature” of 50 °C and charge restart at “start temperature” of 46 °C. Non-convective air (as reference) and three solid passive cooling materials were investigated in this study. Table 1 sums up the key parameters of the materials. Phase change in the latent heat storage material was implemented by adapting the heat capacity of the material at melting/solidifying temperature. Further documentation of the heat transfer in solids as well as the convective heat flux surface boundary condition and the equations used can be found in Appendix B as well as in the Comsol documentation [48].

3. Results and Discussion

3.1. Influence of Cooling Material on the Pack Performance during Use/Charge Cycle (Material Sweep Study)

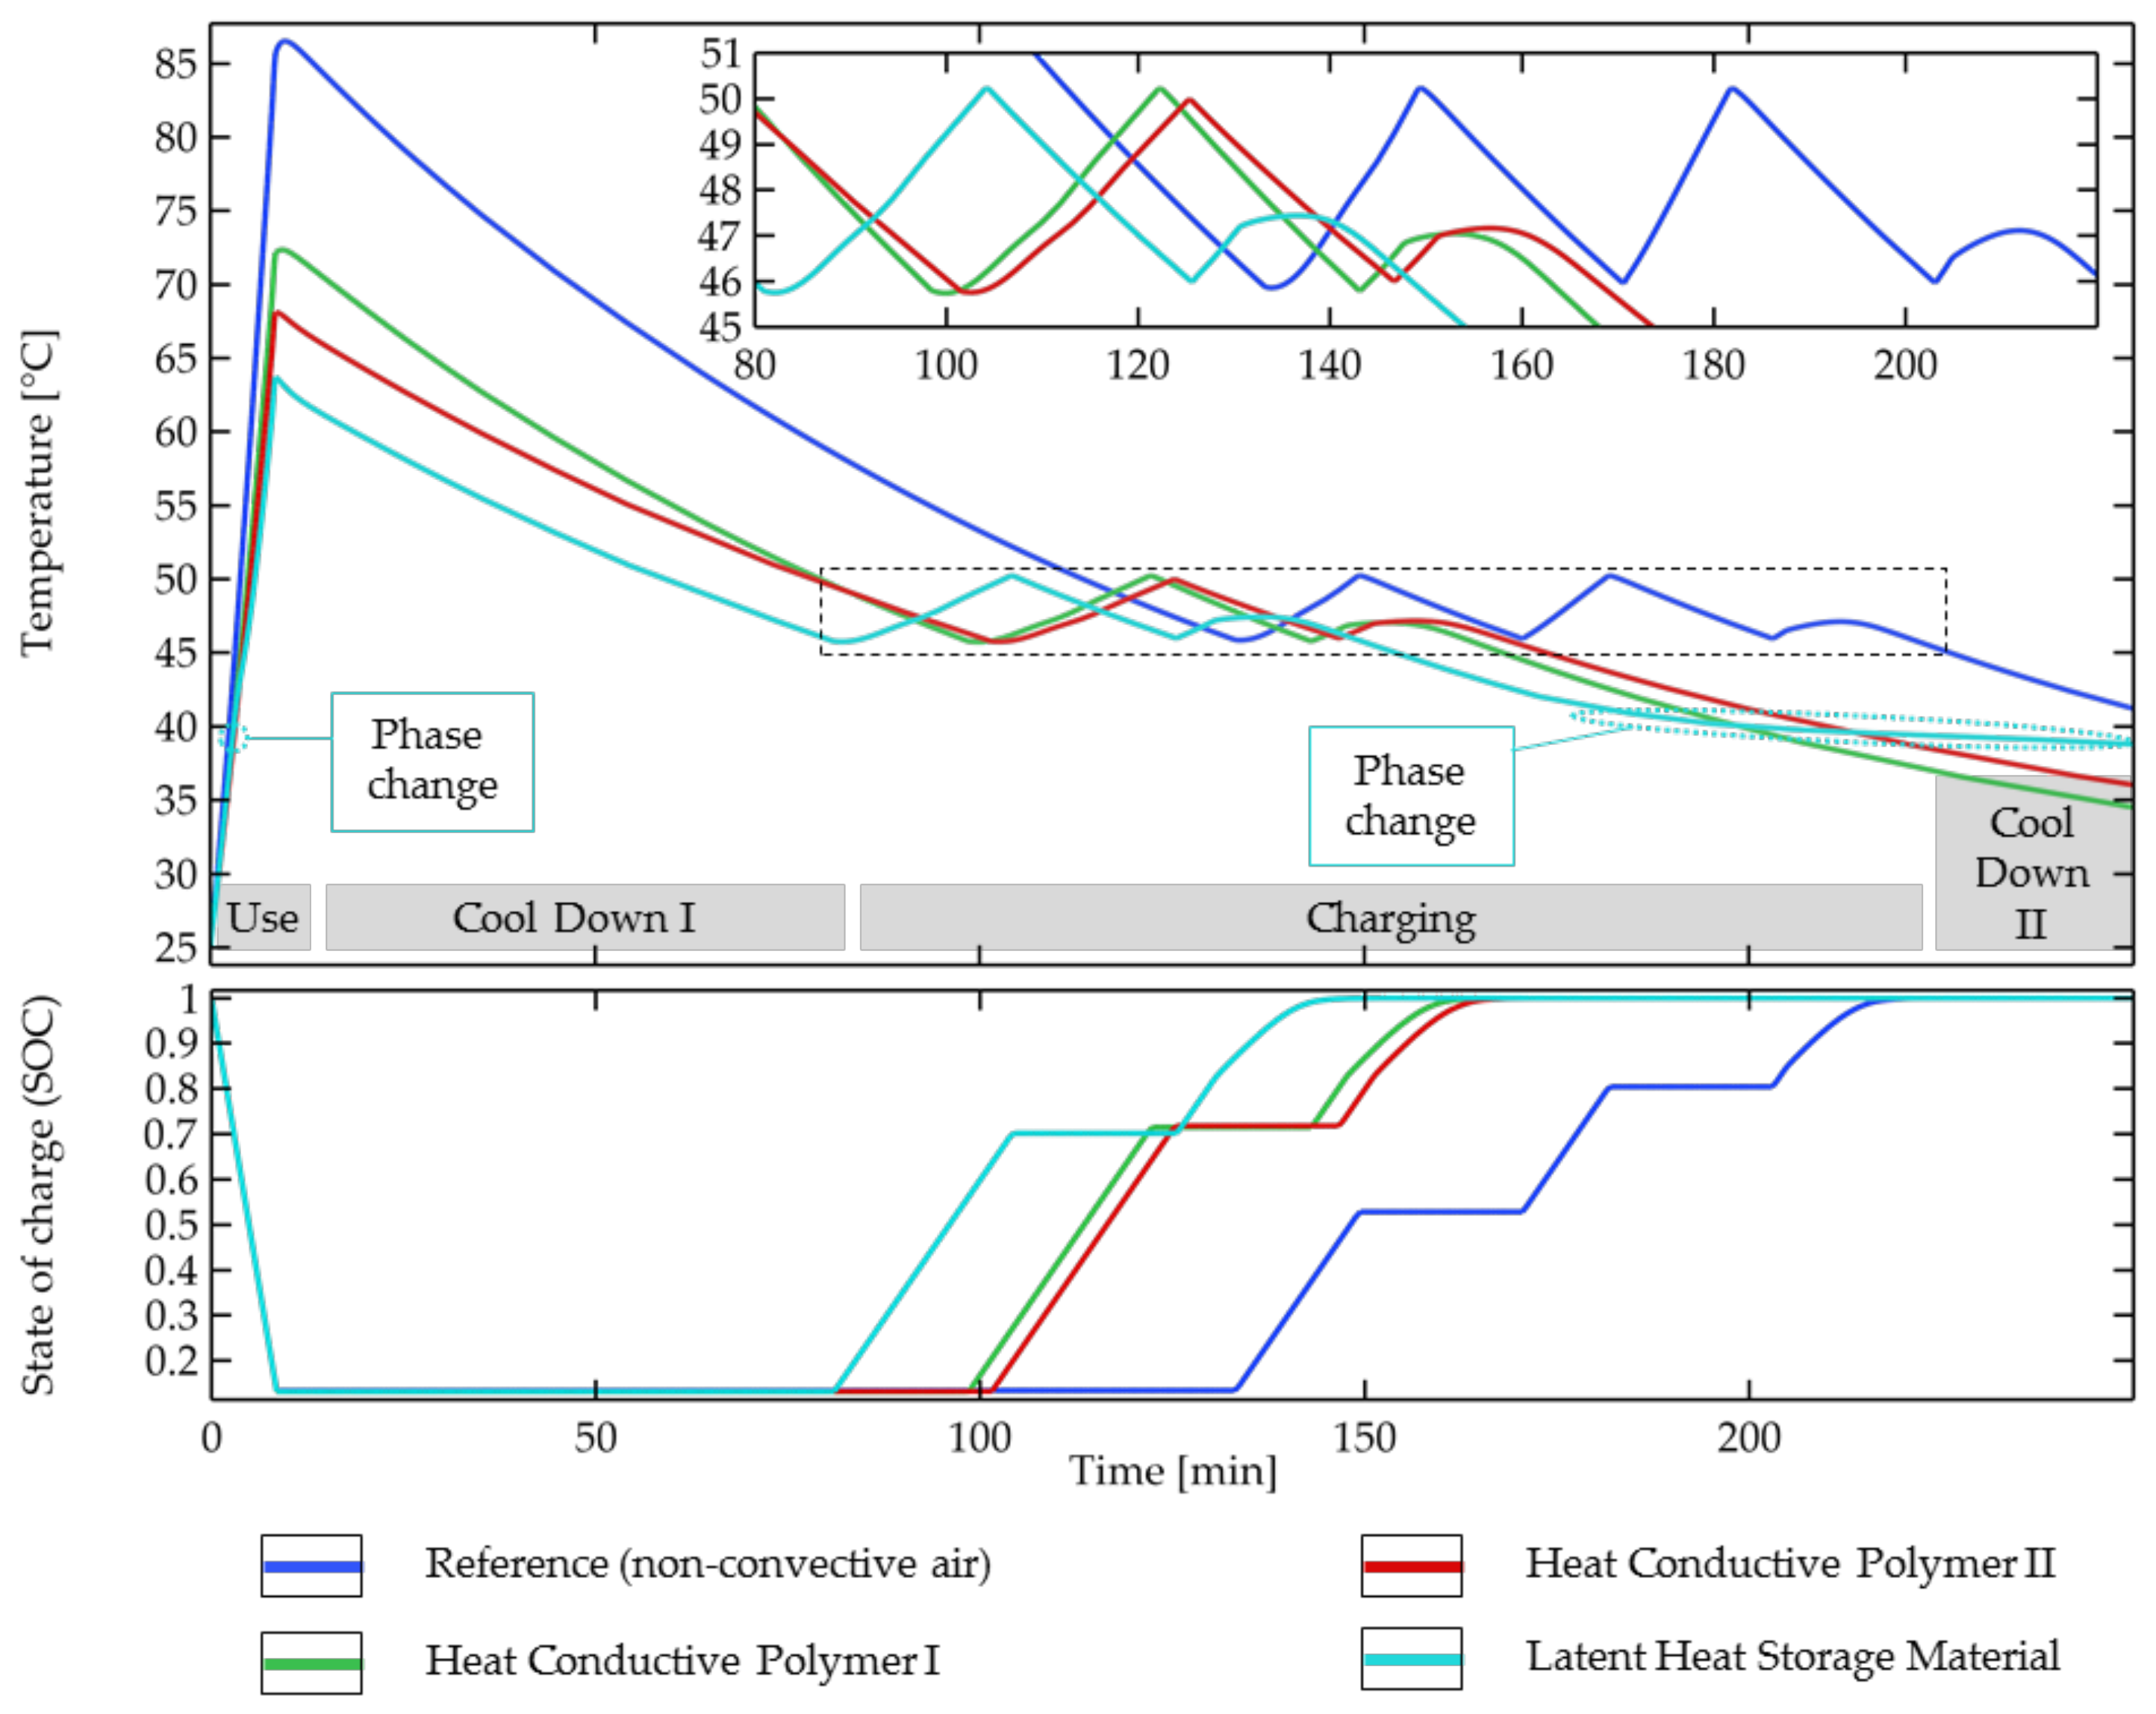
The performance of three different cooling materials was investigated in the use (discharge), cool-down (rest), and charging phases (Figure 3 and Table 2). The following use case was investigated: the fully charged battery pack was discharged with 50 A to zero SOC (step A, resembling, e.g., working with an angle grinder until the battery is empty). After it cooled down to an acceptable temperature (step B, the cool-down step, decreasing the temperature to 46 °C), a charging step with 1.5 C (6 A, step C) and a second cool-down step (D) back to the ambient temperature were conducted.
Due to the high discharge current (25 A/cell), the cells quickly heat up in the use phase (A) and reach temperatures in the range of 64–86 °C. In the following cool-down phase I (B), during which no new heat is created in the cells, all four configurations cool down. The charging start temperature (which starts as soon as the cells have cooled down to 46 °C) is attained after 81–134 min and is followed by the charging phase (C), which ends when the cells are fully charged after 130–182 min. Room temperature is reached after cool-down phase II after 473–580 min (see Figure 3).

3.1.1. Use and Cool-Down Phase I

The highest temperature in the simulation is reached with the non-convective air (used as reference). Even though the temperature transported to the battery pack’s surface is high in comparison to that of the other materials, the system is not able to transfer enough heat in the use phase (A). In combination with the very low heat capacity, this leads to a very high temperature of 86.5 °C in the cells at the end of discharging. This is beyond the typical specification of commercially available cells and the manufacturer’s recommendations (~80 °C for discharging); thus, the use of this system cannot be recommended for the investigated use scenario. During cool-down phase I, the cells cool down fast (~0.5 °C/min, with an average cooling rate of 12–30 min), but due to the high maximum temperature, it takes until minute 133.5 to cool down to the charging start temperature, which is significantly later than that for the other investigated cooling materials.
Heat-conductive polymer I is characterized by high thermal conductivity but a low heat capacity. With a peak temperature of 72.3 °C, it performs in the use phase (A) better than the reference system but worse than the other two solid materials. Even though the peak temperature is 14.2 °C lower than the reference state, it is only 7.7 °C below the recommended maximum temperature. Due to the high thermal conductivity, the subsequent cool down (B) is quick (~0.4 °C/min, with an average cooling rate of 12–30 min), and the charging start temperature is achieved after 98.5 min.
Heat-conductive polymer II exhibits the lowest peak temperature (68.1 °C) of both materials without latent heat storage (phase change). The high heat capacity is able to take up a high amount of the thermal energy created during discharging in a short time span. Its cool down by contrast is slower compared to that of the other materials (~0.3 °C/min, with an average cooling rate of 12–30 min). The charging start temperature is reached after 102 min.
The latent heat storage material is able to absorb a certain amount of thermal energy by a phase change (solid to liquid) at 39 °C. This significantly lowers the maximum temperature at the end of the use phase. With this and the high specific heat, it reaches at peak temperature of 63.7 °C only and outperforms all other materials, even though it has the lowest thermal conductivity. However, the thermal energy stored in the phase change is released during cool-down phase II and therefore prolongs the cool down to room temperature. Note that if a transition temperature of 39 °C is not reached in the cool-down phase and thus re-solidification does not happen, the latent heat is not available in the following second use phase. The cool-down speed is slow (~0.3 °C/min, with an average cooling rate of 12–30 min), but due to the low maximum temperature, the charging start temperature is reached after 81 min, which is the fastest in comparison with the other materials.

3.1.2. Charging and Cool-Down Phase II

Figure 3 and Table 2 show the cell behavior during charging (C) and cool-down phase II (D). All of the materials start at the charging start temperature of 46 °C (the onset temperature of the charging unit at cool down) with a 6 A charger. During charging, the cells heat up until the upper safety temperature limit (the stop temperature) of 50 °C is reached. The charging pauses at this temperature to let the battery pack cool down until it has reached the starting temperature (46 °C) and charging starts again. After the charging is finished, the pack cools down in cool-down phase II, and room temperature is reached after another 304–428 min.
When using non-convective air (reference), the charging is paused twice for 21 min each. This significantly prolongs the total charging time. Due to the low heat capacity, the system heats up quickly, and therefore the cells can only partly be charged in each charging step. The cells are fully charged after 225 min (a charging time of 91.6 min).
Heat-conductive polymer I, heat-conductive polymer II, and the latent heat storage material are characterized by comparable behaviors during charging. For all configurations, the charging was interrupted once for 21 min. The cells were fully charged after comparable time spans of 70.8, 70.9, and 71.2 min of charging time. However, due to the different starting times, the total charged state is reached after different times (160, 164, and 143 min). The latent heat storage effect has no influence on the charging process, as the melting point (phase change temperature) is lower than the start temperature.

3.1.3. Summary (Material Sweep)

For the investigated ambient temperature of 25 °C and moderate air movement (with a convection coefficient of 5 W/m2 K), all of the systems struggle to transport the produced heat out of the system during use phase A. In particular, the heat dissipation of the packs by surface convection is too low and is most likely a bottleneck. Therefore, systems which can take up and store high amounts of thermal energy in a short time span, such as the heat-conductive polymer II (with a high heat capacity) and the latent heat storage material (in which the heat is absorbed by the phase change), perform best and lead to the lowest maximum temperatures. The thermal conductivity of the materials is of minor importance in this step for the given conditions. The performance of the cooling system during the use phase is on the one hand important for safety reasons. However, on the other hand, it also governs the maximum temperature, which has a big influence on the length of the following cool-down phase I and thus also influences the length of the use/charge cycle.
During the cool-down phases, high heat transfer and a low thermal mass as well as a low starting temperature are beneficial. In cool-down phase I, the high thermal conductivity of heat-conductive polymer I leads to a quick cool down (with a high negative slope of the temperature curve). However, due to the lower starting temperatures, the length of the cool-down phase of heat-conductive polymer II is only slightly longer (3.5 min, with heat conductivity that is three times lower), and due to the lower starting temperature, the use of the latent heat storage material leads to a 17.5 min shorter cool-down phase.
When it comes to charging, all the investigated solid cooling materials result in comparable charging time spans. Differences in their material properties have only a minor influence on their performance in this step. All materials are not able to absorb and transfer the produced heat to be charged without interruption, and thus, the charging time is significantly prolonged. This clearly indicates that it is necessary to carefully design the pack-cooling system, as small differences can significantly prolong or shorten the duration of charging and operating conditions such as the ambient temperature and ventilation (convection coefficient) are of high importance.
Comparing the influence of cool down and charging on the total length of the use/charge cycle, both are of importance. Looking at phases A–C only (till fully charged), cool-down phase I makes up about half of the time. For the whole cycle reaching room temperature (26 °C), cool down makes up 82–86% of the total cycle length. Improving the cool down behavior has the potential to shorten the whole process greatly.

3.2. Temperature Homogeneity in the Battery Pack

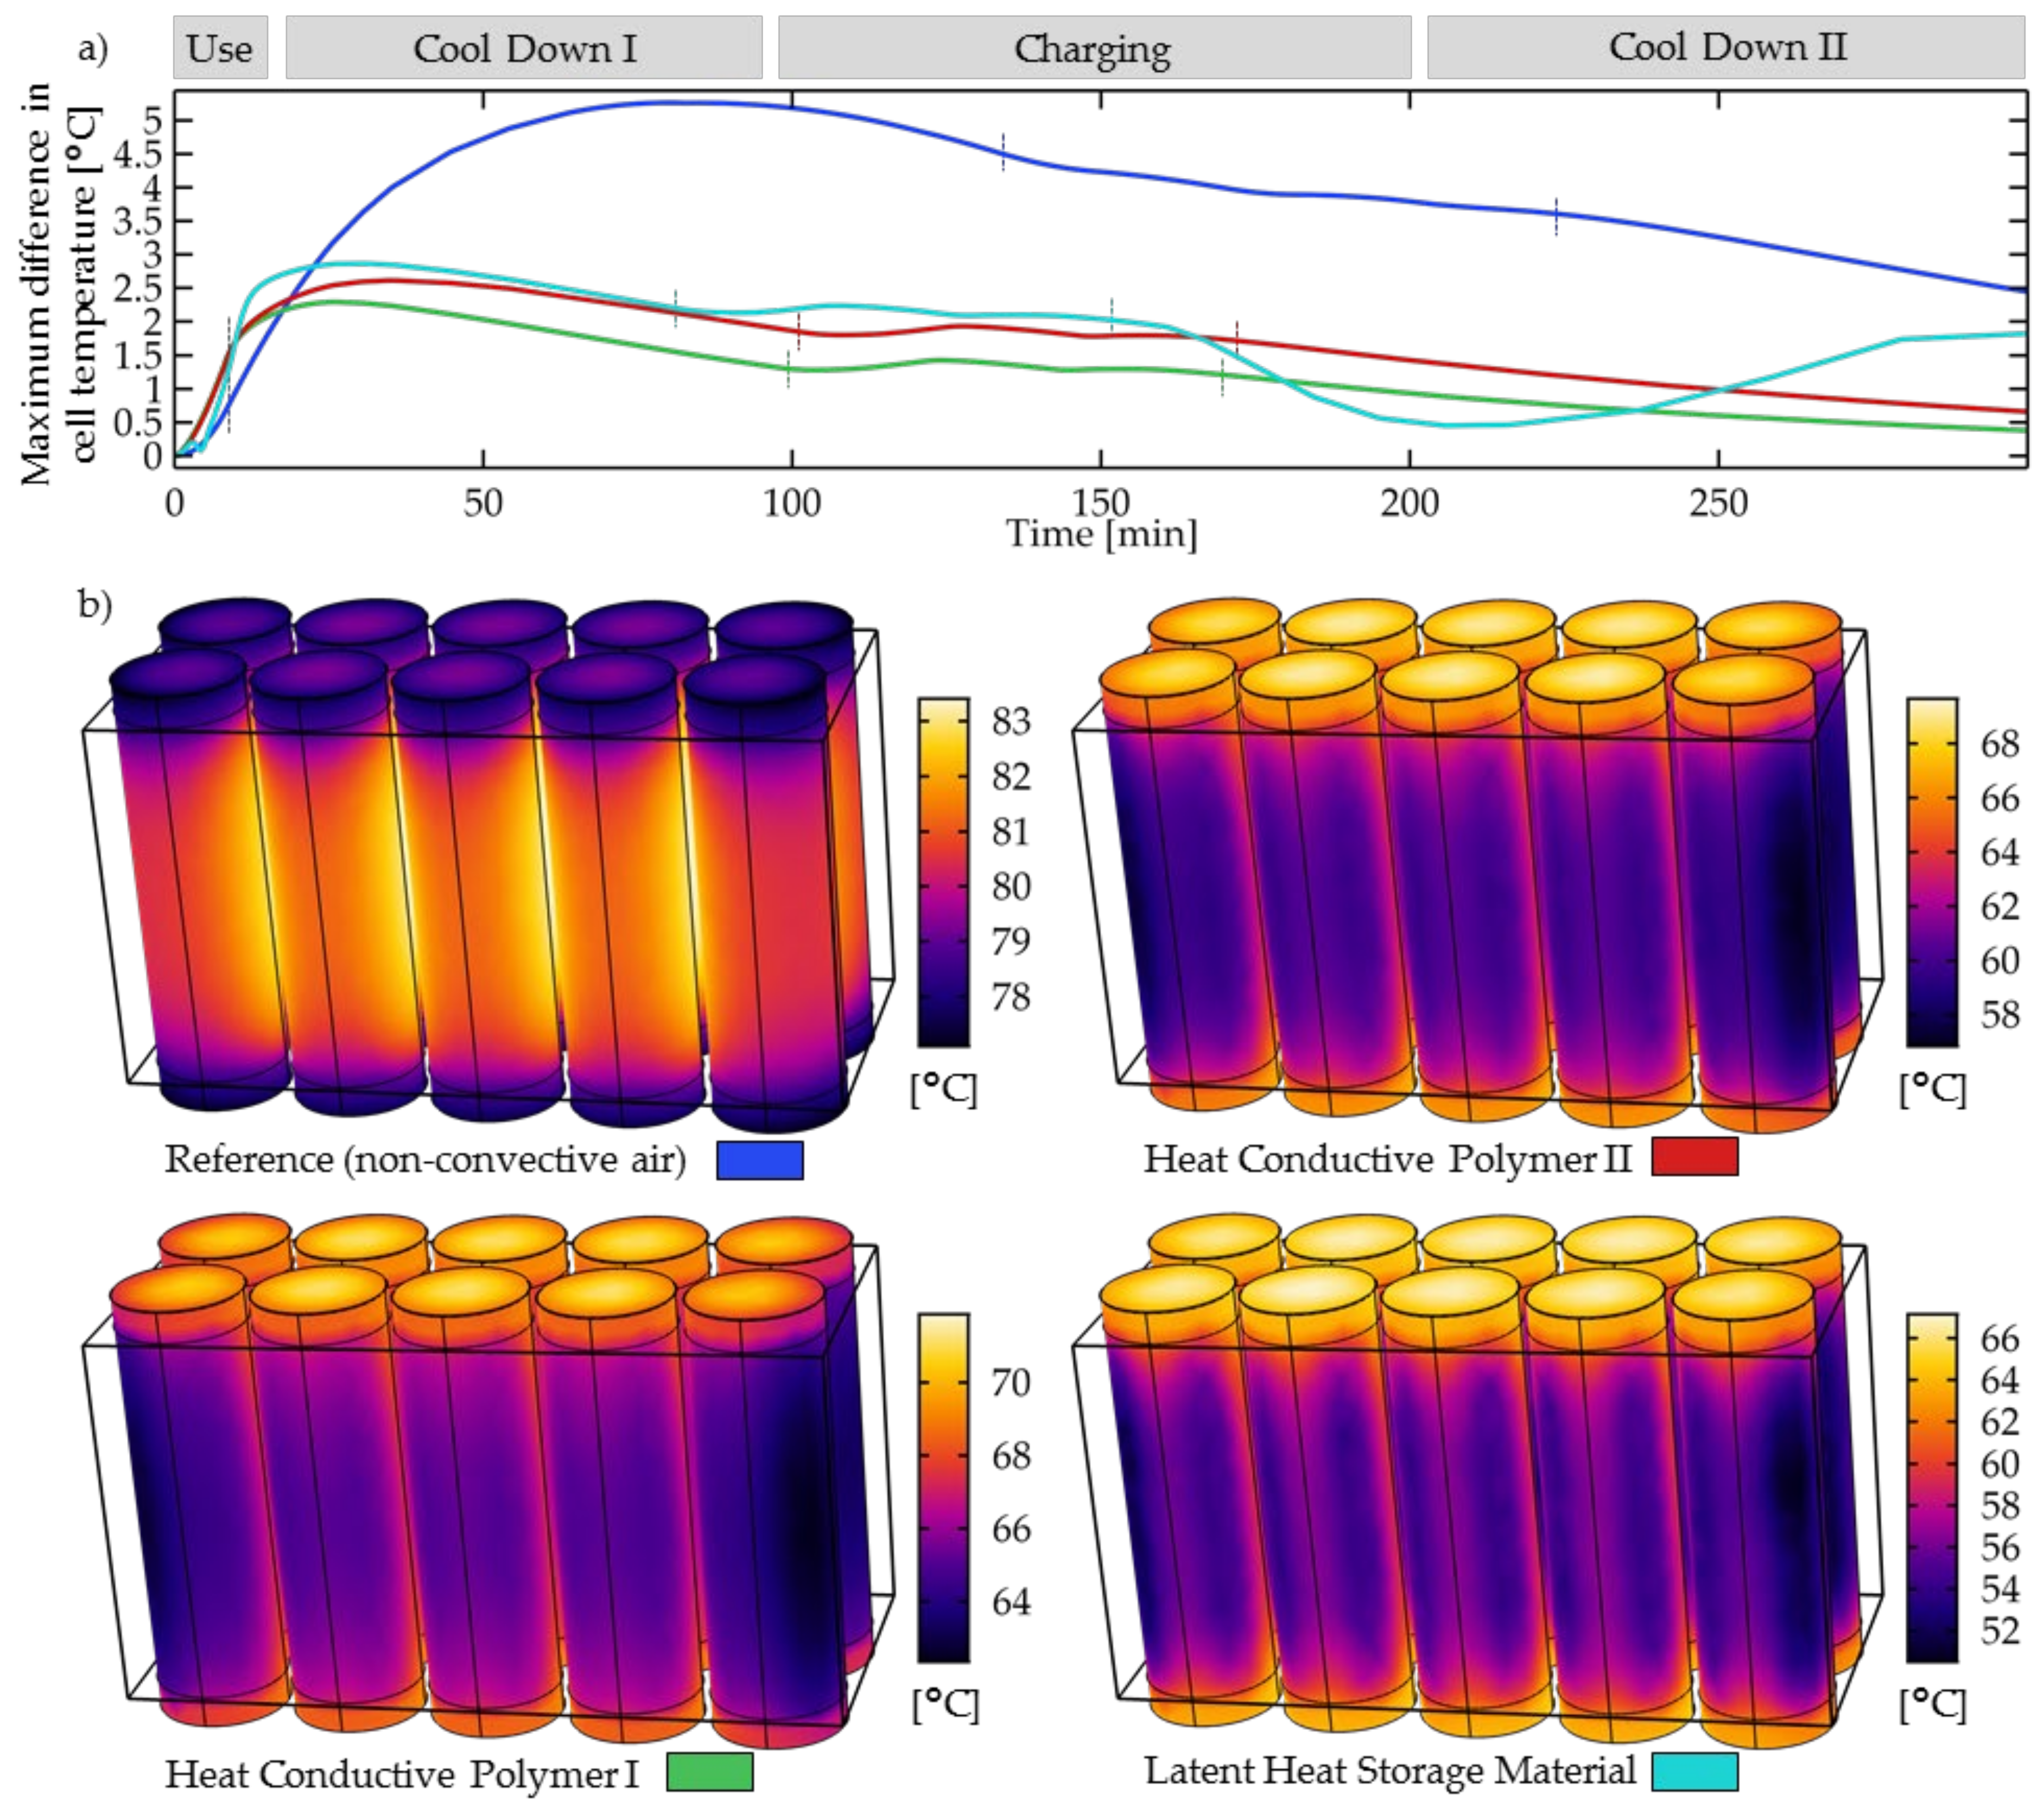
Apart from the average (maximum) temperature of the pack, it is of high importance to keep the temperature differences between the individual cells low. Figure 4 shows the evolution of the maximum temperature difference of the cells in the use/charge cycle for the different investigated materials, as well as the temperature distribution in the cells shortly after the use phase.
For all of the cooling materials and phases used, the cells are cooler at the corners than at the center (Figure 4a). Compared to the reference, all the solid cooling materials significantly reduce the maximum temperature difference in the cells. Shortly after the maximum temperature is reached, the temperature difference is the highest. The difference is 2.4 °C for heat-conductive polymer I, 2.6 °C for heat-conductive polymer II, 2.9 °C for the latent heat storage material (the maximum difference is reached shortly after the start of cool-down phase I for all three materials), and 5.2 °C for the reference (the maximum is reached in the middle of cool-down phase I). During charging, the maximum temperature difference is lower: 4.4 °C for the reference, 1.4 °C for heat-conductive polymer I, 2.0 °C for heat-conductive polymer II, and 2.3 °C for the latent heat storage material. As heat-conductive polymer I has the lowest temperature difference, high thermal conductivity and a low thermal mass are most likely beneficial for good temperature homogeneity in the cell pack. During the phase change of latent heat storage material, the temperature difference is significantly reduced, indicating the highly beneficial influence of the phase change on the temperature homogeneity.
Figure 4b, which highlights the temperature distribution in the cells, clearly illustrates the cooling effect of the solid cooling materials, as the parts of the cells in contact with the cooling materials (the central part within the cube) are lower than the heads of the cells not in contact with the cooling materials. The cooling materials take up the heat produced in the cells, and therefore, the parts in contact with the materials are cooler than the parts not in contact, for which the cell surface temperature is set by the thermal mass of the cells and the conductive heat transfer is at the surface only. The temperature difference between the head with no contact and the central part of the cells indicates that it might be beneficial for the temperature homogeneity to design the pack in a way that the cooling material totally encapsulates the cells, leaving no free heads with no contact to the cooling materials.

3.3. Influence of Ambient Conditions—Surrounding Temperature and Ventilation (Parameter Sweep Study)

The performance of cooling systems is heavily influenced by the climatic conditions in which power tools are used. To evaluate two of the main factors, ambient temperature and ventilation (i.e., the convection coefficient in the model), a parameter sweep (variation in one single input parameter while keeping all other parameters constant) was conducted varying these two parameters (Figure 5). The study was performed for the whole cycle using heat-conductive polymer I as the cooling material.

3.3.1. Influence of Ambient Temperature

The ambient temperature (AT) has a strong influence on the use/charge cycle, as highlighted in Figure 5a with the simulated ambient temperatures of 10, 20, 30, and 40 °C. At all ambient temperatures, the cell temperature quickly rises during the use phase to 70.8 °C (10 °C AT), 71.6 °C (20 °C AT), 72.4 °C (30 °C AT), and 73.1 °C (40 °C AT), the maximum temperature.
At low temperatures (10 °C AT), the cooling system can handle the created heat well and quickly cools down to the charging start temperature, which is reached after 68 min. During the charging process, the temperature slowly increases, but the cell stop temperature is not reached. The cells are fully charged without interruption after 119.5 min (with a charging time of 51.5 min). The maximum temperature after use was 70.8 °C.
Moderate temperatures (20 °C AT) lead to a maximum temperature of 71.6 °C, and the charging start temperature is reached after 85 min. The configuration just misses the threshold to charge without interruption—with one interruption, the fully charged state is reached after 153 min (a 68-min charging time).
Higher ambient temperatures of 30 and 40 °C significantly reduce the effectivity of the convective heat transport from the surface of the battery pack. As a consequence, the packs cool down slower, and the charging start temperature is reached after 87 and 135.5 min. During charging, the cells heat up quickly, and the stop temperature is reached once (30 °C, AT) and three times (40 °C AT) until the cells are fully charged after 159 min and 291 min (79.5 and 179 min charging times), respectively. Obviously, the charging process is significantly prolonged. However, the maximum temperature after use is only few degrees higher (72.4 and 73.1 °C) than that at lower ambient temperatures. This underlines the strong influence of the thermal mass of the cooling system on the maximum temperature. The ambient temperature is of minor significance, at least at low convection coefficients.

3.3.2. Influence of Air Movement Around the Pack

The convection coefficient (Figure 5b) was varied in the typical range of free, non-forced convection between almost no air movement (1 W/m2 K) and a strong wind (20 W/m2 K). For a high level of air movement (10 and 20 W/m2 K), the heat is very quickly dissipated by the surface, and the pack temperatures are low during use (70.5 and 68.1 °C) and even decrease during charging for 20 W/m2 K. This demonstrates that the heat transfer ability of the cooling system is able to transport the created thermal energy during charging if the pack surface is sufficiently cooled. The fully charged state is reached without interruption after 106.5 and 84.5 min. A low level of air movement leads to higher temperatures and a significant prolongation of cool down and charging. At 5 W/m2 K, a maximum temperature of 72.3 is reached, and the charging is interrupted once. The pack is fully charged after 169.3 min. Regarding 1 W/m2 K, the heat dissipation by the surface is very limited, and the pack heats up quickly during charging (73.6 °C), mainly governed by the heat capacity of the material. The cool-down phase is very slow. The charging start temperature is reached after 437 min, and the charging process is interrupted several times because the stop temperature is reached. The pausing interval is also prolonged by the slow cool-down speed. The fully charged state was not reached within the simulated maximum time of 500 min.

3.3.3. Summary (Parameter Sweep)

Both investigated factors, the ambient temperature and convection coefficient, have a strong influence on the performance of the cooling system. For designing an adequate cooling system, it is therefore strongly recommended to have a detailed look at the conditions in which the system shall be used. As the effect of both factors on the performance is contrary, a hot environment (a high ambient temperature) could be compensated for by high ventilation (e.g., forced ventilation by the charging unit), and low ventilation could be compensated for by placing the charging unit in cold or cooled surroundings. Comparing the two factors within the investigated ranges, the convection coefficient has a higher impact than the ambient temperature. The influence on the maximum temperature is small. The recommendation by the cell manufacturer to keep the cell pack at lower than 80 °C during the use phase (discharging) was fulfilled for all the configurations.
Looking at the governing material properties, it can be noted that at low convection coefficients and high ambient temperatures, the heat dissipation by the surface is very limited; thus, the heat capacity of the cooling material is of high importance. At high convection coefficients and low ambient temperatures, by contrast, the heat transfer ability of the cooling material is the governing material property, and the heat capacity is of lower significance.

4. Conclusions

A simulation model for evaluating the performance of handheld power tool battery pack cooling systems with passive cooling was established, highlighting the performance of three different solid cooling materials in a typical use/charge cycle, as well as assessing the influence of different ambient conditions.
  • Due to its ability to quickly absorb high amounts of thermal energy, the latent heat storage material performs best during the use phase (discharging) followed by heat-conductive polymer II with a high heat capacity. The maximum temperature is reduced up to 26% and is for all the solid cooling materials below the maximum temperature of 80 °C allowed for discharging by the cell manufacturer.
  • For the length of the whole cycle until the battery was fully charged (A–C), a shortening of 32% was reached using the latent heat storage material (25% was reached without a phase change using heat-conductive polymer I).
  • The ability to cool down quickly is of high importance for the total length of the cycle, as cooling down comprises up to 56% (till fully charged) and up to 86% (till reaching 26 °C after charging) of the total cycle time. High thermal conductivity and a low heat capacity are beneficial for short cool-down phases. Compared to the reference, a shortening of the cool-down phase I of 42% (28% without a phase change) was achieved with the solid cooling materials.
  • For the charging phase, all the investigated materials fail to transfer away or absorb enough heat to prevent reaching the stop temperature and have to interrupt the charging at least once to cool down back to the start temperature. Comparable total charging times are reached for all the solid materials, which have to be interrupted once for cooling during charging, while the reference has to be interrupted two times. Compared to the reference scenario (the non-convective air), a shortening of the charging up to 23% was achieved using the solid cooling materials. The influence of the differences in the materials properties of the solid cooling materials on the length of the step is only minor. Less often reaching the “stop temperature” during charging proved to be very important for short charging times. Fitting the start and stop temperatures or a temperature-adapted charging protocol, in which the charging current automatically lowers when the cell temperature is close to the “stop temperature” (CC-CT charging), might help shorten charging under different conditions.
  • The temperature homogeneity in the battery pack is significantly lower for the reference than for that of the investigated solid cooling materials. Heat-conductive polymer I showed the lowest total cell temperature differences, and therefore most likely the cell aging will differ the least.
  • By performing a parameter variation study, the strong influence of the ambient temperature and convection coefficient was demonstrated. It is advised to carefully evaluate future use conditions of power tools when designing power tool cooling systems. Active cooling (e.g., by a fan in the cooling unit) or cooling fins might enhance the heat transfer from the pack surface and thus help to reduce the length of the cool-down phases significantly.

Author Contributions

Conceptualization, V.K. (Veit Königer) and V.K. (Volker Knoblauch); methodology, V.K. (Veit Königer) and V.K. (Volker Knoblauch); software, V.K. (Veit Königer); validation, V.K. (Veit Königer); formal analysis, V.K. (Veit Königer); investigation, V.K. (Veit Königer); resources, V.K. (Veit Königer); data curation, V.K. (Veit Königer); writing—original draft preparation, V.K. (Veit Königer) and V.K. (Volker Knoblauch); writing—review and editing, V.K. (Veit Königer) and V.K. (Volker Knoblauch); visualization, V.K. (Veit Königer); supervision, V.K. (Volker Knoblauch); project administration, V.K. (Veit Königer) and V.K. (Volker Knoblauch); funding acquisition, V.K. (Volker Knoblauch). All authors have read and agreed to the published version of the manuscript.

Funding

This research was funded by the German Federal Ministry of Education and Research in the project “Smart Pro: LiMaProMet” grant number 13FH4I02IA. Open Access publication was funded by Aalen University of Applied Sciences and Deutsche Forschungsgemeinschaft (DFG, German Research Foundation)—512645013.

Data Availability Statement

The data presented in this study are available on request from the corresponding author.

Acknowledgments

The authors would like to acknowledge Christian Weisenberger for his advice and help with the experimental work, and Jonas Oehm for proofreading the paper.

Conflicts of Interest

The authors declare no conflict of interest.

Appendix A. Input Parameters for the Cell Model and the Thermal Model

For simulating the cell behavior, the Comsol Lumped Battery Model is used. The input parameters for the model are determined using a combination of measurements carried out at the battery lab at Aalen University and fitting approaches in Comsol. The input parameters are summed up in Table A1, and the initial and boundary conditions in Table A2.
  • OCV
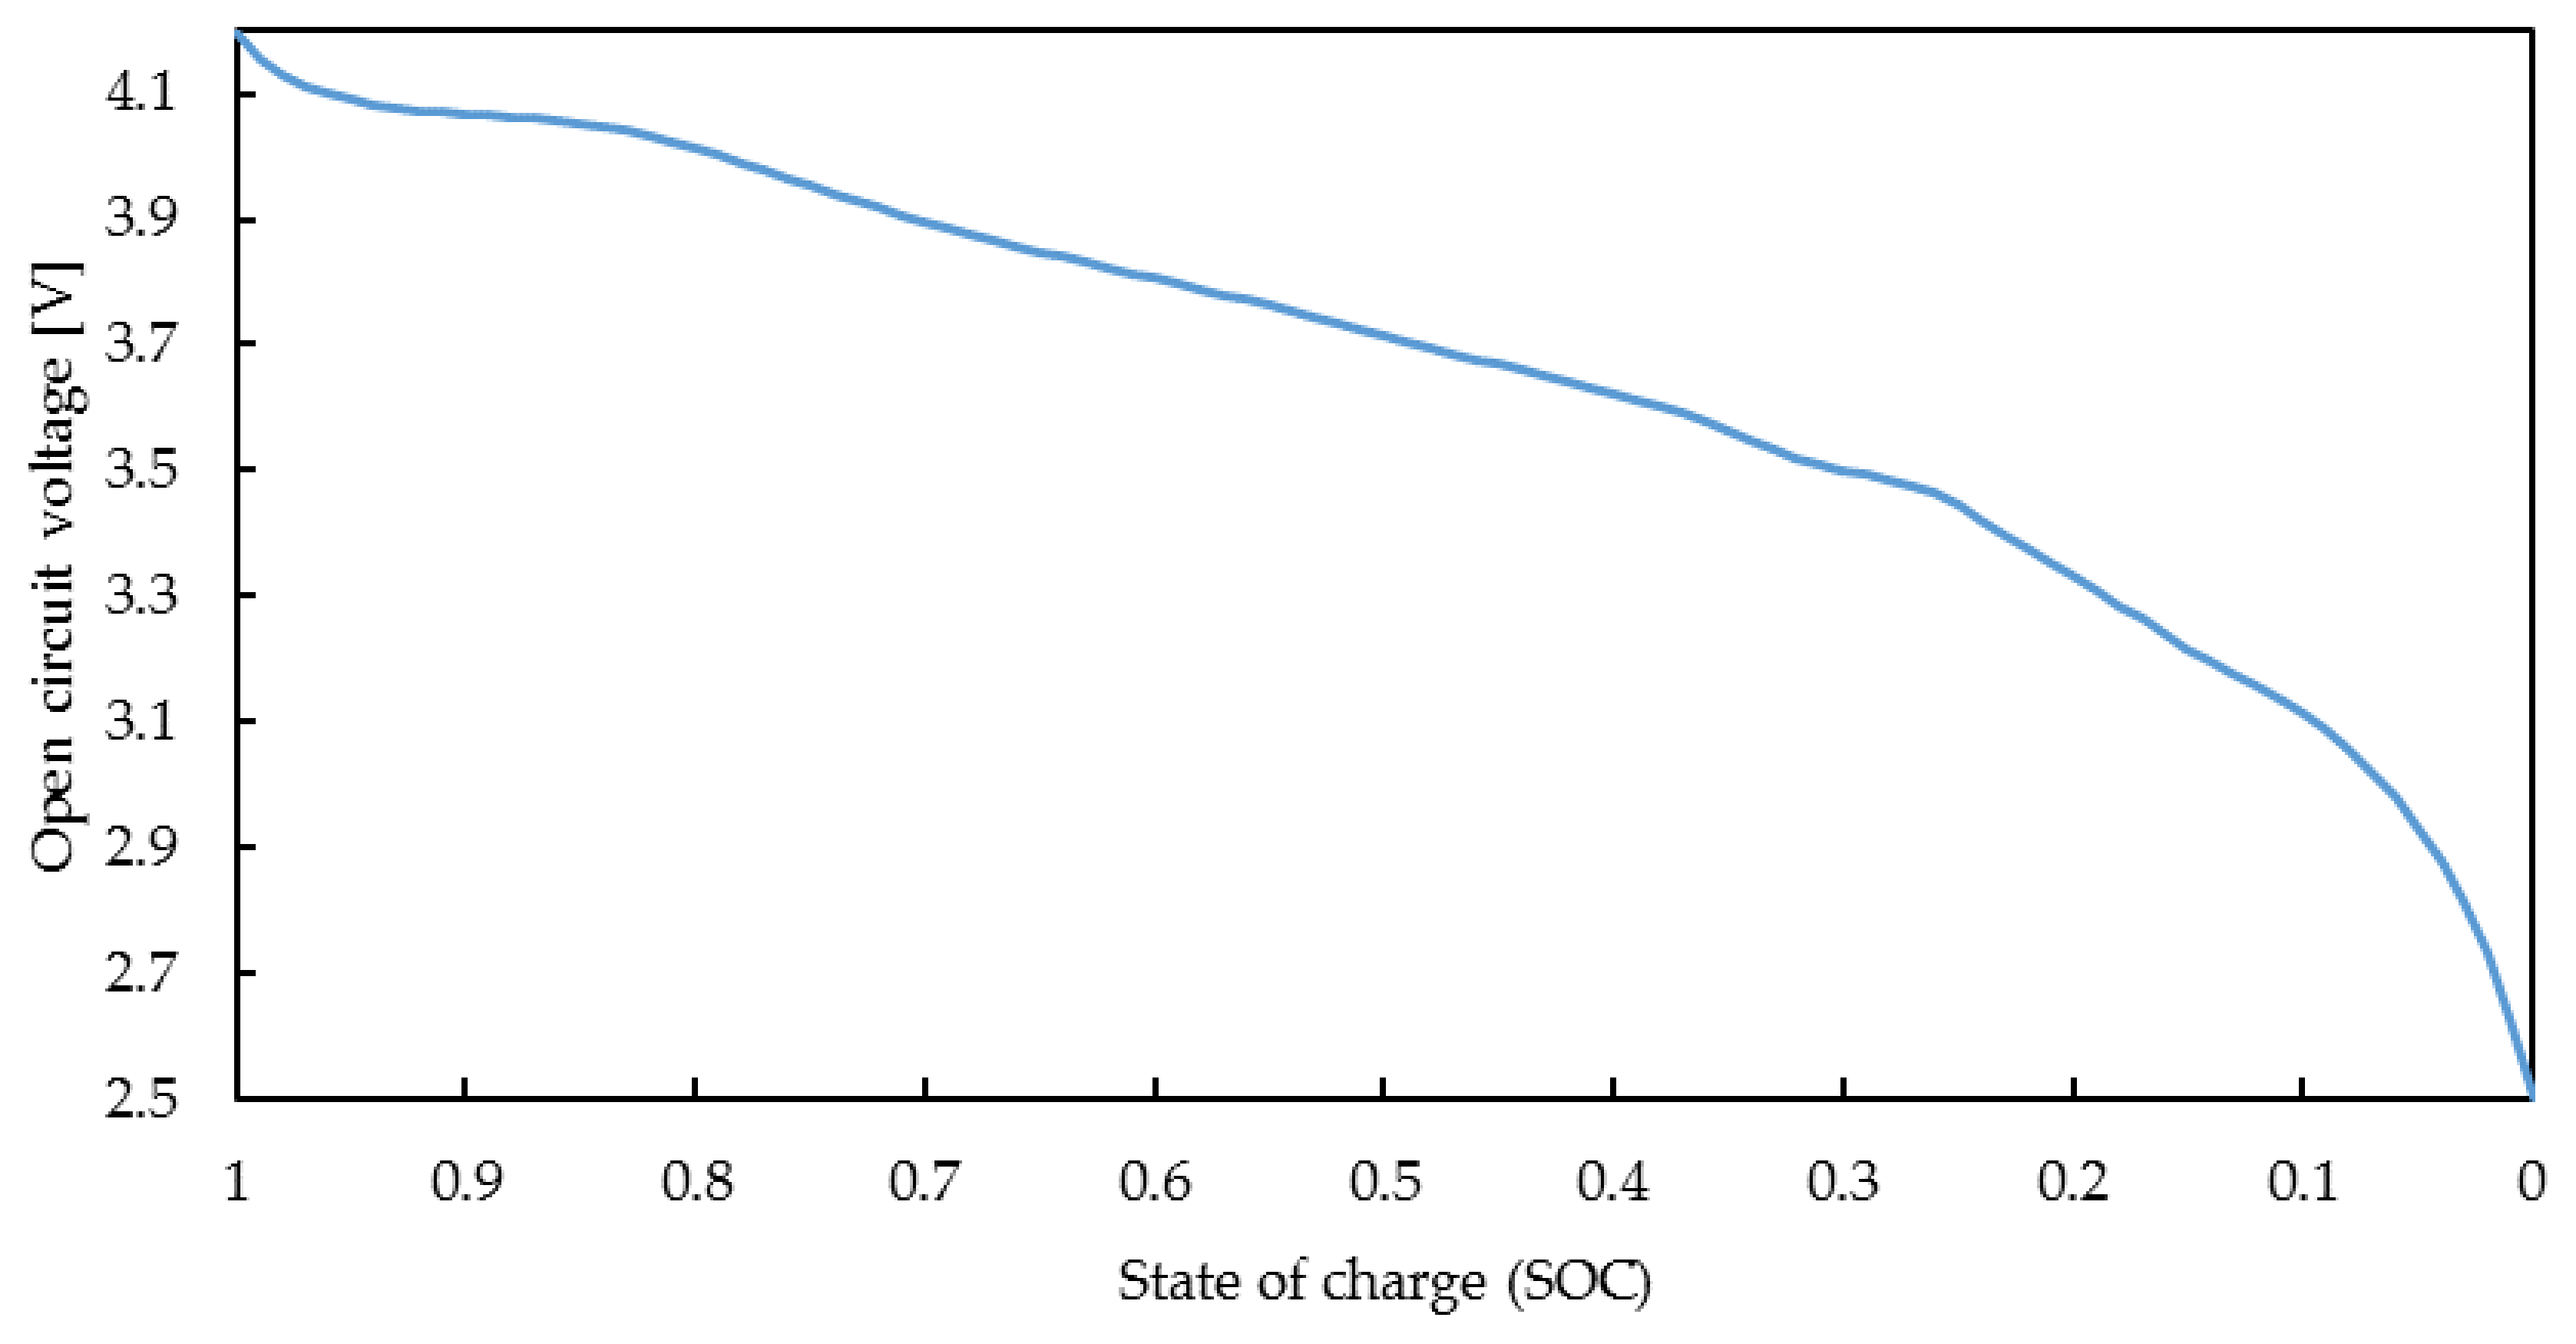
The open circuit voltage (OCV) of the investigated Samsung INR21700-40T was determined by charging and discharging at different currents (C/10, C/5, C/2, 1 C) and adding voltage losses to the measured curves. The voltage losses were calculated using state of charge (SOC)-dependent resistances and charging/discharging currents. Measurements were performed at different temperatures to assess the temperature dependency of the OCV. For the OCV-curve used, see Figure A1.
  • Cell Capacity
The cell capacity was measured by performing charging/discharging at C/40 (charging and discharging current of 0.1 A) at 25 °C.
  • Temperature Derivative of Open Circuit Voltage (dE/dT)
Determined by changing temperatures (5 °C/20 °C/50 °C) at different SOC values while measuring the change in voltage. A fitting approach within the Comsol cell model was used to adapt the measured values to better fit the cell heat production at different C rates (see voltage losses).
  • Voltage Losses
The Comsol lumped battery model uses “ohmic overpotential”, “activation overpotential”, and “concentration overpotential” to simulate the voltage losses due to ohmic resistance, electrochemical reaction at the electrode/electrolyte interface, and concentration differences during discharging and charging.
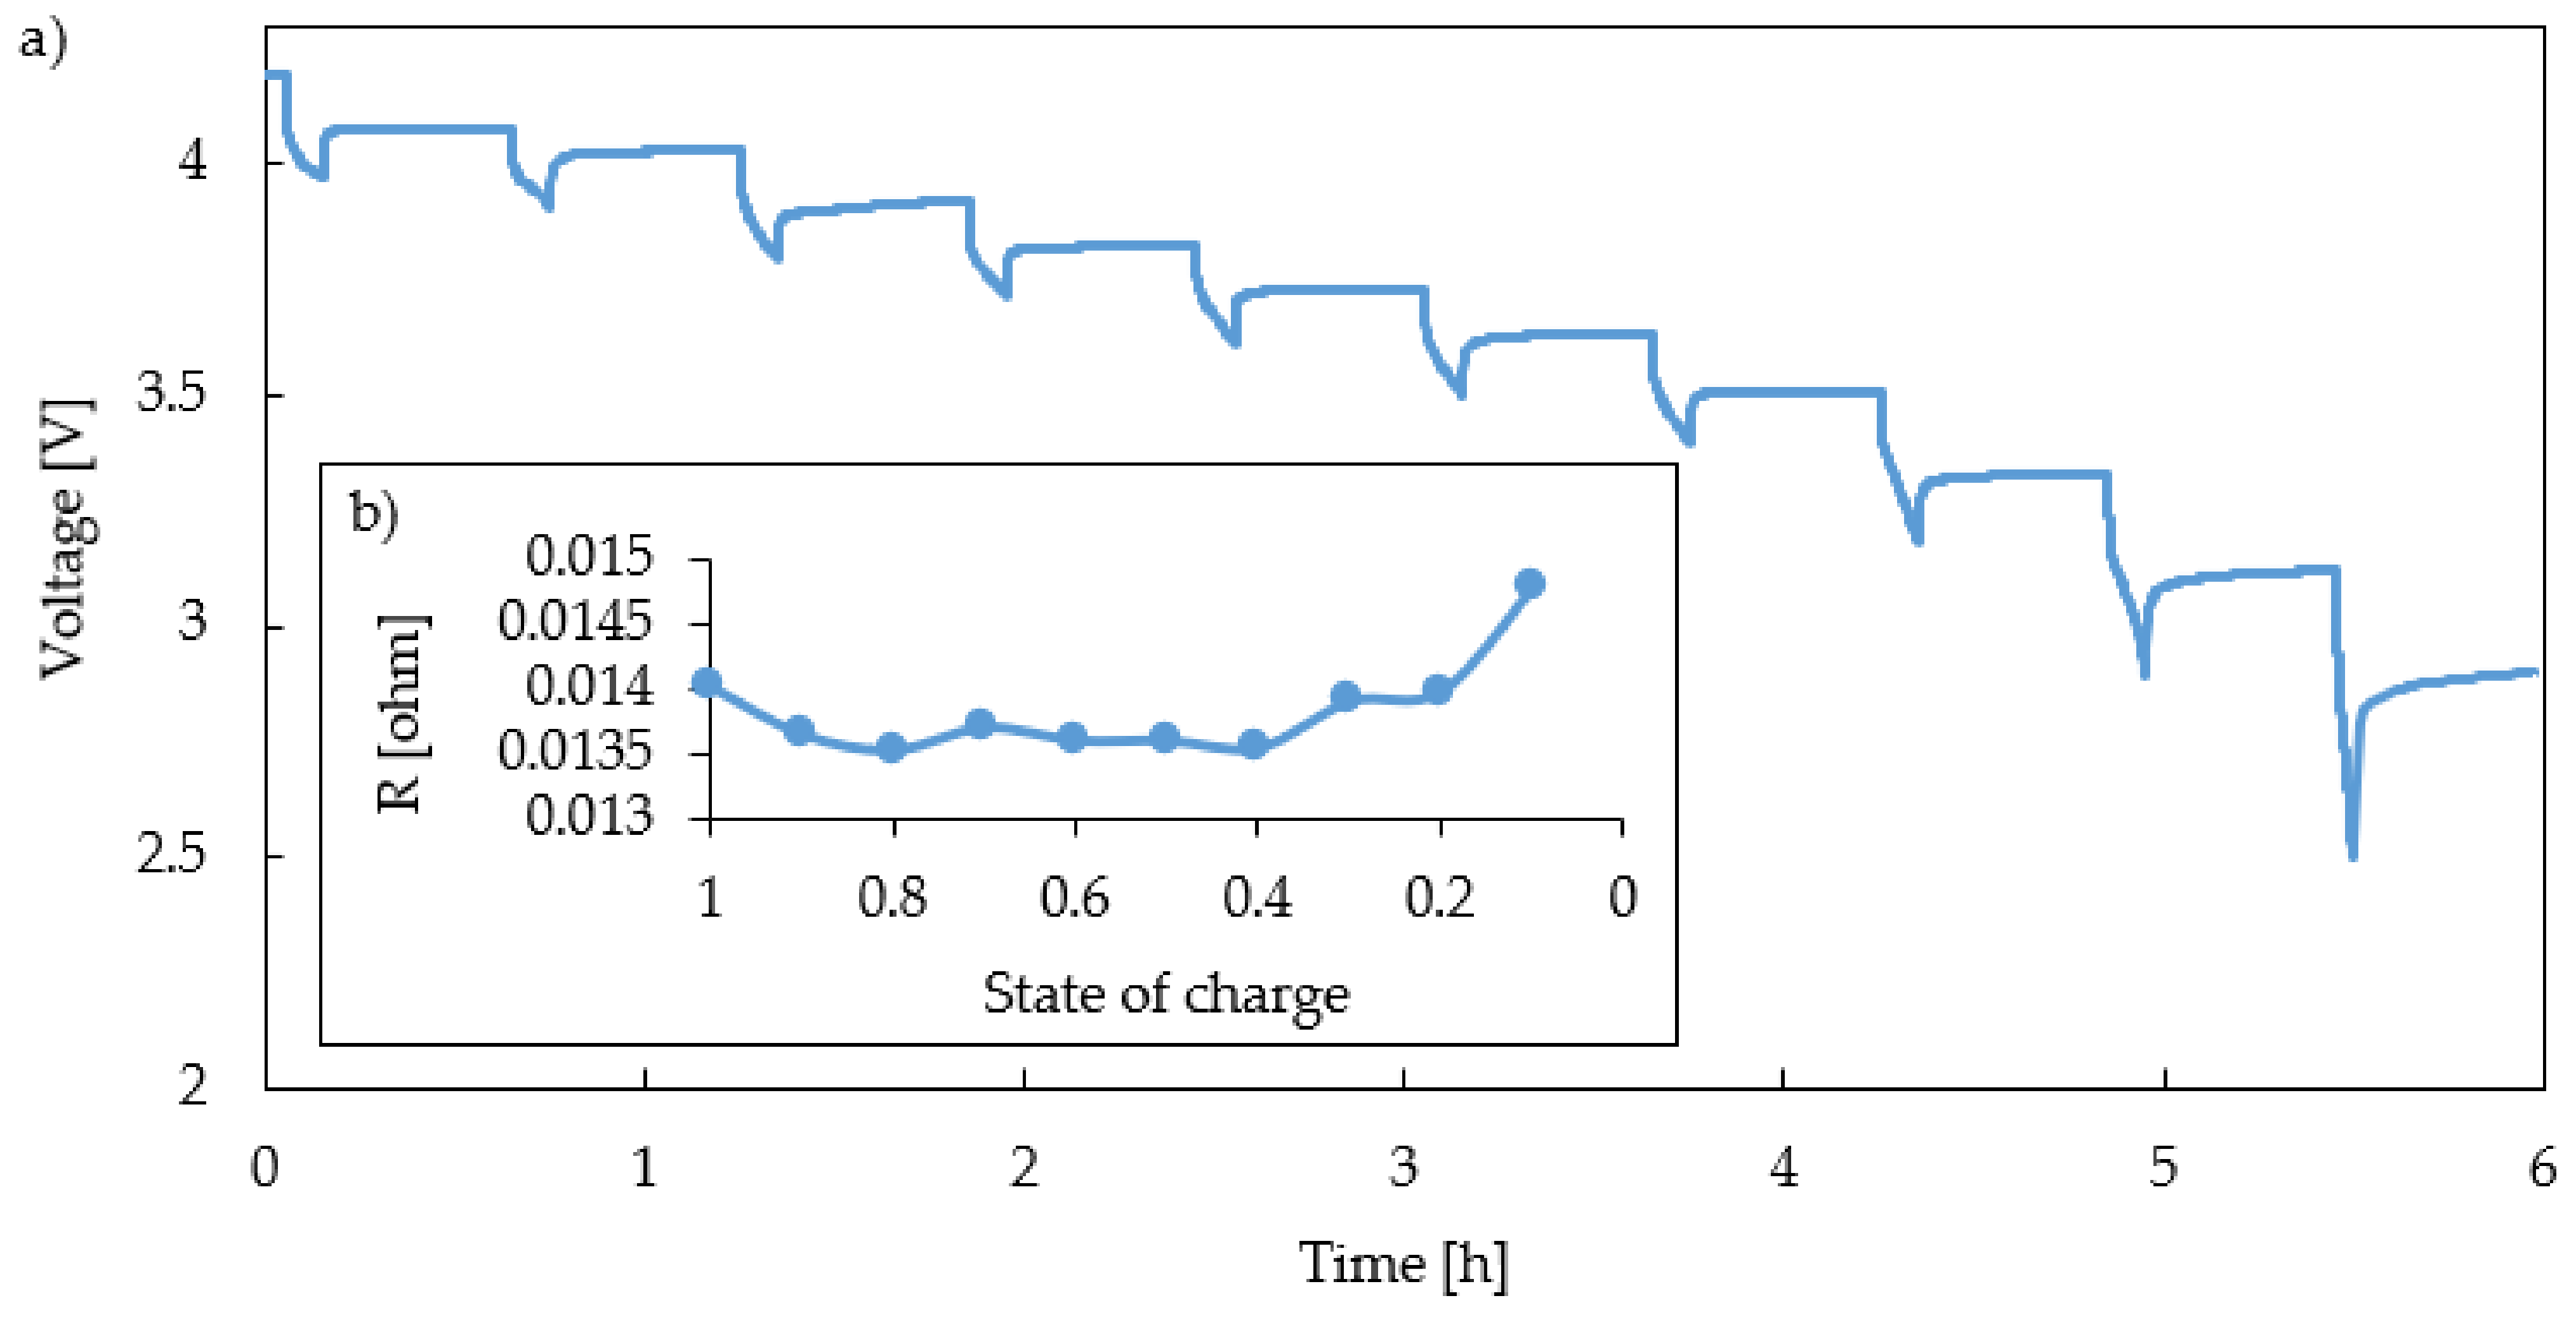
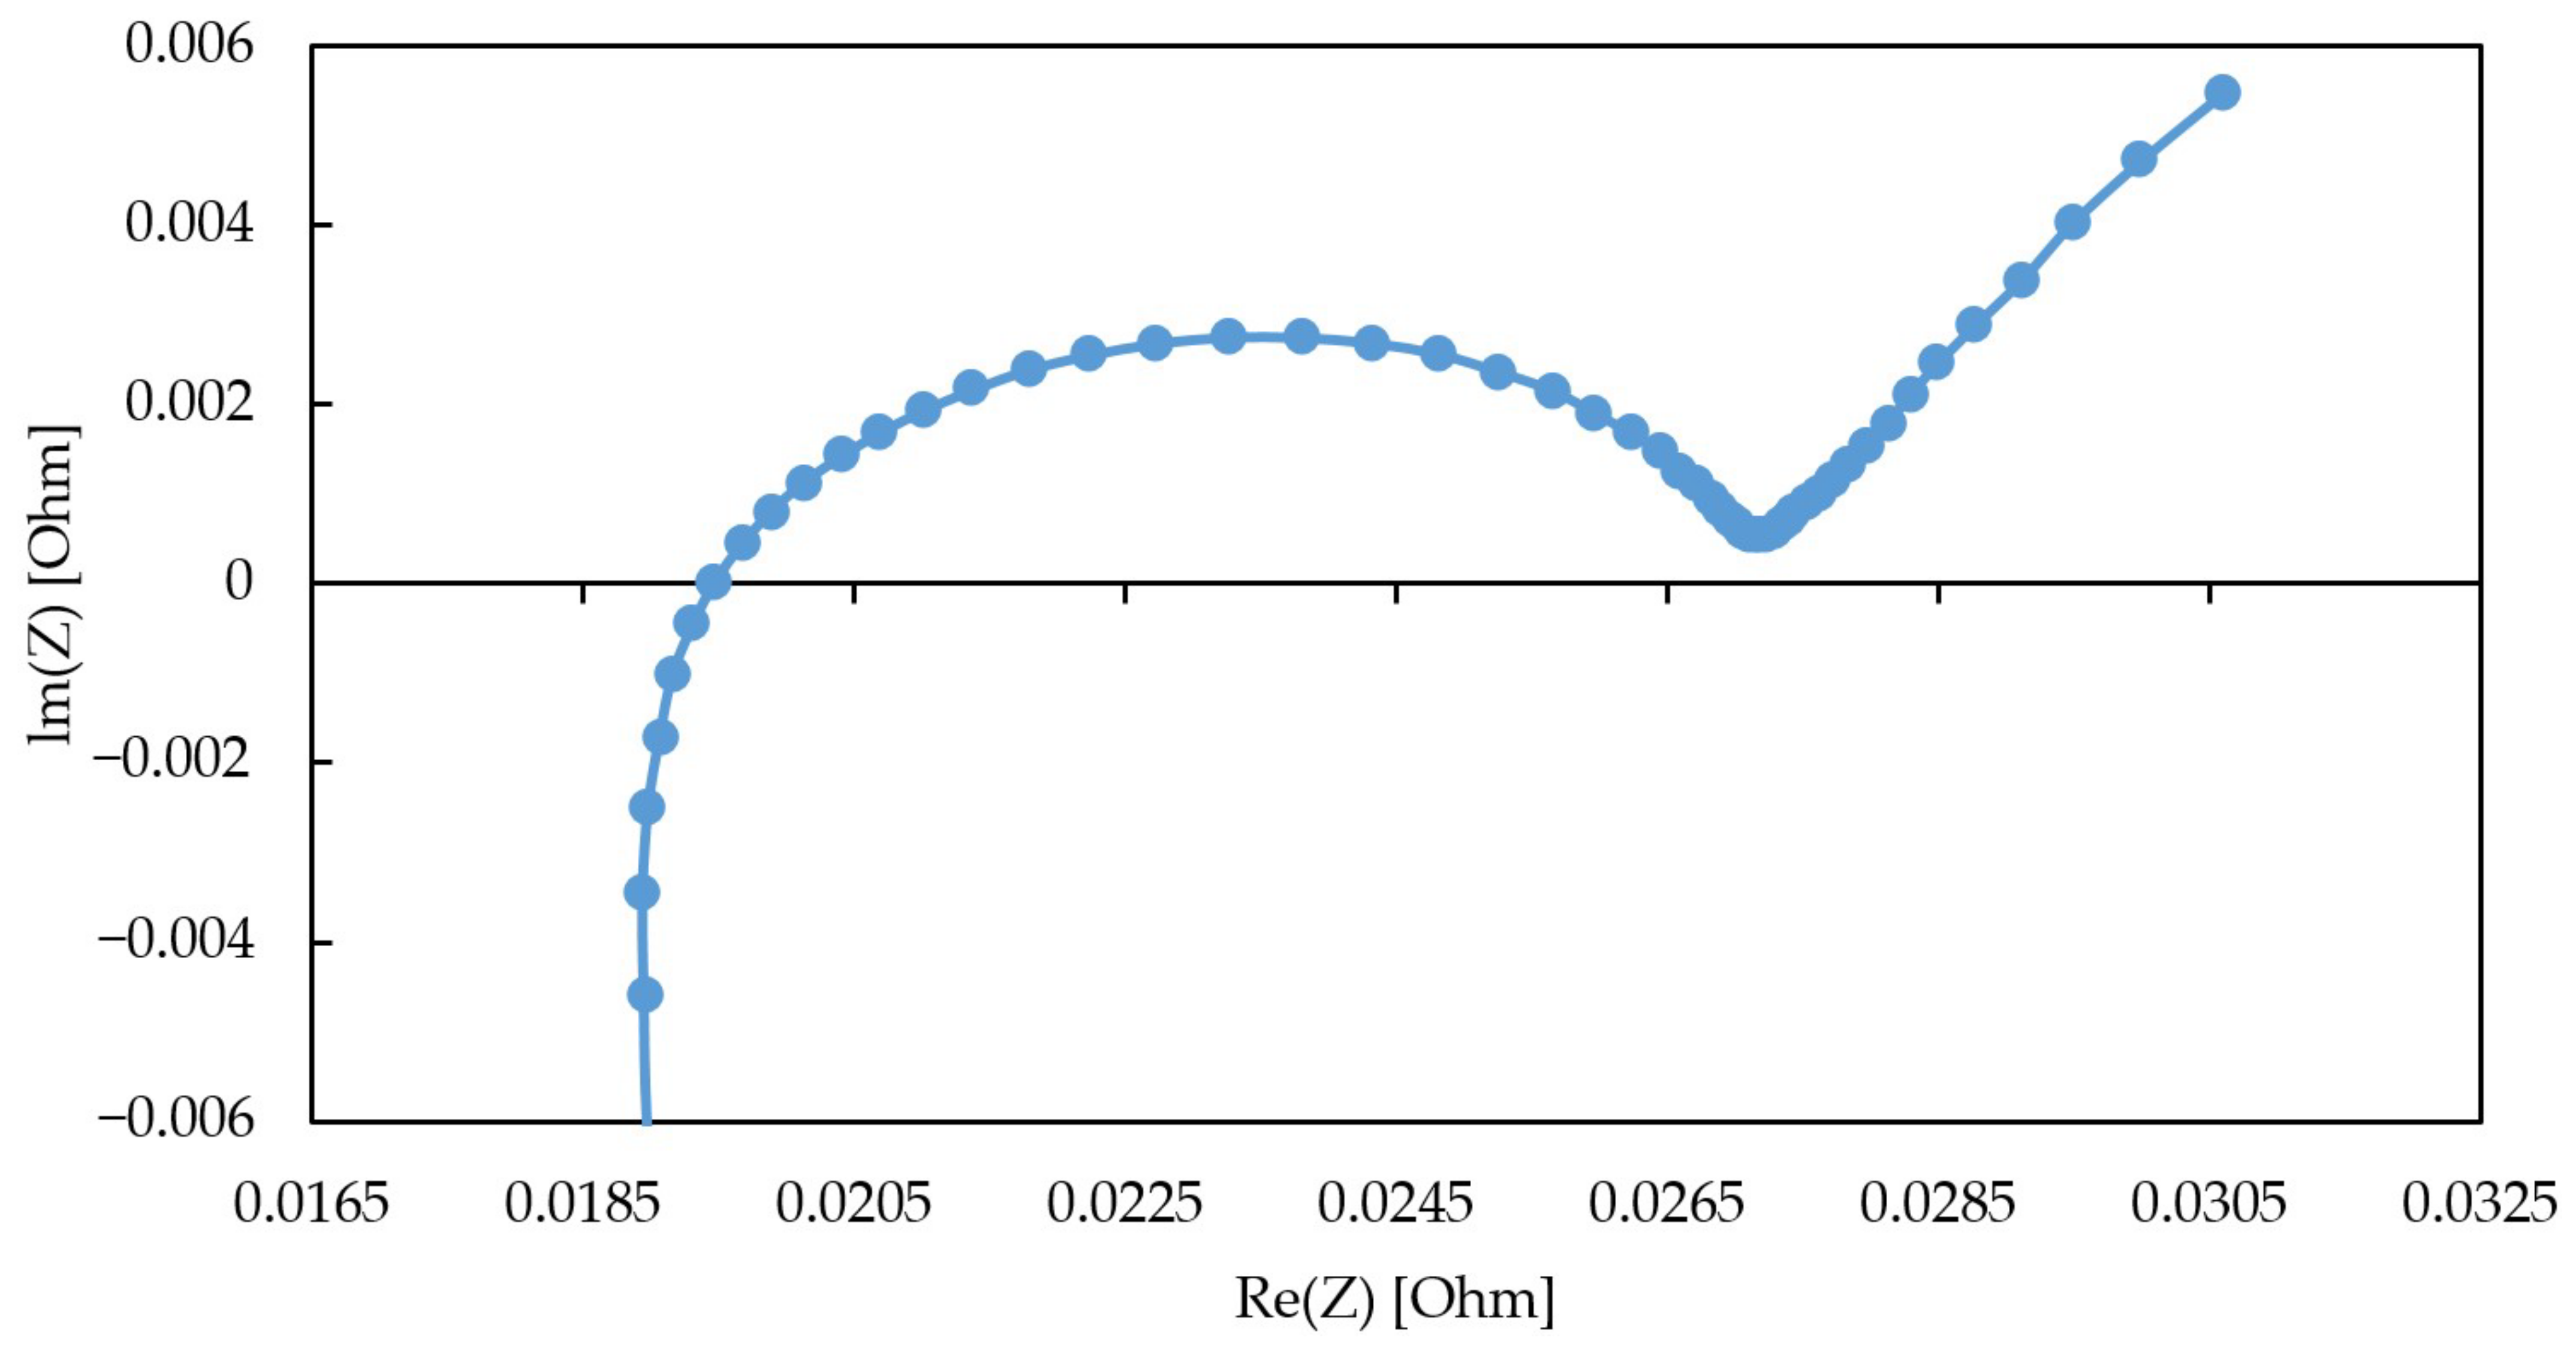
Ohmic overpotential is represented by the ohmic resistance of the cell. It was measured by EIS measurements (see Figure A2) and discharge pulses (pulsed discharge test, see Figure A3) at different SOC values. The measured ohmic resistance was used as a starting value for optimization. For the activation overpotential (input parameter: Dimensionless charge exchange current “1”) and concentration overpotential (particle diffusion, diffusion time constant “1000 s”, spheres with linear distribution Nel 10 and Nord 1), the Comsol default values were used as starting value for optimization.
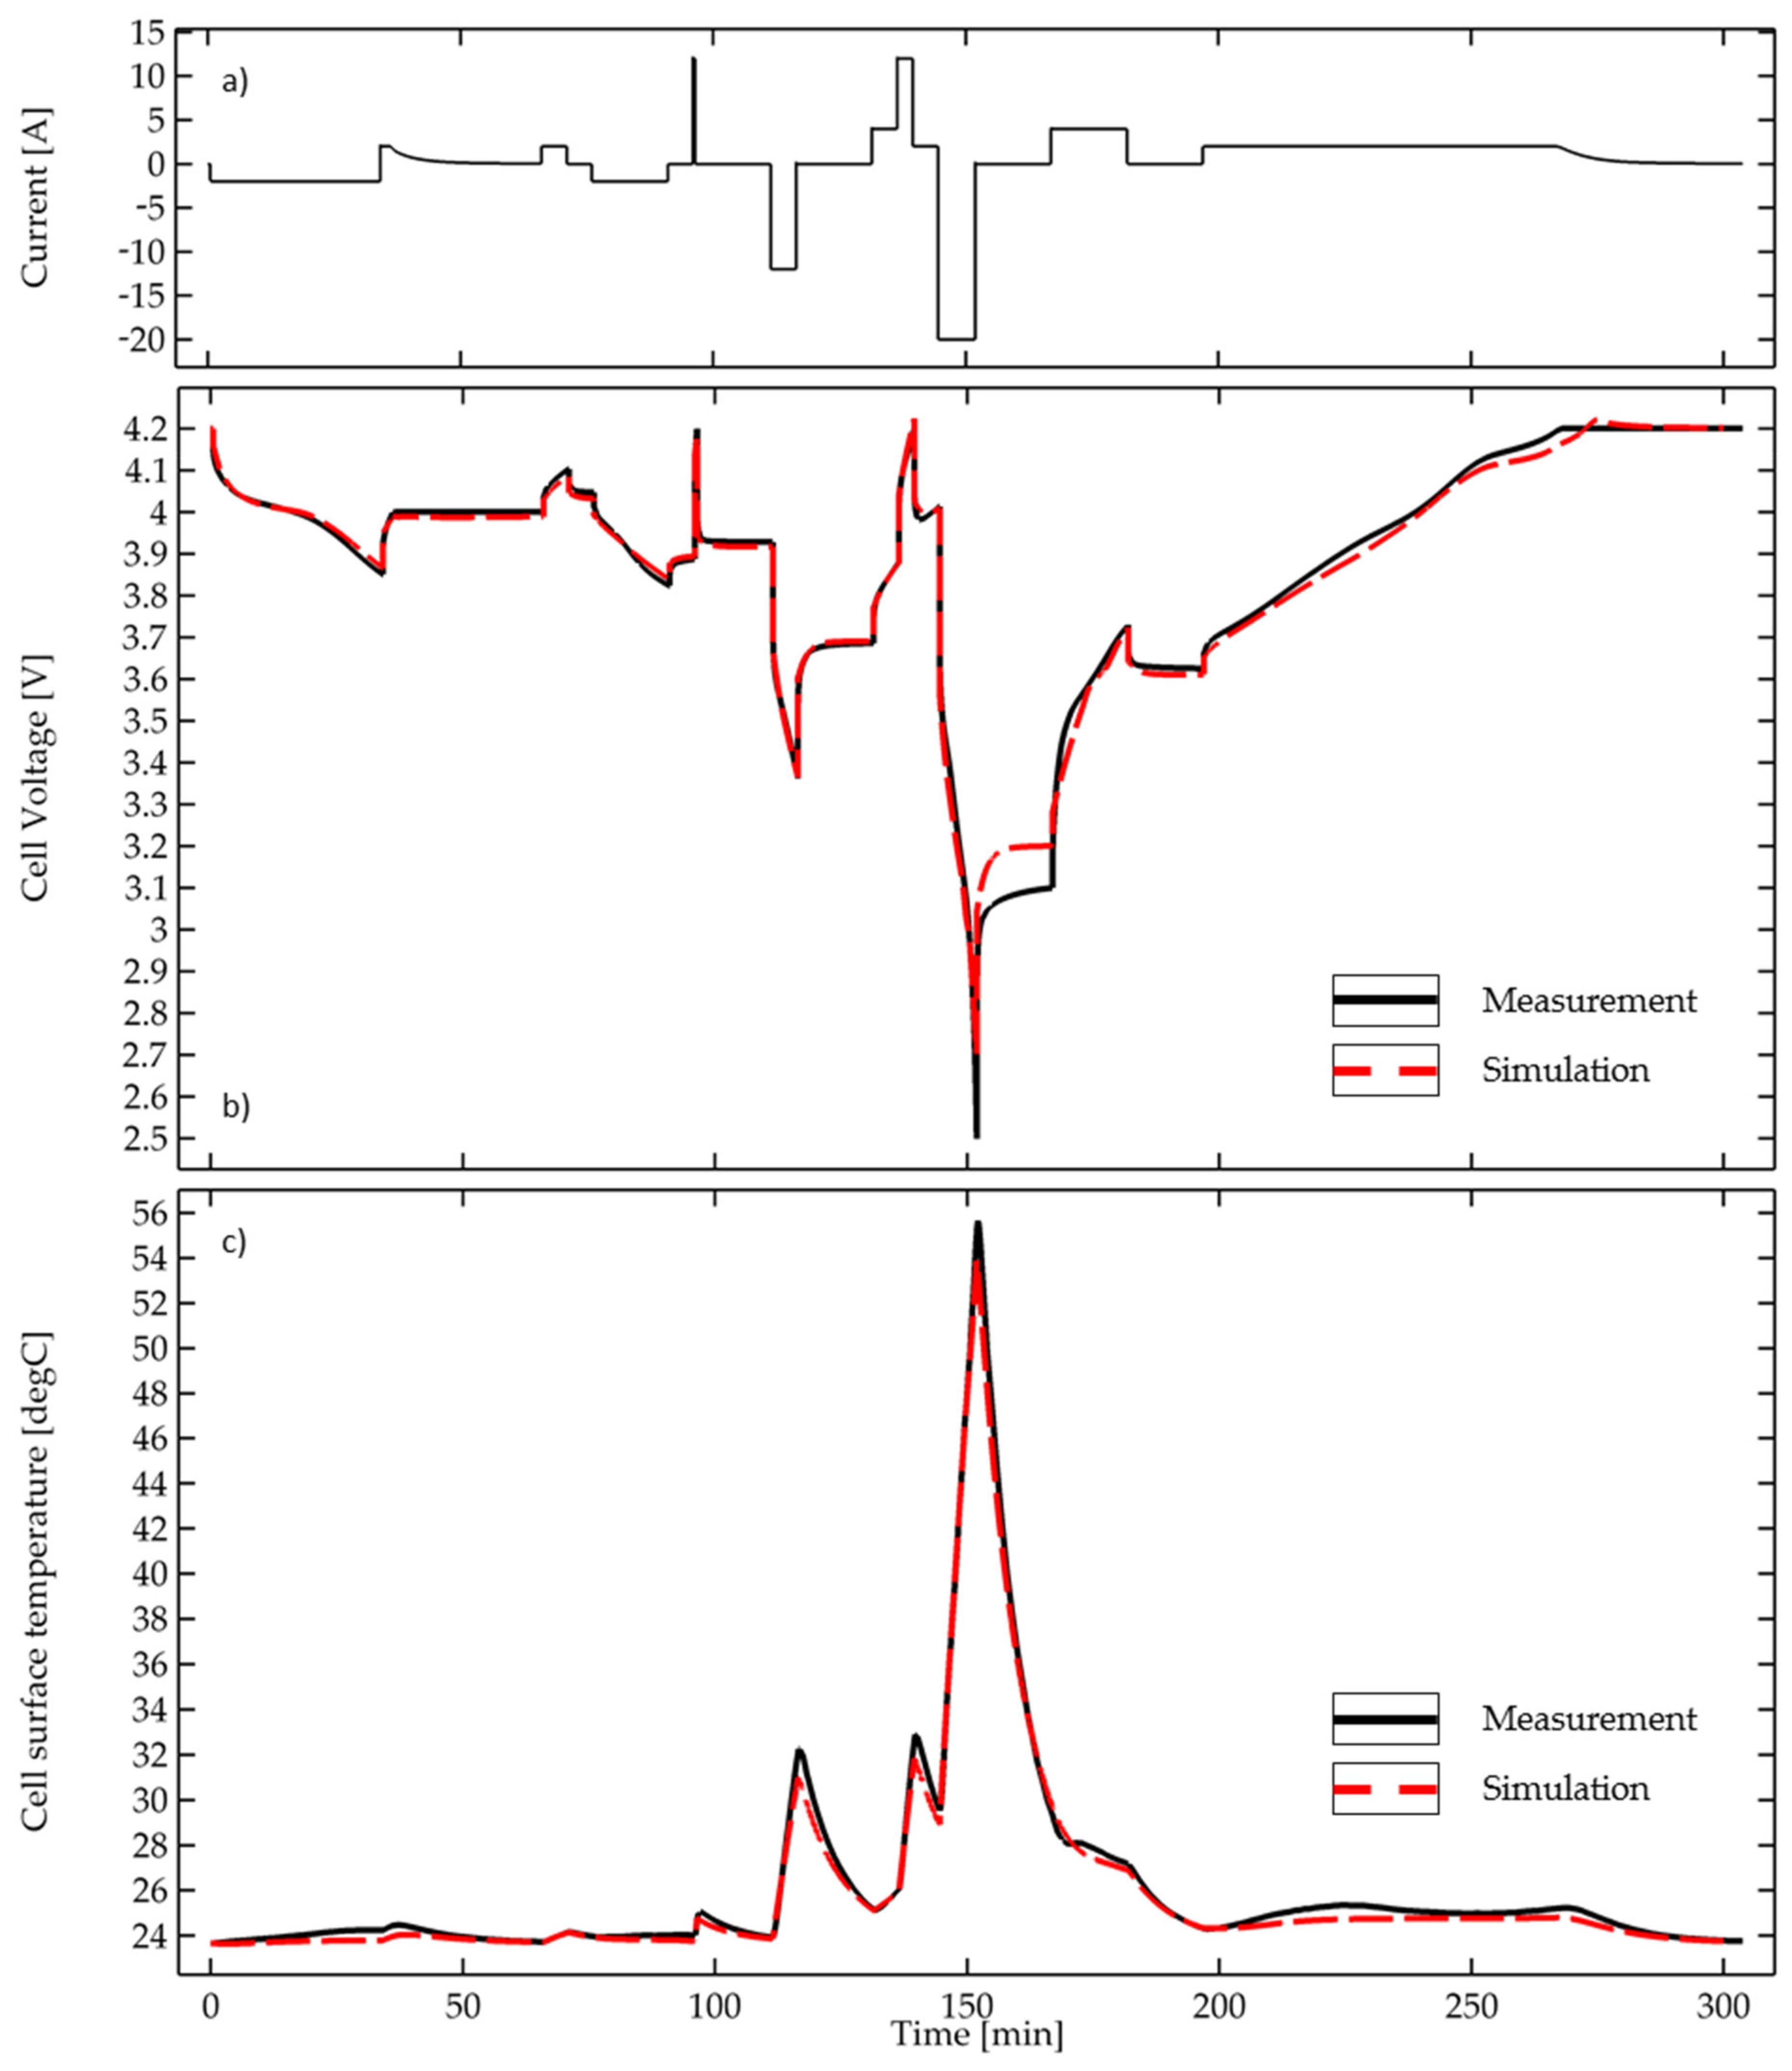
Input parameters were adapted by using the optimization module in Comsol to fit experimental measured discharge curves (0.5 C, 1 C, 5 C) in the cell model. A reasonable agreement of the simulation and experimental data was achieved in terms of electrochemical behavior (see Figure A4).
  • Cell Thermal Material Properties
The thermal material input parameters are the thermal conductivity, density, and heat capacity of the cell. To simplify, the battery cell was simulated as a homogeneous thermal body with averaged material properties. To assess the thermal properties of the cell, our approach consisted of (a) determining starting values and (b) optimizing these values by a fitting approach in Comsol.
The starting values were calculated by adding the thermal properties of the electrode and casing materials balanced by their layer thickness. The layer thickness was determined assessing the computed tomography scans of the cells.
Optimization was carried out using measurements and a simulation of a single cell in a well-defined thermal surrounding during discharging at different C rates.
A reasonable agreement of the simulation and experimental data was achieved in terms of thermal behavior (see Figure A4).
Table A1. Input parameters used in the cell model of the Samsung INR2170040T cell.
Input Parameter 1UnitMeasurementLiteratureOptimization in ComsolValue Used in Cell Model
Cell capacityAh4.1 4.074.07
Ohmic overpotential at 1 CmV55 2/77.6 354.4 [49]72.7172
Charge exchange current--1 [48], 5.5 [50]2.42.4
Diffusion time constant R2/C2mV/C 100031.775/101.8431.7/101
Density (cell)kg/m32887 42000/
2615.7 [51]/
2560 [52]/
2453 [53]
-2887
Heat capacity (cell)J/kgK952 41060 [54]/
1605 [51]/
1000 [52]/
1009 [53]
1185.91256.7
Thermal conductivity (cell)W/mK0.87 43 [51]/1 [52]/
1 [53]
0.864360.87
1 For temperature- and SOC-dependent parameters, values at 25 °C and SOC of 0.5 are given in the table; 2 Pulsed discharge test; 3 Impedance Spectroscopy; 4 Lumped value calculated based on microstructural investigations and properties of the individual materials [55].
Figure A1. Open circuit voltage of Samsung INR21700-40T used for cell simulation.
Applsci 13 08848 g0a1
Figure A2. (a) Pulsed discharge to measure overpotentials, 1C discharge pulses, Samsung INR21700-40T at 25 °C. (b) Ohmic resistance at different SOC.
Applsci 13 08848 g0a2
Figure A3. Impedance spectra of Samsung INR21700-40T at 4.45V and 25 °C.
Applsci 13 08848 g0a3
Figure A4. Comparison of measured and simulated cell voltage of a single Samsung INR21700-40T cell during charge and discharge at different rates. Agreement of measurement and simulation was achieved by optimization of model input data. (a) applied current, (b) cell voltage, (c) cell surface temperature.
Applsci 13 08848 g0a4
Table A2. Initial and boundary conditions used in the cell and thermal model.
Battery Model
cell typeSamsung INR 21700 40T
number of cells20
initial state of charge (SOC)1
discharge current/cell (use phase)25 A
charging current/cell5 A
thermal model
initial temperature of cells and cooling system25 °C
convection boundary condition at the cooling system surface
convection coefficient5 W/m2 K
temperature25 °C

Appendix B. Simulation Equations

Table A3 sums up the main equations used in the simulation of the battery and the heat transfer.
Table A3. Governing equation and boundary conditions used in the battery and heat transfer models.
Formula
Battery simulation:Comsol lumped battery model
Battery cell voltage E C e l l = E O C V S O C , T + η o h m + η a c t + η c o n c
Open circuit voltage E O C V S O C , T = E O C V , r e f S O C + T T r e f δ E O C V S O C δ T
Ohmic voltage loss η o h m = η o h m , 1 C I c e l l I 1 C
Activation overpotential voltage loss η a c t = 2 R T F asinh I c e l l 2 J 0 I 1 C
Concentration overpotential voltage loss η c o n c = E o c v S O C s u r f a c e , T E o c v S O C a v e r a g e , T
τ δ S O C δ t = * SOC
SOC = 0   for   x = 0   particle   center
SOC = τ I c e l l N s h a p e Q c e l l , 0 for x = 1 (particle surface)
Electrochemical heat sources Q h = η o h m + η a c t + T δ E O C V S O C , T δ T I c e l l + Q m i x
Q m i x = N s h a p e Q c e l l , 0 τ 0 1 δ E O C V , t h e r m δ S O C δ S O C δ x δ S O C δ x X N s h a p e 1 δ x
E o c v , t h e r m = E o c v , r e f S O C T r e f δ E O C V S O C δ T
Heat transfer model:Comsol heat transfer in solids
Heat transfer in solids equation ρ C p δ T δ t + u t r a n s T + q = α T : δ S δ t + Q
Convective heat flux Q c o n v = h A T T e x t

References

  1. Mills, A.; Al-Hallaj, S. Simulation of passive thermal management system for lithium-ion battery packs. J. Power Sources 2005, 141, 307–315. [Google Scholar] [CrossRef]
  2. Pandur, Z.; Šušnjar, M.; Bačić, M. Battery Technology. Croat. J. For. Eng. 2021, 42, 135–148. [Google Scholar] [CrossRef]
  3. Weydanz, W. Encyclopedia of Electrochemical Power Sources—Power Tools: Batteries; Elsevier: Amsterdam, The Netherlands, 2009. [Google Scholar]
  4. Vetter, J.; Novák, P.; Wagner, M.R.; Veit, C.; Möller, K.-C.; Besenhard, J.O.; Winter, M.; Wohlfahrt-Mehrens, M.; Vogler, C.; Hammouche, A. Ageing mechanisms in lithium-ion batteries. J. Power Sources 2005, 147, 269–281. [Google Scholar] [CrossRef]
  5. Waldmann, T.; Wilka, M.; Kasper, M.; Fleischhammer, M.; Wohlfahrt-Mehrens, M. Temperature dependent ageing mechanisms in Lithium-ion batteries—A Post-Mortem study. J. Power Sources 2014, 262, 129–135. [Google Scholar] [CrossRef]
  6. Kang, J.; Rizzoni, G. Study of relationship between temperature and thermal energy, operating conditions as well as environmental factors in large-scale lithium-ion batteries. Int. J. Energy Res. 2014, 38, 1994–2002. [Google Scholar] [CrossRef]
  7. Zadeh, P.G.; Gholamalizadeh, E.; Wang, Y.; Chung, J.D. Electrochemical modeling of a thermal management system for cylindrical lithium-ion battery pack considering battery capacity fade. Case Stud. Therm. Eng. 2022, 32, 101878. [Google Scholar] [CrossRef]
  8. Khan, M.R.; Swierczynski, M.J.; Kær, S.K. Towards an ultimate battery thermal management system—A review. Batteries 2017, 3, 9. [Google Scholar] [CrossRef]
  9. Zadeh, P.G.; Gholamalizadeh, E.; Wang, Y.; Chung, J.D. A review of lithium-ion battery state of charge estimation and management system in electric vehicle applications: Challenges and recommendations. Renew. Sustain. Energy Rev. 2017, 78, 834–854. [Google Scholar] [CrossRef]
  10. Khan, M.R.; Swierczynski, M.J.; Kær, S.K. Towards a Smarter Battery Management System for Electric Vehicle Applications: A Critical Review of Lithium-Ion Battery State of Charge Estimation. Energies 2019, 12, 446. [Google Scholar] [CrossRef]
  11. Hannan, M.A.; Lipu, M.; Hussain, A.; Mohamed, A. State of charge and state of health diagnosis of batteries with voltage-controlled models. J. Power Sources 2022, 544, 231828. [Google Scholar] [CrossRef]
  12. Ali, M.U.; Zafar, A.; Nengroo, S.H.; Hussain, S.; Alvi, M.J.; Kim, H.-J. Nonlinear extension of battery constrained predictive charging control with transmission of Jacobian matrix. Int. J. Electr. Power Energy Syst. 2023, 146, 108762. [Google Scholar] [CrossRef]
  13. Braun, J.A.; Behmann, R.; Schmider, D.; Bessler, W.G. Analysis and Synthesis of Architectures for Automotive Battery Management Systems. Appl. Sci. 2022, 12, 10756. [Google Scholar] [CrossRef]
  14. Thakur, A.K.; Ahmed, M.S.; Kang, H.; Prabakaran, R.; Said, Z.; Rahman, S.; Sathyamurthy, R.; Kim, J.; Hwang, J.-Y. Critical Review on Internal and External Battery Thermal Management Systems for Fast Charging Applications. Adv. Energy Mater. 2013, 13, 2202944. [Google Scholar] [CrossRef]
  15. Pesaran, A.A. Battery thermal management in EV and HEVs—Issues and solutions. Battery Man 2001, 43, 34–49. [Google Scholar]
  16. Khateeb, S.A.; Amiruddin, S.; Farid, M.; Selman, J.R.; Al-Hallaj, S. Thermal management of Li-ion battery with phase change material for electric scooters—Experimental validation. J. Power Sources 2005, 142, 345–353. [Google Scholar] [CrossRef]
  17. Patel, J.R.; Rathod, M.K. Recent developments in the passive and hybrid thermal management techniques of lithium-ion batteries. J. Power Sources 2020, 480, 228820. [Google Scholar] [CrossRef]
  18. Yamanaka, T.; Kihara, D.; Takagishi, Y.; Yamaue, T. Multi-physics equivalent circuit models for a cooling system of a lithium ion battery pack. Batteries 2020, 6, 44. [Google Scholar] [CrossRef]
  19. Lazrak, A.; Fourmigué, J.-F.; Robin, J.-F. An innovative practical battery thermal management system based on phase change materials: Numerical and experimental investigations. Appl. Therm. Eng. 2018, 128, 20–32. [Google Scholar] [CrossRef]
  20. Park, H. A design of air flow configuration for cooling lithium ion battery in hybrid electric vehicles. J. Power Sources 2013, 239, 30–36. [Google Scholar] [CrossRef]
  21. Yu, K.; Yang, X.; Cheng, Y.; Li, C. Thermal analysis and two-directional air flow thermal management for lithium-ion battery pack. J. Power Sources 2014, 270, 193–200. [Google Scholar] [CrossRef]
  22. Rao, Z.; Qian, Z.; Kuang, Y.; Li, Y. Thermal performance of liquid cooling based thermal management system for cylindrical lithium-ion battery module with variable contact surface. Appl. Therm. Eng. 2017, 123, 1514–1522. [Google Scholar] [CrossRef]
  23. Chen, D.; Jiang, J.; Kim, G.-H.; Yang, C. Comparison of different cooling methods for lithium ion battery cells. Appl. Therm. Eng. 2016, 94, 846–854. [Google Scholar] [CrossRef]
  24. Zhao, G.; Wang, X.; Negnevitsky, M.; Li, C. An up-to-date review on the design improvement and optimization of the liquid-cooling battery thermal management system for electric vehicles. Appl. Therm. Eng. 2023, 219, 119626. [Google Scholar] [CrossRef]
  25. Khateeb, S.A.; Farid, M.M.; Selman, J.R.; Al-Hallaj, S. Design and simulation of a lithium-ion battery with a phase change material thermal management system for an electric scooter. J. Power Sources 2004, 128, 292–307. [Google Scholar] [CrossRef]
  26. Septiadi, W.N.; Alim, M.; Adi, M.N.P. The application of battery thermal management system based on heat pipes and phase change materials in the electric bike. J. Energy Storage 2022, 56, 106014. [Google Scholar] [CrossRef]
  27. Wang, Z.; Zhang, Z.; Jia, L.; Yang, L. Paraffin and paraffin/aluminum foam composite phase change material heat storage experimental study based on thermal management of Li-ion battery. Appl. Therm. Eng. 2015, 78, 428–436. [Google Scholar] [CrossRef]
  28. Kizilel, R.; Lateef, A.; Sabbah, R.; Farid, M.M.; Selman, J.R.; Al-Hallaj, S. Passive control of temperature excursion and uniformity in high-energy Li-ion battery packs at high current and ambient temperature. J. Power Sources 2008, 183, 370–375. [Google Scholar] [CrossRef]
  29. Kizilel, R.; Sabbah, R.; Selman, J.R.; Al-Hallaj, S. An alternative cooling system to enhance the safety of Li-ion battery packs. J. Power Sources 2009, 194, 1105–1112. [Google Scholar] [CrossRef]
  30. Chen, M.; Zhang, S.; Wang, G.; Weng, J.; Ouyang, D.; Wu, X.; Zhao, L.; Wang, J. Experimental Analysis on the Thermal Management of Lithium-Ion Batteries Based on Phase Change Materials. Appl. Sci. 2020, 10, 7354. [Google Scholar] [CrossRef]
  31. Goud, V.M.; Satyanarayana, G.; Ramesh, J.; Pathanjali, G.A.; Ruben Sudhakar, D. An experimental investigation and hybrid neural network modelling of thermal management of lithium-ion batteries using a non-paraffinic organic phase change material, Myristyl alcohol. J. Energy Storage 2023, 72, 108395. [Google Scholar] [CrossRef]
  32. Boomstra, M.W.; van Asseldonk, M.; Geurts, B.J.; Nazarychev, V.M.; Lyulin, A.V. Effects of branching and polydispersity on thermal conductivity of paraffin waxes. Int. J. Heat Mass Transf. 2022, 195, 123192. [Google Scholar] [CrossRef]
  33. Wang, Y.; Wang, Z.; Min, H.; Li, H.; Li, Q. Performance investigation of a passive battery thermal management system applied with phase change material. J. Energy Storage 2021, 35, 102279. [Google Scholar] [CrossRef]
  34. Luo, J.; Zou, D.; Wang, Y.; Wang, S.; Huang, L. Battery thermal management systems (BTMs) based on phase change material (PCM): A comprehensive review. Chem. Eng. J. 2022, 430, 132741. [Google Scholar] [CrossRef]
  35. Talele, V.; Patil, M.S.; Panchal, S.; Fraser, R.; Fowler, M.; Gunti, S.R. Novel metallic separator coupled composite phase change material passive thermal design for large format prismatic battery pack. J. Energy Storage 2023, 58, 106336. [Google Scholar] [CrossRef]
  36. Tang, A.; Chen, W.; Shao, X.; Jin, Y.; Li, J.; Xia, D. Experimental investigation of aluminum nitride/carbon fiber-modified composite phase change materials for battery thermal management. Int. J. Energy Res. 2022, 46, 12737–12757. [Google Scholar] [CrossRef]
  37. Samimi, F.; Babapoor, A.; Azizi, M.; Karimi, G. Thermal management analysis of a Li-ion battery cell using phase change material loaded with carbon fibers. Energy 2016, 96, 355–371. [Google Scholar] [CrossRef]
  38. Zhao, Y.; Jin, L.; Zou, B.; Qiao, G.; Zhang, T.; Cong, L.; Jiang, F.; Li, C.; Huang, Y.; Ding, Y. Expanded graphite—Paraffin composite phase change materials: Effect of particle size on the composite structure and properties. Appl. Therm. Eng. 2020, 171, 115015. [Google Scholar] [CrossRef]
  39. Goli, P.; Legedza, S.; Dhar, A.; Salgado, R.; Renteria, J.; Balandin, A.A. Graphene-enhanced hybrid phase change materials for thermal management of Li-ion batteries. J. Power Sources 2014, 248, 37–43. [Google Scholar] [CrossRef]
  40. Zhang, K.; Han, B.; Yu, X. Electrically conductive carbon nanofiber/paraffin wax composites for electric thermal storage. Energy Convers. Manag. 2012, 64, 62–67. [Google Scholar] [CrossRef]
  41. Liu, X.; Zhang, C.-F.; Zhou, J.-G.; Xiong, X.; Wang, Y.-P. Thermal performance of battery thermal management system using fins to enhance the combination of thermoelectric Cooler and phase change Material. Appl. Energy 2022, 322, 119503. [Google Scholar] [CrossRef]
  42. Choudhari, V.G.; Dhoble, A.S.; Panchal, S. Numerical analysis of different fin structures in phase change material module for battery thermal management system and its optimization. Int. J. Heat Mass Transf. 2020, 163, 120434. [Google Scholar] [CrossRef]
  43. Sun, Z.; Guo, Y.; Zhang, C.; Whitehouse, J.; Zhou, Q.; Xu, H.; Wang, C. Experimental study of battery passive thermal management system using copper foam-based phase change materials. Int. J. Thermofluids 2023, 17, 100255. [Google Scholar] [CrossRef]
  44. Zheng, Y.; Shi, Y.; Huang, Y. Optimisation with adiabatic interlayers for liquid-dominated cooling system on fast charging battery packs. Appl. Therm. Eng. 2019, 147, 636–646. [Google Scholar] [CrossRef]
  45. Ranjbaran, Y.S.; Shojaeefard, M.H.; Molaeimanesh, G.R. Thermal performance enhancement of a passive battery thermal management system based on phase change material using cold air passageways for lithium batteries. J. Energy Storage 2023, 68, 107744. [Google Scholar] [CrossRef]
  46. Shelkea, A.V.; Buston, J.E.; Gill, J.; Howard, D.; Williams, R.C.; Read, E.; Abaza, A.; Cooper, B.; Richards, P.; Wen, J.X. Combined numerical and experimental studies of 21700 lithium-ion battery thermal runaway induced by different thermal abuse. Int. J. Heat Mass Transf. 2022, 194, 123099. [Google Scholar] [CrossRef]
  47. Vogiatzis, D.; Schacht, H.-J.; Schmidt, S.; Kirchberger, R.; Arenz, M. Investigation on Transient Behavior and SoC Balancing of a Hybrid Powertrain Hand-Held Tool; SAE Technical Paper Series; SAE International400 Commonwealth Drive: Warrendale, PA, USA, 2022. [Google Scholar]
  48. COMSOL. COMSOL Multiphysics Reference Manual v. 5.4; COSMOL: Burlington, MA, USA, 2018. [Google Scholar]
  49. Quinn, J.B.; Waldmann, T.; Richter, K.; Kasper, M.; Wohlfahrt-Mehrens, M. Energy density of cylindrical Li-ion cells—A comparison of commercial 18650 to the 21700 cells. J. Electrochem. Soc. 2018, 165, A3284. [Google Scholar] [CrossRef]
  50. Ovejas, V.J.; Cuadras, A. State of charge dependency of the overvoltage generated in commercial Li-ion cells. J. Power Sources 2019, 418, 176–185. [Google Scholar] [CrossRef]
  51. Kang, T.; Park, S.; Lee, P.-Y.; Cho, I.-H.; Yoo, K.; Kim, J. Thermal Analysis of a Parallel-Configured Battery Pack (1S18P) Using 21700 Cells for a Battery-Powered Train. Electronics 2020, 9, 447. [Google Scholar] [CrossRef]
  52. Hosseini Moghaddam, S.M. Designing Battery Thermal Management Systems (BTMS) for Cylindrical Lithium-Ion Battery Modules Using CFD. Master’s Thesis, KTH School of Industrial Engineering and Management Energy Technology, Stockholm, Sweden, 2018. [Google Scholar]
  53. Kerler, M.; Lienkamp, M. COFAT 2015—A method to find a thermal optimum cell size. In Proceedings of the Conference on Future Automotive Technology, Munich, Germany, 3–4 May 2015. [Google Scholar]
  54. Faber, M.; RItz, S.; Börner, M.; Sauer, D.U. Technique to Determine the specific heat Capacity of Lithium-ion Battery cells. In Proceedings of the AABC Europe 2019, Strasbourg, France, 27–31 January 2019. [Google Scholar]
  55. Chen, S.C.; Wan, C.C.; Wang, Y.Y. Thermal analysis of lithium-ion batteries. J. Power Sources 2005, 140, 111–124. [Google Scholar] [CrossRef]
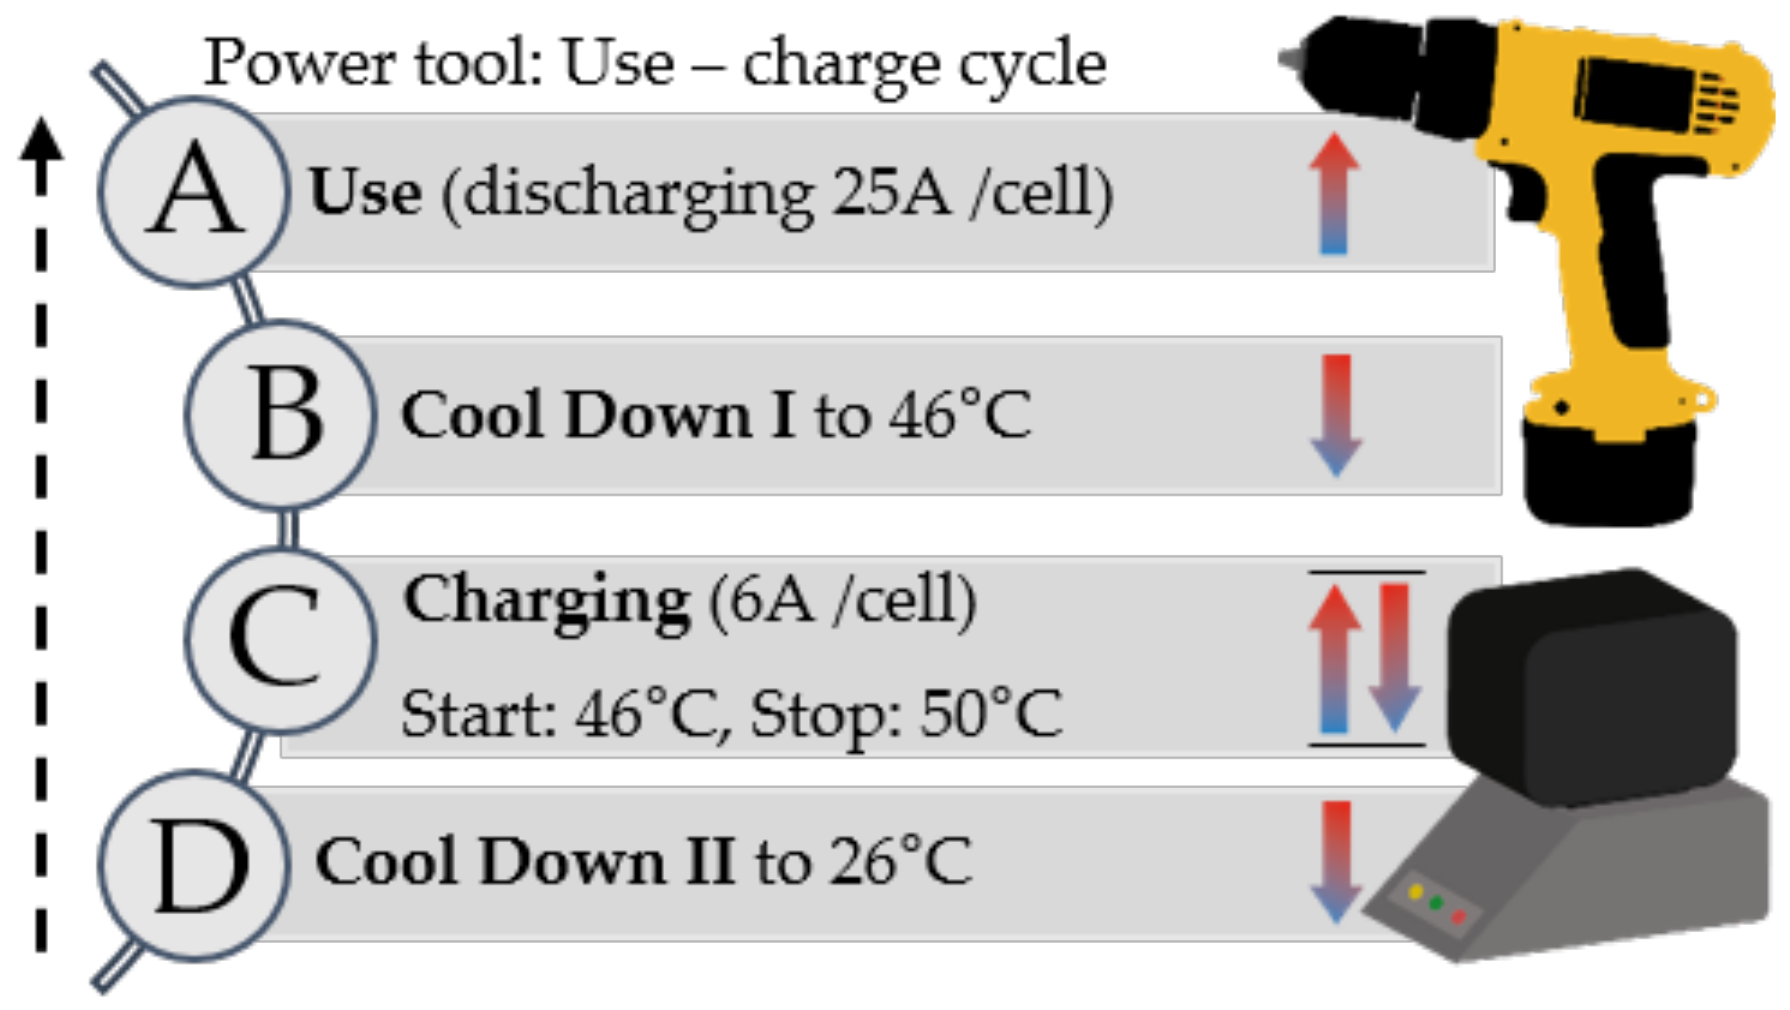
Figure 1. Use/charge cycle: While using the power tool, the battery pack is quickly discharged and heats up ((A): Use phase). After being totally discharged, it is placed in the charging unit. However, before the charging can start, the cell pack has to cool down (rest) below the upper safety temperature limit (stop temperature) to prevent accelerated aging of the cells ((B): cool down phase I). This is controlled by the charging management system in the charging unit. At a certain temperature (start temperature, usually a few degrees Celsius below stop temperature) set by the manufacturer, the actual charging starts ((C): charging phase). During charging, the battery pack can heat up. If the upper safety temperature limit (stop temperature) is reached, the charging has to stop and cool down to the start temperature. When the pack is fully charged it cools down until it reaches room temperature ((D): Cool down phase II).
Applsci 13 08848 g001
Figure 2. 3D geometry of the investigated power tool battery pack. Ten Samsung INR2170040T cells are enclosed in a matrix of passive cooling material.
Applsci 13 08848 g002
Figure 3. Influence of cooling material surrounding the cells in the pack on the cell temperature during the use/charge cycle; (A) Use phase ((A), 6.25 C = 25 A discharge) is followed by charging which consists of cool-down phase I (B), charging phase ((C), 6 A = 1.5 C), and cool-down phase II (D). Charging starts as soon as the battery pack has cooled down to 46 °C (start temperature) and is stopped if the temperature reaches 50 °C (stop temperature) to prevent charging at temperatures that are too high. Upper part: temperature of central cell with close-up inlet of charging phase; lower part: state of charge of the cells in the pack.
Applsci 13 08848 g003
Figure 4. Temperature homogeneity in the cell pack. (a) Temperature difference of the cells in the center and the cells at the edges (average cell temperature) during the whole use/charging cycle. Cells at the edges are 0.5 to 5 °C (depending on cooling material and phase) cooler than the cells in the center. (b) Temperature distribution in the cells at the end of use phase (8 min, cell size: radius 21 mm, height 70 mm, cuboid indicates the position of the cooling materials).
Applsci 13 08848 g004
Figure 5. Parameter variation study with heat-conductive polymer I highlights the strong influence of ambient temperature and wind speed: (a) Variation in ambient temperature (10, 20, 30, 40 °C). (b) Variation in convection coefficient (1, 5, 10, 20 W/m2 K). Upper part: temperature of central cell, lower part: state of charge of cell.
Applsci 13 08848 g005
Table 1. Investigated cooling materials and their key properties.
MaterialDensity [kg/m3]Specific Heat Capacity [J/kgK]Volumetric Heat
Capacity [J/m3 K]
Thermal Conductivity [W/mK]Melting Point [°C]Heat of Fusion [W/kg]
Reference (non-conv. air)Comsol database “air” [48]--
Heat-conductive polymer I154014702,263,8002.2--
Heat-conductive polymer II98035003,430,0000.74--
Latent heat storage material122021002,562,0000.439 170,000 1
1 Latent heat storage: Phase change at 39 °C.
Table 2. Summary of time spans needed for the different steps of the use/charge cycle (with length of step in minutes and percentage of total cycle length). Significant differences occur mainly in the cool-down and charge phases.
Material [min] ([%])Use
(A)
Cool-Down Phase I
(B)
Charge
(C)
Cool-Down Phase II
(D)
Total
Reference (non conv. air)8.5 (2%)125 (23%)91.6 (17%)318.1 (59%)543
Heat-Conductive Polymer I8.5 (2%)90 (19%)70.8 (15%)303.9 (64%)473
Heat-Conductive Polymer II8.5 (2%)93.5 (18%)70.9 (14%)347.9 (67%)521
Latent Heat Storage Material8.5 (1%)72.5 (13%)71.2 (12%)427.7 (74%)580
Disclaimer/Publisher’s Note: The statements, opinions and data contained in all publications are solely those of the individual author(s) and contributor(s) and not of MDPI and/or the editor(s). MDPI and/or the editor(s) disclaim responsibility for any injury to people or property resulting from any ideas, methods, instructions or products referred to in the content.