Magnetoelectric Composites: Engineering for Tunable Filters and Energy Harvesting Applications


Abstract
:1. Introduction
2. Materials and Methods
3. Results
4. Conclusions
Author Contributions
Funding
Institutional Review Board Statement
Informed Consent Statement
Data Availability Statement
Acknowledgments
Conflicts of Interest
References
- Henrique, M.B., Jr.; Magalhães, A.L.; Bastos, A.M.; Jefferson, M.; Sales, A.; Gouveia, D.X.; Kamshilin, A.A.; da Ferreira, A.C.; de Guimarães, G.F.; Sombra, A.S.B.; et al. Piezoelectric ceramic sensor (PZT) applied to electric current measurements. Microsyst. Technol. 2019, 25, 705–710. [Google Scholar]
- Hu, Z.; Smith, R.C.; Ernstberger, J. The homogenized energy model for characterizing polarization and strains in hysteretic ferroelectric materials: Implementation algorithms and data-driven parameter estimation techniques. J. Intel. Mat. Syst. 2012, 16, 1869–1894. [Google Scholar] [CrossRef]
- Aktas, O.; Kangama, M.; Linyu, G.; Catalan, G.; Ding, X.; Zunger, A.; Salje, E.K.H. Piezoelectricity in nominally centrosymmetric phases. Phys. Rev. Res. 2021, 3, 043221. [Google Scholar] [CrossRef]
- Chen, D.; Wang, L.; Luo, X.; Fei, C.; Li, D.; Shan, G.; Yang, Y. Recent development and perspectives of optimization design methods for piezoelectric ultrasonic transducers. Micromachines 2021, 12, 779. [Google Scholar] [CrossRef]
- Meng, Y.; Chen, G.; Huang, M. Piezoelectric materials: Properties, advancements, and design strategies for high-temperature applications. Nanomaterials 2022, 12, 1171. [Google Scholar] [CrossRef]
- Dipti, D.; Juneja, J.K.; Singh, S.; Raina, K.K.; Prakash, C. Enhancement in magnetoelectric coupling in PZT based composites. Ceram. Int. 2015, 41, 6108–6112. [Google Scholar] [CrossRef]
- Spaldin, N.A. Multiferroics: Past, present, and future. MRS Bull. 2017, 42, 385–389. [Google Scholar] [CrossRef] [Green Version]
- Bartkowska, J.A.; Ilczuk, J. Microscopic origin of electric and magnetic ordering in BiFeO3. Int. J. Thermophys. 2010, 31, 1–7. [Google Scholar] [CrossRef]
- Bochenek, D.; Skulski, R.; Wawrzała, P.; Brzezińska, D. Dielectric properties of Pb0.75Ba0.25(Zr0.65Ti0.35)1-zSnzO3 ceramics. Ferroelectrics 2011, 418, 82–87. [Google Scholar] [CrossRef]
- Scott, J.F. Multiferroic memories. Nat. Mater. 2007, 6, 256–257. [Google Scholar] [CrossRef]
- Afuye, O.; Li, X.; Guo, F.; Jena, D.; Ralph, D.C.; Molnar, A.; Xing, H.G.; Apsel, A. Modeling and circuit design of associative memories with spin orbit torque FETs. IEEE J. Explor. Solid-State Comput. Dev. Circ. 2019, 5, 197–205. [Google Scholar] [CrossRef]
- Ustinov, A.B.; Kalinikos, B.A. Multiferroic periodic structures based on magnetic crystals for electronically tunable microwave devices. Tech. Phys. Lett. 2014, 7, 568–570. [Google Scholar] [CrossRef]
- Kreisel, J.; Kenzelmann, M. Multiferroics the challenge of coupling magnetism and ferroelectricity. Europhys. News 2009, 40, 17–20. [Google Scholar] [CrossRef]
- Fiebig, M. Revival of the magnetoelectric effect. J. Phys. D Appl. Phys. 2005, 38, R123–R152. [Google Scholar] [CrossRef]
- Das, J.; Li, M.; Kalarickal, S.S.; Altmannshofer, S.; Buchanan, K.S.; Li, J.F.; Viehland, D. Control of magnetic and electric responses with electric and magnetic fields in magnetoelectric heterostructures. Appl. Phys. Lett. 2010, 96, 222508. [Google Scholar] [CrossRef] [Green Version]
- Yang, G.M.; Lou, J.; Wu, J.; Liu, M.; Wen, G.; Jin, Y.; Sun, N.X. Dual H-and E-field tunable multiferroic bandpass filters with yttrium iron garnet film. In Proceedings of the 2011 IEEE MTT-S International Microwave Symposium, Baltimore, MD, USA, 5–10 June 2011; pp. 1–4. [Google Scholar]
- Wu, H.; Tatarenko, A.; Bichurin, M.I.; Wang, Y. A multiferroic module for biomechanical energy harvesting. Nano Energy 2021, 83, 105777. [Google Scholar] [CrossRef]
- Xiang, P.-H.; Dong, X.-L.; Chen, H.; Zhang, Z.; Guo, J.-K. Mechanical and electrical properties of small amount of oxides reinforced PZT ceramics. Ceram. Int. 2003, 29, 499–503. [Google Scholar] [CrossRef]
- Boucher, E.; Guiffard, B.; Lebrun, L.; Guyomar, D. Effects of Zr/Ti ratio on structural, dielectric and piezoelectric properties of Mn- and (Mn, F)-doped lead zirconate titanate ceramics. Ceram. Int. 2006, 32, 479–485. [Google Scholar] [CrossRef]
- Scott, J.F. Applications of magnetoelectrics. J. Mater. Chem. 2012, 22, 4567–4574. [Google Scholar] [CrossRef]
- Bochenek, D.; Niemiec, P.; Skulski, R.; Adamczyk, M.; Brzezińska, D. Electrophysical properties of the multicomponent PBZT-type ceramics doped by Sn4+. J. Electroceram. 2019, 42, 17–30. [Google Scholar] [CrossRef] [Green Version]
- Brzezińska, D.; Skulski, R.; Bochenek, D.; Niemiec, P. The properties of (1-x)(0.5PZT-0.5PFW)-xPFN ceramics. Integr. Ferroelectr. 2016, 173, 104–112. [Google Scholar] [CrossRef]
- Venkata Ramana, M.; Roopas Kiranc, S.; Ramamanohar Reddy, N.; Siva Kumar, K.V.; Murthy, V.R.K.; Murty, B.S. Investigation and characterization of Pb(Zr0.52Ti0.48)O3 nanocrystalline ferroelectric ceramics: By conventional and microwave sintering methods. Mater. Chem. Phys. 2011, 126, 295–300. [Google Scholar] [CrossRef]
- Maiwa, H.; Kimura, O.; Shoji, K.; Ochiai, H. Low temperature sintering of PZT ceramics without additives via an ordinary ceramic route. J. Eur. Ceram. Soc. 2005, 25, 2383–2385. [Google Scholar] [CrossRef]
- Xu, Z.J.; Chu, R.Q.; Li, G.R.; Shao, X.; Yin, Q.R. Preparation of PZT powders and ceramics via a hybrid method of sol–gel and ultrasonic atomization. Mater. Sci. Eng. B 2005, 117, 113–118. [Google Scholar] [CrossRef]
- Zhang, L.; Jiang, S.; Fan, B.; Zhang, G. Enhanced energy storage performance in (Pb0.858Ba0.1La0.02Y0.008) (Zr0.65Sn0.3Ti0.05)O3–(Pb0.97La0.02) (Zr0.9Sn0.05Ti0.05)O3 anti–ferroelectric composite ceramics by Spark Plasma Sintering. J. Alloys Compd. 2015, 622, 162–165. [Google Scholar] [CrossRef]
- Prasatkhetragarn, A.; Yimnirun, R. Phase formation, electrical properties and morphotropic phase boundary of 0.95Pb(ZrxTi1-x)O3–0.05Pb(Mn1/3Nb2/3)O3 ceramics. Ceram. Int. 2013, 39, S91–S95. [Google Scholar] [CrossRef]
- Li, J.; Sun, Q. Effects of Cr2O3 doping on the electrical properties and the temperature stabilities of PZT binary piezoelectric ceramics. Rare Met. 2008, 27, 362–366. [Google Scholar] [CrossRef]
- Shung, K.K.; Cannata, J.M.; Zhou, Q.F. Piezoelectric materials for high frequency medical imaging applications: A review. J. Electroceram. 2007, 19, 141–147. [Google Scholar] [CrossRef]
- Venkata Ramana, M.; Ramamanohar Reddy, N.; Siva Kumar, K.V.; Murthy, V.R.K.; Murty, B.S. Magneto-electric effect in multiferroic Ni0.93Co0.02Mn0.05Fe1.95O4−/PbZr0.52Ti0.48O3 particulate composites: Dielectric, piezoelectric properties. Mod. Phys. Lett. B 2011, 25, 345–358. [Google Scholar] [CrossRef]
- Zhang, H.; Mak, C.-L. Impedance spectroscopic characterization of fine-grained magnetoelectric Pb(Zr0.53Ti0.47)O3–(Ni0.5Zn0.5)Fe2O4 ceramic composites. J. Alloys Compd. 2012, 513, 165–171. [Google Scholar] [CrossRef]
- Němec, P.; Fiebig, M.; Kampfrath, T.; Kimel, A.V. Antiferromagnetic opto-spintronics. Nat. Phys. 2018, 14, 229–241. [Google Scholar] [CrossRef]
- Hrib, L.M.; Caltun, O.F. Effects of the chemical composition of the magnetostrictive phase on the dielectric and magnetoelectric properties of cobalt ferrite–barium titanate composites. J. Alloys Compd. 2011, 509, 6644–6648. [Google Scholar] [CrossRef]
- Bochenek, D.; Zachariasz, R.; Niemiec, P.; Bartkowska, J.; Brzezińska, D. Ferroelectromagnetic solid solutions on the base piezoelectric ceramic materials for components of micromechatronics. Mech. Syst. Signal Process. 2016, 78, 84–90. [Google Scholar] [CrossRef]
- Penchal Reddy, M.; Madhuri, W.; Venkata Ramana, M.; Ramamanohar Reddy, N.; Siva Kumar, K.V.; Murthy, V.R.K.; Siva Kumar, K.; Ramakrishna Reddy, R. Effect of sintering temperature on structural and magnetic properties of NiCuZn and MgCuZn ferrites. J. Magn. Magn. Mater. 2010, 322, 2819–2825. [Google Scholar] [CrossRef]
- Penchal Reddy, M.; Madhuri, W.; Ramamanohar Reddy, N.; Siva Kumar, K.V.; Murthy, V.R.K.; Ramakrishna Reddy, R. Magnetic properties of Ni-Zn ferrites prepared by microwave sintering method. J. Electroceram. 2012, 28, 1–9. [Google Scholar] [CrossRef]
- Bochenek, D.; Niemiec, P.; Chrobak, A. Effect of chemical composition on magnetic and electrical properties of ferroelectromagnetic ceramic composites. Materials 2021, 14, 2488. [Google Scholar] [CrossRef]
- Ciomaga, C.E.; Avadanei, O.G.; Dumitru, I.; Airimioaei, M.; Tascu, S.; Tufescu, F.; Mitoseriu, L. Engineering magnetoelectric composites towards application as tunable microwave filters. J. Phys. D Appl. Phys. 2016, 49, 125002. [Google Scholar] [CrossRef]
- Atif, M.; Ahmed, S.; Nadeem, M.; Nasir Khan, M. Complex dielectric and impedance analysis in a relaxor type ferroelec-tric/ferrimagnetic magnetoelectric (0.5)PbZr0.52Ti0.48O3+(0.5)CoFe2O4 composite. J. Alloys Compd. 2018, 735, 880–889. [Google Scholar] [CrossRef]
- Hannachi, E.; Sayyed, M.I.; Slimani, Y.; Almessiere, M.A.; Baykal, A.; Elsafi, M. Synthesis, characterization, and performance as-sessment of new composite ceramics towards radiation shielding applications. J. Alloys Compd. 2022, 899, 163173. [Google Scholar] [CrossRef]
- Wu, H.; Xu, R.; Zhou, C.; Xing, S.; Zeng, Z.; Ao, H.; Li, W.; Qin, X.; Gao, R. Effect of core size on the magnetoelectric properties of Cu0.8Co0.2Fe2O4@Ba0.8Sr0.2TiO3 ceramics. J. Phys. Chem. Solids 2022, 160, 110314. [Google Scholar] [CrossRef]
- Gao, R.; Zhang, Q.; Xu, Z.; Wang, Z.; Chen, G.; Deng, X.; Fu, C.; Cai, W. A comparative study on the structural, dielectric and multiferroic properties of Co0.6Cu0.3Zn0.1Fe2O4/Ba0.9Sr0.1Zr0.1Ti0.9O3 composite ceramics. Compos. Part B-Eng. 2019, 166, 204–212. [Google Scholar] [CrossRef]
- Mane, S.M.; Nimbalkar, A.R.; Kim, H.; Kulkarni, S.B.; Tayade, N.T.; Thombare, J.V.; Dhasade, S.S.; Shin, J.C. Magnetoelectric and magnetodielectric coupling in partially Ni-doped CoFe2O4 and 0.15(Ba0.7Ca0.3TiO3)-0.85(BaZr0.2Ti0.8O3) composites prepared via clean microwave sintering. J. Alloys Compd. 2020, 849, 156599. [Google Scholar] [CrossRef]
- Mao, C.; Yan, S.; Cao, S.; Yao, C.; Cao, F.; Wang, G.; Dong, X.; Hu, X.; Yang, C. Effect of grain size on phase transition, dielectric and pyroelectric propertiesof BST ceramics. J. Eur. Ceram. Soc. 2014, 34, 2933–2939. [Google Scholar] [CrossRef]
- Bobić, J.D.; Ivanov, M.; Ilić, N.I.; Dzunuzović, A.S.; Vijatović Petrović, M.M.; Banys, J.; Ribic, A.; Despotovic, Z.; Stojanovic, B.D. PZT-nickel ferrite and PZT-cobalt ferrite comparative study: Structural, dielectric, ferroelectric and magnetic properties of composite ceramics. Ceram. Int. 2018, 44, 6551–6557. [Google Scholar] [CrossRef]
- Nayak, P.; Badapanda, T.; Kumar Singh, A.; Panigrahi, S. An approach for correlating the structural and electrical properties of Zr4+-modified SrBi4Ti4O15/SBT ceramic. RSC Adv. 2017, 7, 16319–16331. [Google Scholar] [CrossRef] [Green Version]
- Li, M.; Sinclair, D.C.; West, A.R. Extrinsic origins of the apparent relaxor like behavior in CaCu3Ti4O12 ceramics at high temperatures: A cautionary tale. J. Appl. Phys. 2011, 109, 084106. [Google Scholar] [CrossRef]
- Irvine, J.T.; Sinclair, D.C.; West, A.R. Electroceramics: Characterization by impedance spectroscopy. Adv. Mat. 1990, 2, 132–138. [Google Scholar] [CrossRef]
- Zhang, M.F.; Wang, Y.; Wang, K.F.; Zhu, J.S.; Liu, J.M. Characterization of oxygen vacancies and their migration in Ba-doped Pb(Zr0.52Ti0.48)O3 ferroelectrics. J. Appl. Phys. 2009, 105, 061639. [Google Scholar] [CrossRef]
- Kang, B.S.; Choi, S.K.; Park, C.H. Diffuse dielectric anomaly in perovskite-type ferroelectric oxides in the temperature range of 400–700 °C. J. Appl. Phys. 2003, 9, 1904–1911. [Google Scholar] [CrossRef]
- Elissalde, C.; Ravez, J. Ferroelectric ceramics: Defects and dielectric relaxations. J. Mater. Chem. 2001, 11, 1957–1967. [Google Scholar] [CrossRef]
- Li, Z.; Fan, H. Polaron relaxation associated with the localized oxygen vacancies in Ba0.85Sr0.15TiO3 ceramics at high temperatures. J. Appl. Phys. 2009, 106, 054102. [Google Scholar] [CrossRef]
- Lvovich, V.F. Impedance Spectroscopy, Applications to Electrochemical and Dielectric Phenomena; John Wiley & Sons, Inc.: Hoboken, NJ, USA, 2012. [Google Scholar]
- Wu, J.; Wang, J. Ferroelectric and impedance behavior of La- and Ti-codoped BiFeO3 thin films. J. Am. Ceram. Soc. 2010, 93, 2795–2803. [Google Scholar] [CrossRef]
- Chang, B.Y.; Park, S.M. Electrochemical impedance spectroscopy. Ann. Rev. Anal. Chem. 2010, 3, 207. [Google Scholar] [CrossRef] [PubMed]
- Akkopru-Akgun, B.; Marincel, D.M.; Tsuji, K.; Bayer, T.J.M.; Randall, C.A.; Lanagan, M.T.; Trolier-McKinstry, S. Thermally stimulated depolarization current measurements on degraded lead zirconate titanate films. J. Am. Ceram. Soc. 2021, 104, 5270–5280. [Google Scholar] [CrossRef]


| P20-F80 | P40-F60 | P60-F40 | P80-F20 | P85-F15 | P90-F10 | |||||||
|---|---|---|---|---|---|---|---|---|---|---|---|---|
| t (%) | ex (%) | t (%) | ex (%) | t (%) | ex (%) | t (%) | ex (%) | t (%) | ex (%) | t (%) | ex (%) | |
| TiO2 | 3.065 | 2.44 | 5.746 | 5.34 | 8.109 | 8.05 | 10.208 | 10.07 | 10.697 | 10.47 | 11.173 | 10.92 |
| MnO2 | 0.007 | 0.09 | 0.013 | 0.12 | 0.018 | 0.15 | 0.023 | 0.17 | 0.024 | 0.12 | 0.025 | 0.17 |
| Fe2O3 | 50.133 | 55.05 | 35.238 | 39.35 | 22.103 | 21.93 | 10.435 | 10.13 | 7.718 | 7.63 | 5.076 | 4.91 |
| NiO | 11.725 | 13 | 8.241 | 10.87 | 5.169 | 5.08 | 2.440 | 2.31 | 1.805 | 1.85 | 1.187 | 1.13 |
| ZnO | 12.779 | 13.6 | 8.982 | 11.05 | 5.634 | 5.78 | 2.660 | 2.63 | 1.967 | 1.78 | 1.294 | 1.08 |
| ZrO2 | 4.923 | 2.85 | 9.227 | 7.03 | 13.022 | 12.95 | 16.393 | 16.23 | 17.178 | 16.85 | 17.942 | 17.58 |
| Nb2O5 | 0.010 | 0.26 | 0.020 | 0.31 | 0.028 | 0.77 | 0.035 | 0.97 | 0.036 | 1.01 | 0.038 | 1.02 |
| PbO | 16.993 | 12.34 | 31.850 | 25.39 | 44.951 | 44.27 | 56.590 | 56.39 | 59.299 | 58.97 | 61.935 | 61.42 |
| Bi2O3 | 0.366 | 0.37 | 0.685 | 0.54 | 0.967 | 1.020 | 1.218 | 1.10 | 1.276 | 1.32 | 1.333 | 1.77 |
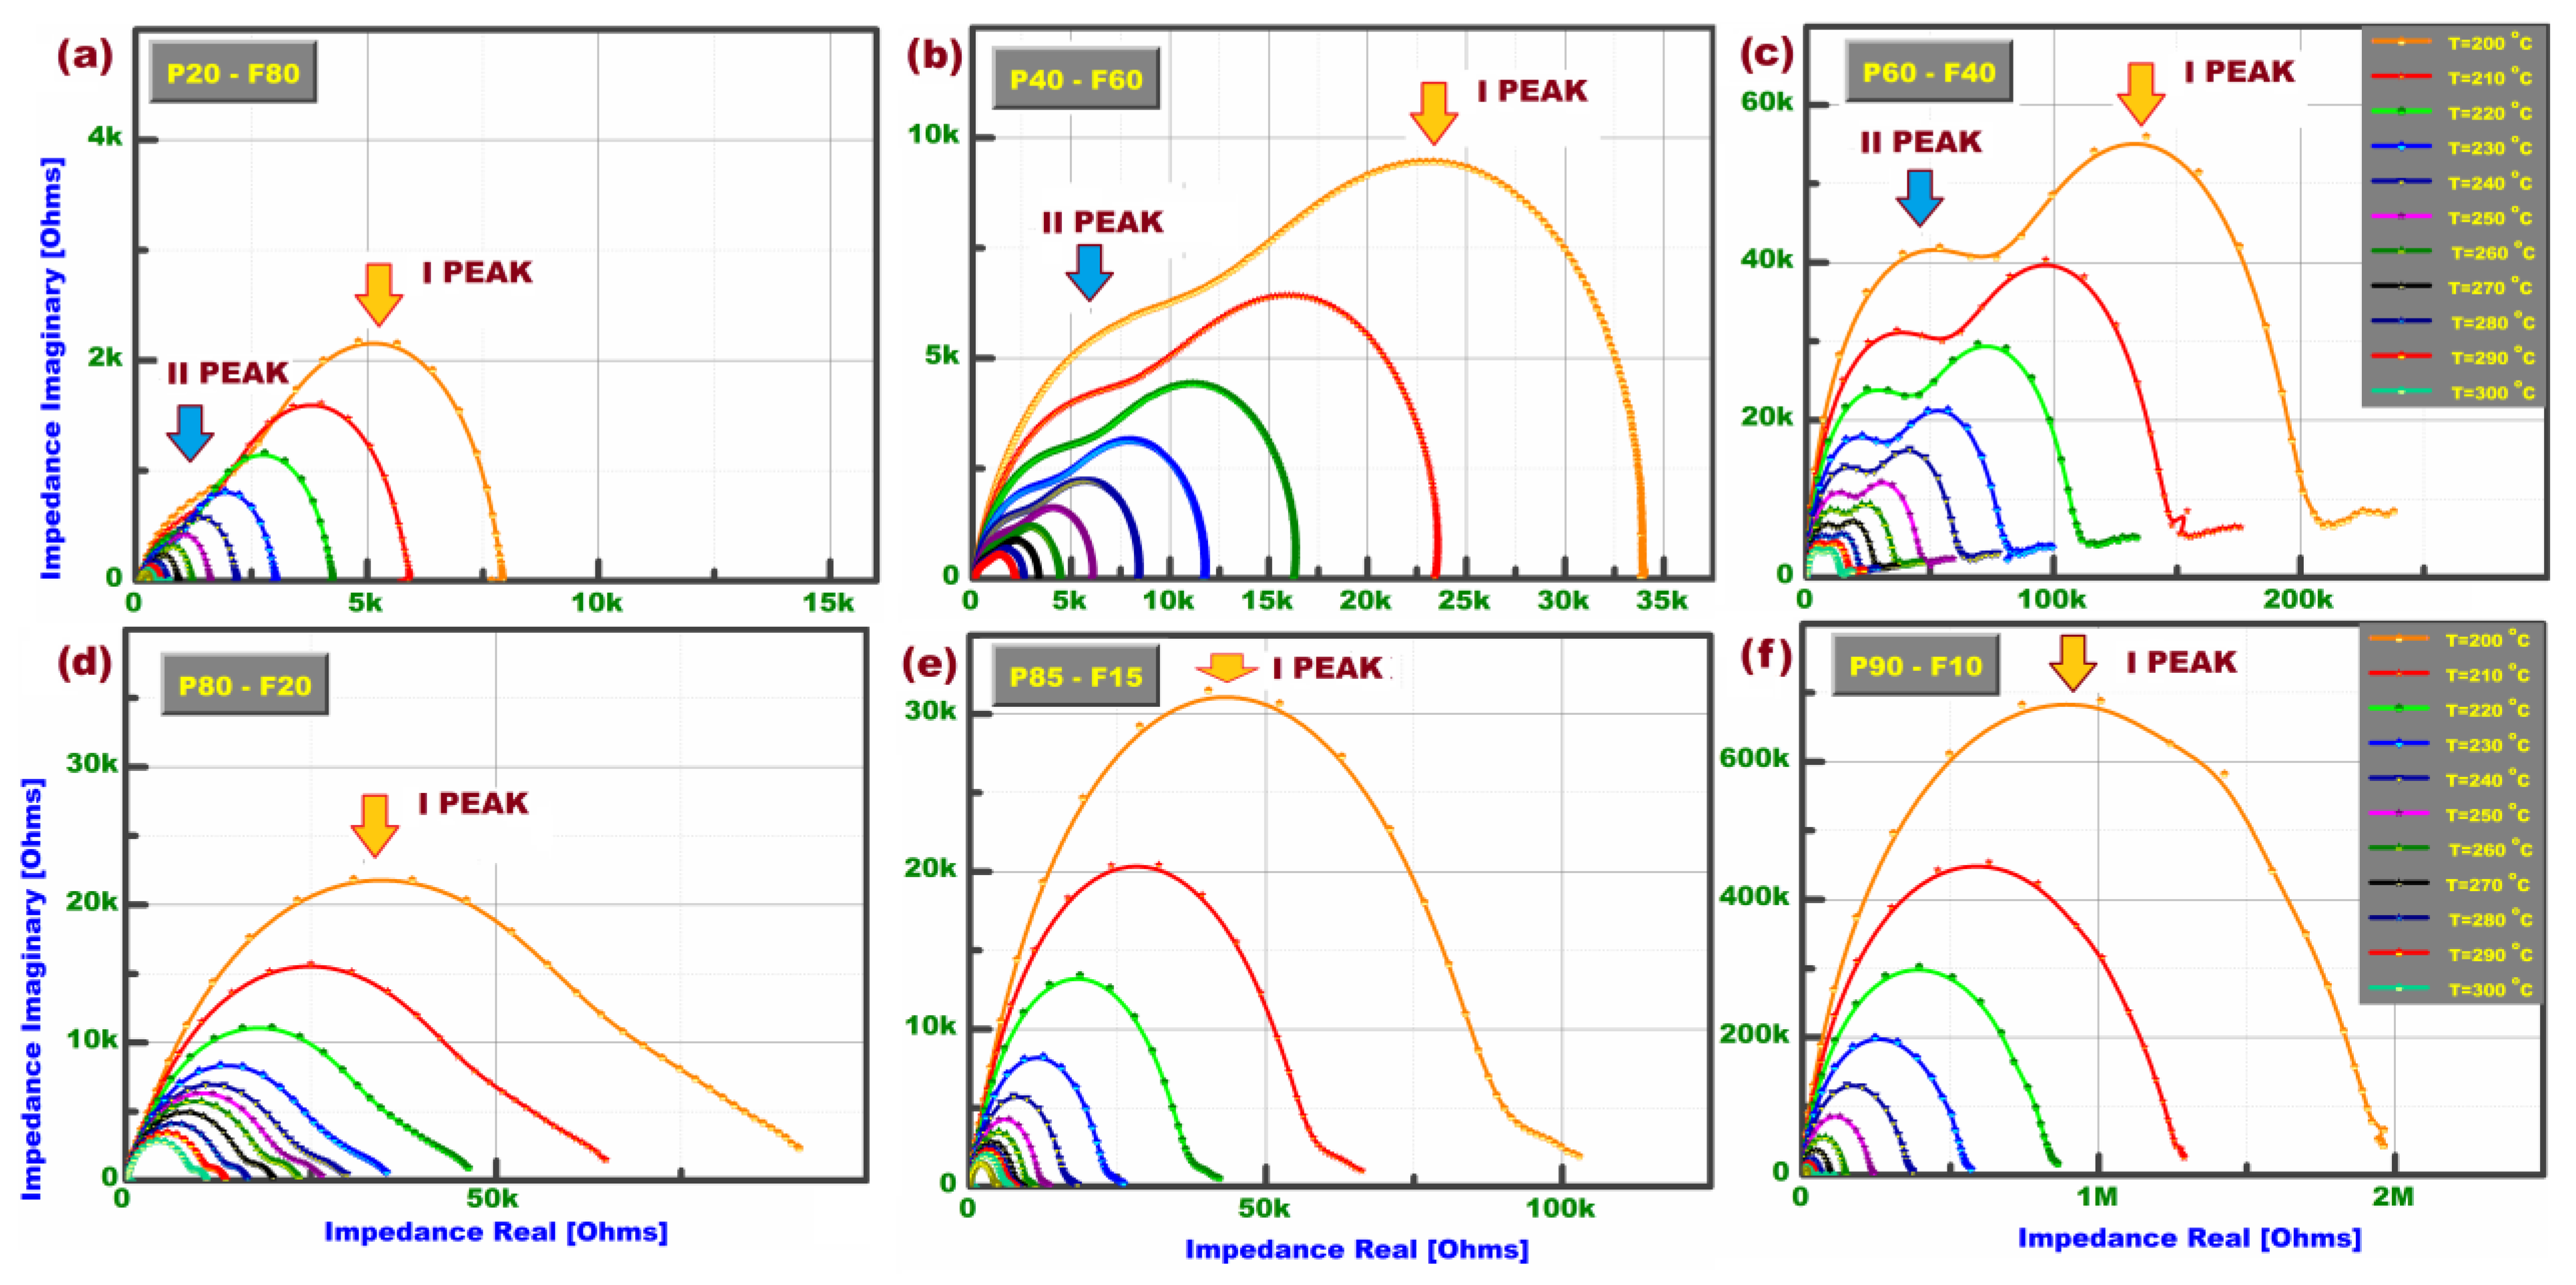
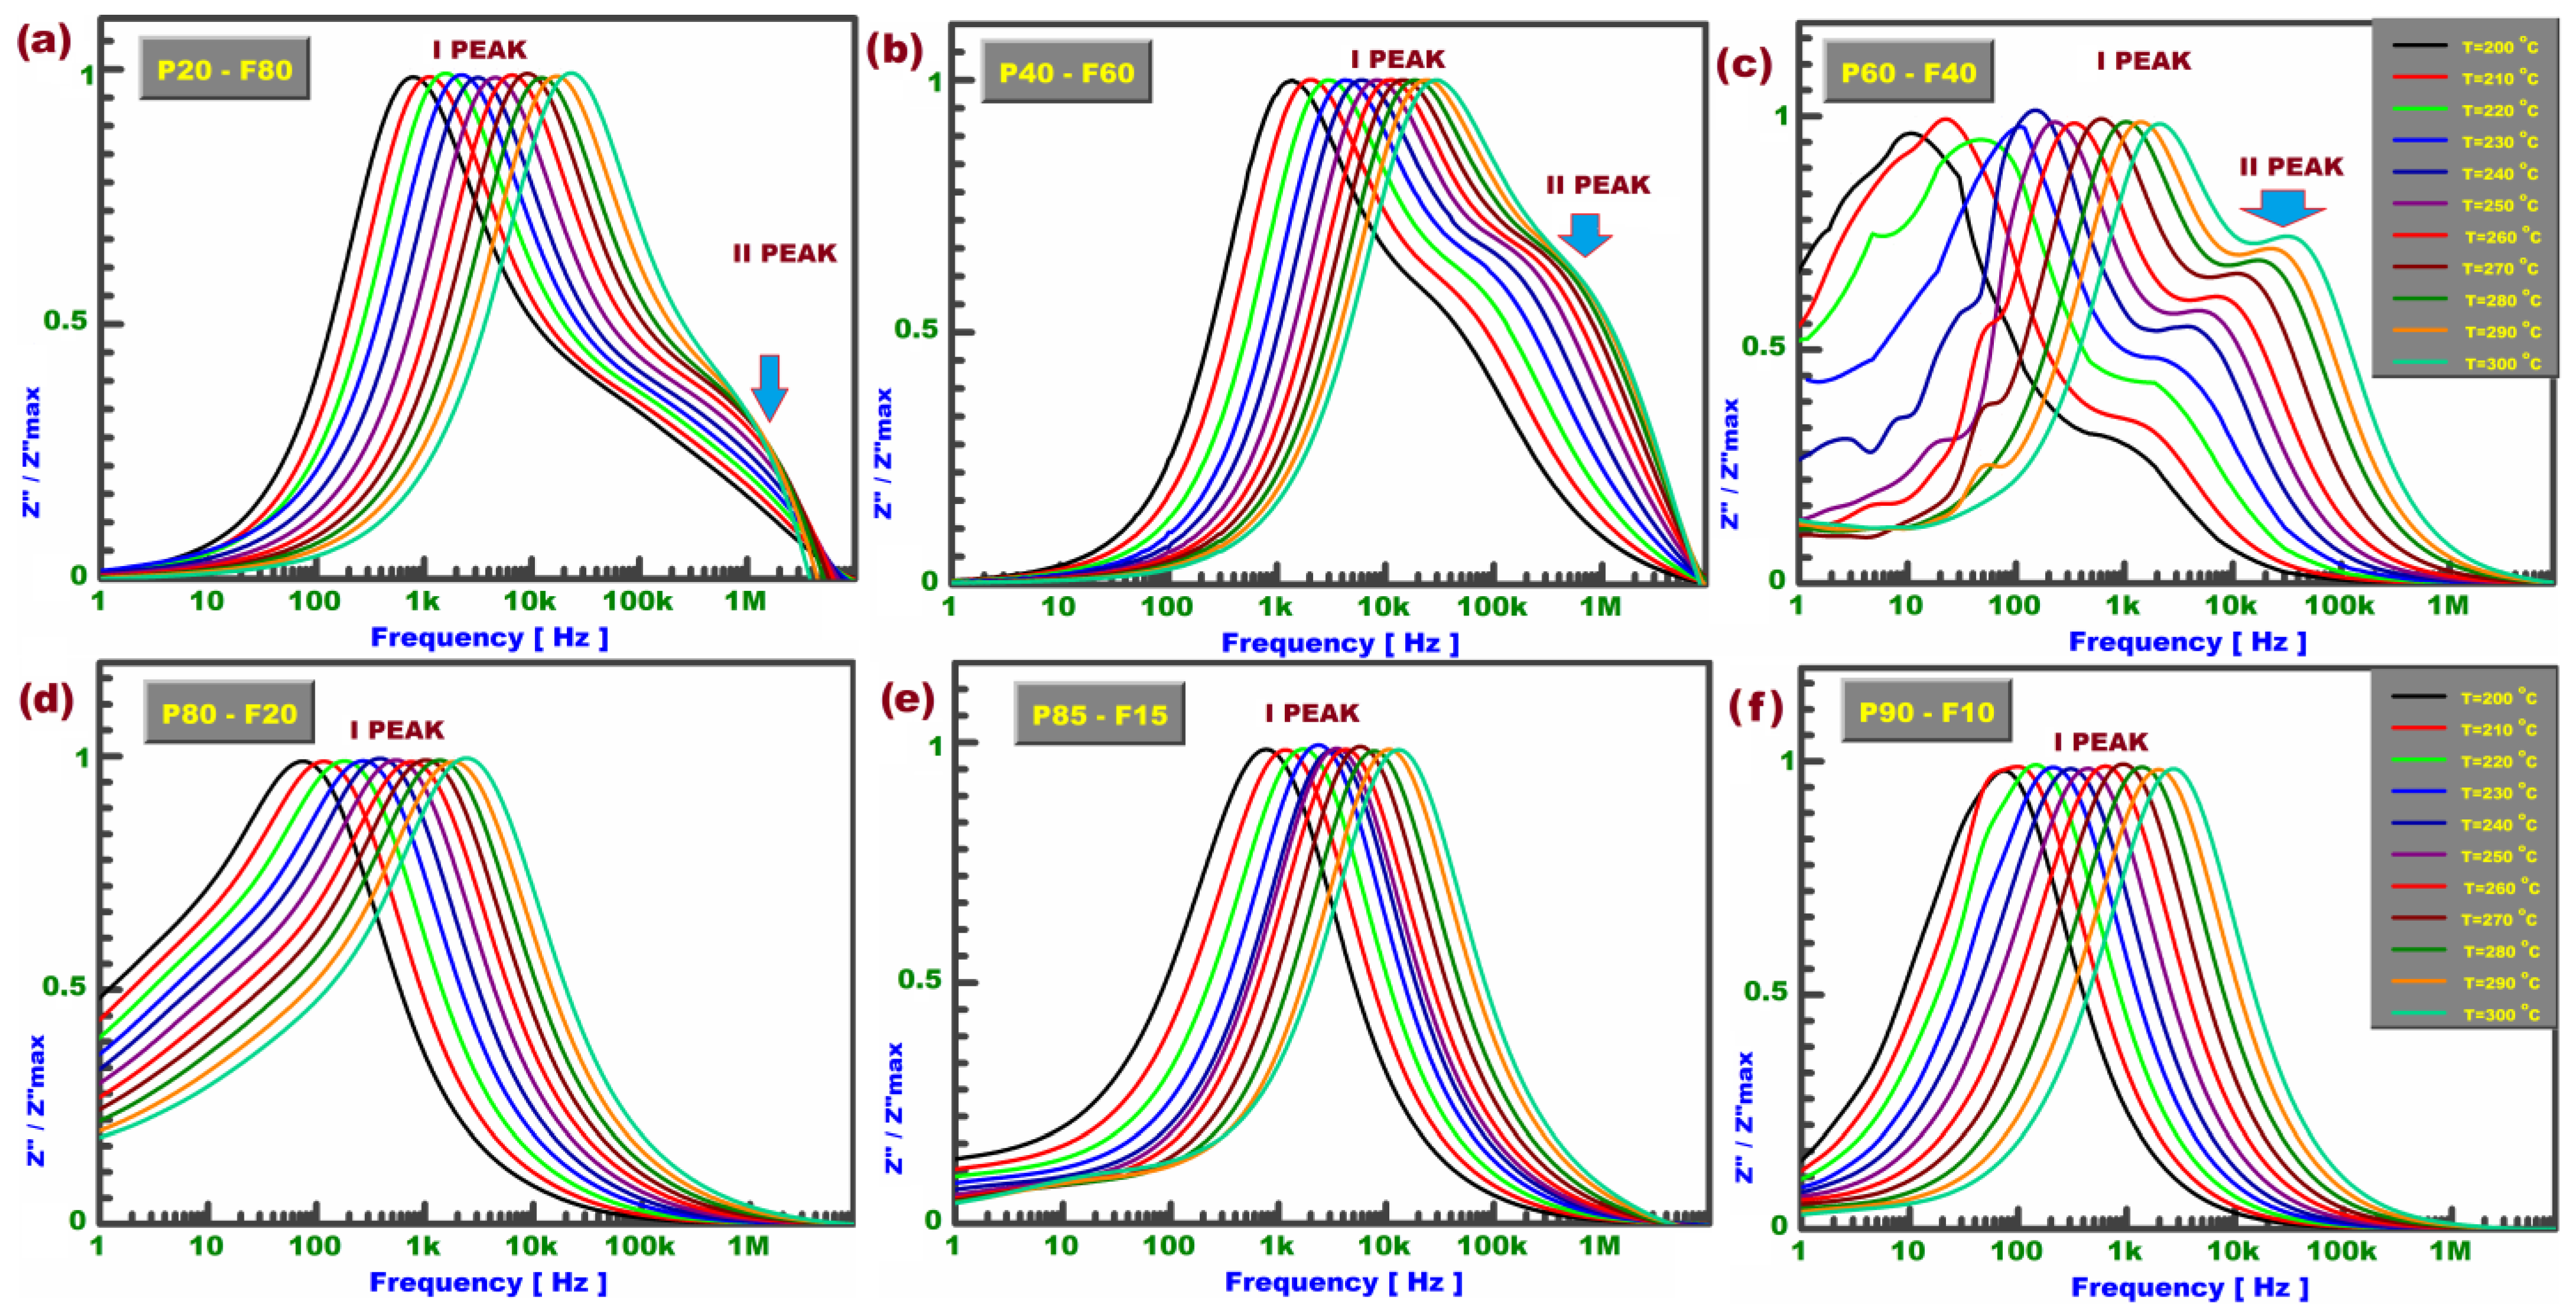
| Composition | ER1 for I Peak | ER2 for II Peak |
|---|---|---|
| P20-F80 | 0.18 ± 0.1 eV | 0.17 ± 0.1 eV |
| P40-F60 | 0.16 ± 0.1 eV | 0.15 ± 0.1 eV |
| P60-F40 | 0.18 ± 0.1 eV | 0.17 ± 0.1 eV |
| P80-F20 | 0.17 ± 0.1 eV | - |
| P85-F15 | 0.15 ± 0.1 eV | - |
| P90-F10 | 0.16 ± 0.1 eV | - |
Disclaimer/Publisher’s Note: The statements, opinions and data contained in all publications are solely those of the individual author(s) and contributor(s) and not of MDPI and/or the editor(s). MDPI and/or the editor(s) disclaim responsibility for any injury to people or property resulting from any ideas, methods, instructions or products referred to in the content. |
© 2023 by the authors. Licensee MDPI, Basel, Switzerland. This article is an open access article distributed under the terms and conditions of the Creative Commons Attribution (CC BY) license (https://creativecommons.org/licenses/by/4.0/).
Share and Cite
Kozielski, L.; Bochenek, D.; Clemens, F.; Sebastian, T. Magnetoelectric Composites: Engineering for Tunable Filters and Energy Harvesting Applications. Appl. Sci. 2023, 13, 8854. https://doi.org/10.3390/app13158854
Kozielski L, Bochenek D, Clemens F, Sebastian T. Magnetoelectric Composites: Engineering for Tunable Filters and Energy Harvesting Applications. Applied Sciences. 2023; 13(15):8854. https://doi.org/10.3390/app13158854
Chicago/Turabian StyleKozielski, Lucjan, Dariusz Bochenek, Frank Clemens, and Tutu Sebastian. 2023. "Magnetoelectric Composites: Engineering for Tunable Filters and Energy Harvesting Applications" Applied Sciences 13, no. 15: 8854. https://doi.org/10.3390/app13158854