1. Introduction
Through the integration of perception, computing, communication, control, and other technologies, the expressway cooperative vehicle infrastructure system realizes the information interaction and intelligent cooperative control among people, vehicles, roads, and cloud servers so as to comprehensively improve the safety, efficiency, and comfort of expressway traffic and provide real-time and highly reliable environmental perception and control decision-making information for networked and intelligent vehicles [
1,
2]. The transmission of information in the cooperative vehicle infrastructure system is mainly divided into two modes: V2V and V2I [
3]. There are two kinds of homogeneous networks in the cooperative vehicle infrastructure system, namely the roadside perception control network and the vehicle self-organizing network; RSU plays a key node role between them.
The layout of RSU is one of the hot topics in the design process of vehicle road collaborative systems. In the existing design schemes, the layout mode under the constraints of cost and benefit is considered more [
4,
5,
6,
7]. Yu et al. [
8] established an RSU deployment strategy based on traffic demand considering the two goals of balancing efficiency and coverage so as to achieve the purpose of serving most vehicles under low coverage and reducing VANET delay under low cost. Cai et al. [
9] introduced a two-layer improved greedy algorithm. The improved Kruskal algorithm embedded in the first layer greedy algorithm is used to deploy C-RSU and cable, while the second layer improved greedy algorithm is used to determine the optimal number of U-RSU and its flight strategy to achieve the maximum effective traffic coverage under budget constraints. The above arrangement achieves the best income or coverage through constraints but does not take into account the situation when the intelligent network car is mixed in. On the premise of referring to the above constraint variables, this paper innovatively introduces the concept of permeability and discusses the deployment problem under different levels of permeability.
A balance between the installation and maintenance costs and adequate RSU coverage should be maintained to determine the appropriate RSU deployment location to maintain network connectivity and reduce installation costs in a given area. Wang et al. [
10] proposed an RSU layout scheme based on centrality in urban or suburban areas, thus transforming the RSU layout problem into a linear programming problem and using centrality to measure the node importance to select the node layout. Yang et al. [
6] investigated the time-bounded and cost-constrained RSU deployment (DBCL) problem in urban VANET and proposed a binary differential evolution scheme to maximize the number of roads covered by RSU, providing higher road coverage and lower packet loss rates. Based on the consideration of V2V communication connectivity, Xue et al. [
11] built an optimized RSU layout model for maximum information coverage and robustness and considered the layout cost of RSU cells but lacked relevant consideration for the cost of the network between RSUs. The above research has the advantage of realizing low cost and high coverage of RSU but the impact of V2V and V2I on RSU layout is not considered. In this paper, the communication between V2V and V2I is included in the model construction and the information transmission energy loss is quantified.
With the deepening of research, research on RSU layout [
12,
13,
14,
15,
16] under the influence of V2V and V2I has also come into being. Xue et al. [
11] proposed a connection-oriented RSU deployment scheme with maximum coverage to achieve a maximum performance of V2I communication in urban areas. The number of RSUs should be reduced to ensure communication performance while covering most vehicles on the road. Nguyen et al. [
17] proposed a multi-hop forwarding scheme between vehicles so that there is always a multi-hop forwarding path to the target vehicle through V2V communication in the uncovered area. The above studies assume that the proportion of intelligent vehicles is 100%; the layout mode is optimized by optimizing algorithms, establishing models, etc., without considering the layout adjustment during the infiltration process of intelligent vehicles from 0% to 100%, which is a lack of flexibility. Based on the above purpose, this paper proposes a revenue model of intelligent connected vehicles under different penetration rates, determines the deployment spacing under different traffic density and penetration rates, and fills the gap in this field.
The innovation points of this paper are as follows. (1) By introducing permeability to reconstruct the traffic flow information flow coupling model and node energy loss model, the positive and negative balance model of layout income is constructed based on the assumed conditions and the basis for roadside RSU deployment under different modes is provided for intelligent high-speed sensor network builders. (2) MATLAB programming software is used to realize the visual output of the income model results under the changes in highway traffic density, the intelligent vehicle penetration rate, and roadside RSU deployment spacing; a set of matching income verification models is established. In addition, the model has a reliability of more than 93% which can provide a deployment basis for intelligent high-speed sensor network builders to deal with the layout adjustment after the infiltration of intelligent vehicles in the future and provide the optimal deployment spacing under different income models, which not only saves deployment costs but also ensures high connectivity between nodes so that the deployment cost ratio is optimized.
2. Statement of RSU Deployment in Expressway
Based on the intelligent expressway sensor network in the coexistence environment of V2V and V2I communication, this paper constructs the optimal deployment model of roadside RSU including roadside RSU information coverage income, information transmission deficit in the life cycle, and the construction and maintenance cost [
11,
18] from the perspective of intelligent expressway sensor network builder; it determines the deployment spacing under different permeability to achieve the purpose of reducing the deployment cost of roadside RSU. Moreover, this paper reconstructs the model based on the traffic flow–information flow coupling theory [
19,
20,
21,
22,
23] and the WSN node energy loss model [
24], combining the permeability characteristics to determine the deployment adjustment of roadside RSU under different influences, that is, the deployment interval under different income states.
2.1. Roadside RSU Perception Analysis under Cooperative Vehicle Infrastructure Perception
The cooperative vehicle infrastructure network is mainly composed of a roadside unit, vehicle unit, and communication network; the communication network mainly includes V2V, V2I, and V2X. In the cooperative vehicle infrastructure network, V2V and V2I are the keys to information transmission [
17,
25] while the roadside RSU is the hub of information interaction and its deployment effect will directly affect the quality of the cooperative vehicle infrastructure network. When only considering V2I, dense roadside units need to be deployed, thus causing an increase in deployment cost; there is also the problem of information interference between multiple roadside RSU, resulting in redundancy of vehicle information.
At present, the academic research on roadside RSU deployment has not considered the impact of permeability, that is, the ratio of intelligent vehicles to the total number of vehicles. The traditional model for roadside RSU deployment is generally considered through two factors, such as communication coverage and deployment cost, without taking into account the deployment impact of intelligent connected vehicles as information transmission units. When the roadside RSU interacts with the surrounding intelligent connected vehicles, the intelligent connected vehicles within its coverage can transmit information normally while the intelligent connected vehicles outside the coverage can realize V2I information interaction through the transmission of intermediate vehicles which expands the scope of information transmission, as shown in
Figure 1. In addition, due to the influence of equipment performance and external environment interference, when the communication distance between devices is too large under the existing wireless communication technology, the information cannot be transmitted effectively in time. Therefore, when considering roadside RSU deployment, it is necessary to consider the suitable deployment spacing which can maximize the information transmission. In addition, it is beneficial for autonomous vehicles to drive according to rules since the expressway scene is relatively simple. Therefore, most of the smart road pilot projects are based on the expressway scene, as is the case in this paper.
2.2. Characteristics Analysis of Vehicle Cluster and Information Transmission
In the vehicle self-organizing network, a large number of intelligent connected vehicles bear the responsibility of network communication as information transmission nodes in the network. Some scholars have carried out a lot of research on the positioning of vehicles in the road network using vehicles as research units [
26,
27,
28]. However, due to the fast-moving speed of vehicles, the difficulty of trajectory prediction and the large number of nodes, it is not feasible to study the mobility attributes of vehicles using vehicle nodes as units. Therefore, this paper adopts vehicle clusters as the research object in vehicle self-organizing networks. As a large number of vehicles are divided into clusters in this paper, the vehicles within the same cluster can realize information transmission by single-hop or multi-hop. Since the expressway has the characteristics of relatively small traffic density, fast vehicle speed, relatively fixed driving direction, and easy prediction of driving trajectory, it is suitable to adopt a Poisson distribution. It is assumed that the vehicles arriving near the roadside sensing unit obey the Poisson distribution which means that the probability of the existence of
vehicles at the average traffic density
on an expressway of length
L is as in Equation (1):
The arrival of the vehicle obeys the Poisson distribution and the arrival time interval obeys the exponential distribution. Assuming that the driving speed of the vehicle is the same, it is deduced that the distance
between vehicles also obeys the exponential distribution, as shown in Equation (2). Assuming that the communication range of intelligent vehicles is a circle with
as the radius, when
and
, the probability of communication and non-communication between vehicles is shown in Equations (3) and (4),respectively.
represents permeability. Within the vehicle cluster, each node has access to the information transmitted by the cluster head, therefore, the vehicle cluster length can be calculated by the number of intervals; then, the probability of having
intervals in the cluster is as in Equation (5).
Based on the information flow–traffic flow coupling theory, the transmission of information flow in the traffic flow of connected vehicles is divided into two categories, namely instantaneous transmission and ferry transmission. When the distance between two adjacent vehicles is less than or equal to the radius of information transmission, instantaneous transmission will occur and information will be transmitted directly between vehicles through wireless communication. Ferry transmission occurs when the distance between two adjacent vehicles is greater than the information transmission radius, at which time the information will be attached to the vehicle and continue to move along the traffic flow. The speed of information transmission is equal to the speed of the vehicle until the distance between the next transmission target vehicle is equal to the transmission radius; at this point, after completing the ferry transmission, a new round of transmission will begin.
In summary, there is a fixed mode of information flow transmission in traffic flow. Each group of information consists of one or more instantaneous transmissions and one ferry transmission. Now,
is used to represent the transmission distance of instantaneous transmission and
is the transmission distance of ferry transmission; hence, a group of information transmission arises whose transmission distance L can be obtained by summing the two parts. Due to the influence of dynamic traffic flow, both transmission distances are random variables and the two expected distances can be obtained by combining the distribution of vehicle spacing in traffic flow, as in Equation (6).
2.3. Basic Assumptions
- (1)
In this paper, the information life cycle is set as a parameter. When the time that the vehicle information is transmitted to the RSU through multi-hop is greater than the life cycle time of the information itself, the jump transmission is not continued, that is, the timeliness of the information is inactivated. In addition, the positive income of each model after receiving information is equal;
- (2)
The vehicle clusters in this paper are directional vehicles, which consider the road direction, while the length of each directional section is 1000 m, the average traffic flow density is , and the average traffic flow speed is ;
- (3)
In this paper, the energy loss of nodes is used to quantitatively represent the information deficit caused by equipment and environmental factors in the process of information transmission. Due to the lack or loss of information caused by external interference and other factors, the greater the range between nodes, the more energy loss is generated when the distance between vehicles is too long to pass;
- (4)
Under the condition that the deployment and maintenance cost of the roadside RSU units and single RSU power transmission private network are fixed and known, the unit price will not vary with the deployment distance and the total cost is only affected by the distance variation [
29];
- (5)
The roadside RSU units are connected by straight lines which means that the wiring distance is equal to the distance between the RSUs and the wired connection between the RSUs and the cloud platform is not considered in this paper [
29].
3. Income Model of Roadside Units
In this section, the relationship between the permeability and the roadside RSU information coverage income
, the life-cycle information transmission deficit
, and the construction and maintenance cost
is further investigated. For
, this paper constructs the relationship between permeability and coverage based on the existing traffic flow–information flow coupling theory and establishes the roadside RSU information coverage income function. For
, this paper constructs the relationship between the permeability and the deficit generated by information conduction during the life cycle based on the energy loss model of WSN nodes. For
, the cost is only related to the number of roadside RSUs and the length of deployment, which can be directly used for calculation under the condition that the unit price of equipment, installation, and maintenance remain unchanged. In summary, the optimal deployment model P-P (permeability-profit max) of roadside RSU is shown in Equation (7):
Here, and represent the deficiency and cost coefficients which are used to control the effect of the dimension between different units.
3.1. Positive Income of Roadside RSU Coverage
In the process of driving on the highway, with the mixing of intelligent connected vehicles, the surrounding information obtained by the driver will increase correspondingly and the driving will become more stable, which can be approximately a uniform traffic flow. It is assumed that the driving speed of the vehicle at this time is and the chasing speed is .
Under the condition of assumption (1), the income generated by each vehicle after receiving information is equal during the information life cycle , so the income generated by the roadside RSU coverage can be expressed by the total number of vehicles covered by information transmission and is linearly correlated. Making the income generated by each piece of information in the process of transmission is equal to the maximum number of vehicles that can be covered during the information life cycle.
Based on the above objectives, this paper firstly constructs the cluster length model of vehicle clusters under different permeabilities according to the information flow–traffic flow coupling theory [
19,
20,
21,
22,
23]. Secondly, based on assumption (2), the time expectation model of information transmission in the life cycle is constructed under the consideration of opposite traffic flow. The total number of vehicles covered by roadside RSU can be obtained by combining the above cluster length model, time expectation model, roadside RSU coverage radius, and average traffic density, namely
.
3.1.1. Construction of an Instantaneous Transmission Model under Different Permeabilities
The expressway scene studied in this paper can be approximated as a one-dimensional scene in which intelligent vehicles act as important nodes in the information transmission process in a vehicle self-organizing network. As shown in
Figure 2, when the distance between two adjacent vehicles is less than or equal to the perception radius
of the intelligent connected vehicle, instantaneous transmission will occur and the information will be transmitted directly between vehicles through wireless communication.
In
Figure 2, when the distance
between vehicle
and vehicle
and the distance
between vehicle
and vehicle
are less than
, the information carried by vehicle
can be transmitted through vehicle
by two jumps and then transmitted to vehicle
. When the distance between two adjacent vehicles is greater than
, the ferry transmission will occur. At this time, the vehicle will continue to move along the traffic flow carrying information until the distance between it and the next target vehicle is equal to
, at which point a new round of instantaneous transmission will begin.
In the process of information transmission, when W, instantaneous transmission occurs between vehicles. According to the analysis of vehicle cluster characteristics above, the expected distance of single-hop instantaneous transmission is as in Equation (8), the instantaneous transmission distance is as in Equation (9), and the transmission time is as in Equation (10).
In the equation,
represents the expected number of hops of a set of information instantaneous transmission and
represents the probability of instantaneous transmission of information between vehicles, whose expressions are Equations (11) and (12), respectively.
represents the single-hop transmission time.
3.1.2. Construction of the Ferry Transmission Model under Different Permeability
When ferry transmission occurs in a vehicle, the information carried by the intelligent connected vehicle flows along the moving direction of the vehicle until
and the information is transmitted. Based on the information flow–traffic flow coupling theory, ferry transmission is divided into four types, as shown in
Figure 3. The initial state of the two types of ferry transmission is the same in that the traffic flow direction is the same as the information flow direction, as shown in
Figure 3a,b. In
Figure 3a, when the vehicle
catches up with the vehicle
in the same direction before encountering the reverse vehicle
, this is the first type of ferry transmission. As for
Figure 3b, when the vehicle
first encounters the reverse vehicle
, it is the second type of ferry transmission. In the third and fourth types of ferry transmission, the ferry transmission direction is opposite to the information flow direction, as shown in
Figure 3c,d. In
Figure 3c, the vehicle
will be overtaken by the same rear vehicle
, which is the third type of ferry transmission. In
Figure 3d, the distance between two adjacent vehicles gradually increases and vehicle
has to complete information transmission before meeting, which is transformed into the second type of ferry transmission.
Therefore, the above four types are divided into three transmission methods. When calculating the expected transmission distance
of ferry transmission, Equations (13) and (14) can be obtained by weighting the above three transmission types as well as the corresponding transmission time Equation (15):
In the equation, represents the expected transmission distance of the above three methods, represents the proportion of the three methods, represents the speed of the vehicle carrying the information, and represents the chasing speed.
3.1.3. RSU Vehicle Coverage under Different Permeabilities
According to the above analysis, the transmission of information in traffic flow is divided into instantaneous transmission and ferry transmission. With the ratio of transmission distance to transmission time, a set of information transmission speeds in this traffic flow can be obtained, as in Equation (16). Therefore, the transmission distance
of information within the life cycle
is as in Equation (17). The number of roadside RSU vehicle coverage, which is the positive income generated by roadside RSU coverage, is as in Equation (18).
In the equation, is the radius of RSU coverage.
3.2. Roadside RSU Coverage Negative Income
3.2.1. Information Transmission Deficit
In the construction of the negative income model, the negative income mainly includes two aspects: the information transmission deficit and the network construction and maintenance cost . In the first part, when the information is transmitted in the wireless sensor network, the information received by some nodes is defective and distorted due to the interference of equipment and the external environment. Based on assumption (3), this paper uses node information transmission energy loss to represent the economic loss caused by information distortion and transforms the abstract problem into a quantitative problem. In addition, the energy loss problem of the node can be carried out from multiple angles, which will be explained in this section.
Three main types of energy loss occur in the process of information transmission between nodes, which are the transmission energy loss
, receiving energy loss
, and unit data fusion energy loss
. Depending on the distance between the roadside unit nodes to the vehicle nodes, the free-space model and the multi-path fading model [
22] are applied, in which the free-space model is used within the threshold range and the multi-path fading model is used outside the range.
Based on the assumption (3) that the distance between nodes is proportional to the energy loss, the model is selected by whether the distance between nodes is greater than a set threshold value
, as in Equation (19). The energy loss generated by nodes transmitting information is as in Equation (20).
In the equation, represents the data length of information transmission; represents the circuit energy loss per bit of data transmitted or received by the node; represents the distance between the transmitting node and the receiving node; and and represent the circuit energy loss amplification factor of the free space model and the multi-path fading model. The free-space model is used when and the multi-path fading model is used when .
In addition, the energy loss generated by the node receiving information is as in Equation (21). To facilitate the description, a single vehicle cluster is taken as an example to illustrate and explain with. After the cluster head receives the information transmitted by each node, the energy loss generated during the information fusion process is as in Equation (22).
In the equation,
is the number of nodes in the cluster and
is the energy loss per unit of data fusion. In summary, the information transmission energy loss
is as in Equation (23).
In the equation, is the number of vehicles in a vehicle cluster for data fusion. If there are no special requirements, is equivalent to the hops of information transmission.
3.2.2. Construction and Maintenance Cost
The second part of construction and maintenance cost W is divided into two parts: the network cost and roadside RSU cost. Based on assumption (4), the network cost unit price required for the deployment of roadside RSU is known and fixed and will not change with the increase in the deployment length. Based on assumption (5), the roadside RSU are connected to each other by straight lines and located in the road with a linear distribution.
In the calculation of the construction and maintenance cost
, the part shown in
Figure 4 is a calculation unit so the network cost of the unit can be divided into the following two cases according to the cluster length, as in Equation (24). When
, the information transmission between the vehicle clusters shown in
Figure 4a cannot increase the communication distance of the roadside RSU and
is only related to
. When
, the information transmission between the vehicle clusters shown in
Figure 4b can increase the communication distance of the roadside RSU;
is related to
. In summary, the network cost can be obtained by multiplying the RSU coverage length and the single vehicle cluster length in different intervals by the network cost unit price. The total cost is the sum of the network cost and roadside unit RSU cost, as in Equation (25).
In the equation, represents the length of a single vehicle cluster; represents the number of computing units; represents the unit cost of the network; and represents the unit cost of the roadside RSU.
5. Conclusions
5.1. Summary of Results
To address the practical needs of roadside RSU deployment in a cooperative vehicle infrastructure system, this paper proposes an optimal deployment method for roadside RSU in the coexistence of V2V and V2I communication. From the perspective of an intelligent expressway sensor network builder, it analyzes the changes in the income model under the influence of permeability and traffic density and determines the values of permeability under several different income models so that the spacing of roadside RSU unit deployment under each model can be inferred. In addition, the reliability of each part of the model is verified by the Warshell algorithm and the Kmeans clustering algorithm. The main results of this paper include the following aspects:
- (1)
Proposed income model for an intelligent expressway sensor network under the permeation of intelligent connected vehicles. The results of the income equation under different permeabilities and traffic densities are analyzed to determine the optimal spacing of roadside RSU deployment under the corresponding conditions. Taking the traffic density of 60 as an example, the following situations apply.
- Situation 1
When the intelligent connected vehicles reach 29%, the effective connection between the vehicles begins to form; or, when it is located on the state curve L3, the deployment spacing is 290 m.
- Situation 2
With the increase in intelligent connected vehicles, when it reaches 54%, the income model is at the maximum. At this time, the deployment spacing is 684 m and the income model is optimal on the peak curve L1.
- Situation 3
When the intelligent connected vehicle reaches 82%, the income model is zero. At this time, the information transmission of cooperative vehicle infrastructure is dominated by V2V and supplemented by V2I, whose corresponding deployment spacing is 2684 m and the income model is in equilibrium.
- (2)
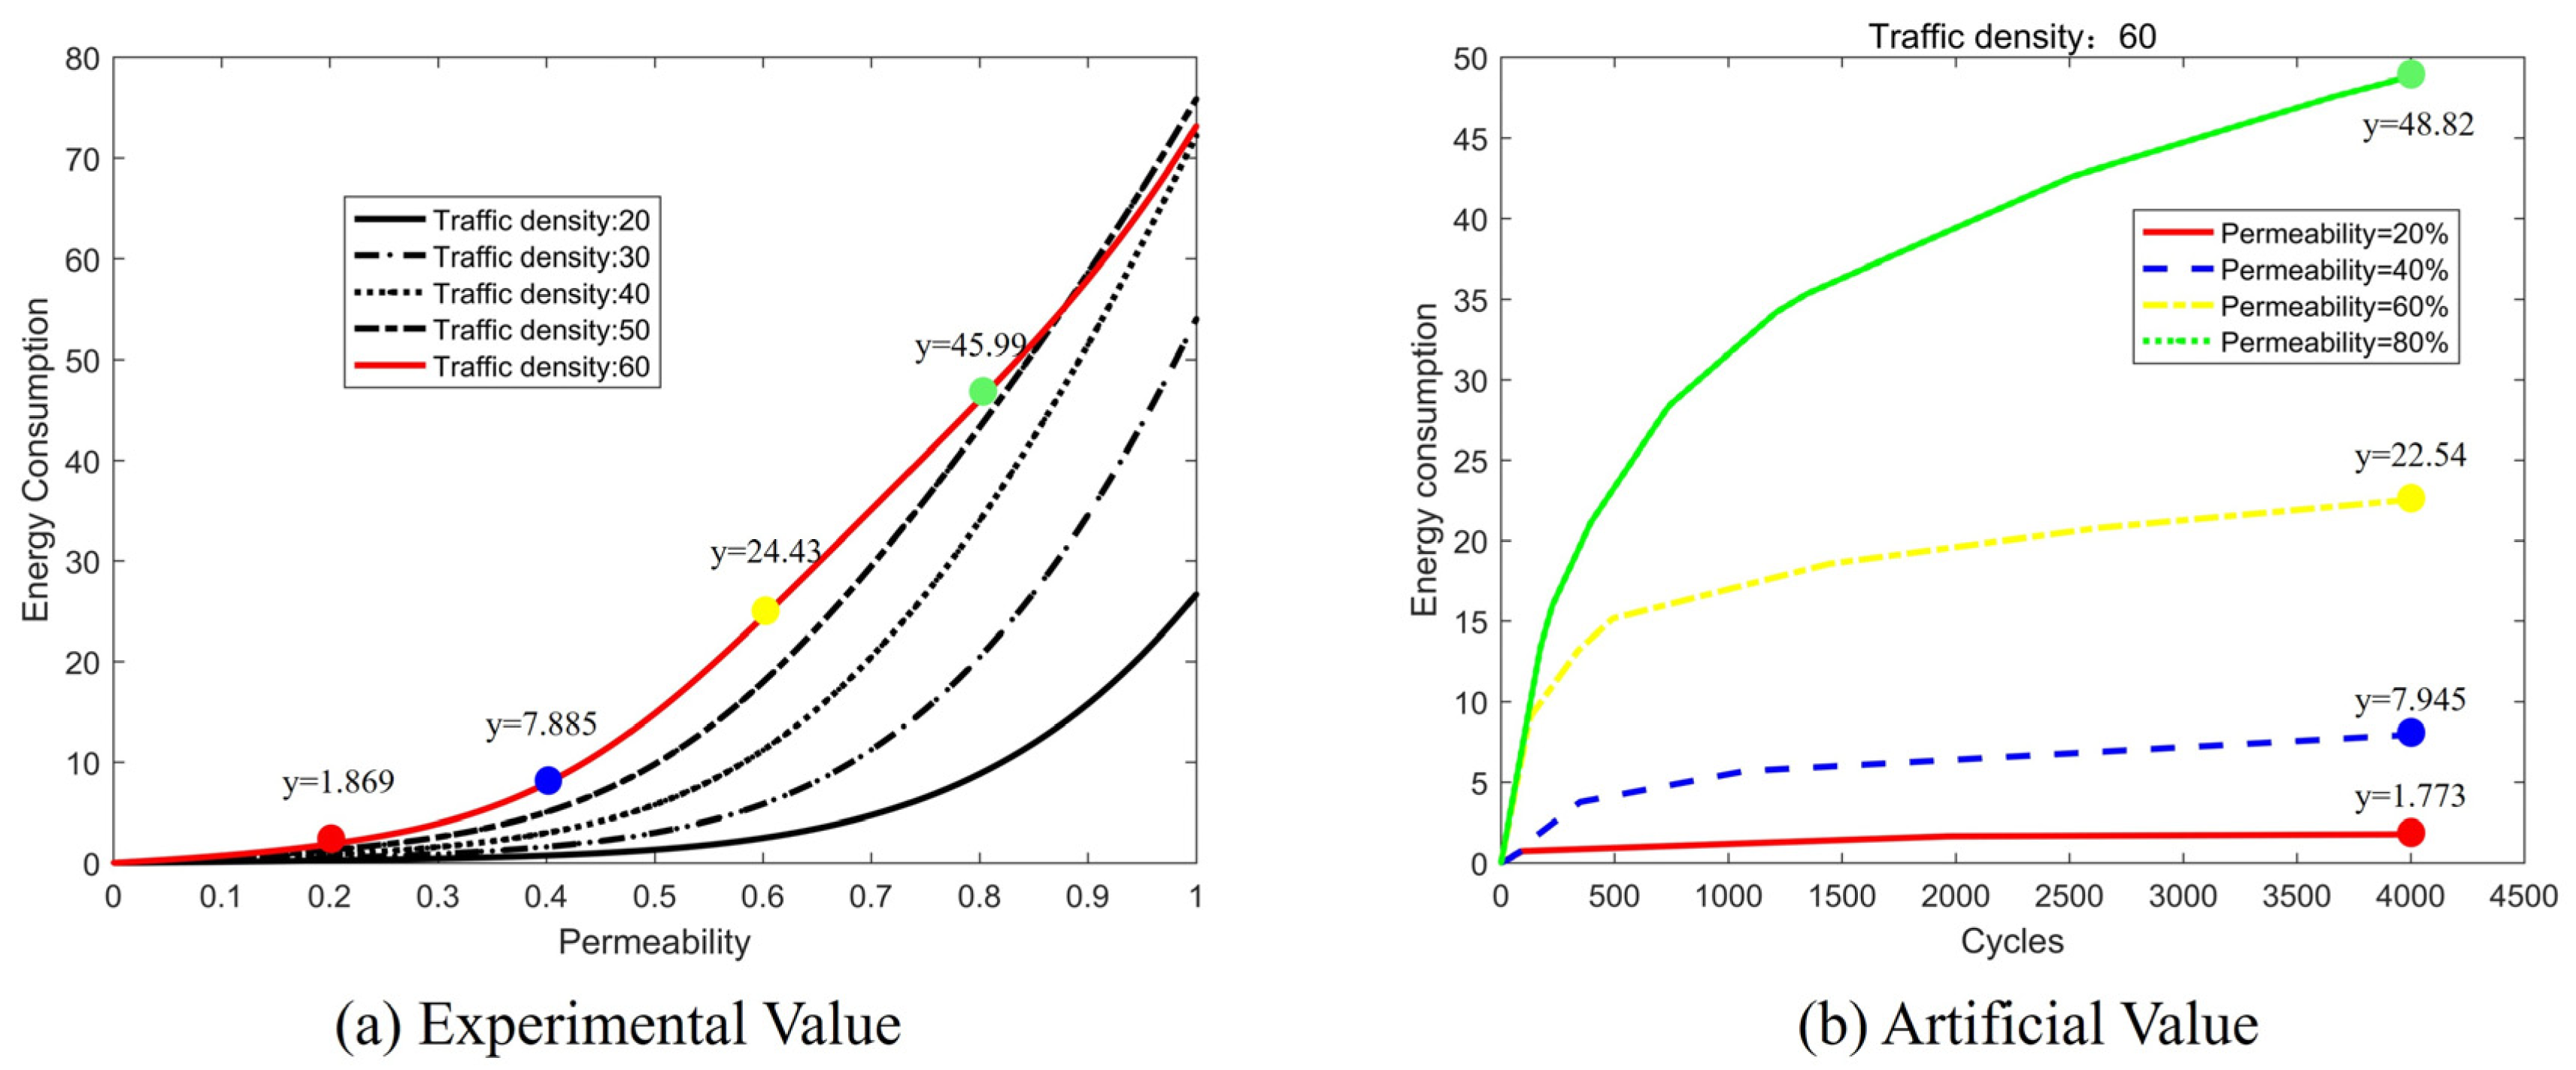
The Warshell algorithm is used to simulate and verify the permeability of effective connectivity between vehicles when the traffic density is 20, 40, 60, and 80. The simulation results show that the part of positive income has a reliability of 93.2%. The Kmeans clustering algorithm is used to simulate and verify the deficit caused by information transmission when the traffic density is 60 and the permeability is 20%, 40%, 60%, and 80%. The simulation results show that the information transmission deficit part has a reliability of 94.91%.
In summary, since both modeling and model simulation adopt uniform traffic flow, the income model has high reliability in determining layout spacing in the environment of the expressway and can be used as the optimal layout of roadside RSU.
5.2. Limitations and Future Research
Firstly, the model in this article only considers information transmission defects and maintenance costs in the negative revenue section and has not addressed the security issues caused by the disconnection of connected vehicles. The article assumes that the missing vehicle will be corrected by the driver for abnormal vehicle conditions. During this correction process, abnormal vehicles will not affect surrounding vehicles. Therefore, safety issues should also be considered in future research to prevent abnormal vehicles from causing safety accidents.
Secondly, the model is established in highway scenarios, with relatively few external influencing factors and no involvement in interference under abnormal weather conditions. Future research should consider adverse external environmental interference.


