
Lowari Tunnel Water Quality Evaluation: Implications for Tunnel Support, Potable Water Supply, and Irrigation in Northwestern Himalayas, Pakistan

 , ,
, ,  , ,
, ,  and
and
Abstract
:1. Introduction
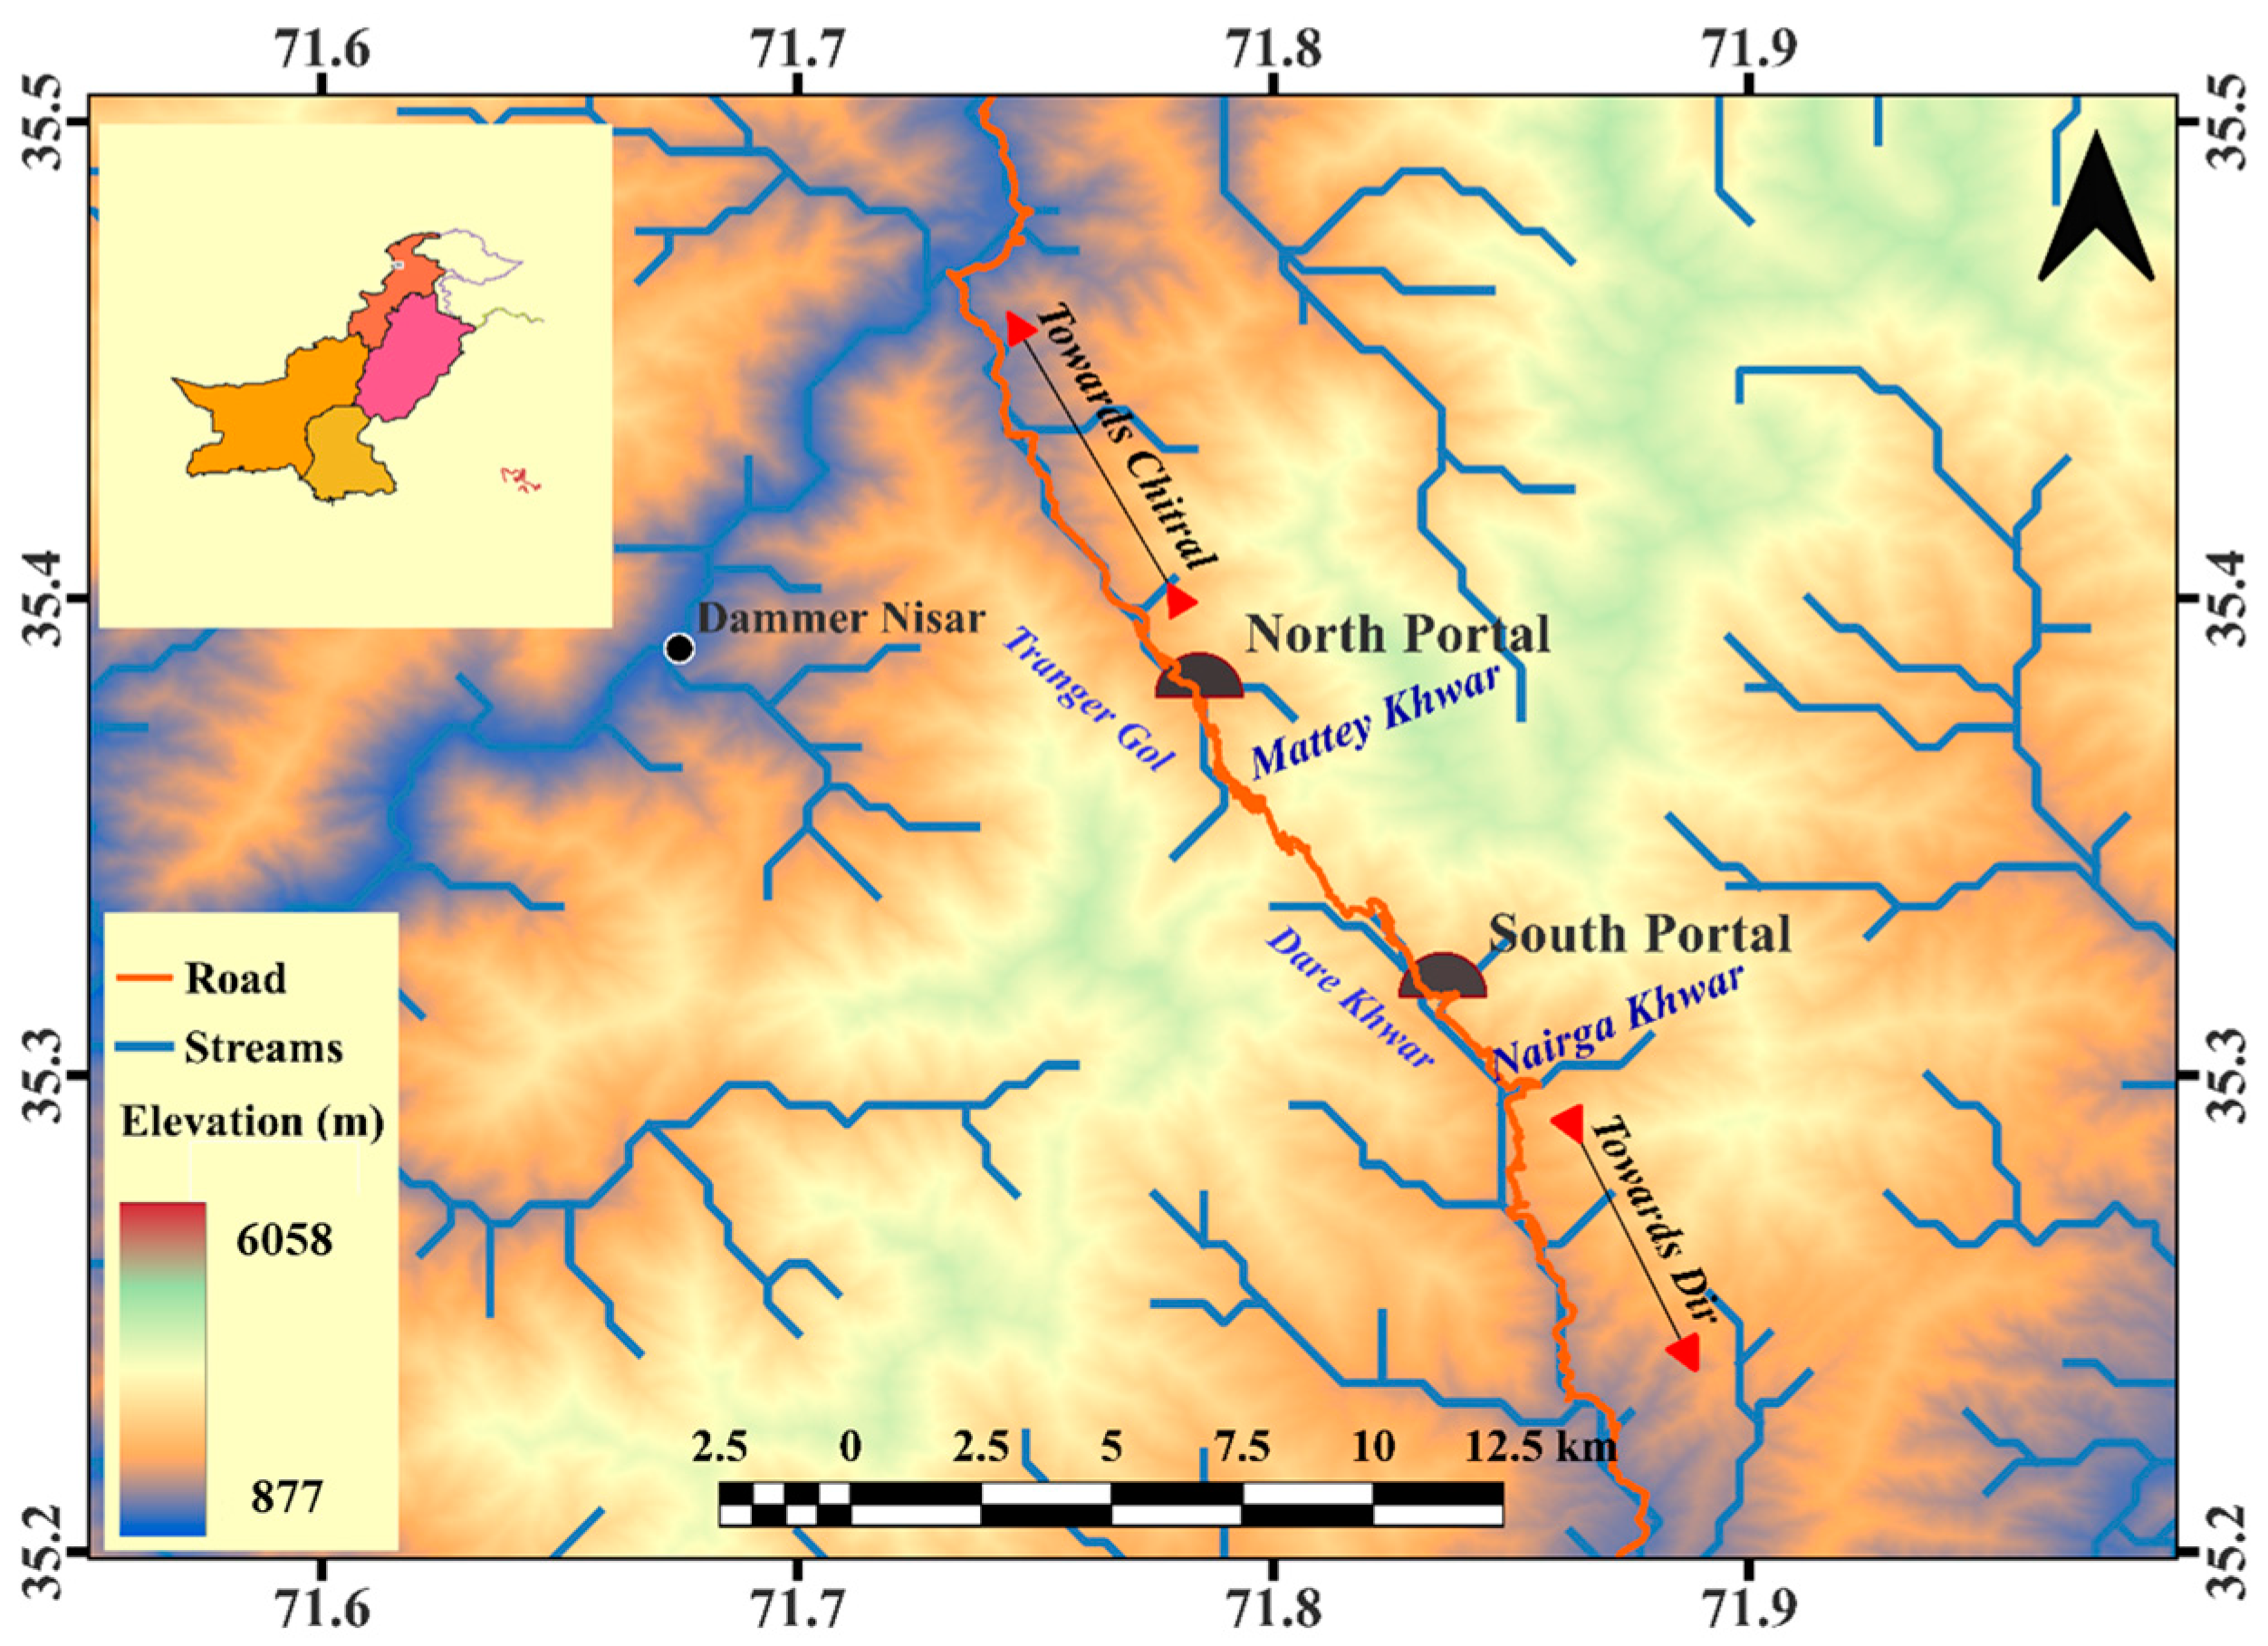
2. Study Area
3. Materials and Methods
3.1. Construction Stage
3.2. Operation Stage
- Using a pH meter, we potentiometrically measured pH using the conventional hydrogen electrode method (4500-H + B);
- Electric conductivity was measured using a resistor network by the laboratory method (2510 B);
- The method (2540 C) was used to calculate total dissolved solids;
- Total suspended solids were measured using gravimetry by the solids in water method (2540 D);
- Total hardness was determined titrimetrically using the EDTA titrimetric method (2340 C);
- Calcium was determined by titration using the EDTA titration method (3500 CaB) with a color indicator;
- Magnesium was determined using the calculation method (3500 Mg/B);
- Total alkalinity was determined by the titration method (2320 B) using a pH meter;
- Chlorine was determined by iodometric method I (4500-Cl-B) using titration with color indication;
- Sodium and potassium were measured using the flame emission photometric method (3500-Na B and 3500-K B) through flame emission.
4. Results and Discussion
4.1. Constrcution Stage
4.2. Operation Stage
5. Conclusions
- During the construction stage, the dewatering process carried out from the Lowari Tunnel (from April 2007 to February 2009), successfully managed water ingress with average discharge of 20 L/s. Seasonal water ingress was observed, primarily during snowmelt or heavy rainfall periods. During tunnel excavation, the successful grouting of water leakage points, such as joints and fractures, with shotcrete significantly reduced water infiltration. For the recorded period, during its operation stage, the Lowari Tunnel experienced natural water discharge at both the north and south portals. The measured water discharge rates vared between summer and winter, with higher rates observed during summer (10.08 L/s) compared to winter (6.96 L/s). This seasonal variation in water discharge is attributed to the snow melting process;
- During the construction stage, all measured hydrochemical parameters were within the normal range except for a low pH value (5.21), attributed to a high concentration of CO2 (14,000 ppm) inside the tunnel. In the operation stage, water analysis showed that most parameters in the south and north portals complied with WHO 2017 standards for drinking water. However, the pH levels deviated from the permissible range. The water in the south portal had acidic pH values of 5.22 (summer) and 5.83 (winter), while the north portal showed a pH of 5.83 (winter) and 7.51 (summer). The higher concentration of electric conductivity, total dissolved solids, total hardness, calcium, magnesium, total alkalinity, chlorine, sodium, potassium, and sulfate in the north portal can be attributed to its longer drainage stretch;
- Piper diagram revealed significant variation in hydrochemistry between seasons and portals. Mg was the dominant cation in the south portal during summer, while the north portal samples showed a lack of dominance by any cation. Na + K dominated in the south portal during winter, while Ca was the dominant ion in the north portal. Bicarbonate was the dominant anion in both seasons and portals. The majority of samples exhibited the Ca-Mg-HCO3 hydrochemical facies, indicating the influence of rock weathering. The Wilcox plot classified all samples as “excellent” for agricultural purposes, ensuring the suitability of the water for irrigation without adverse effects on soil properties or plant nutrient uptake;
- The difference in water quality parameters between the north and south portals is attributed to the geological and hydrological factors such as surrounding rock types and groundwater conditions [62,63,64,65,66,67]. Thus, understanding local geological and hydrological conditions is essential for effective tunnel water resource management.
Author Contributions
Funding
Institutional Review Board Statement
Informed Consent Statement
Data Availability Statement
Acknowledgments
Conflicts of Interest
References
- Chen, Z.; He, C.; Yang, W.; Guo, W.; Li, Z.; Xu, G. Impacts of geological conditions on instability causes and mechanical behavior of large-scale tunnels: A case study from the Sichuan–Tibet highway, China. Bull. Eng. Geol. Environ. 2020, 79, 3667–3688. [Google Scholar] [CrossRef]
- Holmøy, K.; Nilsen, B. Significance of geological parameters for predicting water inflow in hard rock tunnels. Rock Mech. Rock Eng. 2014, 47, 853–868. [Google Scholar] [CrossRef]
- Zhao, Y.; Li, P.; Tian, S. Prevention and treatment technologies of railway tunnel water inrush and mud gushing in China. J. Rock Mech. Geotech. Eng. 2013, 5, 468–477. [Google Scholar] [CrossRef] [Green Version]
- Kong, W.K. Water ingress assessment for rock tunnels: A tool for risk planning. Rock Mech. Rock Eng. 2011, 44, 755. [Google Scholar] [CrossRef] [Green Version]
- Zhang, D.; Fang, Q.; Lou, H. Grouting techniques for the unfavorable geological conditions of Xiang’an subsea tunnel in China. J. Rock Mech. Geotech. Eng. 2014, 6, 438–446. [Google Scholar] [CrossRef]
- Nilsen, B. Characteristics of water ingress in Norwegian subsea tunnels. Rock Mech. Rock Eng. 2014, 47, 933–945. [Google Scholar] [CrossRef]
- Panthi, K.K.; Nilsen, B. Uncertainty analysis for assessing leakage through water tunnels: A case from Nepal Himalaya. Rock Mech. Rock Eng. 2010, 43, 629–639. [Google Scholar] [CrossRef]
- Huang, S.; Guo, M. Analysis and strategies of the common tunnel problems. In Proceedings of the 2015 International Conference on Artificial Intelligence and Industrial Engineering, Phuket Island, Thailand, 26–27 July 2015; pp. 312–314. [Google Scholar]
- Hou, Y.; Fang, Q.; Zhang, D.; Wong, L.N.Y. Excavation failure due to pipeline damage during shallow tunnelling in soft ground. Tunn. Undergr. Space Technol. 2015, 46, 76–84. [Google Scholar] [CrossRef]
- Jagoutz, O.E.; Burg, J.-P.; Hussain, S.; Dawood, H.; Pettke, T.; Iizuka, T.; Maruyama, S. Construction of the granitoid crust of an island arc part I: Geochronological and geochemical constraints from the plutonic Kohistan (NW Pakistan). Contrib. Mineral. Petrol. 2009, 158, 739–755. [Google Scholar] [CrossRef]
- Tseng, D.-J.; Tsai, B.-R.; Chang, L.-C. A case study on ground treatment for a rock tunnel with high groundwater ingression in Taiwan. Tunn. Undergr. Space Technol. 2001, 16, 175–183. [Google Scholar] [CrossRef]
- Maleska, T.; Beben, D. Behaviour of Soil–Steel Composite Bridges under Strong Seismic Excitation with Various Boundary Conditions. Materials 2023, 16, 650. [Google Scholar] [CrossRef]
- Gao, L.; Luo, J.; Chen, T.; Wang, D.; Wang, G. Testing and Analysis of the Vibration Response Characteristics of Heavy-Haul Railway Tunnels and Surrounding Soil with Base Voids. Appl. Sci. 2023, 13, 4090. [Google Scholar] [CrossRef]
- Liu, R.; Yang, J.; Du, Y.; Li, M. Influence of Blasting Disturbance on the Dynamic Stress Distribution and Fracture Area of Rock Tunnels. Appl. Sci. 2023, 13, 5503. [Google Scholar] [CrossRef]
- Tian, T.; Yao, A.; Li, Y.; Gong, Y. Seismic Response of Utility Tunnels with Different Burial Depths at the Non-Homogeneous Liquefiable Site. Appl. Sci. 2022, 12, 11767. [Google Scholar] [CrossRef]
- Kong, H.-Q.; Zhao, L.-S.; Zhang, N. Water Inrush Hazard in Shijingshan Tunnel during Construction, Zhuhai, Guangdong, China. Safety 2022, 8, 7. [Google Scholar] [CrossRef]
- Chiu, Y.-C.; Chia, Y. The impact of groundwater discharge to the Hsueh-Shan tunnel on the water resources in northern Taiwan. Hydrogeol. J. 2012, 20, 1599. [Google Scholar] [CrossRef]
- Hughes, A. Hydro 2016–Montreux: A report. Dams Reserv. 2017, 27, 124–130. [Google Scholar] [CrossRef]
- Shi, P.; Zhang, D.; Pan, J.; Liu, W. Geological investigation and tunnel excavation aspects of the weakness zones of Xiang’an subsea tunnels in China. Rock Mech. Rock Eng. 2016, 49, 4853–4867. [Google Scholar] [CrossRef]
- Jung, H.-S.; Han, Y.-S.; Chung, S.-R.; Chun, B.-S.; Lee, Y.-J. Evaluation of advanced drainage treatment for old tunnel drainage system in Korea. Tunn. Undergr. Space Technol. 2013, 38, 476–486. [Google Scholar] [CrossRef]
- Kolymbas, D.; Wagner, P. Groundwater ingress to tunnels—The exact analytical solution. Tunn. Undergr. Space Technol. 2007, 22, 23–27. [Google Scholar] [CrossRef]
- Holter, K.G. Loads on sprayed waterproof tunnel linings in jointed hard rock: A study based on Norwegian cases. Rock Mech. Rock Eng. 2014, 47, 1003–1020. [Google Scholar] [CrossRef]
- Fu, Q.; Bu, M.; Li, D.; Xu, W.; He, J.; Niu, D. Resistance to sulfate attack and chemo-damage-transport model of sulfate ions for tunnel lining concrete under the action of loading and flowing groundwater. ACS Sustain. Chem. Eng. 2021, 9, 14307–14326. [Google Scholar] [CrossRef]
- Hartshorn, S.; Sharp, J.; Swamy, R. Thaumasite formation in Portland-limestone cement pastes. Cem. Concr. Res. 1999, 29, 1331–1340. [Google Scholar] [CrossRef]
- Hunkeler, F. Corrosion in reinforced concrete: Processes and mechanisms. Corros. Reinf. Concr. Struct. 2005, 1–45. [Google Scholar] [CrossRef]
- Revuelta, M.B. Concrete. Constr. Mater. Geol. Prod. Appl. 2021, 217–274. [Google Scholar]
- Zhou, Y.; Gencturk, B.; Willam, K.; Attar, A. Carbonation-induced and chloride-induced corrosion in reinforced concrete structures. J. Mater. Civ. Eng. 2015, 27, 04014245. [Google Scholar] [CrossRef]
- Roberge, P.R. Corrosion Engineering; McGraw-Hill Education: New York, NY, USA, 2008. [Google Scholar]
- Manquehual, C.J.; Jakobsen, P.D.; Bruland, A. Corrosion level of rock bolts exposed to aggressive environments in Nordic road tunnels. Rock Mech. Rock Eng. 2021, 54, 5903–5920. [Google Scholar] [CrossRef]
- Fathi Salmi, E.; Soltani Asadi, Z.; Bayati, M.; Sharifzadeh, M. Assessing the hydrogeological conditions leading to the corrosion and deterioration of pre-cast segmental concrete linings (case of zagros tunnel). Geotech. Geol. Eng. 2019, 37, 3961–3983. [Google Scholar] [CrossRef]
- Wu, X.; Li, C.; Sun, B.; Geng, F.; Gao, S.; Lv, M.; Ma, X.; Li, H.; Xing, L. Groundwater hydrogeochemical formation and evolution in a karst aquifer system affected by anthropogenic impacts. Environ. Geochem. Health 2020, 42, 2609–2626. [Google Scholar] [CrossRef]
- Li, H.F.; Jin, P.K.; Jin, L.P.; He, D.; Wang, X.B. A study on analyzing the pollutants of construction wastewater in northern section of Qinling tunnel of the YinHanJiWei project and Its Treatment Processes. Adv. Mater. Res. 2013, 610, 2138–2143. [Google Scholar]
- Wu, J.; Cao, M.; Tong, D.; Finkelstein, Z.; Hoek, E.M. A critical review of point-of-use drinking water treatment in the United States. Npj Clean Water 2021, 4, 40. [Google Scholar] [CrossRef]
- Carrillo-Reyes, J.; Barragán-Trinidad, M.; Buitrón, G. Surveillance of SARS-CoV-2 in sewage and wastewater treatment plants in Mexico. J. Water Process Eng. 2021, 40, 101815. [Google Scholar] [CrossRef]
- Lv, Y.; Jiang, Y.; Hu, W.; Cao, M.; Mao, Y. A review of the effects of tunnel excavation on the hydrology, ecology, and environment in karst areas: Current status, challenges, and perspectives. J. Hydrol. 2020, 586, 124891. [Google Scholar]
- Sun, B.; Luo, Y.; Yang, D.; Yang, J.; Zhao, Y.; Zhang, J. Coordinative Management of Soil Resources and Agricultural Farmland Environment for Food Security and Sustainable Development in China. Int. J. Environ. Res. Public Health 2023, 20, 3233. [Google Scholar] [CrossRef] [PubMed]
- Karmegam, U.; Chidambaram, S.; Prasanna, M.V.; Sasidhar, P.; Manikandan, S.; Johnsonbabu, G.; Dheivanayaki, V.; Paramaguru, P.; Manivannan, R.; Srinivasamoorthy, K. A study on the mixing proportion in groundwater samples by using Piper diagram and Phreeqc model. Chin. J. Geochem. 2011, 30, 490–495. [Google Scholar] [CrossRef]
- Fetter, A.L.; Svidzinsky, A.A. Vortices in a trapped dilute Bose-Einstein condensate. J. Phys. Condens. Matter 2001, 13, R135. [Google Scholar] [CrossRef] [Green Version]
- Piper, A.M. A graphic procedure in the geochemical interpretation of water-analyses. Eos Trans. Am. Geophys. Union 1944, 25, 914–928. [Google Scholar] [CrossRef]
- Goyal, A.; Ganjian, E.; Pouya, H.S.; Tyrer, M. Inhibitor efficiency of migratory corrosion inhibitors to reduce corrosion in reinforced concrete exposed to high chloride environment. Constr. Build. Mater. 2021, 303, 124461. [Google Scholar] [CrossRef]
- Shah, B.; Kansara, B.; Shankar, J.; Soni, M.; Bhimjiyani, P.; Bhanushali, T.; Shah, M.; Sircar, A. Reckoning of water quality for irrigation and drinking purposes in the konkan geothermal provinces, Maharashtra, India. Groundw. Sustain. Dev. 2019, 9, 100247. [Google Scholar] [CrossRef]
- Ravikumar, P.; Somashekar, R.; Prakash, K. Suitability assessment of deep groundwater for drinking and irrigation use in the parts of Hoskote and Malur Taluks, Karnataka (India). Environ. Res. Eng. Manag. 2015, 71, 15–26. [Google Scholar] [CrossRef] [Green Version]
- Khan, J.; Ahmed, W.; Yasir, M.; Islam, I.; Janjuhah, H.T.; Kontakiotis, G. Pollutants Concentration during the Construction and Operation Stages of a Long Tunnel: A Case Study of Lowari Tunnel,(Dir–Chitral), Khyber Pakhtunkhwa, Pakistan. Appl. Sci. 2022, 12, 6170. [Google Scholar] [CrossRef]
- Mabee, S.B.; Curry, P.J.; Hardcastle, K.C. Correlation of lineaments to ground water inflows in a bedrock tunnel. Groundwater 2002, 40, 37–43. [Google Scholar] [CrossRef] [PubMed]
- Liang, H.-Q.; Zhao, S.; Hu, X.-M.; Ceccato, M.; Skrydstrup, T.; Daasbjerg, K. Hydrophobic copper interfaces boost electroreduction of carbon dioxide to ethylene in water. ACS Catal. 2021, 11, 958–966. [Google Scholar] [CrossRef]
- Omer, N. Water Quality Parameters, Water Quality—Science, Assessments and Policy, Kevin Summers; IntechOpen: Rijeka, Croatia, 2019. [Google Scholar]
- Patil, P.; Sawant, D.; Deshmukh, R. Physico-chemical parameters for testing of water—A review. Int. J. Environ. Sci. 2012, 3, 1194–1207. [Google Scholar]
- Duruibe, J.O.; Ogwuegbu, M.; Egwurugwu, J. Heavy metal pollution and human biotoxic effects. Int. J. Phys. Sci. 2007, 2, 112–118. [Google Scholar]
- Zhou, J.; Wu, Q.; Gao, S.; Zhang, X.; Wang, Z.; Wu, P.; Zeng, J. Coupled controls of the infiltration of rivers, urban activities and carbonate on trace elements in a karst groundwater system from Guiyang, Southwest China. Ecotoxicol. Environ. Saf. 2023, 249, 114424. [Google Scholar] [CrossRef]
- Hosseininia, M.; Hassanzadeh, R. Groundwater quality assessment for domestic and agricultural purposes using GIS, hydrochemical facies and water quality indices: Case study of Rafsanjan plain, Kerman province, Iran. Appl. Water Sci. 2023, 13, 84. [Google Scholar]
- Bishwakarma, K.; Wang, G.-x.; Zhang, F.; Adhikari, S.; Karki, K.; Ghimire, A. Hydrochemical characterization and irrigation suitability of the Ganges Brahmaputra River System: Review and assessment. J. Mt. Sci. 2022, 19, 388–402. [Google Scholar] [CrossRef]
- Zhi, C.; Cao, W.; Zhang, Z.; Li, Z.; Ren, Y. Hydrogeochemical characteristics and processes of shallow groundwater in the yellow river delta, China. Water 2021, 13, 534. [Google Scholar] [CrossRef]
- Wilcox, L. Classification and Use of Irrigation Waters; US Department of Agriculture: Washington, DC, USA, 1955. [Google Scholar]
- Liu, L.; Dong, Y.; Kong, M.; Zhou, J.; Zhao, H.; Tang, Z.; Zhang, M.; Wang, Z. Insights into the long-term pollution trends and sources contributions in Lake Taihu, China using multi-statistic analyses models. Chemosphere 2020, 242, 125272. [Google Scholar] [CrossRef]
- Chaney, P.L.; Roland, J.; Moore, M.; Burton, C.G. Water use monitoring for irrigation in the United States: A case study in alabama and lessons learned for achieving sustainability. Prof. Geogr. 2020, 72, 433–447. [Google Scholar]
- Ullah, A.S.; Rashid, H.; Khan, S.N.; Akbar, M.U.; Arshad, A.; Rahman, M.M.; Mustafa, S. A Localized Assessment of Groundwater Quality Status Using GIS-Based Water Quality Index in Industrial Zone of Faisalabad, Pakistan. Water 2022, 14, 3342. [Google Scholar] [CrossRef]
- Liu, N.; Pei, J.; Cao, C.; Liu, X.; Huang, Y.; Mei, G. Geological investigation and treatment measures against water inrush hazard in karst tunnels: A case study in Guiyang, southwest China. Tunn. Undergr. Space Technol. 2022, 124, 104491. [Google Scholar]
- Abideen, Z.U. Comparison of crop water requirements of maize varieties under irrigated condition in semi-arid environment. J. Environ. Earth Sci. 2014, 4, 1–3. [Google Scholar]
- Naheed, G.; Mahmood, A. Water requirement of wheat crop in Pakistan. Pak. J. Meteorol. 2009, 6, 89–97. [Google Scholar]
- Xu, G.; Gutierrez, M. Study on the damage evolution in secondary tunnel lining under the combined actions of corrosion degradation of preliminary support and creep deformation of surrounding rock. Transp. Geotech. 2021, 27, 100501. [Google Scholar] [CrossRef]
- Showkati, A.; Salari-rad, H.; Aghchai, M.H. Predicting long-term stability of tunnels considering rock mass weathering and deterioration of primary support. Tunn. Undergr. Space Technol. 2021, 107, 103670. [Google Scholar] [CrossRef]
- Hongyun, F.; Liping, L.; Guangqi, C.; Hongliang, L.; Jingyao, G.; Changze, L.; Xinyan, P.; Shen, Z. Analysis method of the water inrush and collapse in jointed rock mass tunnels: A case study. Eng. Anal. Bound. Elem. 2023, 146, 838–850. [Google Scholar]
- Chen, Z.; Ma, C.; Li, T.; He, C. Experimental investigation of the failure mechanism of deep granite under high seepage water pressure and strong unloading effect. Acta Geotech. 2022, 17, 5009–5030. [Google Scholar] [CrossRef]
- Zhang, Y.; Ma, Y.; Hu, Z.; Lei, H.; Bai, L.; Lei, Z.; Zhang, Q. An experimental investigation into the characteristics of hydraulic fracturing and fracture permeability after hydraulic fracturing in granite. Renew Energy 2019, 140, 615–624. [Google Scholar] [CrossRef]
- Wang, X.; Li, S.; Xu, Z.; Hu, J.; Pan, D.; Xue, Y. Risk assessment of water inrush in karst tunnels excavation based on normal cloud model. Bull. Eng. Geol. Environ. 2019, 78, 3783–3798. [Google Scholar] [CrossRef]
- Skilodimou, H.D.; Bathrellos, G.D. Natural and Technological Hazards in Urban Areas: Assessment, Planning and Solutions. Sustainability 2021, 13, 8301. [Google Scholar] [CrossRef]
- Bathrellos, G.D.; Skilodimou, H.D. Land Use Planning for Natural Hazards. Land 2019, 8, 128. [Google Scholar] [CrossRef] [Green Version]


| Chainage | Excavation Period | Ground Water Conditions | Rock Type and Condition | Chainage | Excavation Period | Ground Water Conditions | Rock Type and Condition |
|---|---|---|---|---|---|---|---|
| 0 + 000~0 + 455 | Excavated | Dry | Granite, Gabrro, Granodiorite. Compacted and jointed. Local fault observed at 0 + 455 and 0 + 445 to 0 + 600 | 1 + 668~1 + 721 | February 2007 | Dry and damp | Granite, Gabrro, Granodiorite with intercalation of Amphibolite at 1 + 721–1 + 750 Compacted and jointed. Local fault observed at 1 + 839, 1 + 978 |
| 0 + 455~0 + 600 | June 2006 | Flowing | 1 + 721~1 + 750 | March 2007 | Flowing | ||
| 0 + 600~0 + 658 | July 2006 | Dry and damp | 1 + 750~1 + 805 | March 2007 | Damp | ||
| 0 + 658~0 + 669 | July 2006 | Flowing | 1 + 805~1 + 880 | April 2007 | Dripping and flowing | ||
| 0 + 669~0 + 780 | July 2006 | Dry | 1 + 880~1 + 887 | May 2007 | Damp | ||
| 0 + 780~0 + 786 | August 2006 | Dripping | 1 + 887~1 + 923 | May 2007 | Flowing | ||
| 0 + 786~0 + 839 | August 2006 | Dry and damp | 1 + 923~1 + 960 | May 2007 | Damp | ||
| 0 + 839~0 + 843 | August 2006 | Dripping | 1 + 960~1 + 978 | May 2007 | Flowing | ||
| 0 + 843~0 + 869 | August 2006 | Damp | 1 + 978~2 + 030 | June 2007 | Damp | ||
| 0 + 869~0 + 873 | August 2006 | Flowing | 2 + 030~2 + 055 | June 2007 | Flowing | ||
| 0 + 873~0 + 884 | August 2006 | Dry and damp | 2 + 055~2 + 355 | July 2007 | Dry and damp | ||
| 0 + 884~0 + 889 | August 2006 | Flowing | 2 + 355~2 + 390 | July 2007 | Dripping and flowing | ||
| 0 + 889~0 + 910 | August 2006 | Damp | 2 + 390~2 + 400 | August 2007 | Dry | ||
| 0 + 910~0 + 925 | September 2006 | Flowing | 2 + 400~2 + 418 | August 2007 | Dripping | ||
| 0 + 925~0 + 975 | September 2006 | Dry and damp | 2 + 418~2 + 438 | August 2007 | Damp | ||
| 0 + 975~1 + 021 | September 2006 | Dripping and flowing | 2 + 438~2 + 468 | September 2007 | Dripping | ||
| 1 + 021~1 + 055 | October 2006 | Dry | 2 + 468~2 + 700 | August–December 2007 | Dry | Granite, Gabrro, Granodiorite with intercalation of Amphibolite and Rhyolite at 3 + 834 to 3 + 700. Local fault observed at 2 + 498 | |
| 1 + 055~1 + 071 | October 2006 | Flowing | 2 + 700~2 + 834 | January 2008 | Dripping | ||
| 1 + 071~1 + 175 | November 2006 | Dry | 2 + 834~3 + 700 | June 2008 | Dry and damp | ||
| 1 + 175~1 + 217 | November 2006 | Flowing | 3 + 700~3 + 900 | June 2008 | Dripping and flowing | ||
| 1 + 217~1 + 237 | November 2006 | Damp | 3 + 900~4 + 000 | July 2008 | Damp | ||
| 1 + 237~1 + 246 | November 2006 | Flowing | 4 + 000~4 + 200 | August 2008 | Dripping | ||
| 1 + 246~1 + 258 | December 2006 | Damp | 4 + 200~4 + 300 | October 2008 | Damp | ||
| 1 + 258~1 + 329 | December 2006 | Flowing | 4 + 300~4 + 325 | October 2008 | Flowing | ||
| 1 + 329~1 + 445 | January 2007 | Damp | 4 + 325~4 + 340 | October 2008 | Damp | ||
| 1 + 445~1 + 459 | January 2007 | Flowing | 4 + 340~4 + 400 | November 2008 | Flowing | ||
| 1 + 459~1 + 619 | February 2007 | Dry and damp | 4 + 400~4 + 634 | 8 November–9 January | Dry and damp | ||
| 1 + 619~1 + 636 | February 2007 | Flowing | 4 + 634~5 + 256 | 8 September–9 January | Dripping | Gneiness and Amphibolite | |
| 1 + 636~1 + 662 | February 2007 | Dry and damp | 5 + 256~7 + 700 | 7 August–8 September | Dry and damp | ||
| 1 + 662~1 + 668 | February 2007 | Flowing | 7 + 700~7 + 828 | 7 July–7 August | Dripping and flowing | ||
| 7 + 828~8 + 400 | 7 Jan–7 July | Dry and damp | |||||
| 8 + 400~8 + 509 | 6 September–7 January | Dripping | |||||
| # | Parameter | Unit | Concentration | Max. Permisible Limits for Drinking Water (WHO 2017) |
|---|---|---|---|---|
| 1 | pH | -- | 5.21 | 6.5–8.5 |
| 2 | EC | μS/cm | 100 | 1400 |
| 3 | TDS | mg/L | 120 | 1000 |
| 4 | Turbidity | NTU | 3 | 5 |
| 5 | Ca | mg/L | 63 | 200 |
| 6 | Mg | mg/L | 14 | 50 |
| 7 | Na | mg/L | 3 | 200 |
| 8 | K | mg/L | 1.7 | 12 |
| 9 | TH | mg/L | 78 | 500 |
| 10 | TA | mg/L | 30 | 500 |
| 11 | NO3−2 | mg/L | Nil | 10 |
| 12 | SO4−1 | mg/L | 4 | 250 |
| 13 | Cl− | mg/L | 23 | 250 |
| # | Parameter | Unit | Summer | Winter | Max. Permisible Limits for Drinking Water (WHO 2017) | ||
|---|---|---|---|---|---|---|---|
| South Portal | North Portal | South Portal | North Portal | ||||
| 1 | pH | -- | 5.22 | 7.51 | 5.83 | 5.83 | 6.5–8.5 |
| 2 | EC | μS/cm | 56 | 359 | 120 | 100 | 1400 |
| 3 | TDS | mg/L | 34 | 241 | 60 | 50 | 1000 |
| 4 | Turbidity | NTU | 2 | 3 | 2.13 | 3.07 | 5 |
| 5 | Ca | mg/L | 17 | 87.39 | 12.9 | 70.6 | 200 |
| 6 | Mg | mg/L | 14 | 33.01 | 2.3 | 3.7 | 50 |
| 7 | Na | mg/L | 3.40 | 37.4 | 34.8 | 49.3 | 200 |
| 8 | K | mg/L | 1.30 | 2.3 | 3.237 | 3.641 | 12 |
| 9 | TH | mg/L | 31 | 120.4 | 1.86 | 0.93 | 500 |
| 10 | TA | mg/L | 31.25 | 136 | 300 | 250 | 500 |
| 11 | NO3−2 | mg/L | Nil | Nil | Nil | Nil | 10 |
| 12 | SO4−1 | mg/L | 3.8 | 10.9 | 3.33 | 1.33 | 250 |
| 13 | Cl− | mg/L | 12 | 30 | 47.925 | 21.3 | 250 |
Disclaimer/Publisher’s Note: The statements, opinions and data contained in all publications are solely those of the individual author(s) and contributor(s) and not of MDPI and/or the editor(s). MDPI and/or the editor(s) disclaim responsibility for any injury to people or property resulting from any ideas, methods, instructions or products referred to in the content. |
© 2023 by the authors. Licensee MDPI, Basel, Switzerland. This article is an open access article distributed under the terms and conditions of the Creative Commons Attribution (CC BY) license (https://creativecommons.org/licenses/by/4.0/).
Share and Cite
Khan, J.; Ahmed, W.; Waseem, M.; Ali, W.; Rehman, I.u.; Islam, I.; Janjuhah, H.T.; Kontakiotis, G.; Bathrellos, G.D.; Skilodimou, H.D. Lowari Tunnel Water Quality Evaluation: Implications for Tunnel Support, Potable Water Supply, and Irrigation in Northwestern Himalayas, Pakistan. Appl. Sci. 2023, 13, 8895. https://doi.org/10.3390/app13158895
Khan J, Ahmed W, Waseem M, Ali W, Rehman Iu, Islam I, Janjuhah HT, Kontakiotis G, Bathrellos GD, Skilodimou HD. Lowari Tunnel Water Quality Evaluation: Implications for Tunnel Support, Potable Water Supply, and Irrigation in Northwestern Himalayas, Pakistan. Applied Sciences. 2023; 13(15):8895. https://doi.org/10.3390/app13158895
Chicago/Turabian StyleKhan, Jehanzeb, Waqas Ahmed, Muhammad Waseem, Wajid Ali, Inayat ur Rehman, Ihtisham Islam, Hammad Tariq Janjuhah, George Kontakiotis, George D. Bathrellos, and Hariklia D. Skilodimou. 2023. "Lowari Tunnel Water Quality Evaluation: Implications for Tunnel Support, Potable Water Supply, and Irrigation in Northwestern Himalayas, Pakistan" Applied Sciences 13, no. 15: 8895. https://doi.org/10.3390/app13158895