Article

Optimal Performance of Mg-SiC Nanocomposite: Unraveling the Influence of Reinforcement Particle Size on Compaction and Densification in Materials Processed via Mechanical Milling and Cold Iso-Static Pressing

Faculty III Process Sciences, Institute of Materials Science and Technology, Technische Universität Berlin, Fachgebiet Werkstofftechnik, Strasse des 17. Juni 135, 10623 Berlin, Germany
*
Author to whom correspondence should be addressed.
Appl. Sci. 2023, 13(15), 8909; https://doi.org/10.3390/app13158909
Submission received: 13 May 2023 / Revised: 29 June 2023 / Accepted: 28 July 2023 / Published: 2 August 2023
(This article belongs to the Section Materials Science and Engineering)

Abstract

:
Achieving uniformly distributed reinforcement particles in a dense matrix is crucial for enhancing the mechanical properties of nanocomposites. This study focuses on fabricating Mg-SiC nanocomposites with a high-volume fraction of SiC particles (10 vol.%) using cold isostatic pressing (CIP). The objective is to obtain a fully dense material with a uniform dispersion of nanoparticles. The SiC particle size impact on the compressibility and density distribution of milled Mg-SiC nanocomposites is studied through the elastoplastic Modified Drucker-Prager Cap (MDPC) model and finite element method (FEM) simulations. The findings demonstrate significant variations in the size and dispersion of SiC particles within the Mg matrix. Specifically, the Mg-SiC nanocomposite with 10% submicron-scale SiC content (M10Sµ) exhibits superior compressibility, higher relative density, increased element volume (EVOL), and more consistent density distribution compared to the composite containing 10% nanoscale SiC (M10Sn) following CIP simulation. Under 700 MPa, M10Sµ shows improvements in both computational and experimental results for volume reduction percentage, 2.31% and 2.81%, respectively, and relative density, 4.14% and 3.73%, respectively, compared to M10Sn. The relative density and volume reduction outcomes are in qualitative alignment with experimental findings, emphasizing the significance of particle size in optimizing nanocomposite characteristics.

1. Introduction

Magnesium-based metal matrix composites (MMCs), owing to their advantageous characteristics such as superior strength-to-weight ratio, enhanced thermal conductivity, and commendable wear resistance, have elicited significant interest, positioning them as a material of choice for advanced applications across diverse industries, including automotive, aerospace, and electronics [1,2]. However, magnesium-based MMCs exhibit limited strength and ductility. Incorporating reinforcement particles like SiC can significantly improve these properties [3,4].
The particle size is a critical determinant in shaping the microstructure and thereby influencing the properties of particle-reinforced magnesium matrix composites (PRMMCs) [5]. Recent research suggest micron-sized ceramic particles may reduce ductility, and nano-sized reinforcements can enhance strength and ductility in Mg-composites [6,7].
Despite promising results, achieving uniform density distribution in green compacted parts during consolidation remains challenging, as inhomogeneous density distribution can cause nonuniform shrinkage or distortion during subsequent processes [8]. Particle size, shape, and distribution influence the desired density distribution [9]. Mechanical milling has shown great promise as a method to attain homogeneous dispersion of nano-reinforcement particles within the matrix [4,10]. However, mechanical milling can result in microstructural refinement and strain hardening, hindering further plastic deformation during compaction. Conventional compaction methods, such as uniaxial pressing, may need to be revised for consolidating milled powder, leading to high porosity [4]. Cold isostatic pressing (CIP) is a cost-effective method for producing green ceramic components with uniform density and high quality [10]. Optimizing process parameters such as pressure, time, and change in pressure rate is essential for achieving the desired density distribution at an affordable price [11]. However, predicting density distribution can be challenging. While various experimental methods such as Nuclear Magnetic Resonance (NMR) radioscopy [12], micro-indentation [13], X-ray tomography [14] have been used, they are not practical for predicting the densification behavior of powders before completing the experiment.
Finite element method (FEM) simulations have become reliable for predicting and analyzing powder densification behavior, reducing costs and time waste [15,16,17,18,19]. Simulating powder compaction processes numerically necessitates the use of suitable continuum models capable of accurately depicting densification behaviors, which can be studied and modeled by examining powder interactions after characterizing the powder based on its size, hardness, and shap. The Modified Drucker Prager Cap (MDPC) model is frequently employed to study the densification behavior of powders, treating them as a homogeneous continuum [20,21,22,23]. The MDPC model represents powders as a uniform continuum, considering input parameters encompassing elastic behavior, shear failure surface definition, cap shape determination, and the governing hardening law that prescribes alterations in material strength with plastic deformation [24]. Reiterer et al. employed the MDPC model to characterize the densification behavior of SiC components. In the prior research [25], the MDPC model was utilized to estimate the impact of SiC nanoparticle density distribution on the compressibility of milled powder following CIP. The findings demonstrated a strong correlation between simulation and experimental outcomes for Mg-SiC nanocomposites using the MDPC model.
This study investigates how the size of reinforcement particles impacts the densification behavior of milled Mg-SiC powders during CIP. The MDPC model was utilized to simulate the CIP process using FEM. Various tests were conducted, including uniaxial and Brazilian compressive tests, die compaction test, and CIP experiments, to derive the parameters for the modified Drucker-Prager Cap (DPC) model. The study assessed the impact of nano and submicron-sized SiC reinforcements on the compaction behavior and density distribution of Mg-SiC nanocomposites within the Cold Isostatic Pressing. Moreover, simulation results of the CIP process for Mg-SiC composites were analyzed and discussed, including pressure distribution, relative density distribution, and element volumes.

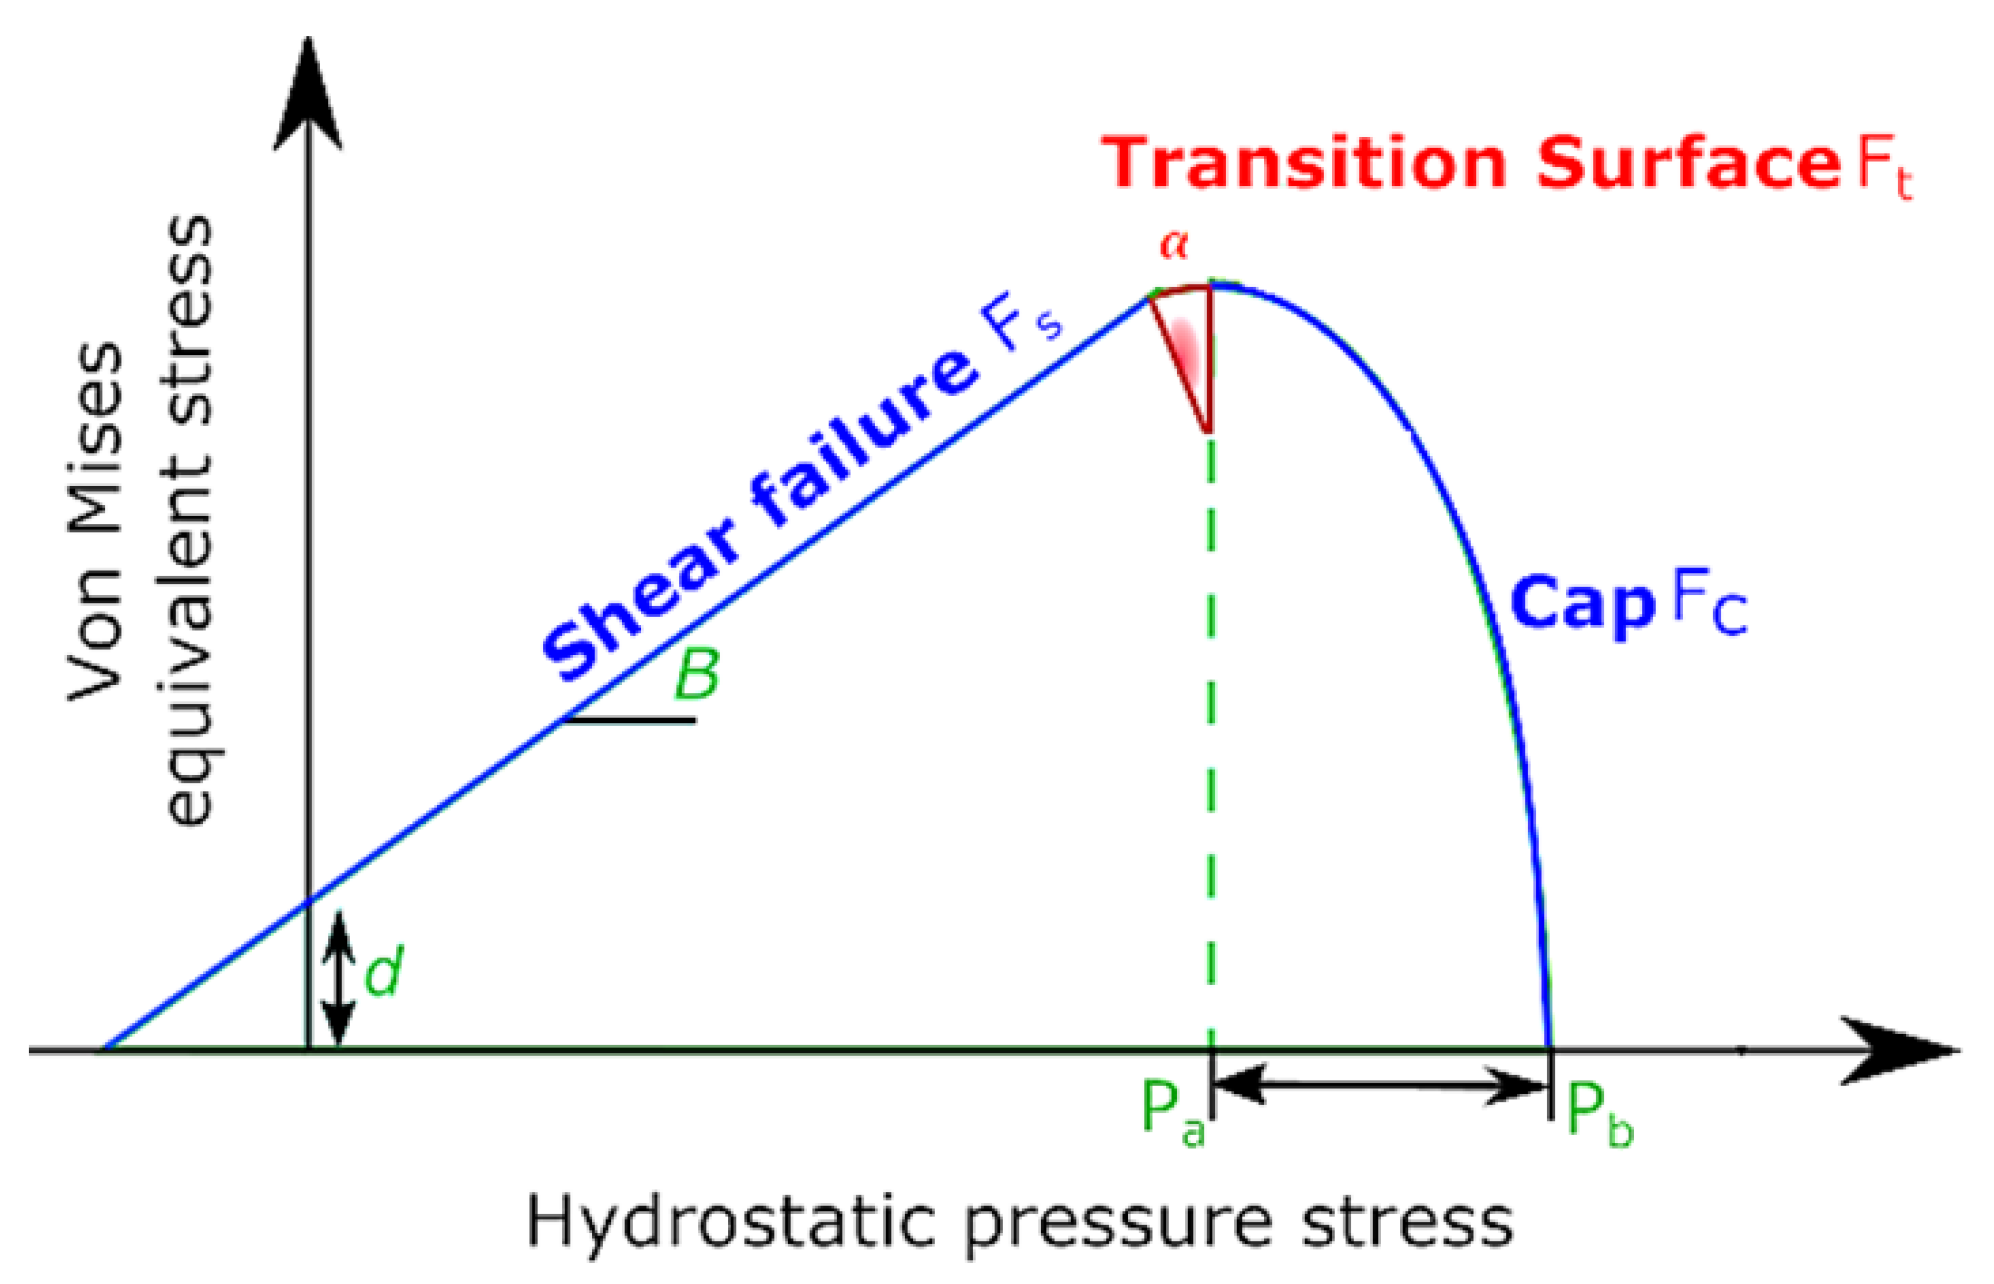
2. Modified Drucker-Prager Cap Constitutive Model and Related Parameters

The MDPC model assumes that the material is a compressible continuum. This model is an elastoplastic, volumetric hardening plasticity model. Numerical studies in this paper are based on the MDPC model implemented in the commercial software ABAQUS 6.14-4 (SIMULIA, Providence, RI, USA). Figure 1 shows the yield surface of the MDPC model.
The model operates under the assumption of isotropy, and its yield surface is comprised of three segments: a shear failure surface, which predominantly drives shear flow; Fs, describe as in [24]:
F s = q p   t a n β d = 0
where β and d are the friction angle and cohesion of material, respectively, q is deviatoric, or Mises stress, and, p represents hydrostatic pressure.
A cap, providing an inelastic hardening mechanism to represent plastic compaction (Fc), is written as [26]:
F c = ( P P a ) 2 + ( R q 1 + α α / c o s β ) 2 R d + P a   t a n β = 0  
where R denotes the material parameter that manipulates the form of the cap. α represents a minor coefficient used to delineate the transition yield surface. P a   acts as an evolutionary parameter that signifies the progression of the volumetric plastic strain-induced hardening and is expressed as:
P a = P b R d ( 1 + R t a n β )  
Pb is the hydrostatic pressure that determines the cap position and is denoted as:
  ε v p L = ln ρ ρ 0
In this equation, ε v p l is the volumetric plastic strain, ρ is the current relative density, while ρ0 denotes the initial relative density. At the end of the cap surface, powders have been consolidated under high pressure, making the powder challenging to compress [24].
The transient surface (Ft), a transition region between the cap yield and shear failure surfaces, is introduced to prepare a smooth surface purely for facilitating the numerical implementation [24] and written as:
F t = ( P P a ) 2 + [ q ( 1 α c o s β ) ( d + P a t a n β ) ] 2 α   ( d + P a t a n β ) = 0
These three surfaces can be used to model the three powder compaction stages.

3. Materials and Experimental Methods

3.1. Materials

In this study, magnesium (Mg) powder was used as the matrix material, and β-SiC powder with purity of 99.8% was employed as the reinforcement. The powders were provided by Alfa Aesar (Ward Hill, MA, USA). Mg-SiC composite mixtures, namely M10Sµ and M10Sn, containing 10 vol% SiC submicron particles and 10 vol% SiC nanoparticles, respectively, were prepared through 25 h of high-energy mechanical milling. In order to govern the milling process and reduce cold welding in the mixture, a milling process control agent (PCA) in the form of 2 wt% stearic acid was applied [21]. The powder mixtures were mixed for 20 min on a rolling bank to ensure homogeneity.
The milling process was conducted using a planetary ball mill (Pulverisette 5, Fritsch, Germany) in a hard PE with zirconia balls vessel for 25 h. The ball-to-powder weight ratio and rotational speed were maintained 10:1 and 250 rpm, respectively, throughout the milling process. All handling, mixing, and milling procedures were carried out in a glove box under an argon atmosphere with high purity.
The average grain sizes of the as-received Mg, SiC, and vol% of SiC in the Mg-SiC powder composite are listed in Table 1.

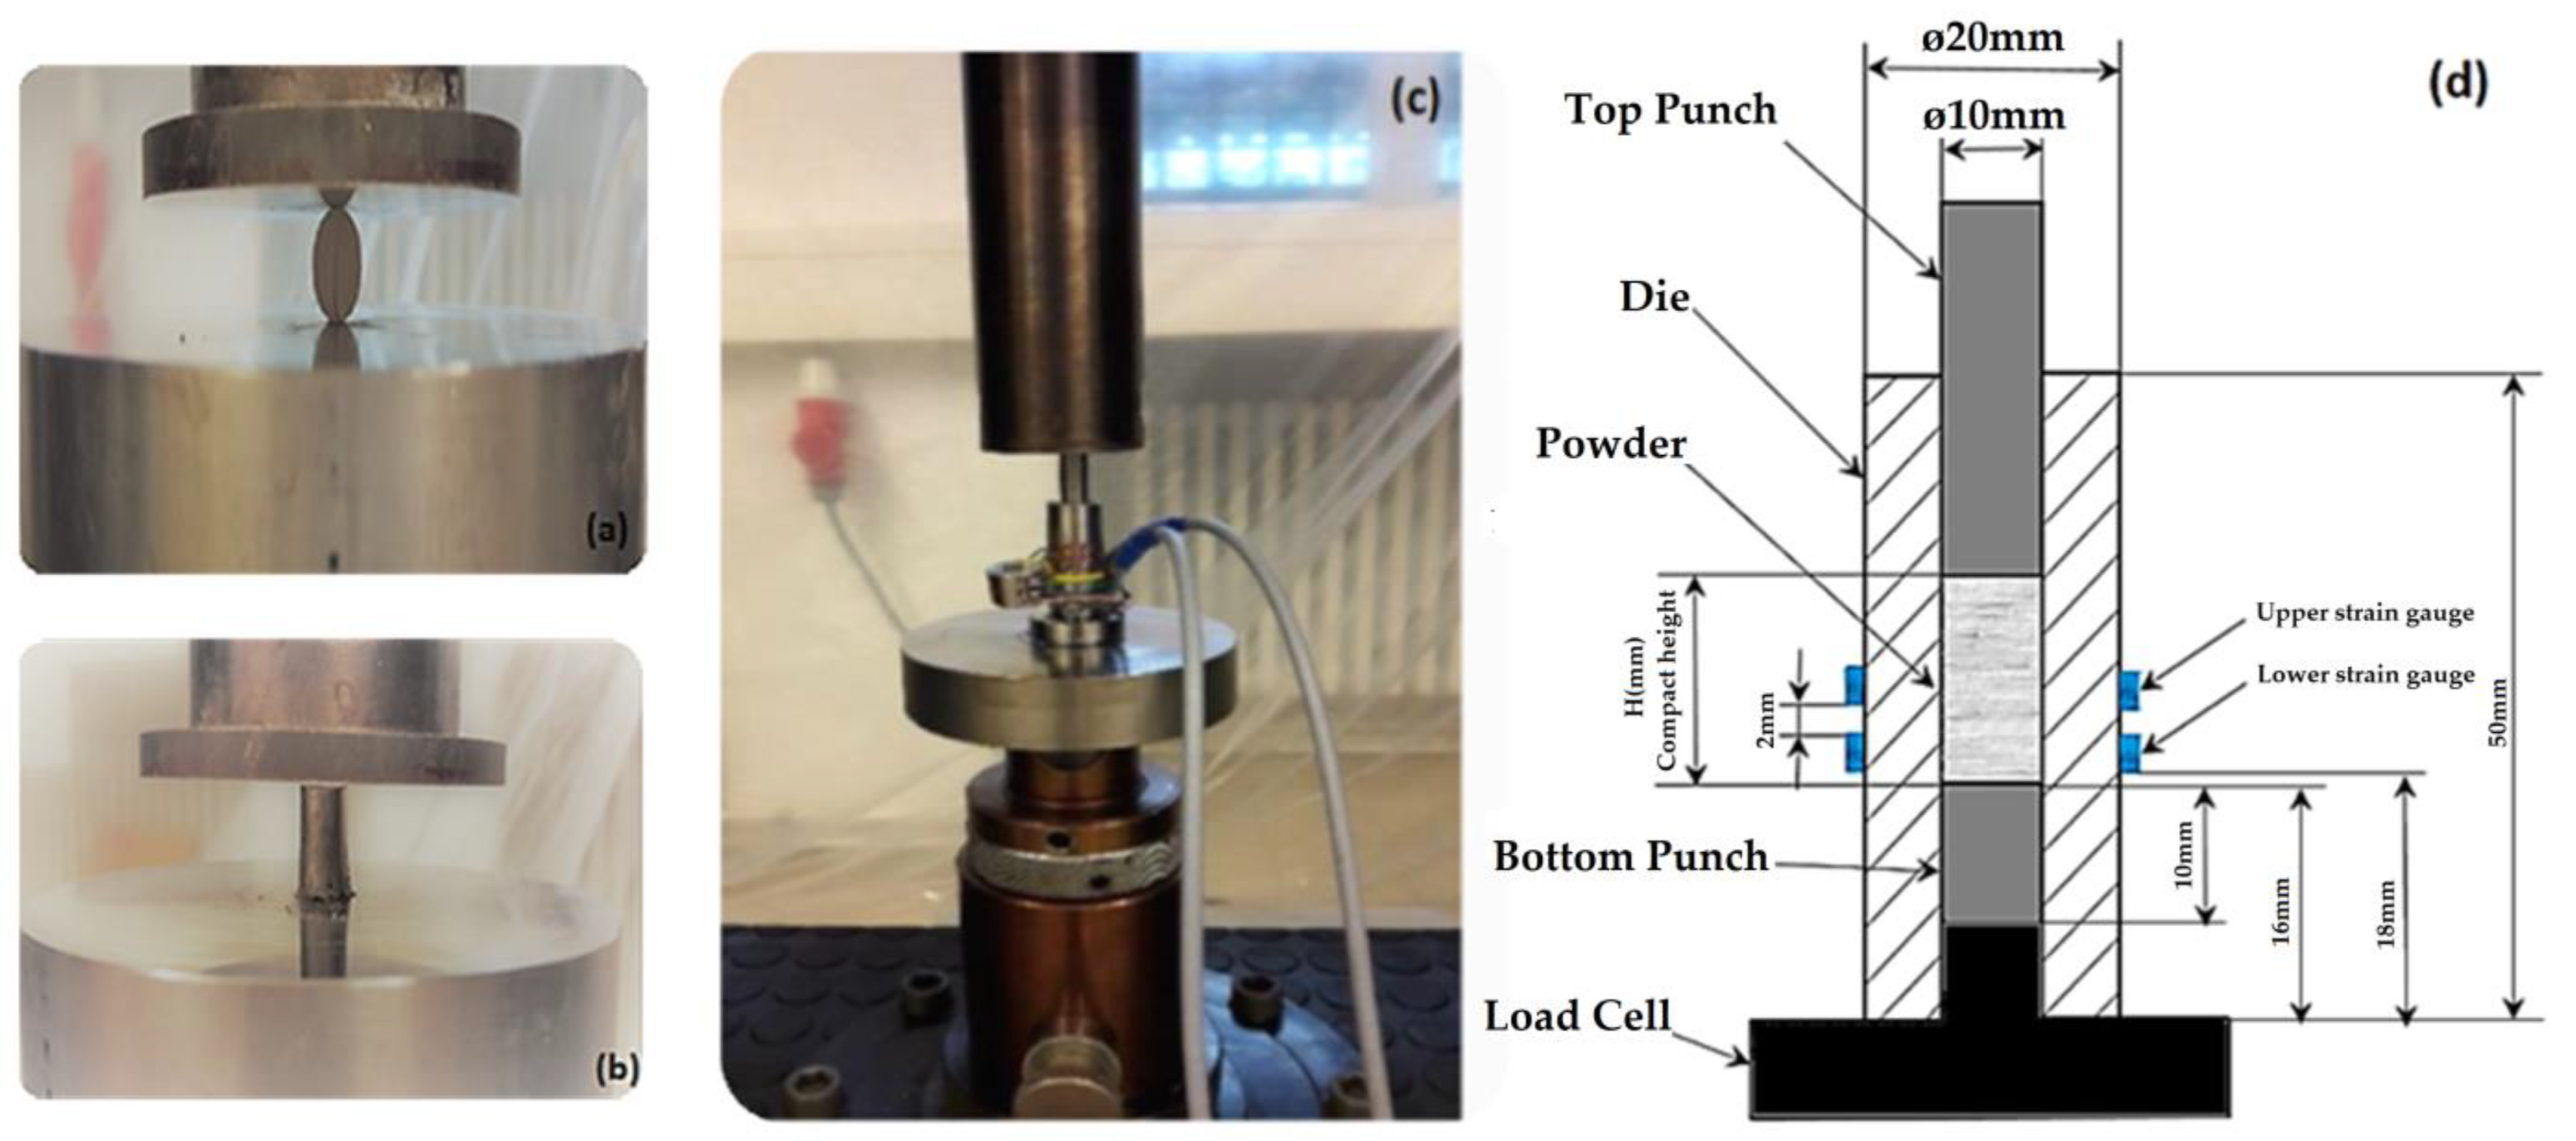
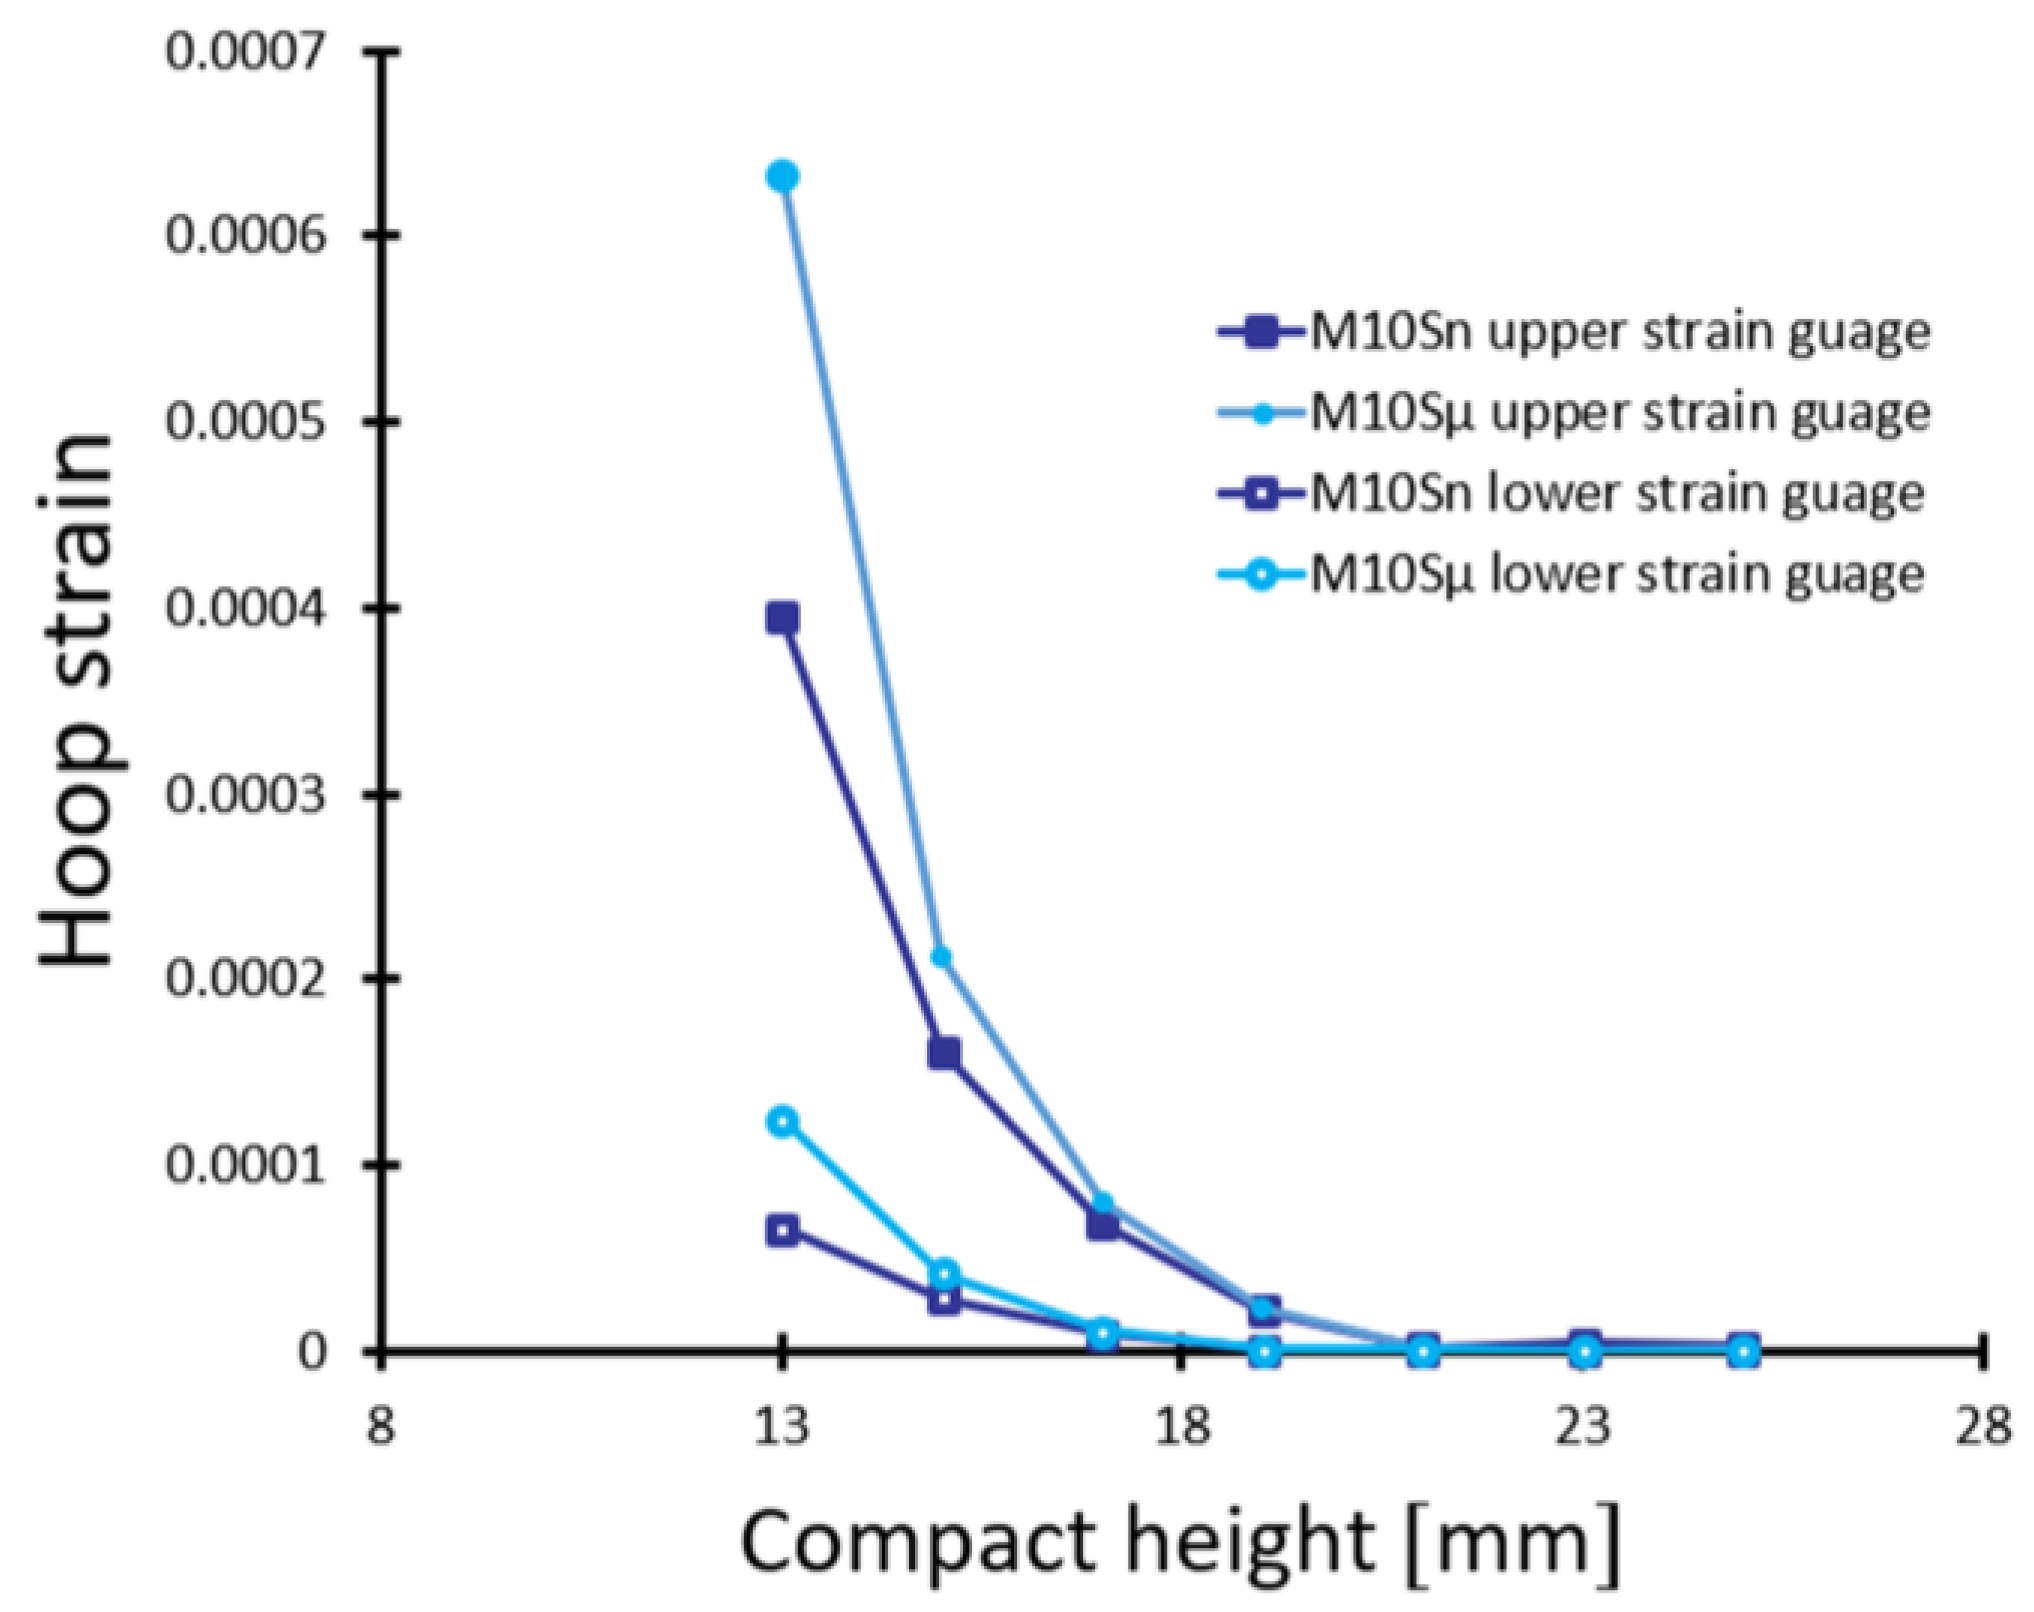
3.2. Experimental Methods

In order to comprehensively characterize the yield surface, the following parameters need to be determined: β, d, P a ,   R, P b and α [22]. To define the Drucker-Prager shear failure surface, the internal friction angle β and the cohesion of material d are required; to specify the cap surface, the cap shape parameter R and evolution P a , P b are needed [24]. The various experiments shown in Table 2 were used to determine the DPC parameters. Lastly, for the DPC parameters determined from the experiments shown in Table 2, we have referenced a summary in our current study and provided detailed descriptions in our previous study [27].
Prior to the main compaction process, the samples were subjected to pre-compaction using a uniaxial press equipment. The die used for pre-compaction had a circular tube shape with an external diameter, an internal diameter, and a height of 20 mm,10 mm, and 50 mm, respectively. The punches, and the die utilized in the pre-compaction were made from 115CrV3 steel, which has a Poisson ratio of 0.3 and Young’s modulus of 210 GPa. Silicon spray was sprayed in the inner surface of die wall to decrease the friction of particles and the die surface [28].
Five samples of each composition were subjected to a series of Brazilian and uniaxial compression tests to determine the shear failure line parameters, the cohesion of material (d), and the friction angle (β). The specimens with height-to-diameter aspect ratios of 1.5:1 and 0.25 were used for the uniaxial and Brazilian compression tests. Axial loading for the tests was applied using the Hegewald & Peschke material testing system (Nossen, Sachsen, Germany).
Figure 2a,b present the failure mode of the Brazilian and uniaxial compression tests, respectively. During the Brazilian compression test, the samples underwent compression diametrically. The resulting radial strength for Brazilian compression test σ T   of the samples can be determined using the following equation:
σ T = 2 P T Π D t
The failure load P T and the dimensions of the cylindrical sample, including diameter D and thickness t, are used to calculate tensile strength for Brazilian compression test σ T . The sample stress state experienced by diametrical loading can be mathematically represented by the following equations:
σ C = P C A            
where P C and A represent the uniaxial breaking force and the sample cross-section area [26]. From this stress state, the cohesion of material d and friction angle β can be defined as follows:
d = σ C     σ T   ( 13 2 ) σ C     2 σ T
β = tan 1 ( 3   σ C   d σ C     )
The cap shape parameters R , P a ,   a n d   P b were obtained using the die compaction test. The similar die used in the uniaxial and Brazilian compaction experiments was utilized for this test. Figure 2c depicts the die compaction set-up, while Figure 2d illustrates the die compaction test schematic, which includes four strain gauges on the outer wall of the die for measuring hoop strains.
The die was carefully filled with the powders to ensure consistent packing. The load and unload procedures were conducted at a consistent speed of 2 mm/min, which was controlled by the movement of the upper punch, while the bottom punch stayed unmoved. Within the die compaction test, the height of the compact underwent continuous changes in response to the applied pressure. To determine the radial stress, the measured hoop strains by the strain gauges pasted on the die wall were analyzed.
Finite element analysis was conducted to calculate the hoop strains on the die outer surface under various uniform interior pressures at different heights. Moreover, a histogram was generated according to the calculated finite element outcomes for radial stress, hoop strain, and compact height on the outer surface of the die [23]. The hoop strains resulting from the die compaction test at different compact heights are depicted in Figure 3.
By utilizing the experimental data of a particular height of compaction and the corresponding hoop strain, the radial stress was determined by resourcing the histogram provided from the simulation results. Finally, the cap eccentricity (R) was determined by utilizing the maximal amount of radial stress, as calculated using Equation (10).
  R = 1 3 6 ( 1 + α α cos β ) 2 ( p p a ) q
where α was assumed to be 0.01 for both samples, and the evolution parameter P a was defined from Equation (3) in Section 2 [22], and the hydrostatic pressure (p) and deviatoric stress (q) were determined utilizing Equation (11).
P = 1 3 ( σ z + σ r )
q = σ z + σ r
where σz and σr represent the maximal magnitudes of the axial and radial stresses during loading, respectively. P b as a function of the volumetric plastic strain is needed to determine the cap hardening/softening rule [26]. A series of CIP experiments under pressures ranging from 100 to 700 MPa and with 10 min holding time in a latex cover was performed for every sample. All samples were hand-pressed prior to the CIP experiment for 5 min under 89 MPa pressure in a glove box under an atmosphere with high purity argon. To mitigate the friction between the particles and the die wall, silicone spray was applied. The volumetric plastic strain is derived from the relative density as:
  ε v p l = l n ( ρ ρ 0 )
where ρ represents the sample’s relative density after cold isostatic press, and ρ 0 is the sample’s relative density after hand press. The Archimedes method in ethanol was applied to determine the relative density of samples. Figure 4c depicts the plotted curves of volumetric plastic strain versus pressure, which were utilized to derive the equation for the hardening law of the samples. Table 3 represents the accomplished tests results and the used DPC model parameters in this work.

3.3. CIP Simulation

The CIP process simulation was conducted using ABAQUS 6.14-4 software (SIMULIA, Providence, RI, USA). The computations were executed on North-German Supercomputing Alliance hardware (HLRN, Zuse Institute, Berlin, Germany). The material was modeled utilizing the modified Drucker-Prager-Cap model. In the simulation, symmetry was considered, and due to geometric symmetry, only one-eighth of a cylindrical sample with a diameter and height of 12 mm and 3 mm was modeled, respectively. Moreover, three symmetry boundary conditions were applied along the X, Y, and Z planes. Furthermore, 5 × 10⁴ linear brick mesh elements, each consisting of 8 nodes, were utilized for Finite Element Method. A pressure of 700 MPa was applied to the free surface of 1/8th of the FEM model.
To compute the relative density after the CIP process from the simulated data, the hardening law equations were modified in the form of both the initial relative density (ρ0) and the pressure at each step (p) and then incorporated into the output field of the ABAQUS software. The following formulas were entered for M10Sµ and M10Sn, respectively: ρ = ρ0 (0.33 P)0.069 and ρ = ρ0 (0.028 P)0.072. The initial relative density of the samples (ρ0) in the formulas was equal to the after hand press relative density, which was 74.62% and 71.8%, respectively, for M10Sµ and M10Sn.
To assess the homogeneity of density distribution and calculate the element volume (EVol), a Python script was employed. This script analyzed the samples after simulating the CIP process using ABAQUS CAE software. Furthermore, the volume reduction was determined by comparing the volume of samples before and after CIP, considering both experimental and computational results.

4. Results

The behavior of Mg-SiC nanocomposites during compaction was examined utilizing the MDPC model in FEM simulation to study the impact of submicron and nano-size SiC reinforcement particles. Figure 5a illustrates the distribution of equivalent pressure stress for Mg-10% SiC composite mixtures containing both submicron and nano reinforcement particles at applied pressures of 100, 300, 500, and 700 Mpa. According to these results, inhomogeneous pressure distribution within the samples was predicted under different applied pressures, despite the uniformly applied isostatic pressure. The larger equivalent pressure, indicating harder compressibility, is visible in the Mg-SiC nanocomposite containing nanoparticles reinforcement.
The relative density distributions in M10Sµ and M10Sn composites are shown in Figure 5b after CIP simulation under applied pressure values of 100, 300, 500, and 700 Mpa.
As shown in Figure 5b, different relative density distributions were predicted within M10Sµ and M10Sn composites after CIP simulation under 100, 300, 500, and 700 MPa pressure values. The relative density was estimated as described in Section 3.3, and under the same pressure, M10Sµ indicated a higher magnitude of relative density compared to M10Sn. Correspondingly, the higher magnitudes of relative density were predicted as 82.36%, 87.6%, 90.84%, and 92.81% for M10Sµ and as 79.50%, 84.75%, 87.46%, and 88.67% for M10Sn.
Figure 4a compares the FEM and experimental approaches for determining relative density under 100, 300, 500, and 700 MPa uniform isostatic pressure for M10Sµ and M10Sn.
The computational and experimental outcomes are in good agreement, and M10Sµ exhibits the maximum magnitude of relative density under different pressures. The element volume (EVOL) in certain pressure ranges was also calculated in Figure 4b to investigate the density distribution after CIP. Consequently, the maximum EVOL values computed for M10Sµ are considerably higher than those for M10Sn, with values of 28.46 and 18.95 estimated within the 690.5 to 717 MPa pressure ranges for M10Sµ and M10Sn, respectively. This outcome provides evidence for a higher homogeneous density distribution of the Mg-SiC composite containing submicron particles. Figure 4c shows the volumetric plastic strain changes with pressure for M10Sn and M10Sµ. The volume reduction percentage under 700 MPa for computational and experimental outcomes was compared in Figure 4d. It can be observed that M10Sµ exhibits 2.13% and 2.81% enhancement in volume reduction percentage for FEM and experimental results, respectively, compared to the values for M10Sn.

5. Discussion

This study aimed to investigate the effect of SiC particle size on the densification behavior, specifically the homogeneity of density distribution in Mg-SiC nanocomposites following the CIP process, which is critical for achieving uniform density distribution. To meet this, a modified Drucker-Prager Cap (DPC) elastoplastic continuum finite element method (FEM) model was employed, previously utilized and validated for analyzing the impact of SiC volume fraction on the Mg-SiC nanocomposites’ density distribution homogeneity after cold isostatic pressing [27]. The previous study’s results demonstrated that as the SiC volume fraction increased, the Mg-SiC nanocomposites’ density distribution homogeneity decreased.
The densification process occurs in three distinct stages. Initially, there is a rearrangement of powder particles, leading to an increase in packing density [23]. In the second stage, elastic-plastic deformation takes place at the contact areas between particles, resulting in a higher coordination number and a reduction in porosity as pressure is applied [28]. As the pressure further increases, the phenomenon of cold welding and/or mechanical interlocking becomes prominent. This causes brittle powder particles to fracture and rearrange, contributing to enhanced densification [21]. The process of densification is influenced by several factors, including material properties such as hardness, work-hardening, and cold-welding response, as well as geometric characteristics like particle shape, size, and distribution [23]. The higher maximal relative density and improved compressibility observed in the Mg-SiC nanocomposite containing submicron-sized SiC particles, as estimated through FEM calculations under various pressures, can be attributed to the input model parameters used in the simulation. Higher values of cohesion of material (d) and friction angle (β) for M10Sµ compared to M10Sn (see Table 3) indicated enhanced interlocking of M10Sµ constituent particles [29,30], which can be traced back to the microstructural characterization of the powder composite. M10Sn exhibited finer and equiaxed morphology after 25 h of mechanical milling (Figure 6a), while M10Sµ powder particles displayed a more irregular, flake-like morphology (Figure 6b) [31]. The presence of flakes and irregular-shaped particles creates an asymmetrical local stress field characterized by a significant shear component. This shear component contributes to the entanglement and cohesion of the material [32]. The size and shape of the powder particles also influence the friction angle (β) of a powder composite. Powder composites with fine and equiaxed particles, such as M10Sn, tended to have a lower friction angle and reduced interlocking between the powder particles [33]. The cap eccentricity (R) in the MDPC model reflects the propagation of plastic flow among particles and their resistance to deformation or deflection under applied loads. It provides information about how the particles resist deformation or deflection under the given load [29]. The significantly lower cap parameter value for M10Sn, 0.53, compared to M10Sµ, 1.77, reveals the lower deflection and higher stiffness, i.e., higher resistance to permanent plastic deformation [30] of the composite containing the nanoparticles under the same load. Although the volume fraction of SiC reinforcement in both M10Sµ and M10Sn is the same at 10%, the smaller grains in M10Sn containing nanosized SiC compared to M10Sµ containing submicron-sized SiC result in an increase in grain boundaries, thereby increasing resistance to plastic deformation and densification of M10Sn [34]. The higher value of relative density and volumetric plastic strain of M10Sµ under 100, 300, 500, and 700 MPa compared to M10Sn, as shown in (Figure 5b) and (Figure 4c), respectively, confirm the superior densification of Mg-SiC composite containing the submicron size reinforcement.
In addition to particle size, particle distribution is another crucial parameter affecting the densification behavior of powder composites [35]. Cross-sections of M10Sn and M10Sµ milled powders are displayed in (Figure 6c,d), with the Mg matrix in light grey and the SiC particles as white dots [33]. These Figures indicate a significantly finer nano SiC distribution than submicron SiC in the Mg matrix. Reducing SiC reinforcement size increases the reinforcement particles’ perimeter and, consequently, a larger contact surface between the matrix and reinforcement. In composites containing nano SiC, the increased total contact surface results in higher pressure transfer to the SiC, which in turn causes a nonuniform distribution of pressure and, accordingly, a nonuniform density distribution [5,36].
As evidenced by the FEM-predicted results (Figure 4b and Figure 5b), the M10Sµ exhibits a more homogeneous relative density distribution, which is attributed to its more homogeneous pressure distribution (Figure 5a).
In conclusion, the Drucker-Prager cap (DPC) model effectively predicts the compaction behavior of powder composites containing different reinforcement sizes. However, there was an observed relative error of approximately 2% between the computational and experimental outcomes for relative density (Figure 4a) and also a reduction in volume (Figure 4d). As detailed in the previous work [27], the observed error is attributable to several influencing factors, such as spring back [37], the use of silicon spray as a lubricant during the CIP experiment [25], the assumed constant material parameters in the DPC model [11], and the omission of friction between the particles and die wall during the tests to obtain the DPC parameters [38]. The present study offers a solid foundation for understanding the intricate relationship between SiC particle size and the resulting composite properties in Mg-SiC nanocomposites under Cold Isostatic Pressing. The findings empower materials scientists and engineers to develop tailored strategies for enhancing Mg-SiC nanocomposite performance by shedding light on the underlying mechanisms and key parameters. Ultimately, this will pave the way for advanced materials with superior characteristics, catering to the ever-growing demands of various high-performance applications across industries.

6. Conclusions

This study comprehensively investigates the critical role of SiC particle size, specifically nano and submicron-sized particles, on the compressibility and density distribution of Mg-SiC composites under Cold Isostatic Pressing. The research unveils valuable insights that pave the way for optimized processing techniques and superior composite properties by leveraging an advanced elastoplastic-modified Drucker-Prager Cap constitutive model.
The findings underscore three key aspects:
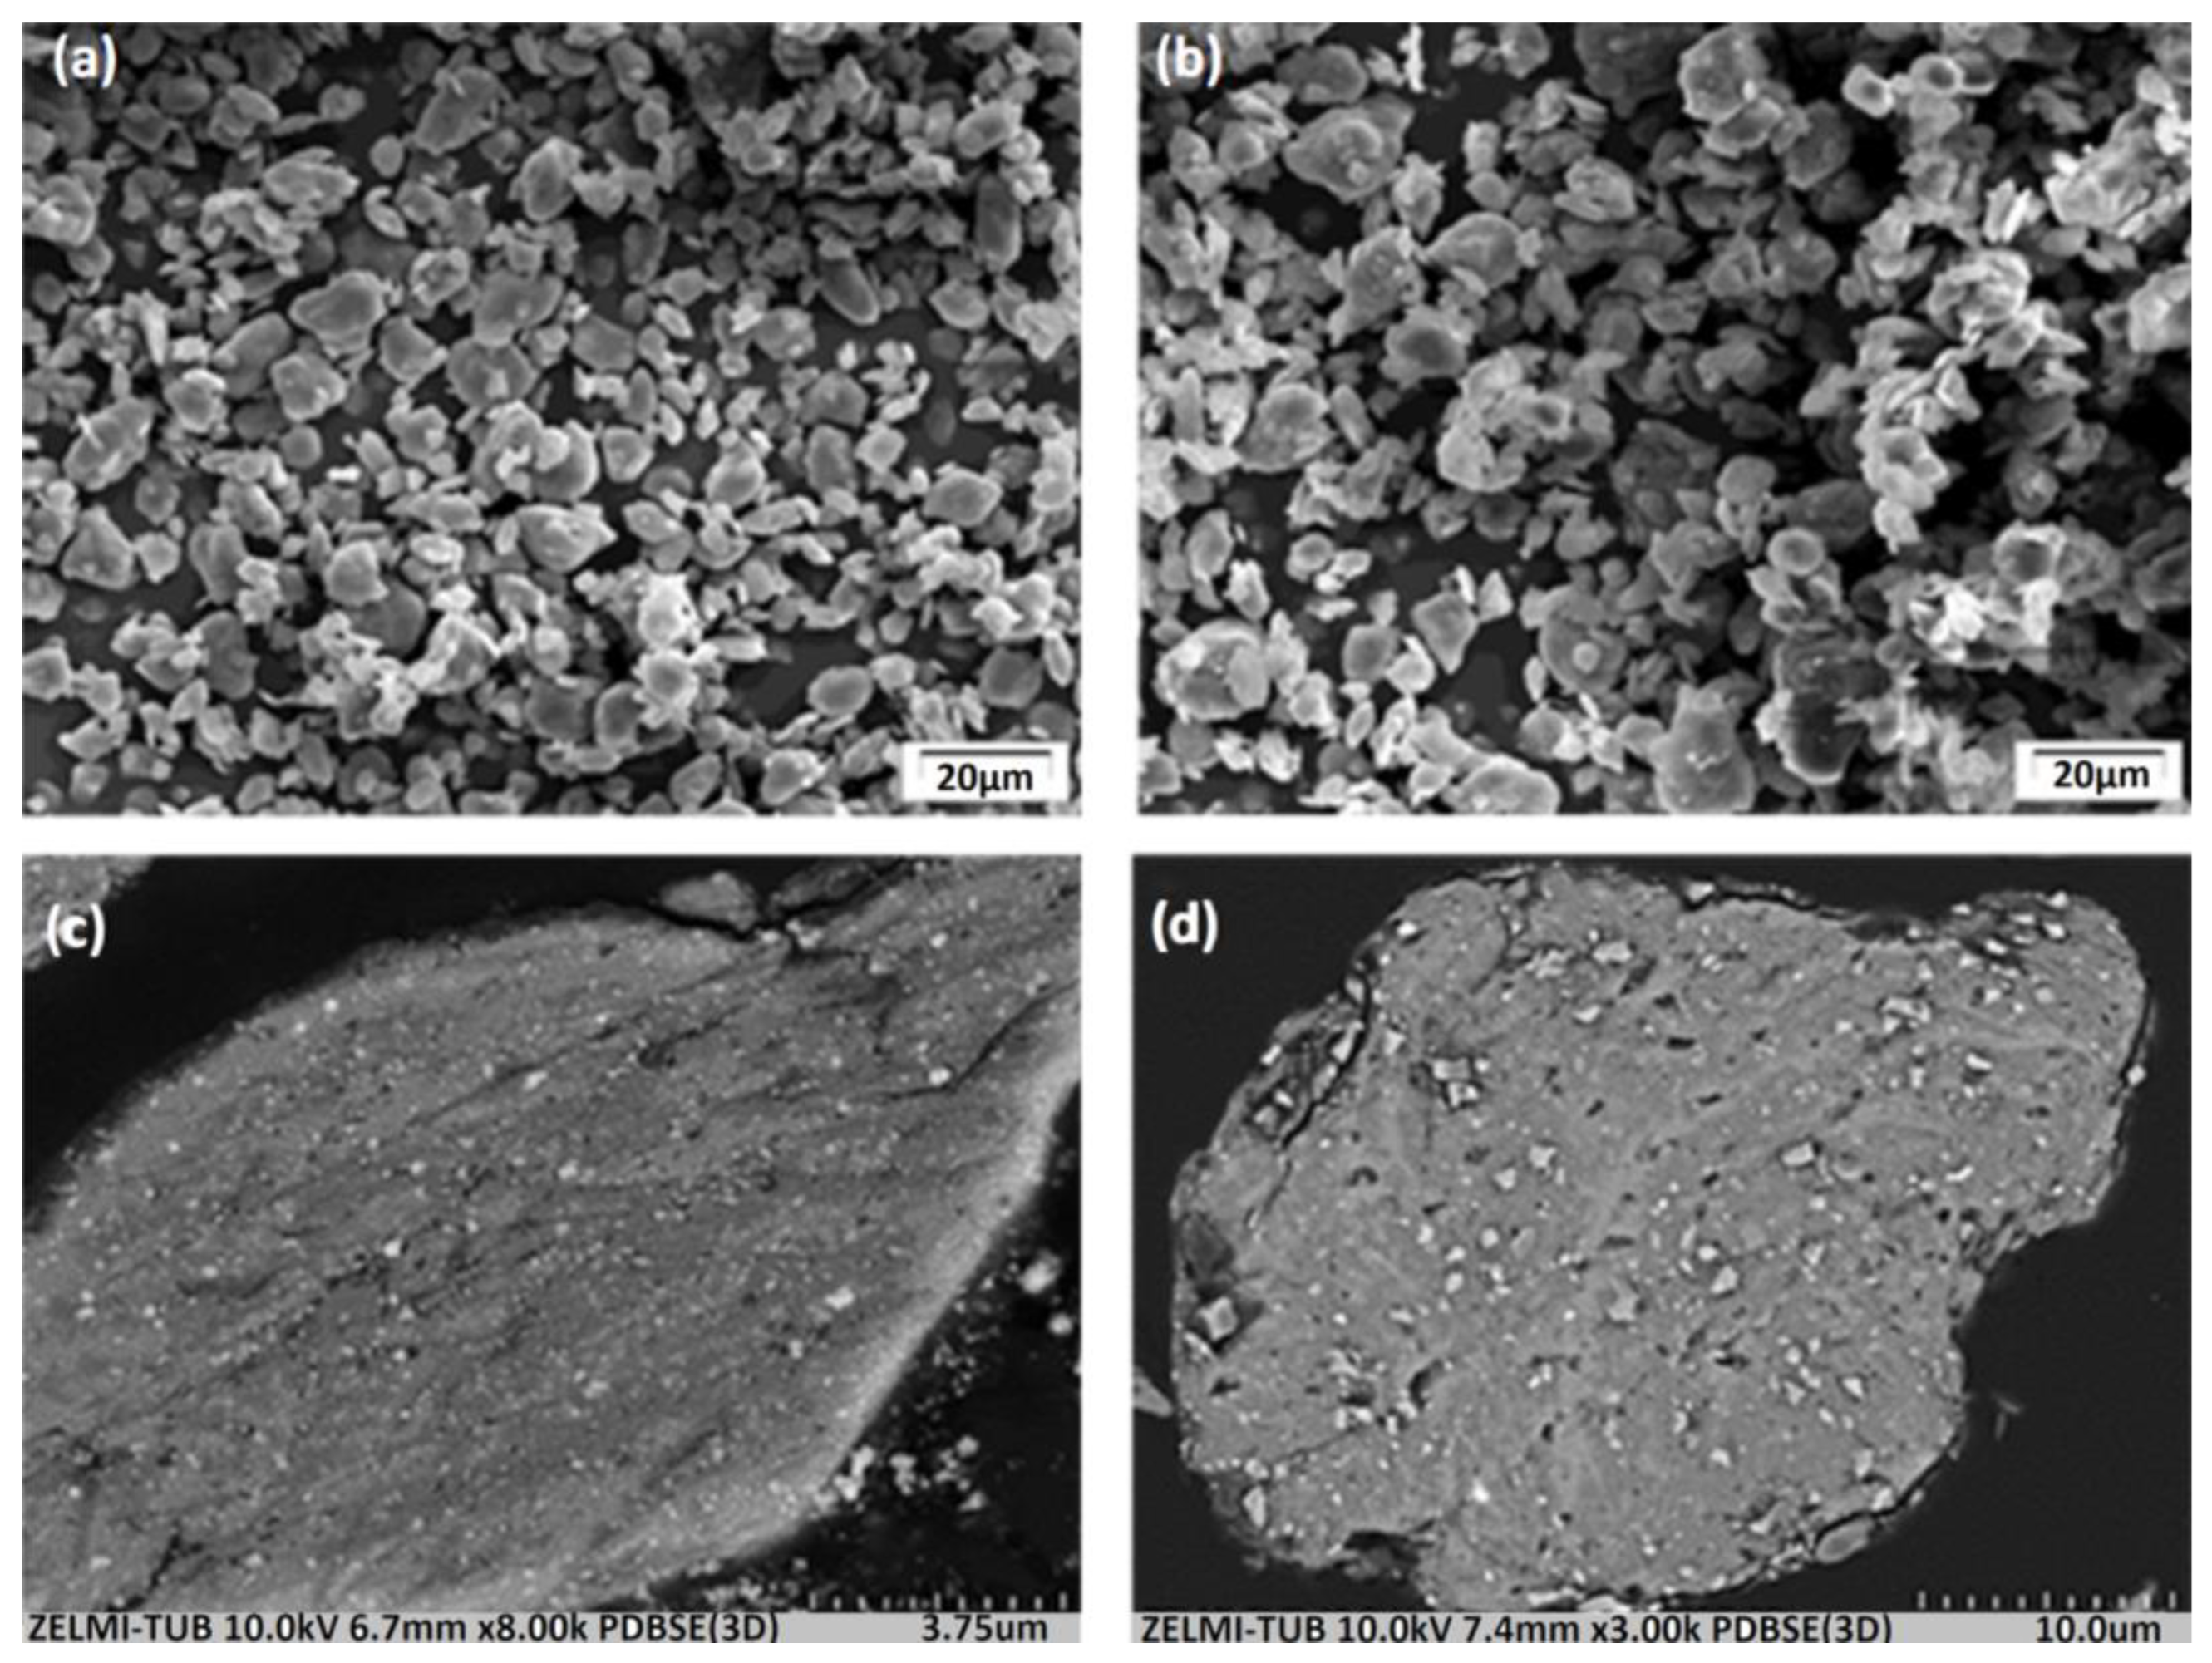
  • Particle morphology plays a pivotal role in material cohesion and friction angle. The presence of fine and equiaxed particles in M10Sn decreases compressibility and densification compared to M10Sµ, which exhibits flake-like and irregular-shaped particles.
  • The smaller grain size in M10Sn, relative to M10Sµ, introduces more grain boundaries, contributing to increased resistance to plastic deformation. Consequently, M10Sn exhibits lower cap eccentricity and faces more significant densification challenges.
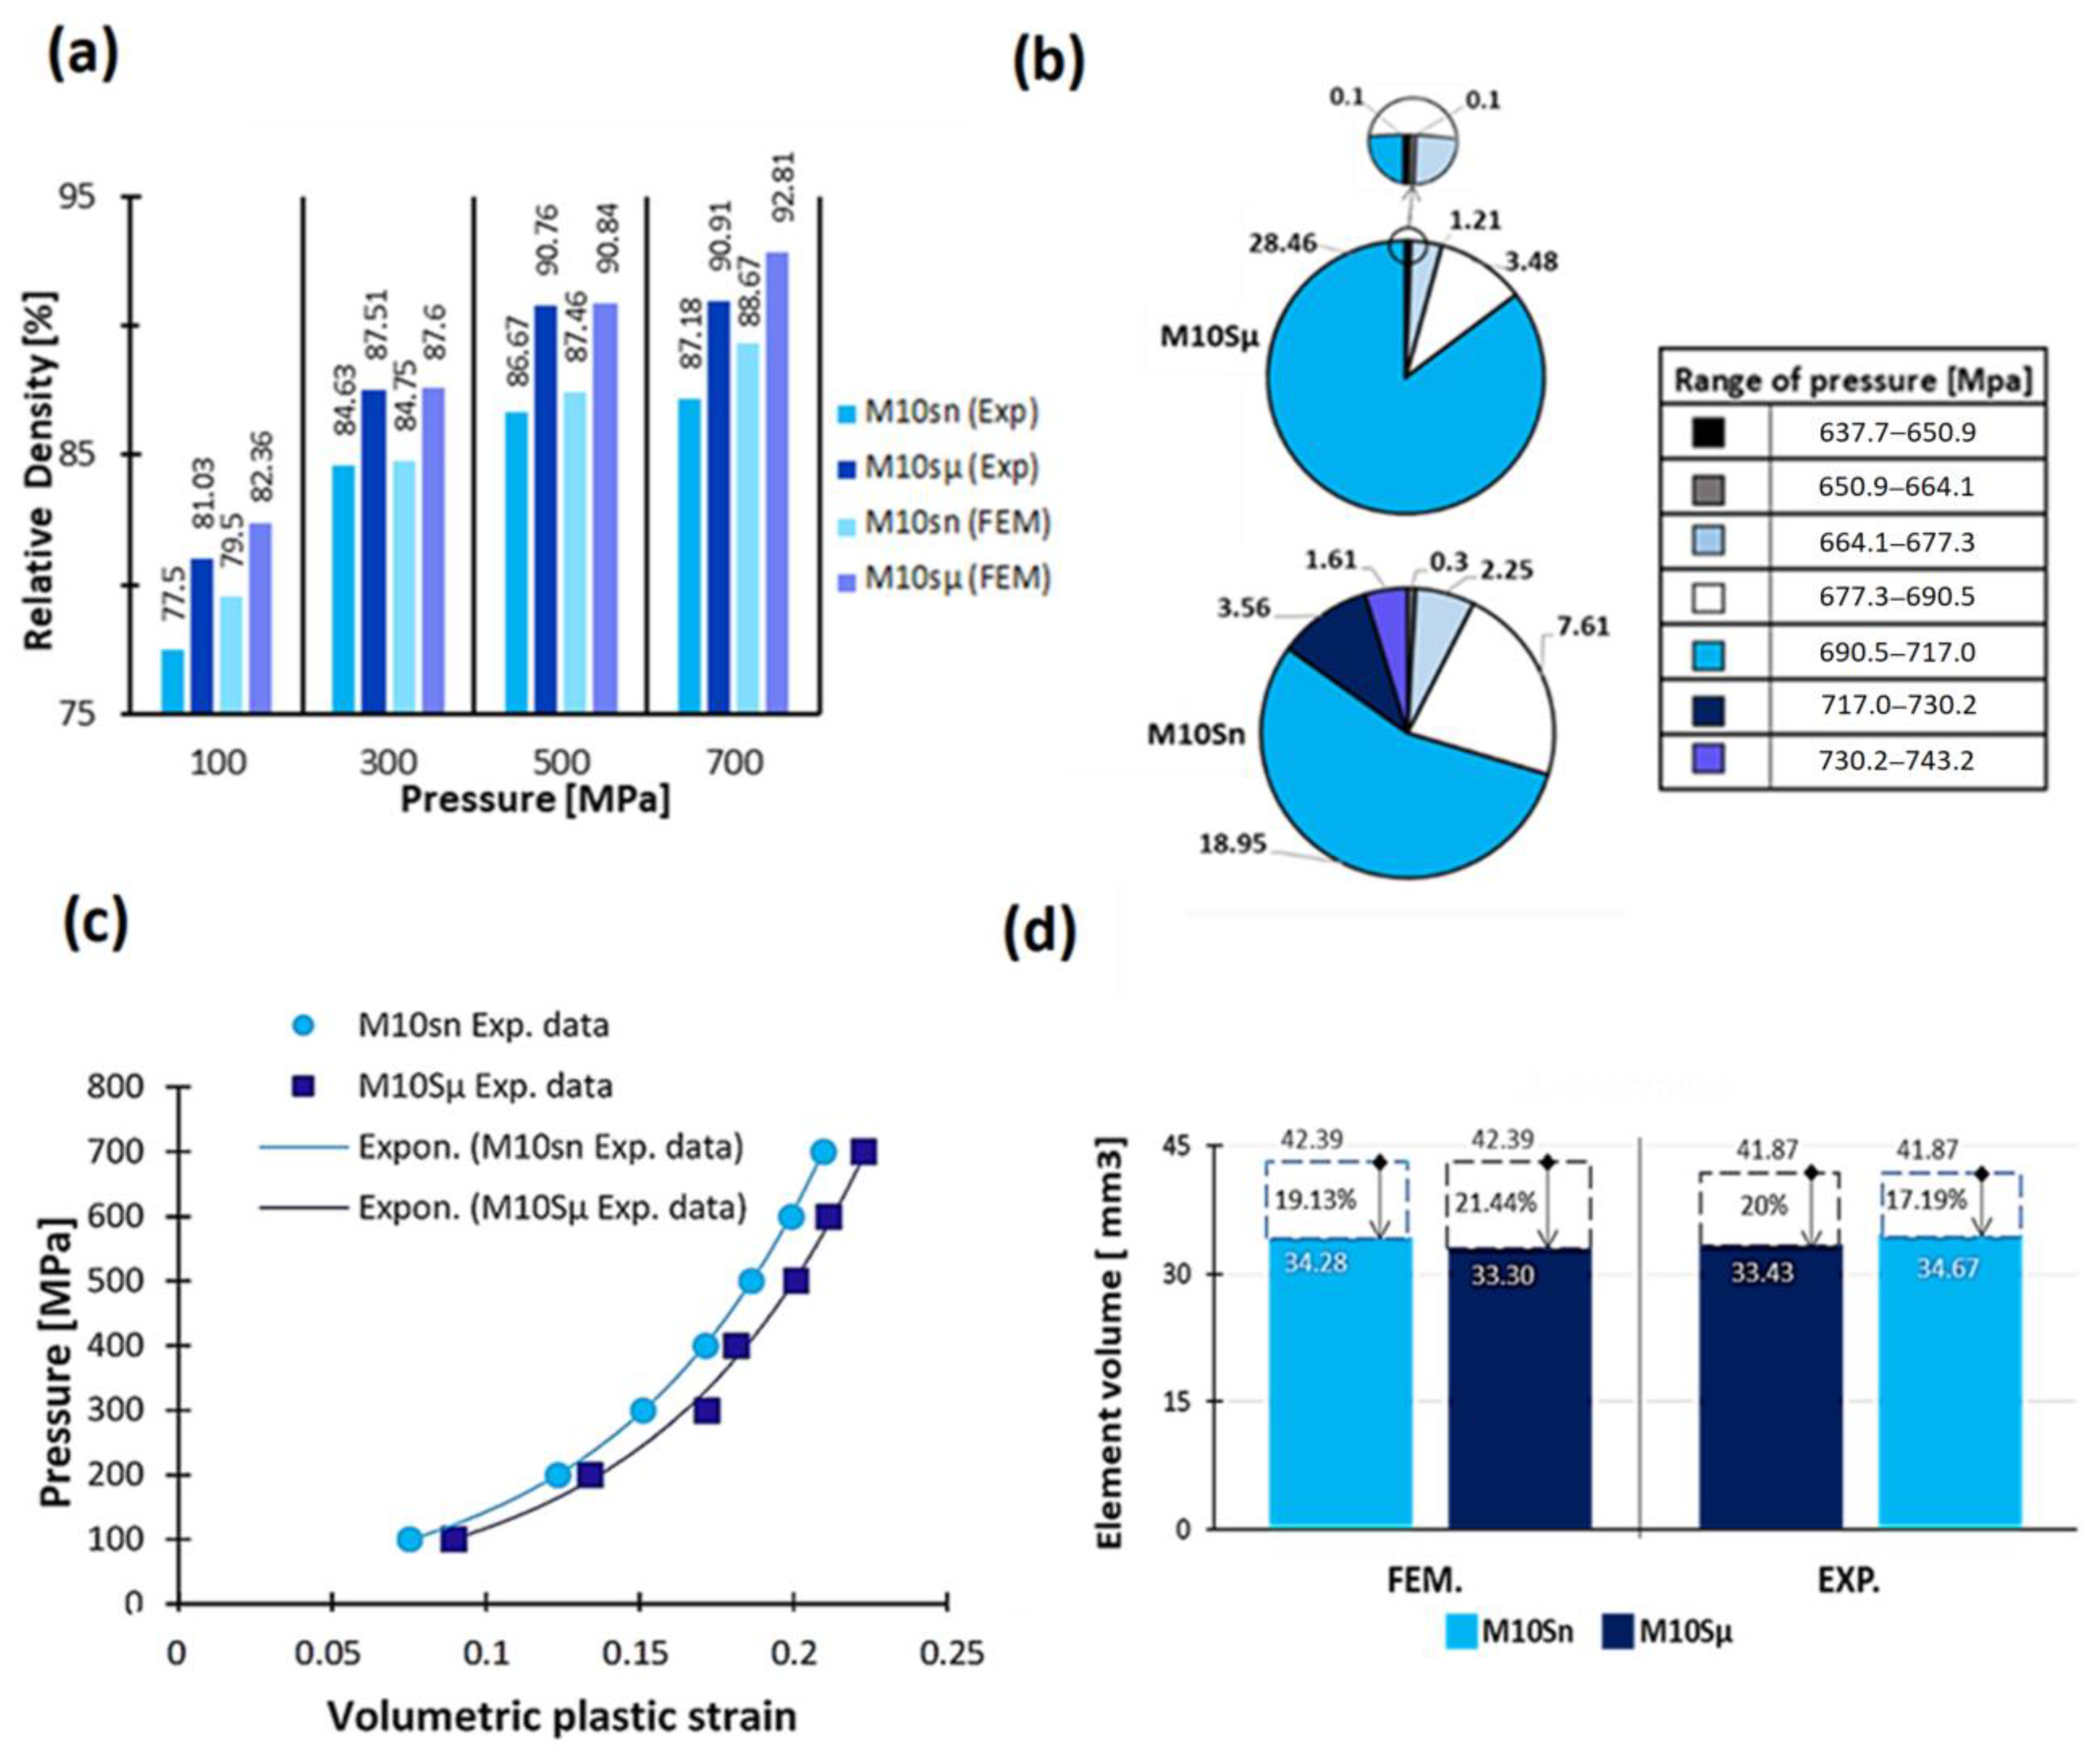
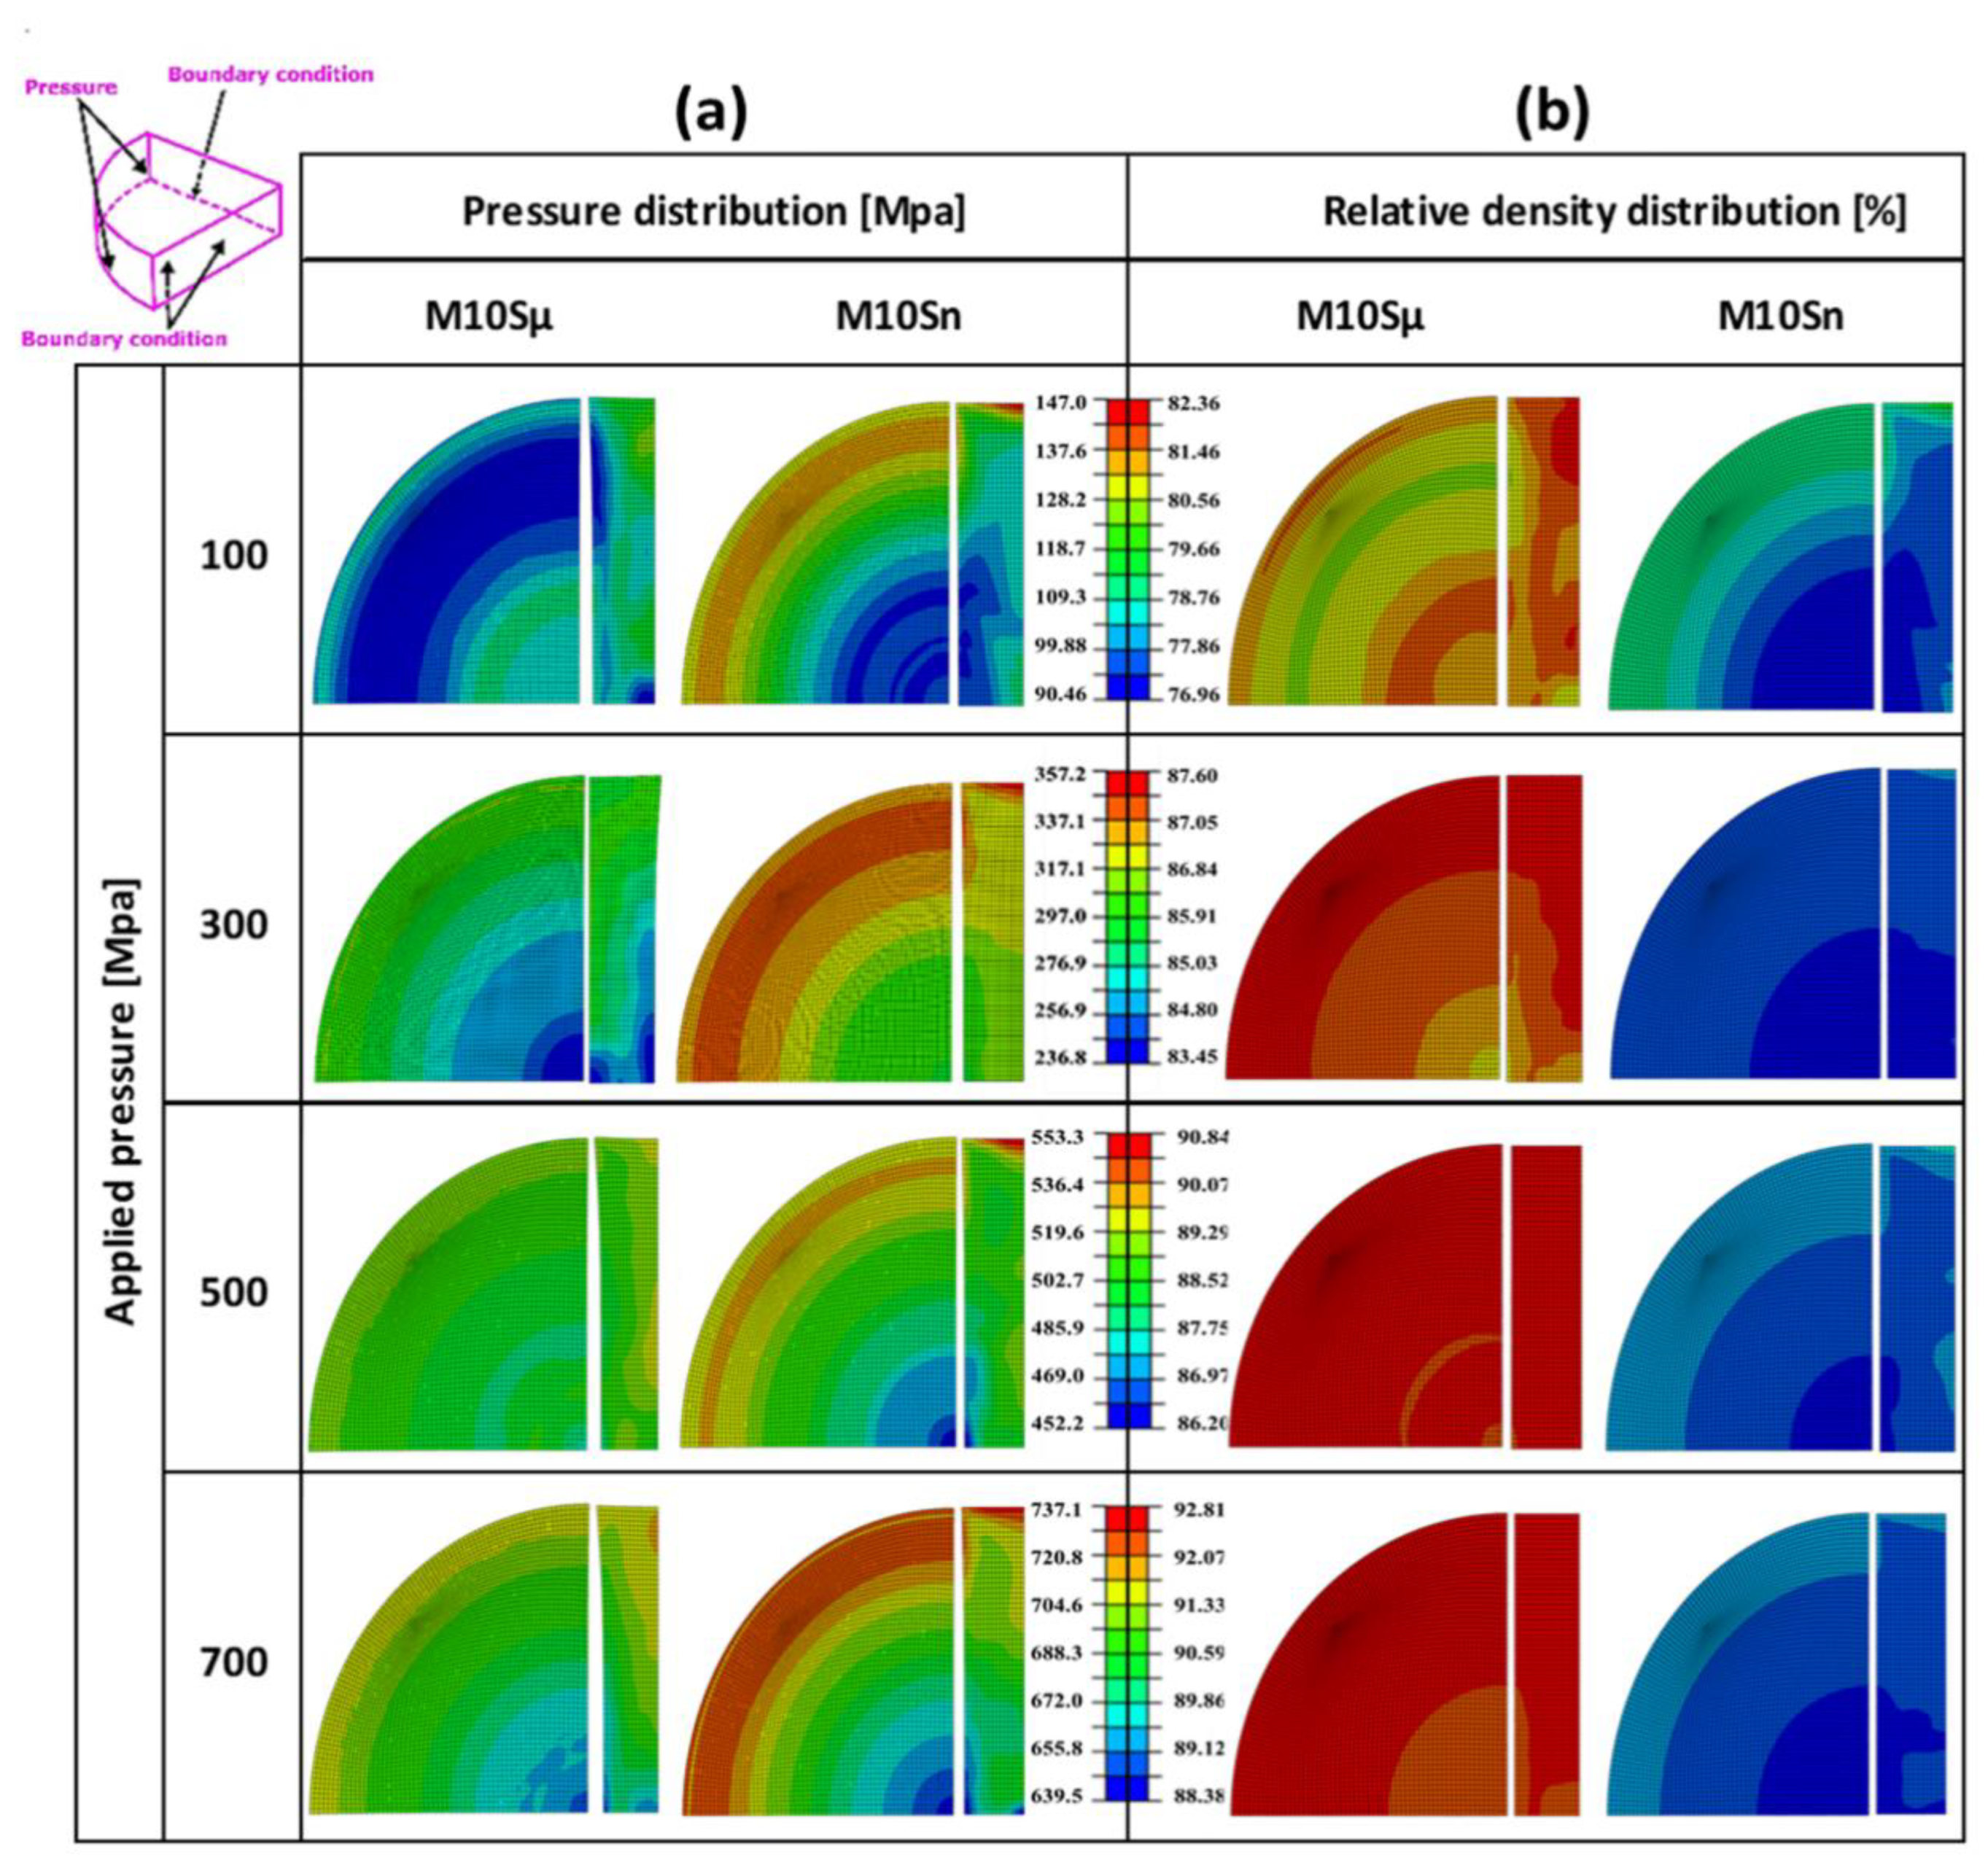
  • The distribution of reinforcement particles profoundly influences pressure and density distribution. Nano-sized SiC particles in M10Sn foster a more extensive contact surface area with the Mg matrix, leading to heterogeneous pressure distribution and density distribution compared to the M10Sµ composite.
Furthermore, this study underscores the utility of employing a modified Drucker-Prager-Cap (DPC) model in simulating the Cold Isostatic Pressing (CIP) process. This approach offers a practical and dependable method for predicting the compaction behavior of Magnesium Silicon Carbide nanocomposite powders, potentially informing and guiding future research in this area.

Author Contributions

Conceptualization, F.R.M., S.K., C.F. and M.S.; methodology, F.R.M. and M.S.; software, F.R.M. and M.S.; validation, F.R.M. and M.S.; formal analysis, F.R.M.; investigation, F.R.M.; resources, F.R.M., S.K., C.F. and M.S.; data curation, F.R.M. and M.S.; writing—original draft preparation, F.R.M. and M.S.; writing—review and editing, F.R.M., S.K., C.F. and M.S.; visualization, F.R.M. and M.S.; supervision, C.F. and M.S.; project administration, F.R.M., C.F. and M.S.; funding acquisition, S.K., C.F. and M.S. All authors have read and agreed to the published version of the manuscript.

Funding

This research received no external funding.

Institutional Review Board Statement

Not applicable.

Informed Consent Statement

Not applicable.

Data Availability Statement

Not applicable.

Acknowledgments

The authors would like to express their gratitude to the North-German Supercomputing Alliance (HLRN) for providing the necessary computation facilities for this research.

Conflicts of Interest

The authors declare no conflict of interest.

References

  1. Weight Loss with Magnesium Alloys|Science. 2023. Available online: https://www.science.org/doi/full/10.1126/science.1182848 (accessed on 1 March 2023).
  2. Luo, A.; Renaud, J.; Nakatsugawa, I.; Plourde, J. Magnesium castings for automotive applications. JOM 1995, 47, 28–31. [Google Scholar] [CrossRef]
  3. Ibrahim, I.A.; Mohamed, F.A.; Lavernia, E.J. Particulate reinforced metal matrix composites—A review. J. Mater. Sci. 1991, 26, 1137–1156. [Google Scholar] [CrossRef]
  4. Tjong, S.C. Novel Nanoparticle-Reinforced Metal Matrix Composites with Enhanced Mechanical Properties. Adv. Eng. Mater. 2007, 9, 639–652. [Google Scholar] [CrossRef]
  5. Paknia, A.; Pramanik, A.; Dixit, A.R.; Chattopadhyaya, S. Effect of Size, Content and Shape of Reinforcements on the Behavior of Metal Matrix Composites (MMCs) under Tension. J. Mater. Eng. Perform. 2016, 25, 4444–4459. [Google Scholar] [CrossRef] [Green Version]
  6. Shen, M.J.; Ying, W.F.; Wang, X.J.; Zhang, M.F.; Wu, K. Development of High Performance Magnesium Matrix Nanocomposites Using Nano-SiC Particulates as Reinforcement. J. Mater. Eng. Perform. 2015, 24, 3798–3807. [Google Scholar] [CrossRef]
  7. Alam, M.E.; Han, S.; Nguyen, Q.B.; Salem Hamouda, A.M.; Gupta, M. Development of new magnesium based alloys and their nanocomposites. Scopus 2011, 509, 8522–8529. [Google Scholar] [CrossRef]
  8. Kim, K.T.; Choi, S.W.; Park, H. Densification Behavior of Ceramic Powder under Cold Compaction. J. Eng. Mater. Technol. 2000, 122, 238–244. [Google Scholar] [CrossRef]
  9. Ewsuk, K.G. Powder Granulation and Compaction; Elsevier: Amsterdam, The Netherlands, 2001. [Google Scholar] [CrossRef]
  10. Lu, L.; Lai, M.O.; Ng, C.W. Enhanced mechanical properties of an Al based metal matrix composite prepared using mechanical alloying. Mater. Sci. Eng. A 1998, 252, 203–211. [Google Scholar] [CrossRef]
  11. Zhong, X.L.; Gupta, M. Development of lead-free Sn-0.7Cu/Al2O3 nanocomposite solders with superior strength. J. Phys. D. Appl. Phys. 2008, 41, 1–7. [Google Scholar] [CrossRef]
  12. Henderson, R.J.; Chandler, H.W.; Akisanya, A.R.; Barber, H.; Moriarty, B. Finite element modelling of cold isostatic pressing. J. Eur. Ceram. Soc. 2000, 20, 1121–1128. [Google Scholar] [CrossRef]
  13. Shin, H.; Kim, J.B.; Kim, S.J.; Rhee, K.Y. A simulation-based determination of cap parameters of the modified Drucker-Prager cap model by considering specimen barreling during conventional triaxial testing. Comput. Mater. Sci. 2015, 100, 31–38. [Google Scholar] [CrossRef]
  14. Schomberg, A.K.; Diener, A.; Wünsch, I.; Finke, J.H.; Kwade, A. The use of X-ray microtomography to investigate the microstructure of pharmaceutical tablets: Potentials and comparison to common physical methods. Int. J. Pharm. X 2021, 3, 100090. [Google Scholar] [CrossRef]
  15. Mortazavi, B.; Novikov, I.S.; Podryabinkin, E.V.; Roche, S.; Rabczuk, T.; Shapeev, A.V.; Zhuang, X. Exploring phononic properties of two-dimensional materials using machine learning interatomic potentials. Appl. Mater. Today 2020, 20, 100685. [Google Scholar] [CrossRef]
  16. An, X.; Liu, Y.; Huang, F.; Jia, Q. MPFEM Modeling on the Compaction of Al/SiC Composite Powders with Core/Shell Structure. Powder Technol. 2018. [Google Scholar] [CrossRef] [Green Version]
  17. Salavati, M.; Rabczuk, T. First-principles investigation of N-triphenylene-graphdiyne nanosheets as an anode material for Na, K, Mg and Ca storage. Comput. Mater. Sci. 2019, 169, 109093. [Google Scholar] [CrossRef]
  18. Salavati, M.; Alajlan, N.; Rabczuk, T. Theoretical Prediction of P-Triphenylene-Graphdiyne as an Excellent Anode Material for Li, Na, K, Mg, and Ca Batteries. Appl. Sci. 2021, 11, 2308. [Google Scholar] [CrossRef]
  19. Salavati, M.; Mojahedin, A.; Shirazi, A.H.N. Mechanical responses of pristine and defective hexagonal boron-nitride nanosheets: A molecular dynamics investigation. Front. Struct. Civ. Eng. 2020, 14, 623–631. [Google Scholar] [CrossRef]
  20. Lu, C. Determination of Cap Model Parameters Using Numerical Optimization Method for Powder Compaction. Available online: https://epublications.marquette.edu/cgi/viewcontent.cgi?article=1058&context=dissertations_mu (accessed on 1 March 2023).
  21. Atrian, A.; Majzoobi, G.H.; Markert, B.; Nourbakhsh, S.H. A novel approach to calibrate the Drucker–Prager Cap model for Al7075 powder. Arch. Appl. Mech. 2018, 88, 1859–1876. [Google Scholar] [CrossRef]
  22. Zhou, M.; Huang, S.; Hu, J.; Lei, Y.; Xiao, Y.; Li, B.; Yan, S.; Zou, F. A density-dependent modified Drucker-Prager Cap model for die compaction of Ag57.6-Cu22.4-Sn10-In10 mixed metal powders. Powder Technol. 2017, 305, 183–196. [Google Scholar] [CrossRef]
  23. Buljak, V.; Baivier-Romero, S.; Kallel, A. Calibration of Drucker–Prager Cap Constitutive Model for Ceramic Powder Compaction through Inverse Analysis. Materials 2021, 14, 4044. [Google Scholar] [CrossRef]
  24. Han, L.H.; Elliott, J.A.; Bentham, A.C.; Mills, A.; Amidon, G.E.; Hancock, B.C. A modified Drucker-Prager Cap model for die compaction simulation of pharmaceutical powders. Int. J. Solids Struct. 2008, 45, 3088–3106. [Google Scholar] [CrossRef] [Green Version]
  25. Reiterer, M.; Kraft, T.; Janosovits, U.; Riedel, H. Finite element simulation of cold isostatic pressing and sintering of SiC components. Ceram. Int. 2004, 30, 177–183. [Google Scholar] [CrossRef]
  26. Mitra, B.; Hilden, J.; Litster, J.D. Compaction mechanics of plastically deformable dry granules. Powder Technol. 2016, 291, 328–336. [Google Scholar] [CrossRef]
  27. Rahimi Mehr, F.; Salavati, M.; Morgenthal, A.; Kamrani, S.; Fleck, C. Computational analysis and experimental calibration of cold isostatic compaction of Mg-SiC nanocomposite powders. Mater. Today Commun. 2021, 27, 102321. [Google Scholar] [CrossRef]
  28. Wagle, G.; Engel, R.; Bollina, R.; German, R. Statistical Analysis of Modified Drucker-Prager Cap Model Parameters for Application to Modeling Die Compaction. Adv. powder Metall. Part. Mater. 2003, 4, 4–24. [Google Scholar]
  29. Popescu, I.N.; Vidu, R. Densification Mechanism, Elastic-Plastic Deformations and Stress-Strain Relations of Compacted Metal-Ceramic Powder Mixtures (Review). Sci. Bull. Valahia Univ. Mater. Mech. 2018, 16, 7–12. [Google Scholar] [CrossRef]
  30. Liu, Y.; Guo, X.; Lu, H.; Gong, X. An investigation of the effect of particle size on the flow behavior of pulverized coal. Procedia Eng. 2015, 102, 698–713. [Google Scholar] [CrossRef] [Green Version]
  31. Alamolhoda, S.; Heshmati-Manesh, S.; Ataie, A.; Badiei, A. Role of process control agents on milling behavior of Al and TiO2 powder mixture to synthesize TiAl/Al2O3 nano composite. Int. J. Mod. Phys. Conf. Ser. 2012, 05, 638–645. [Google Scholar] [CrossRef]
  32. Benesovski, F. Fundamental principles of powder metallurgy. von W. D. Jones, London, Edward Arnold Publishers Ltd., 1960, 1032 S., 316 abb., 81 tab., Leinen, £ 7 7s net. Mater. Corros. 1962, 13, 54. [Google Scholar] [CrossRef]
  33. Villatte, L.; Rua-Taborda, M.-I.; Ndayishimiye, A.; Randall, C.A.; Largeteau, A.; Goglio, G.; Elissalde, C.; Bordère, S. Mechanisms and energetics in the early stages of solvent-assisted low-temperature sintering of ZnO. Materialia 2022, 22, 101418. [Google Scholar] [CrossRef]
  34. Hübler, D.S. From Mechanically Milled Powders to Mg-SiC Nanocomposites: Relationships between Processing, Microstructure and Mechanical Properties. 2022. Available online: https://depositonce.tu-berlin.de/handle/11303/13861 (accessed on 1 March 2023).
  35. Liu, Y.B.; Lim, S.C.; Lu, L.; Lai, M.O. Recent development in the fabrication of metal matrix-particulate composites using powder metallurgy techniques. J. Mater. Sci. 1994, 29, 1999–2007. [Google Scholar] [CrossRef]
  36. Suryanarayana, C.; Al-Aqeeli, N. Mechanically alloyed nanocomposites. Prog. Mater. Sci. 2013, 58, 383–502. [Google Scholar] [CrossRef]
  37. Bhat, T.S.; Venkatesh, T.A. On the relationships between hardness and the elastic and plastic properties of transversely isotropic power-law hardening materials. J. Mater. Res. 2022, 37, 3599–3616. [Google Scholar] [CrossRef]
  38. Quandt, A.; Popov, I.; Tománek, D. Superior Hardness and Stiffness of Diamond Nanoparticles 2020. Carbon 162, 497–501. [CrossRef] [Green Version]
Figure 1. An illustration of Drucker-Prager Cap model: yield surface in the p-q plane.
Applsci 13 08909 g001
Figure 2. (a) the failure mode of the Brazilian compression test mode of failure, (b) the failure mode of the uniaxial compression test, (c) the die compaction set-up, and (d) the die compaction schematic with four strain gauges.
Applsci 13 08909 g002
Figure 3. The measured hoop strain εθ for the upper and lower strain gauges versus various compacts height under an interior pressure of 700 MPa for M10Sn and M10Sµ.
Applsci 13 08909 g003
Figure 4. (a) Compressibility-relative density [%] over 100, 300, 500, and 700 [MPa] after CIP for M10Sµ and M10Sn from Exp. and FEM outcomes. (b) The FEM predicted value of element volume EVOL [mm3] in the pressure certain domain for M10sµ and M10Sn. (c) Volumetric plastic strain-Pressure (Hardening law) for M10Sn and M10Sµ (d) FEM and Exp magnitude of e reduction in volume for M10Sµ and M10Sn under 700 MPa CIP.
Applsci 13 08909 g004
Figure 5. (a) the contour plots of pressure distribution for M10Sµ and M10Sn after the CIP process under different applied pressures of 100, 300, 500, and 700 Mpa, (b) the contour plots of Relative density distribution for M10Sµ and M10Sn after CIP under 100, 300, 500 and 700 MPa.
Applsci 13 08909 g005
Figure 6. Morphology of milled powders (a) M10Sn and (b) M10Sµ. The Backscattered electron image of (c) M10Sn and (d) M10Sµ displays the dispersion of SiC particles (white) in the magnesium matrix (light grey) homogeneously [33].
Applsci 13 08909 g006
Table 1. The particle sizes of as-received Mg, SiC, and the particles volume percent (Vol%) of the Mg-SiC powder composites.
SampleMg Average Particle SizeSiC Average Particle SizeSiC Particle Vol%
M10Sµ (Mg+ Submicron size SiC)40 µm⪅1 µm10%
M10Sn (Mg+ Nano size SiC)40 µm50 nm10%
Table 2. The calibration of Modified Drucker-Prager Cap model.
Testing ProcedureDescriptionParameter, Unit
axial compression testcohesion of materiald, MPa
Radial compression testfriction angleβ, degree
Instrumented die compaction testCap eccentricityR
CIP experimentPressure (Hardening law)Pb, Mpa
Table 3. Modified Drucker-Prager Cap model obtained parameters for M10Sµ and M10Sn.
SampleParameter
d,
(Cohesion of Material,
MPa)
β,
(Friction Angle, Degree)
R
(Cap Shape Parameter)
Hardening Law
M10Sµ0.37576.671.77p = 30.071 𝑒 14.508 ε v p
M10Sn0.3676.60.53p = 33.434 𝑒 14.508 ε v p
Disclaimer/Publisher’s Note: The statements, opinions and data contained in all publications are solely those of the individual author(s) and contributor(s) and not of MDPI and/or the editor(s). MDPI and/or the editor(s) disclaim responsibility for any injury to people or property resulting from any ideas, methods, instructions or products referred to in the content.

