Abstract
Current methodologies for insulator defect detection are hindered by limitations in real-world applicability, spatial constraints, high computational demand, and segmentation challenges. Addressing these shortcomings, this paper presents a robust fast detection algorithm combined segmentation head networks with harnessing self-attention and transformer (HST-Net), which is based on the You Only Look Once (YOLO) v5 to recognize and assess the extent and types of damage on the insulator surface. Firstly, the original backbone network is replaced by the transformer cross-stage partial (Transformer-CSP) networks to enrich the network’s ability by capturing information across different depths of network feature maps. Secondly, an insulator defect segmentation head network is presented to handle the segmentation of defect areas such as insulator losses and flashovers. It facilitates instance-level mask prediction for each insulator object, significantly reducing the influence of intricate backgrounds. Finally, comparative experiment results show that the positioning accuracy and defect segmentation accuracy of the proposed both surpass that of other popular models. It can be concluded that the proposed model not only satisfies the requirements for balance between accuracy and speed in power facility inspection, but also provides fresh perspectives for research in other defect detection domains.
1. Introduction
With the development of the power industry, the safe operation of electrical facilities and equipment has become a focal point for both the industry and the public. In particular, surface defects on the insulators of power transmission lines are a significant contributing factor to transmission line failures. These surface defects could cause a degradation in insulator performance, which will lead to flashovers, system paralysis, or even power system accidents, presenting a serious threat to the safe operation of power systems [1]. To prevent such scenarios, the regular inspection of ceramic insulators on transmission lines plays a pivotal role in grid transmission [2,3].
In the past few years, many scholars have conducted a series of research on insulator surface defect detection. The traditional detection methods mainly categorize into power-based, microwave-based, infrared imaging-based, and other electromagnetic wave technology-based approaches. Fang et al. [4] computed the electric field distribution of normal insulators and insulators with conductive defects and analyzed the influence of defect length and position parameters on insulator electric field distribution. Mei et al. [5] proposed a microwave technology-based method for detecting internal defects of composite insulators. Jiang et al. [6] introduced a defect detection method that converted reflected microwaves into energy signals and compared them with reference values. Zhao et al. [7] introduced a strategy for intermediate feature generation based on binary feature pooling, which combined with support vector machine (SVM) effectively detects and classifies insulator string defects in infrared images. Cheng et al. [8] used the infrared detection for online analysis of composite insulators to determine the relationship between defect temperature and infrared results with different types of thermal defects for composite insulators. Wang et al. [9] used a terahertz time-domain system to test insulator models with different interface defects and analyze the characteristics of time-domain waveforms. Mei et al. [10] proposed a terahertz (THz) imaging method based on edge detection algorithms. Zheng et al. [11] proposed an ultrasonic non-destructive testing method for assessing the density uniformity of basin insulators in gas-insulated metal-enclosed switchgear devices. But in practical application, these traditional detection methods are often subject to spatial constraints. Especially when inspecting high-altitude insulation equipment, it is difficult for personnel to directly contact the equipment, making these methods relatively low in feasibility and efficiency. Additionally, due to the vastness of power systems, these methods also entail significant time and labor costs, which is especially prominent in comprehensive inspections of large-scale power grids. Therefore, insulator surface defect detection methods based on image recognition have got more and more attention.
Insulator image processing methods can be divided into two categories. The first one encompasses traditional image processing approaches, which extract insulator features through techniques such as spatial transformations, threshold segmentation, and morphological filtering. Reddy et al. [12] developed an adaptive neuro-fuzzy inference system based on SVM to estimate the condition of insulators. Zhao et al. [13] proposed a method oriented toward angle detection and binary shape prior knowledge. Tan et al. [14] introduced a fusion algorithm based on shed contour features and grayscale similarity matching. Zhai et al. [15] put forward a solution for detecting bundle drop faults of glass and ceramic insulators using spatial morphological features. The above methods can yield satisfactory localization results when handling images that possess simple backgrounds, especially for the texture features of impurities are highly contrasted with those of insulators. However, they have shown limited robustness when dealing with complex backgrounds, large camera dynamics, and low signal-to-noise ratios.
Another category is based on deep learning algorithms, which apply object detection algorithms to the task of identifying insulators and their defects. The strength of deep learning methods lies in their ability to handle a variety of complex scenarios and adapt to different image qualities, as they can learn complex features from large amounts of data. Gao et al. [16] proposed an improved small insulator defect detection network to better utilize channel information and enhance the effect of different channels on the feature map. Zhong et al. [17] constructed a new localized network called the TOL framework to reduce background and achieve closer localization. Zhang et al. [18] used Faster RCNN to locate insulators and extract their target defect images from detected images. Chen et al. [19] proposed an INSU-YOLO insulator detection algorithm based on the adaptive threat estimation method of the whole insulator and defect area ratio. Wang et al. [20] constructed a new network based on ResNeSt and added an improved RPN for feature extraction to better detect minute defects on insulators. Qiu et al. [21] improved the YOLOv4 model structure using MobileNet lightweight convolutional neural network for the detection of transmission line insulator defects. Xu et al. [22] proposed an insulator defect detection algorithm based on the improved MobilenetV1-YOLOv4, enhancing the accuracy of insulator fault recognition and the convenience of daily work. Zhang et al. [23] presented a SE-YOLOv5 based on a synthetic fog algorithm for insulator detection. Han et al. [24] proposed an improved SIoU loss function considering the regular influence of regression direction on accuracy, which can accelerate model convergence and achieve better results in regression. Tao et al. [25] studied the detection of power line insulator defects using aerial images analyzed with convolutional neural networks. She et al. [26] proposed a convolutional neural network integration with data enhancement and transfer learning for insulator fracture detection with small samples. He et al. [27] introduced a motor fault detection scheme based on one-class tensor hyperdisk, which emphasized the ongoing relevance of data-driven methods for fault detection. Wu et al. [28] introduced an end-to-end physics-informed gated recurrent graph attention unit network for unsupervised anomaly detection, highlighting the integration of prior knowledge with process data to improve the modelling performance and interpretability. The above methods based on deep learning are superior to traditional methods, especially in situations involving complex backgrounds or challenging imaging conditions. However, it should be noted that these methods typically require substantial computational resources, which is not ideal for real-time application scenarios and resource-limited environments. Therefore, it is urgent to solve the balance problem between detection speed and detection accuracy, to meet the increasing efficiency and precision requirements of power companies for inspections.
In addition, in the context of insulator defect detection, segmentation algorithms aid in precise pixel-level object detection and enhance the semantic understanding of an object’s shape and size. Their high accuracy, coupled with their heightened instance-awareness capabilities, makes them an excellent choice for effective detection and quantification of defects. Tan et al. [29] proposed an intelligent defect detection algorithm for the contact network based on the Mask Region Convolutional Neural Network (R-CNN). Lu et al. [30] developed an outdoor support insulator surface defects segmentation approach via image adversarial reconstruction. Li et al. [31] studied an insulator defect recognition based on global detection and local segmentation. Antwi-Bekoe et al. [32] predicted the instance-level masks for each insulator object presented from the RoI align layer. However, minor local changes in complex image targets, such as partial occlusion, could result in image segmentation or edge extraction failure, leading to inefficiency and weak robustness in multi-stage segmentation networks. Besides, due to multiple iterations, they exhibit high time complexity, which does not meet the requirements for real-time segmentation during insulator inspections. Due to the complexity of working conditions and the enormous computational cost of multi-stage segmentation algorithms, current methods for insulator surface defect detection and segmentation still face some challenges in practical applications [33].
As illustrated in Table 1, signal analysis methods shine for their versatility in detecting various surface defects, but they suffer from low robustness and slow inspection speeds. Traditional image processing methods have shown certain capabilities in inspection speed and robustness, yet they still harbor limitations. Deep learning methods, however, represent the cutting edge in insulator defect detection. Despite their high computational resource demands, their robust performance and rapid inspection speeds make them the most promising approach currently available. Therefore, how to balance the accuracy and speed of power facility inspection is a problem worth studying.

Table 1.
Comparison of the status of the proposed model.
To sum up, this paper proposes an insulator surface defect detection and segmentation model based on the You Only Look Once (YOLO) v5 model, incorporating self-attention and transformation techniques, named HST-Net. It replaces the original backbone network with a transformer cross-stage partial (Transformer CSP) network, enhancing its ability to capture information across different depth feature maps. It particularly focuses on complex insulator surface defect types and degrees, as real-world insulator surfaces often suffer from issues such as lighting angles, environmental factors, and occlusion, causing defects to appear unobvious or incomplete. Furthermore, an insulator defect segmentation head network is proposed for segmenting defect regions such as insulator loss and flashover. This approach assists in achieving instance-level mask prediction for each insulator object, greatly reducing the impact of complex backgrounds. Additionally, HST-Net is based on a single-stage detection segmentation network, reducing model complexity and computational and storage resources, thus accelerating model training and detection. This effectively resolves the contradiction between speed and accuracy in traditional insulator defect detection methods. The main novelties and contributions of the proposed model are as follows.
- (1)
- We introduce a novel Transformer-CSP as the backbone, which, enriched with a self-attention module, achieves superior feature reuse and gradient information retention.
- (2)
- A new insulator defect segmentation head network is proposed, effectively enhancing the precision of defect region segmentation, thereby reducing the impact of complex backgrounds.
- (3)
- Comparative experiments demonstrate that the proposed method outperforms existing models in accuracy and robustness, notably in high-altitude insulator equipment detection, signifying an optimal balance between accuracy and speed.
2. HST-Net Model
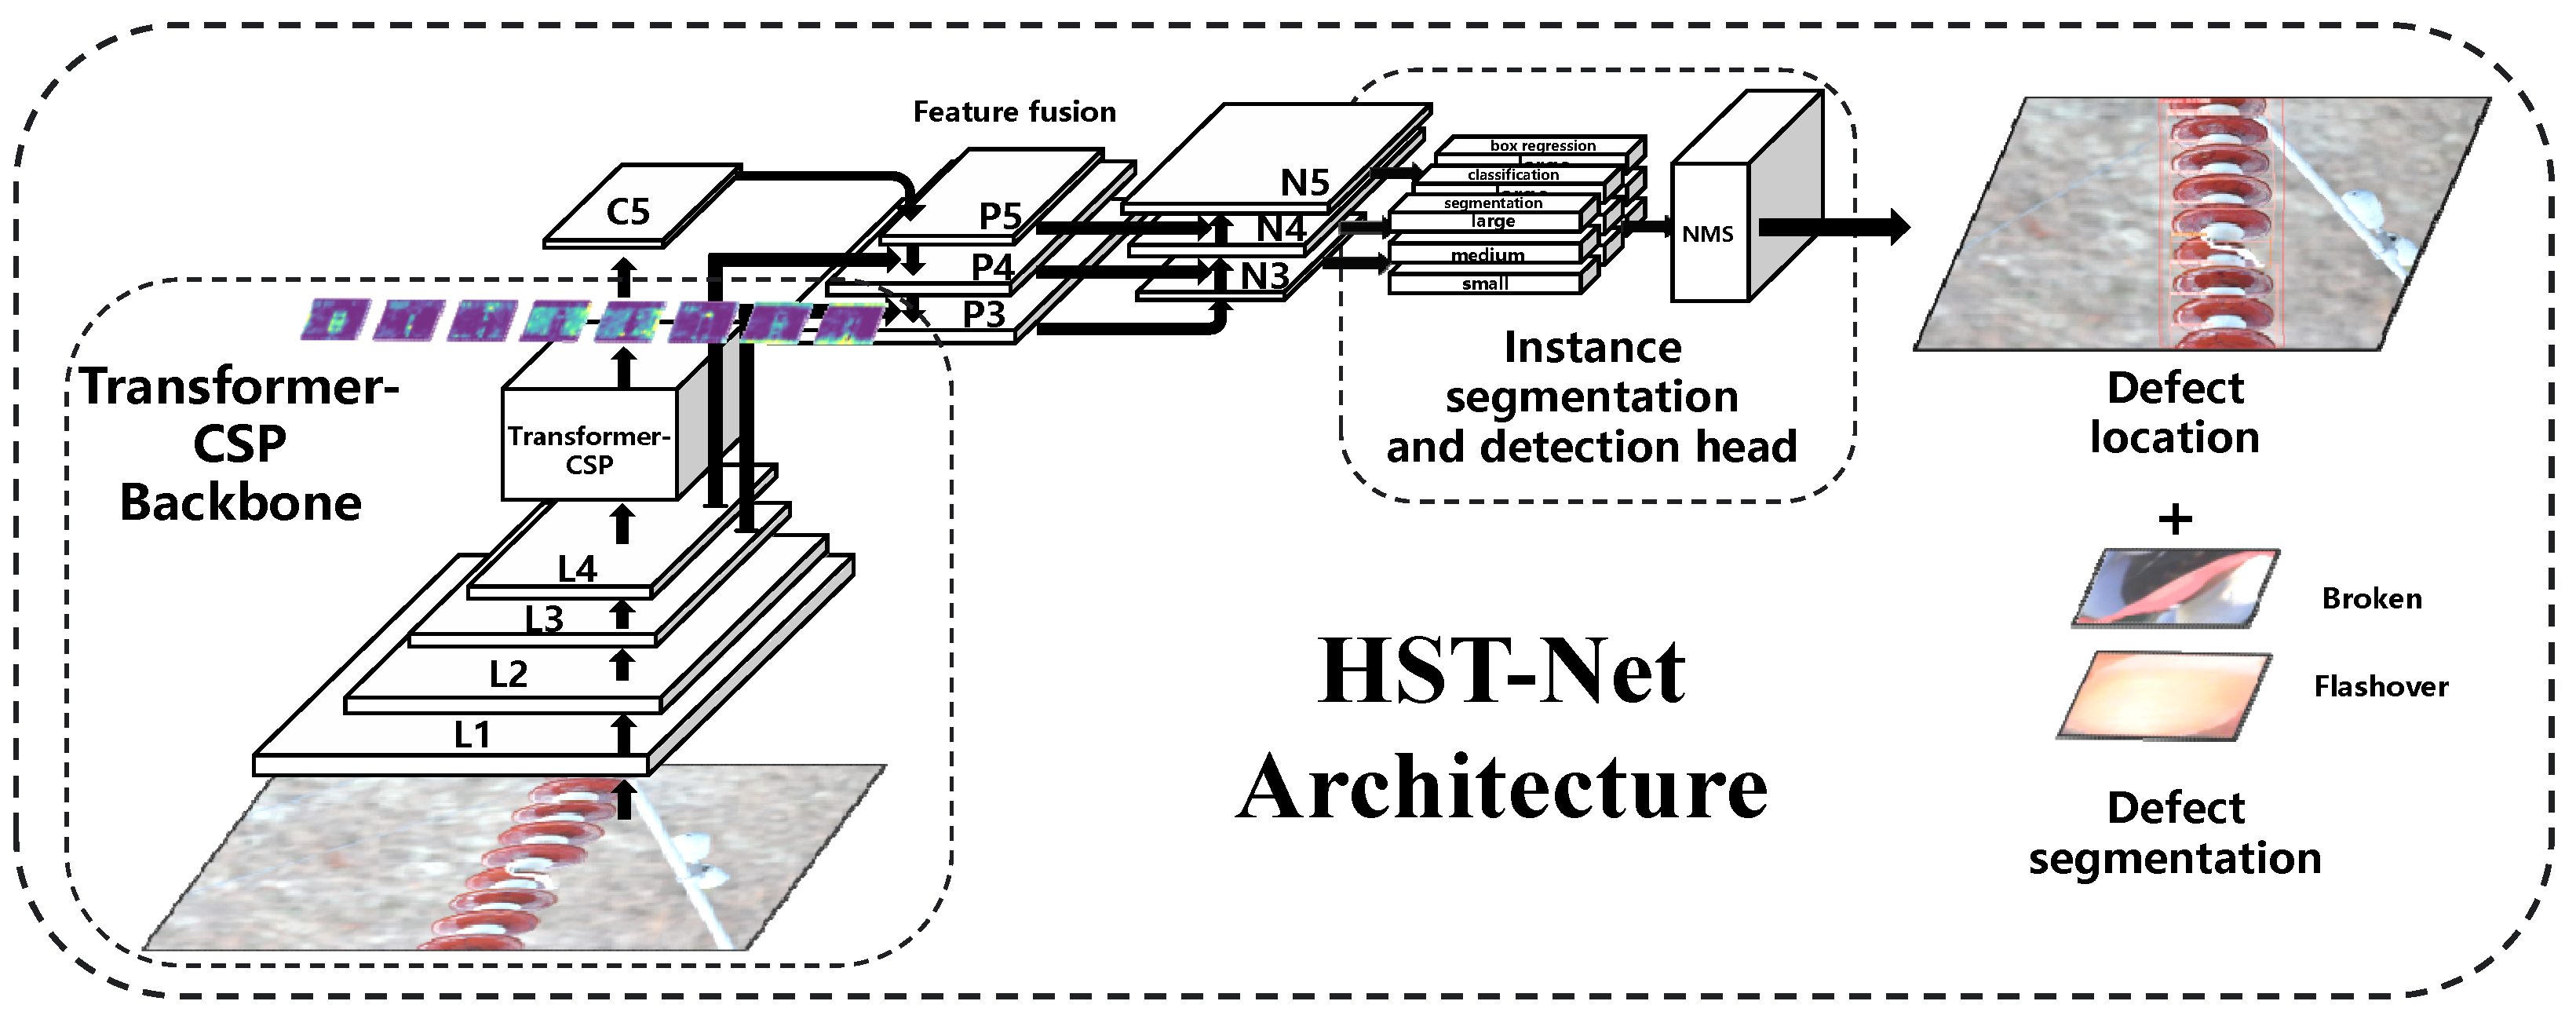
In pursuit of enhancing the efficiency of defect detection on the surface of insulators during power equipment inspections in substations, this paper introduces an improved detection model, the HST-Net. As shown in Figure 1, the HST-Net model is composed of three stages.
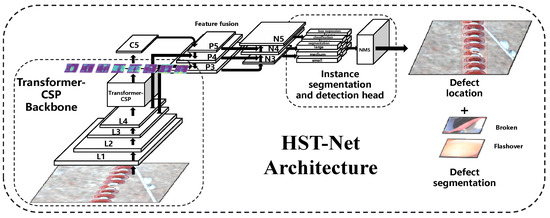
Figure 1.
Framework diagram of HST-Net model.
In the first stage, a Transformer CSP is presented as the backbone network for feature extraction to facilitate the reuse of features and prevent excessive gradient information loss by truncating the gradient flow. The integration of a self-attention module fosters a more effective separation and fusion of prominent and subtle features of surface defects on insulators. In the second stage, a path aggregation network (PANet) is used for the feature refinement. The PANet boosts the semantic flow through a bottom-up pathway and achieves a high-resolution restoration of deep features via a top-down route. This enhances the feature fusion impact, thereby allowing the extraction of richer semantic information from both high-level and low-level image features. The third stage encompasses the decision network and prediction phase. In the head network of the HST-Net, we augment the original object detection head—which includes localization, classification, and confidence—with a segmentation head. This adjustment enables precise pixel-level defect detection, thereby strengthening the semantic understanding of the shape and size of insulator defects.
The realization of the entire model aims to emulate the actual process of power equipment inspections in substations. Therefore, special attention is paid to handle various interfering environments, ensuring the proposed HST-Net model architecture can be applied to the detection of surface defects in insulators, thus further improving the accuracy and efficiency of defect detection.
2.1. Backbone Network with Transformer-CSP
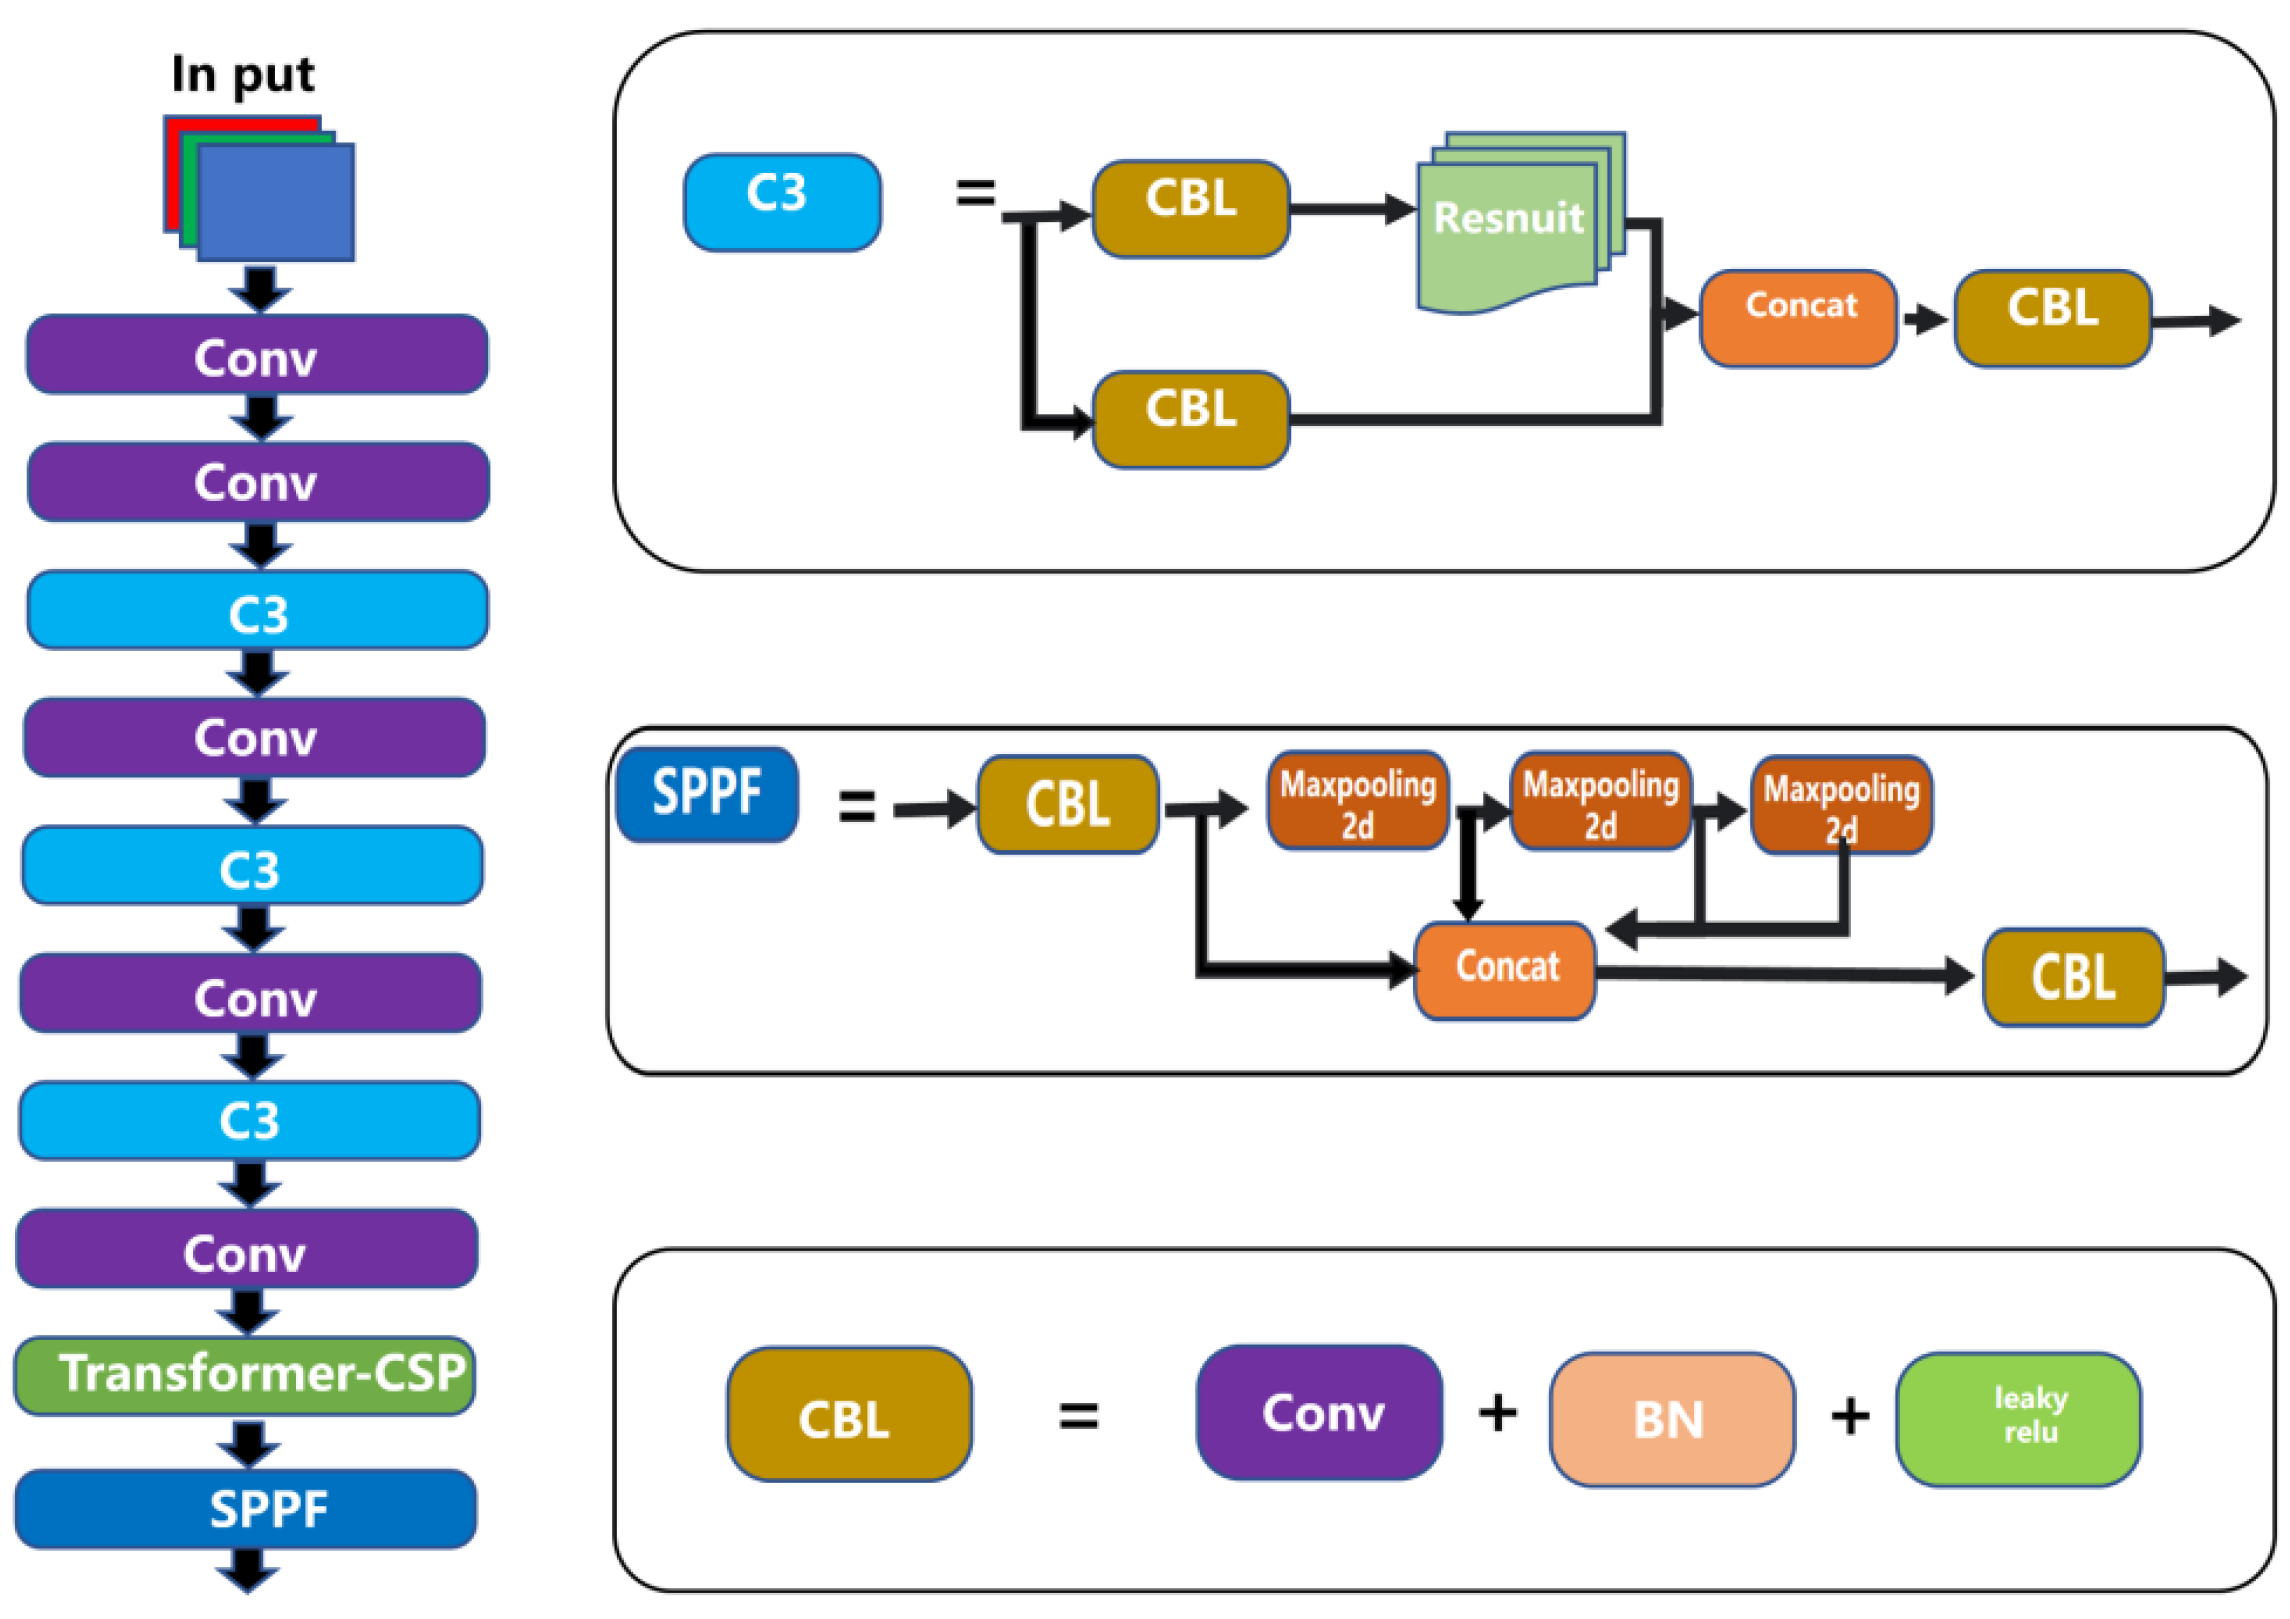
2.1.1. Structure of Backbone Network
As shown in Figure 2, the backbone network of HST-Net is composed of an assortment of modules, namely the convolution layer (Conv), three convolution layers with a shortcut connection (C3), Transformer-CSP, and spatial pyramid pooling—fast (SPPF). In the initial phase, a Conv module with a stride of 2 is employed to halve the input image size, augmenting computational efficiency while concurrently eliciting preliminary features. This is subsequently succeeded by the iterative application of Conv and C3 modules, which execute a gamut of convolutional operations and residual connections, facilitating the extraction of intricate features with depth from the input.
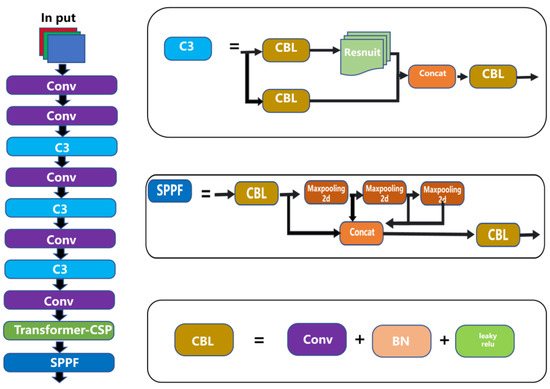
Figure 2.
Backbone network structure.
2.1.2. Transformer-CSP Module and Self-Attention Mechanism
Drawing inspiration from the transformative capabilities of the transformer network and the CSP architecture, the proposed Transformer-CSP module enhances the model’s capacity to assimilate contextual information and more nuanced feature representations. It incorporates a self-attention mechanism, which enables the model to weigh the importance of different features in the input, providing the network with a more global understanding of the input data. By assigning varying degrees of attention to different features, the model can focus more on the relevant parts of the input and less on the less relevant parts, enhancing the overall feature representation.
The SPPF module incorporates spatial pyramid pooling to address multi-scale object detection. By conducting pooling operations of diverse sizes on the same feature map, it extracts features at multiple scales, thus endowing the model with the capability to adapt to a myriad of object detection tasks. Three sets of anchor boxes are defined for P3/8, P4/16, and P5/32 layers, aiding in the precise localization of objects across different scales.
The final C3 module demonstrates a notably swift execution speed, attributed to its employment of a reduced 20 × 20 feature grid. In contrast, the initial C3 module, characterized by a very small stride and a correspondingly large grid, executes at a considerably slower pace [34]. The Conv–Batch_Normalization–Leaky_Relu (CBL) module consists of the Conv, batch normalization (BN), and leaky rectified linear unit operations (Leaky_Relu), which results in a large computational load. In order to improve the detection accuracy, this paper presents a novel Transformer-CSP module by introducing the self-attention mechanism. The Transformer-CSP module is shown in Figure 3.
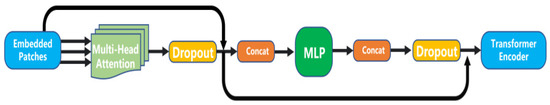
Figure 3.
Structure of transformer-CSP module.
2.1.3. Transformer-CSP Implementation and Multi-Head Attention Layer
Inspired by the ViT proposed by Dosovitskiy et al. [35], we try to apply a transformer to the YOLO algorithm and introduce the self-attention mechanism. The image is divided into patches of the same size, and a class representation is added before the patch, which corresponds to the global information. The machine can notice the correlation between different parts of the whole input while maintaining the output structure consistent with the C3 module. The mathematical expression of input X is shown in Formula (1), H is the height of the divided patch, W is the width of the divided patch, and C is the number of channels.
Since the input is a one-dimensional embedded vector, the two-dimensional data needs to be reshaped. The conversion formula is as follows:
where, P is the size of the patch, and the mathematical expression of the mapped result Y is:
where, D is the fixed size accepted by transformer, and mapping E is learnable.
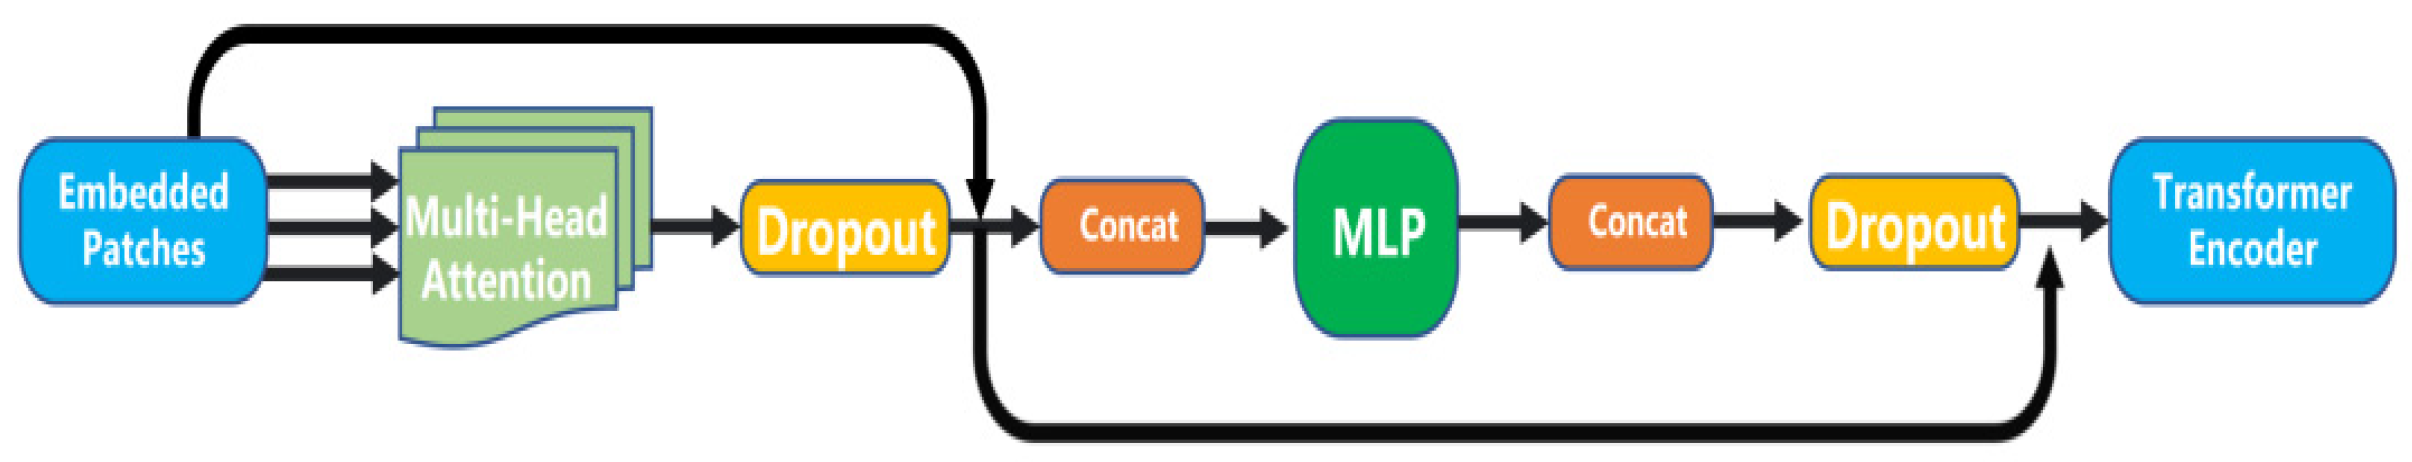
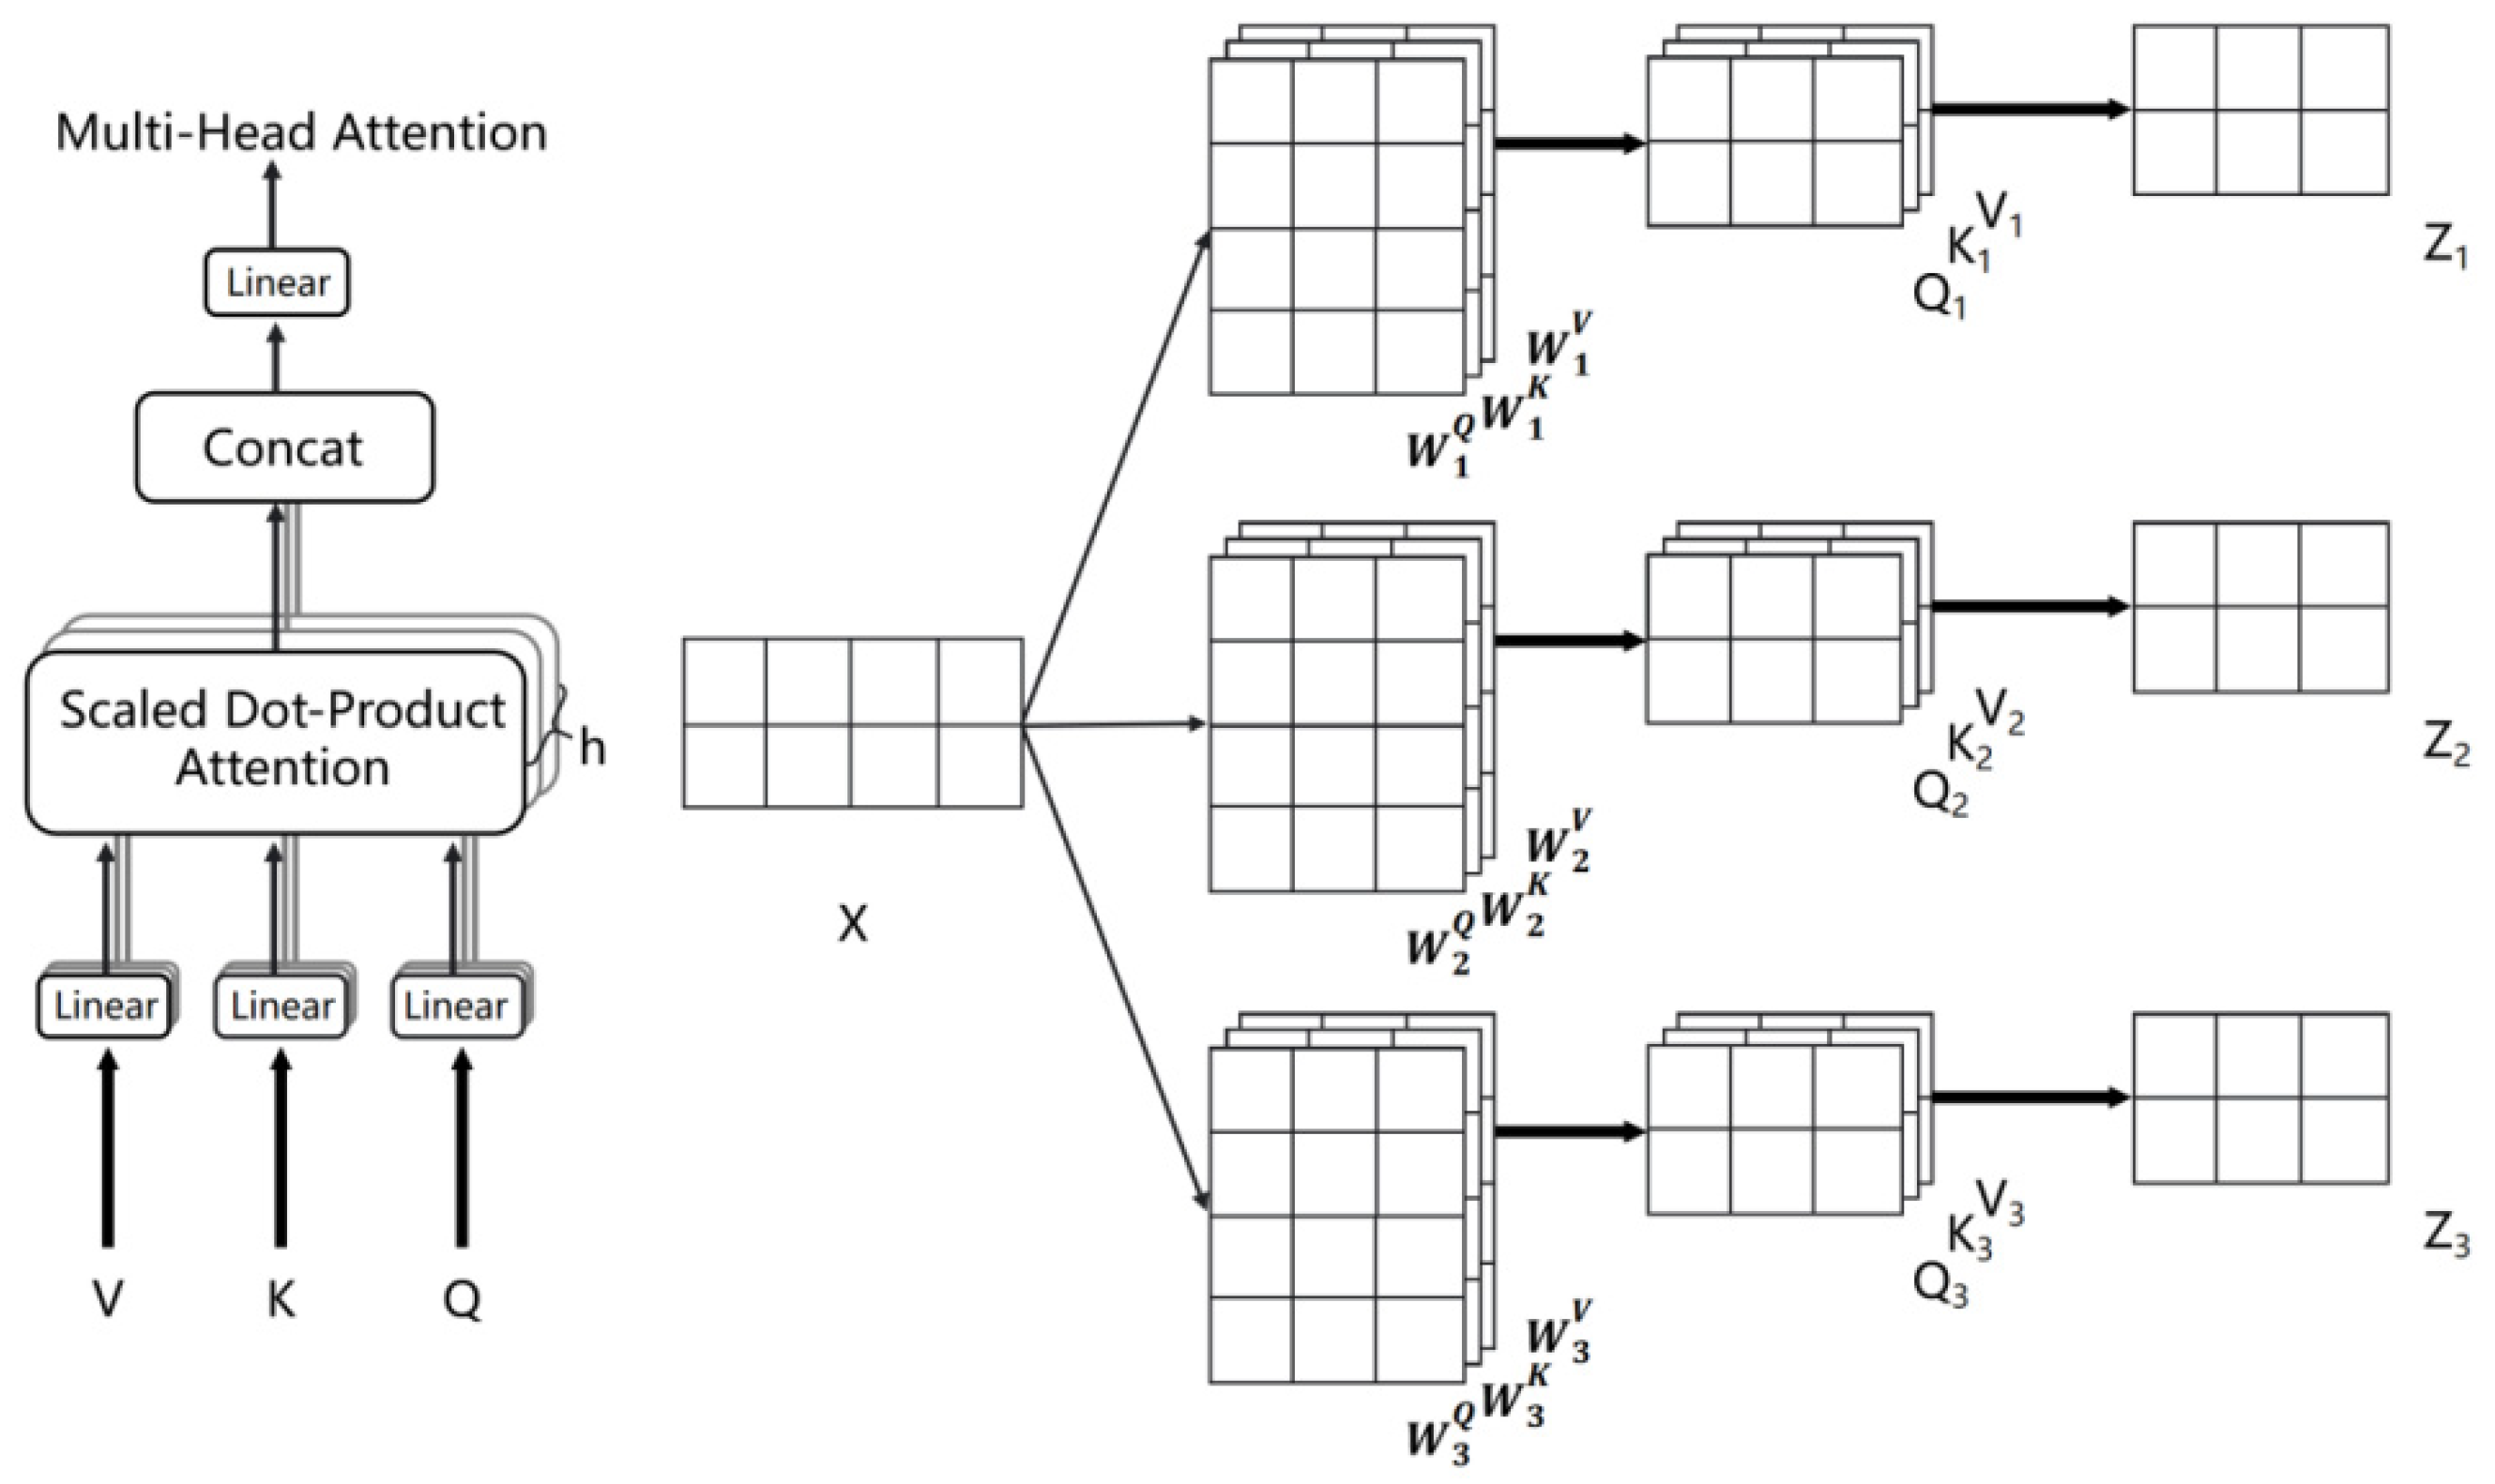
The Transformer-CSP adopts a six-tier encoder-record structure, and each encoder contains two sub-tiers. The first sub-layer is the multi-head attention layer. The structure of multi-head attachment is shown in Figure 4. Q, K and V are calculated through h linear transformations.
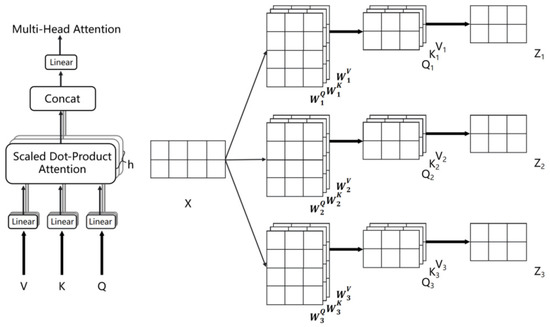
Figure 4.
Structure of multi-head attention module.
The second sub-layer is the full connection layer, which is connected with all nodes of the previous layer to synthesize the features extracted from the front. The reason for using multiple attention is to make the proposed model focus on different aspects of information from multiple subspaces. The decoder layer is composed of self-attention layer, attention layer and feedforward neural network. This structure can make the network invest more attention resources in the bearing area so as to obtain more information in the defect area and suppress other useless information. It allows us to quickly screen out valuable information from a large amount of information. Embedded patches first perform the layer norm processing, then performs the multiple-headed self-attention operation, and last performs the residual add operation. The calculation formula of self-attention is as follows.
Output of the multi head attention module is obtained by linear transformation of the input vector X, and the matrix W multiplied by them respectively is the matrix obtained by training. The similarity degree of Q and K can be obtained by the transposed point multiplication of Q and K, and divided by dk to keep the gradient stable during training. Use softmax to normalize to get the weight matrix, and use this weight matrix and V to weight. The reason for dividing the weight matrix is to solve the problem that the gradient of softmax disappears when the two vectors are large. The h matrices obtained in Figure 4 are spliced to obtain the large characteristic matrix, and the linear transformation is performed with the matrix W, and the results of multiple sub-layers are mapped to the original space to obtain Z.
Next, carry out layer norm processing, and then use a multi-layer perceptron, that is, MLP layer, to learn from the residual network to carry out the residual add operation to prevent degradation. The proposed Transformer-CSP module removes the operation of Norm in the original Vision transformer structure, and the MLP module does not use the activation function but directly operates on two full-connection layers. In order to avoid the gradient dispersion problem when increasing the depth of the network, the residual connection is used between each sub-layer, which makes it easier to train the depth network. The residual mapping is also easy to capture the subtle fluctuations of the identity mapping. The encoder module increases the ability to capture different local information, and it can use the self-attention mechanism to explore the potential of feature representation.
The innovative design of the Transformer-CSP backbone network, with its adaptability to multi-scale object detection and its capacity to handle multi-class object detection tasks, underscores its efficacy as a potent tool across a diverse array of detection tasks.
2.2. Head Network with Segmentation Head
Insulator defect segmentation can be regarded as a semantic segmentation problem. The goal of semantic segmentation is to categorize each pixel within a given image or image sequence into corresponding classes. Since this essentially involves assigning a class to every pixel, it is also considered as a dense prediction problem. For defect segmentation, pixels demand a higher computational volume than the minimal external contour used for defect localization.
Traditional semantic segmentation algorithms, such as Unet [36] and OCRNet [37], can no longer meet the substations’ demand for real-time detection. Therefore, in this study, we introduce an improved real-time segmentation head network capable of accurately segmenting insulator defects in real-time. Given that the objective of insulator defect segmentation is to attain a mask of defects with natural spatial connectivity, most primary detectors can only obtain classification results through box parameters. While secondary detectors can acquire information through feature localization steps such as box, and use Conv layer output masks. This greatly influences the algorithm’s real-time performance.
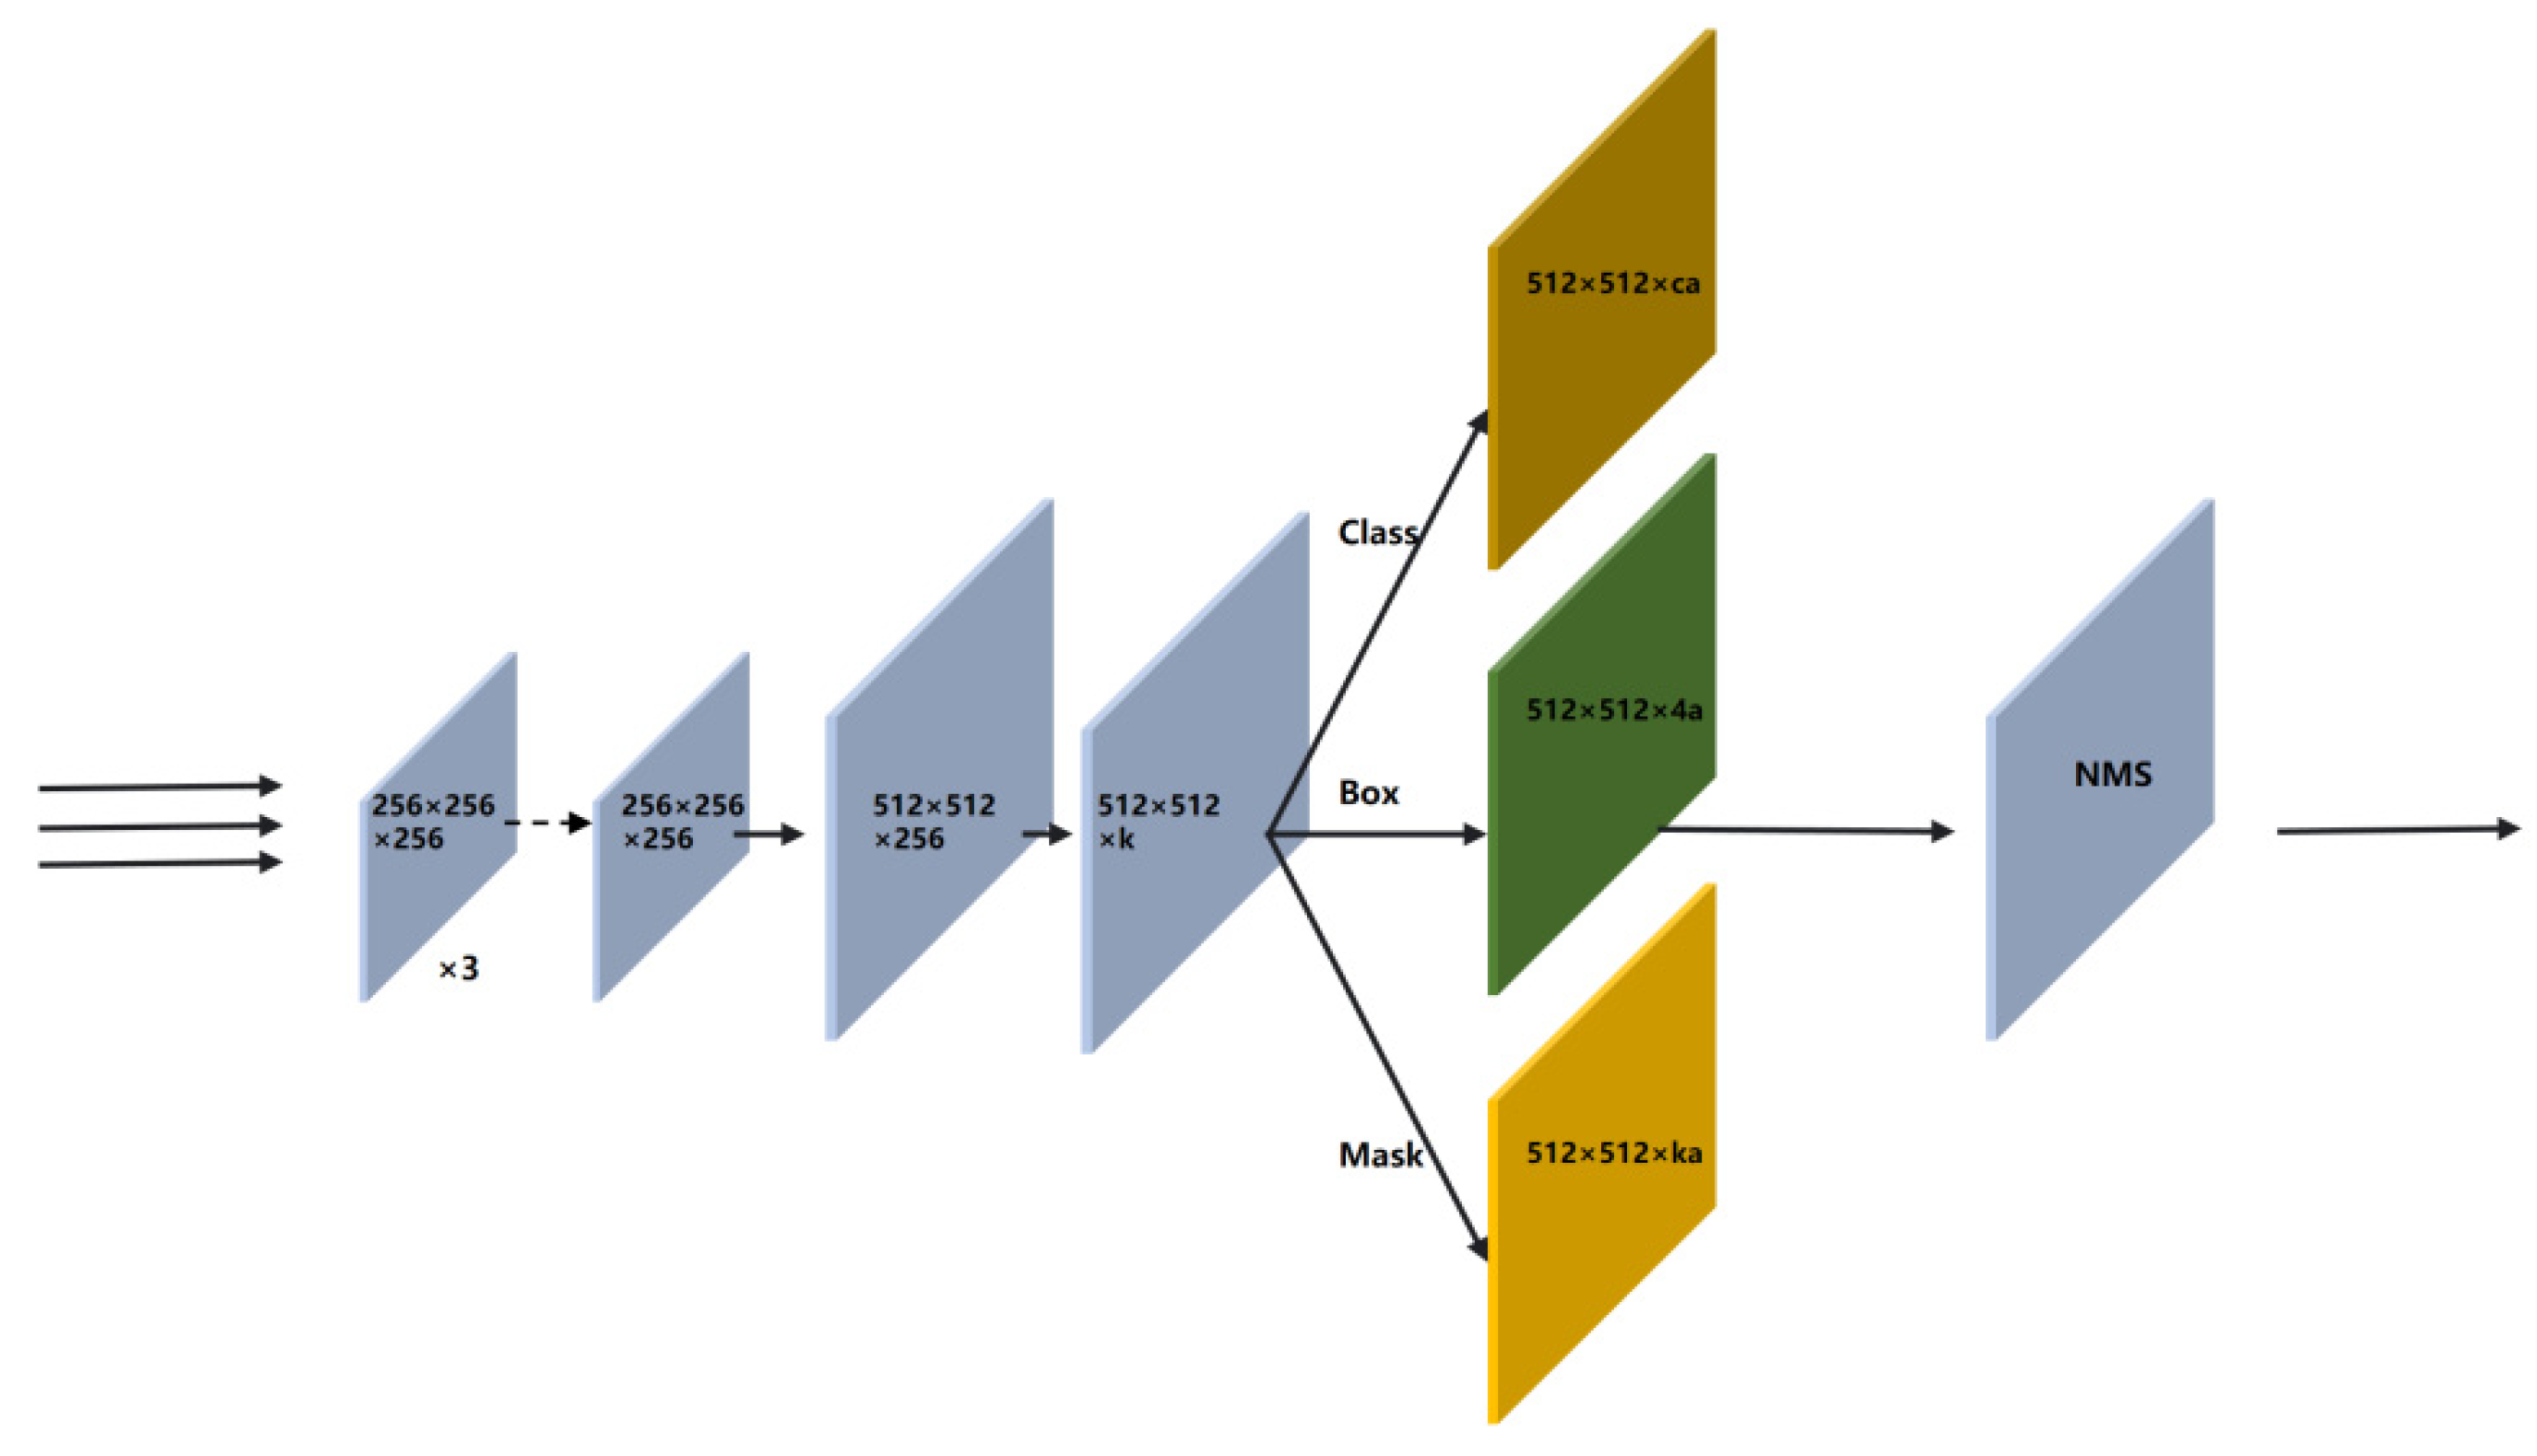
As shown in Figure 5, the proto modules are used to add an instance segmentation detection head, replacing the original object detection head. The initial YOLOv5 output consists of the class number a and the corresponding anchor box matrix, on top of which we add a segmentation result of [512, 512, k]. The Proto module, based on FCN implementation, outputs k mask masks. The Proto module likes a semantic segmentation model, differing in that it does not set a separate loss value but adds a new mask loss at the end of the entire network.

Figure 5.
Structure of proto segmentation head.
In terms of loss function, in addition to the original classification loss and bounding box loss, a mask loss is added to measure the distance between the validation mask and the real mask of the labels. The mask loss function Lmask is defined as follows:
where i is the serial number of the pixel of the bearing image. N is the product of the length and width of the bearing image. xi is the classification of the ith point predicted by the segmentation head, and yi is the label classification of the ith point.
In the placement of the proto module, the deepest backbone network is selected to obtain the feature information so as to generate the most accurate mask. Although the segmentation accuracy of insulator defects is related to the pixels of the image, considering the need for real-time segmentation, the calculation amount is reduced by upsampling the size of defects to 0.25. Use the Equation (7) to process the output of two branches through matrix operation and sigmoid function.
3. Experiments
3.1. Dataset Collection
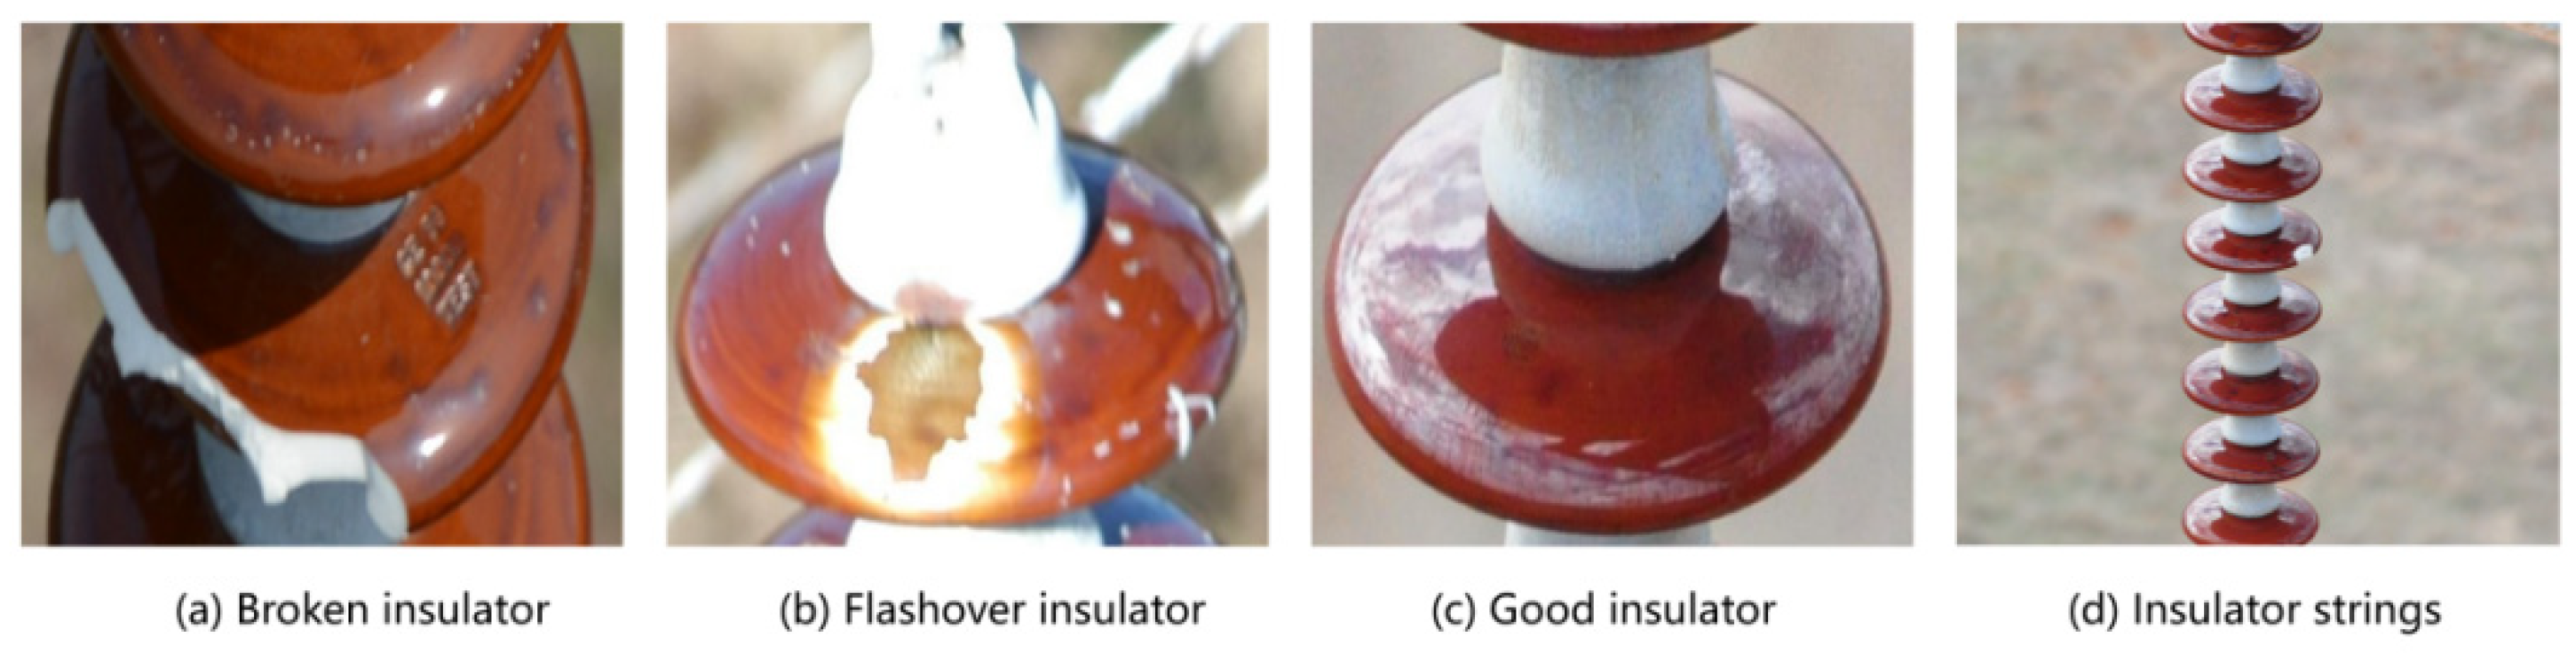
To evaluate the effectiveness of the proposed HST-Net model in the detection of insulator surface defects, we collected a dataset comprising images from four distinct types of defects, namely: (1) flashover damage to insulator shells, (2) insulator shell break, (3) good insulator shell, and (4) insulator string. The images were captured using an industrial-grade array camera, the MV-CE200-10GM model, within the Songshan Substation, Zhengzhou City, China. Initially, our collection comprised 1600 original images. Then, we enhanced this dataset to a total of 12,500 images by data enhancement. This expanded dataset was then meticulously segregated into training and validation sets, maintaining a ratio of 2:1.
When capturing images, careful consideration was given to the realistic scenarios of insulator operation on actual industrial lines, striving to include various temporal periods, light angles, shooting distances, and interference damage. This thorough approach ensured the images chosen were representative of the broad range of possible scenarios, thereby boosting the robustness of the dataset. Figure 6 illustrates the variety of insulator surface defects captured in our study.

Figure 6.
Types of datasets.
3.2. Data Enhancement
In this study, given the finite quantity of defective insulators, we have endeavored to expand the initial data set acquired. To mitigate the phenomenon of overfitting within the training network and enhance the generalization capabilities of the resulting model, an assortment of data augmentation strategies has been employed, such as random cropping, horizontal and vertical flipping, and local magnification. Moreover, we have incorporated two additional techniques into our data augmentation process: Mosaic and Mixup. The Mosaic technique enriches and diversifies the presentation of images by combining portions of multiple training images, while the Mixup method escalates the variety of data by executing linear interpolations of images within the feature space. As a result of these applied data augmentation strategies, the enriched data set is demonstrated in Figure 7.
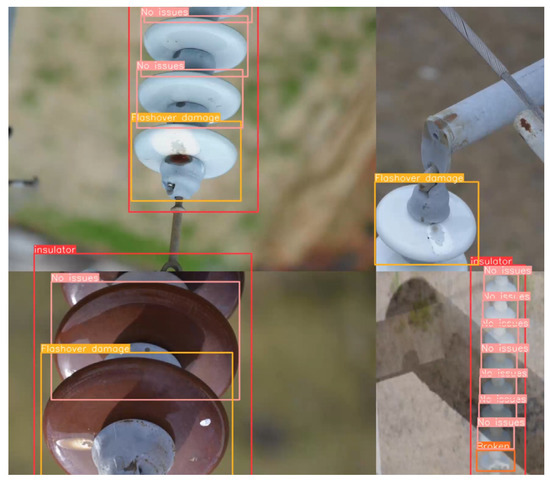
Figure 7.
Data set after data enhancement.
In order to better restore the real working environment and improve the robustness of the algorithm and the adaptability to the complex environment, salt and pepper noise, Gaussian noise and Poisson noise are added to the expanded data set. Due to the diversity of noise sources under real working conditions, this paper sets the additive sum of random variables with different probability distributions for the above three types of noise, and the insulator images with various types of noise are shown in Figure 8.
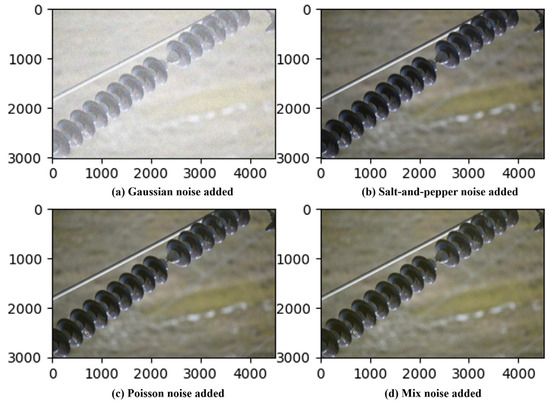
Figure 8.
Preprocessing for adding various types of noise.
3.3. Training Environment and Evaluation Indicators
The training process of the proposed model runs under the Windows 10 operating system and PyTorch framework. The software environment for the experiment is CUDA11.1, CUDNN8.0.4 and Python 3.7. The hardware condition of the experiment is to have a CPU of Intel Core i9-13900 K with a basic frequency of 3.0 GHz, equipped with 32 Gb RAM, and the GPU is NVIDIA GeForce RTX 4090 24 Gb. The initial parameters of the experimental device are shown in Table 2.
Table 2.
Initial training parameters.
In order to measure the performance improvement of the improved algorithm compared with the original algorithm, several evaluation indicators are as follows.
Recall rate (R) is the ratio of the predicted correct target among all of the targets marked as correct. The mathematical calculation expression is as follows:
where TP in the above two formulas represents the number of positive examples of correct prediction, FP represents the number of negative examples of wrong prediction, FN represents the number of positive examples of wrong prediction, and TN represents the number of negative examples of correct prediction.
Average precision (AP) is an important indicator to measure the advantages and disadvantages of the trained network model in a single category. Its mathematical calculation expression is as follows:
The mean average precision (mAP) is an important indicator to measure the average quality of the trained network model in each category. mAP is the average value of AP in all categories. Its mathematical calculation expression is as follows:
Intersection-over-union (IoU) refers to the ratio of the area of the intersection part of the prediction box and the real box to the area of the union part of the prediction box and the real box. The mathematical calculation expression of IoU is as follows:
Frames per second (FPS) refers to the measure of how quickly an imaging device, such as a computer, TV, or video game console, can produce unique consecutive images called frames. High FPS often results in smoother and more realistic motion. The mathematical calculation expression of FPS is as follows:
where T represents the time taken to detect a frame.
Confidence (Conf) in object detection is a metric that indicates the degree of belief in the existence and class of an object in a bounding box predicted by the model. The confidence is calculated using the following formula:
where represents a parameter known as the label smoothing coefficient, which helps to reduce overfitting. Complete Intersection over Union (CIoU) is the Complete Intersection over Union score between the predicted bounding box and the ground truth box. When equals 1, the confidence score is equal to the CIoU score. The mathematical calculation of CIoU is as follows:
In this equation, represents the intersection over the union of the predicted bounding box ) and the ground truth bounding box (). is the square of the Euclidean distance between the centers of b and . c is the diagonal length of the smallest enclosing box containing both and . v is a measure of the difference in aspect ratio between b and . v is calculated as follows:
where and represent the width and height of the ground truth bounding box. and h represent the width and height of the predicted bounding box.
We define the inspection workload completed per unit time as efficiency, and the inspection efficiency for insulator defects is defined as:
where is the camera frame frequency. is the algorithm processing speed which together with f dictates the effective rate, m is the number of visible insulators per frame, v(t) is the speed at time t, and T is the total patrol time. Efficiency measures help to evaluate the performance and speed of insulator inspection.
These metrics allow one to more accurately and comprehensively evaluate the performance of the object detection model.
3.4. Sensitivity Analysis
In this experiment, Transformer-CSP modules with different positions and numbers are selected to replace C3 modules. The Transformer-CSP module placed at the front mainly affects small objects, while the Transformer-CSP module placed at the end of the trunk will mainly affect large objects, so many smaller objects may not be significantly affected by changes. The results of training 200 epochs by replacing different numbers of Transformer-CSP modules are shown in Table 3:
Table 3.
Results of Different Modules.
Table 3 elucidates that with the progressive addition of Transformer-CSP modules, mAP displays an initial increment from 0.802 to 0.842 (i.e., a relative enhancement of 5%). However, when more than one Transformer-CSP module is added, the mAP exhibits an inconsistent trend and even slightly declines, implying that further augmentation with additional Transformer-CSP modules does not necessarily translate into improved mAP. With the initial augmentation of one Transformer-CSP module, the R value notably escalates from 0.786 to 0.818. But, akin to the mAP behavior, R fails to consistently improve with further module addition, instead displaying a mild depreciation. This evidence again underscores the pivotal role of a singular Transformer-CSP module, suggesting that it serves as the primary force driving the performance elevation of the network.
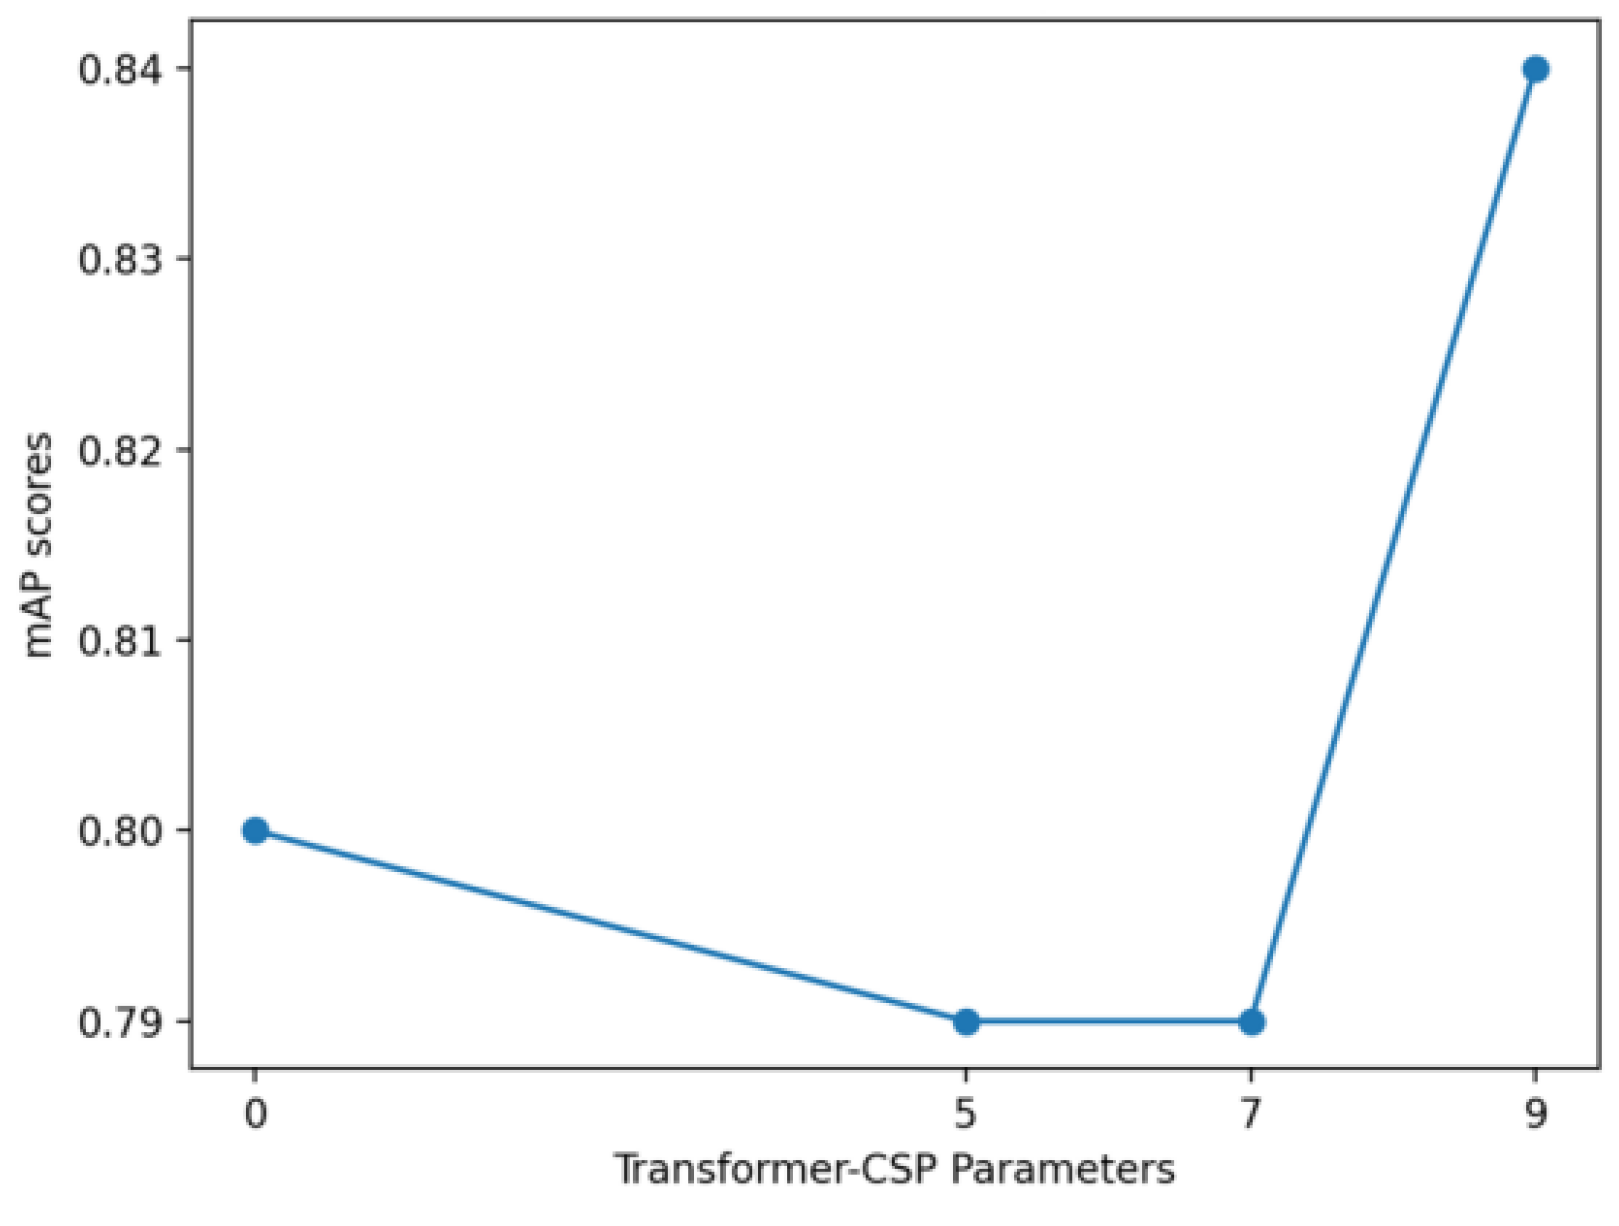
Considering that there are three corresponding C3 modules for detection in the backbone network, in order to maximize the performance of the Transformer-CSP module, the next set of experiments replaces each of the three C3 modules with a Transformer-CSP module at different locations. The model is then trained for 200 epochs, and the results are displayed in Figure 9.

Figure 9.
mAP of Transformer-CSP modules at different locations.
It can be seen from Figure 9 that the optimal performance boost is achieved when the Transformer-CSP module is integrated into the 9th layer of the YOLOv5 network. Through this configuration, an enhancement of 0.04 is observed in the mAP metric, achieving a precision score of 0.84. However, when the Transformer-CSP module is introduced at the 5th and 7th layers, the model’s performance remains constant or decrease slightly. This implies that the inclusion of the Transformer-CSP module at deeper levels offers significant improvements for the task of detecting minor insulator defects, impacting the entirety of the head network. Hence, we conclude that the optimal choice for improving mean precision in minor insulator defect detection is to substitute the C3 module with the Transformer-CSP module at the 9th layer of the network. This research outcome provides direction and reference for the design of less resource-intensive and trainable models.
3.5. Comparison of Training Results with Other Positioning Network Models
To better demonstrate the superior performance of the HST-Net model in the precision and recall of insulator surface defect detection in substations, five state-of-the-art algorithms are chosen for comparative analysis with the validation set, such as SSDlite-mobilenetv2 [38], YOLOv5, YOLOX [39], YOLOF [40], and SSD [41]. The experiments are run under identical environments, using the same equipment and the same image pre-processing procedures. The comparison results are shown in Table 4. It can be seen that the proposed method achieved optimal values on both indicators.
Table 4.
The detection results of each model for insulator defect.
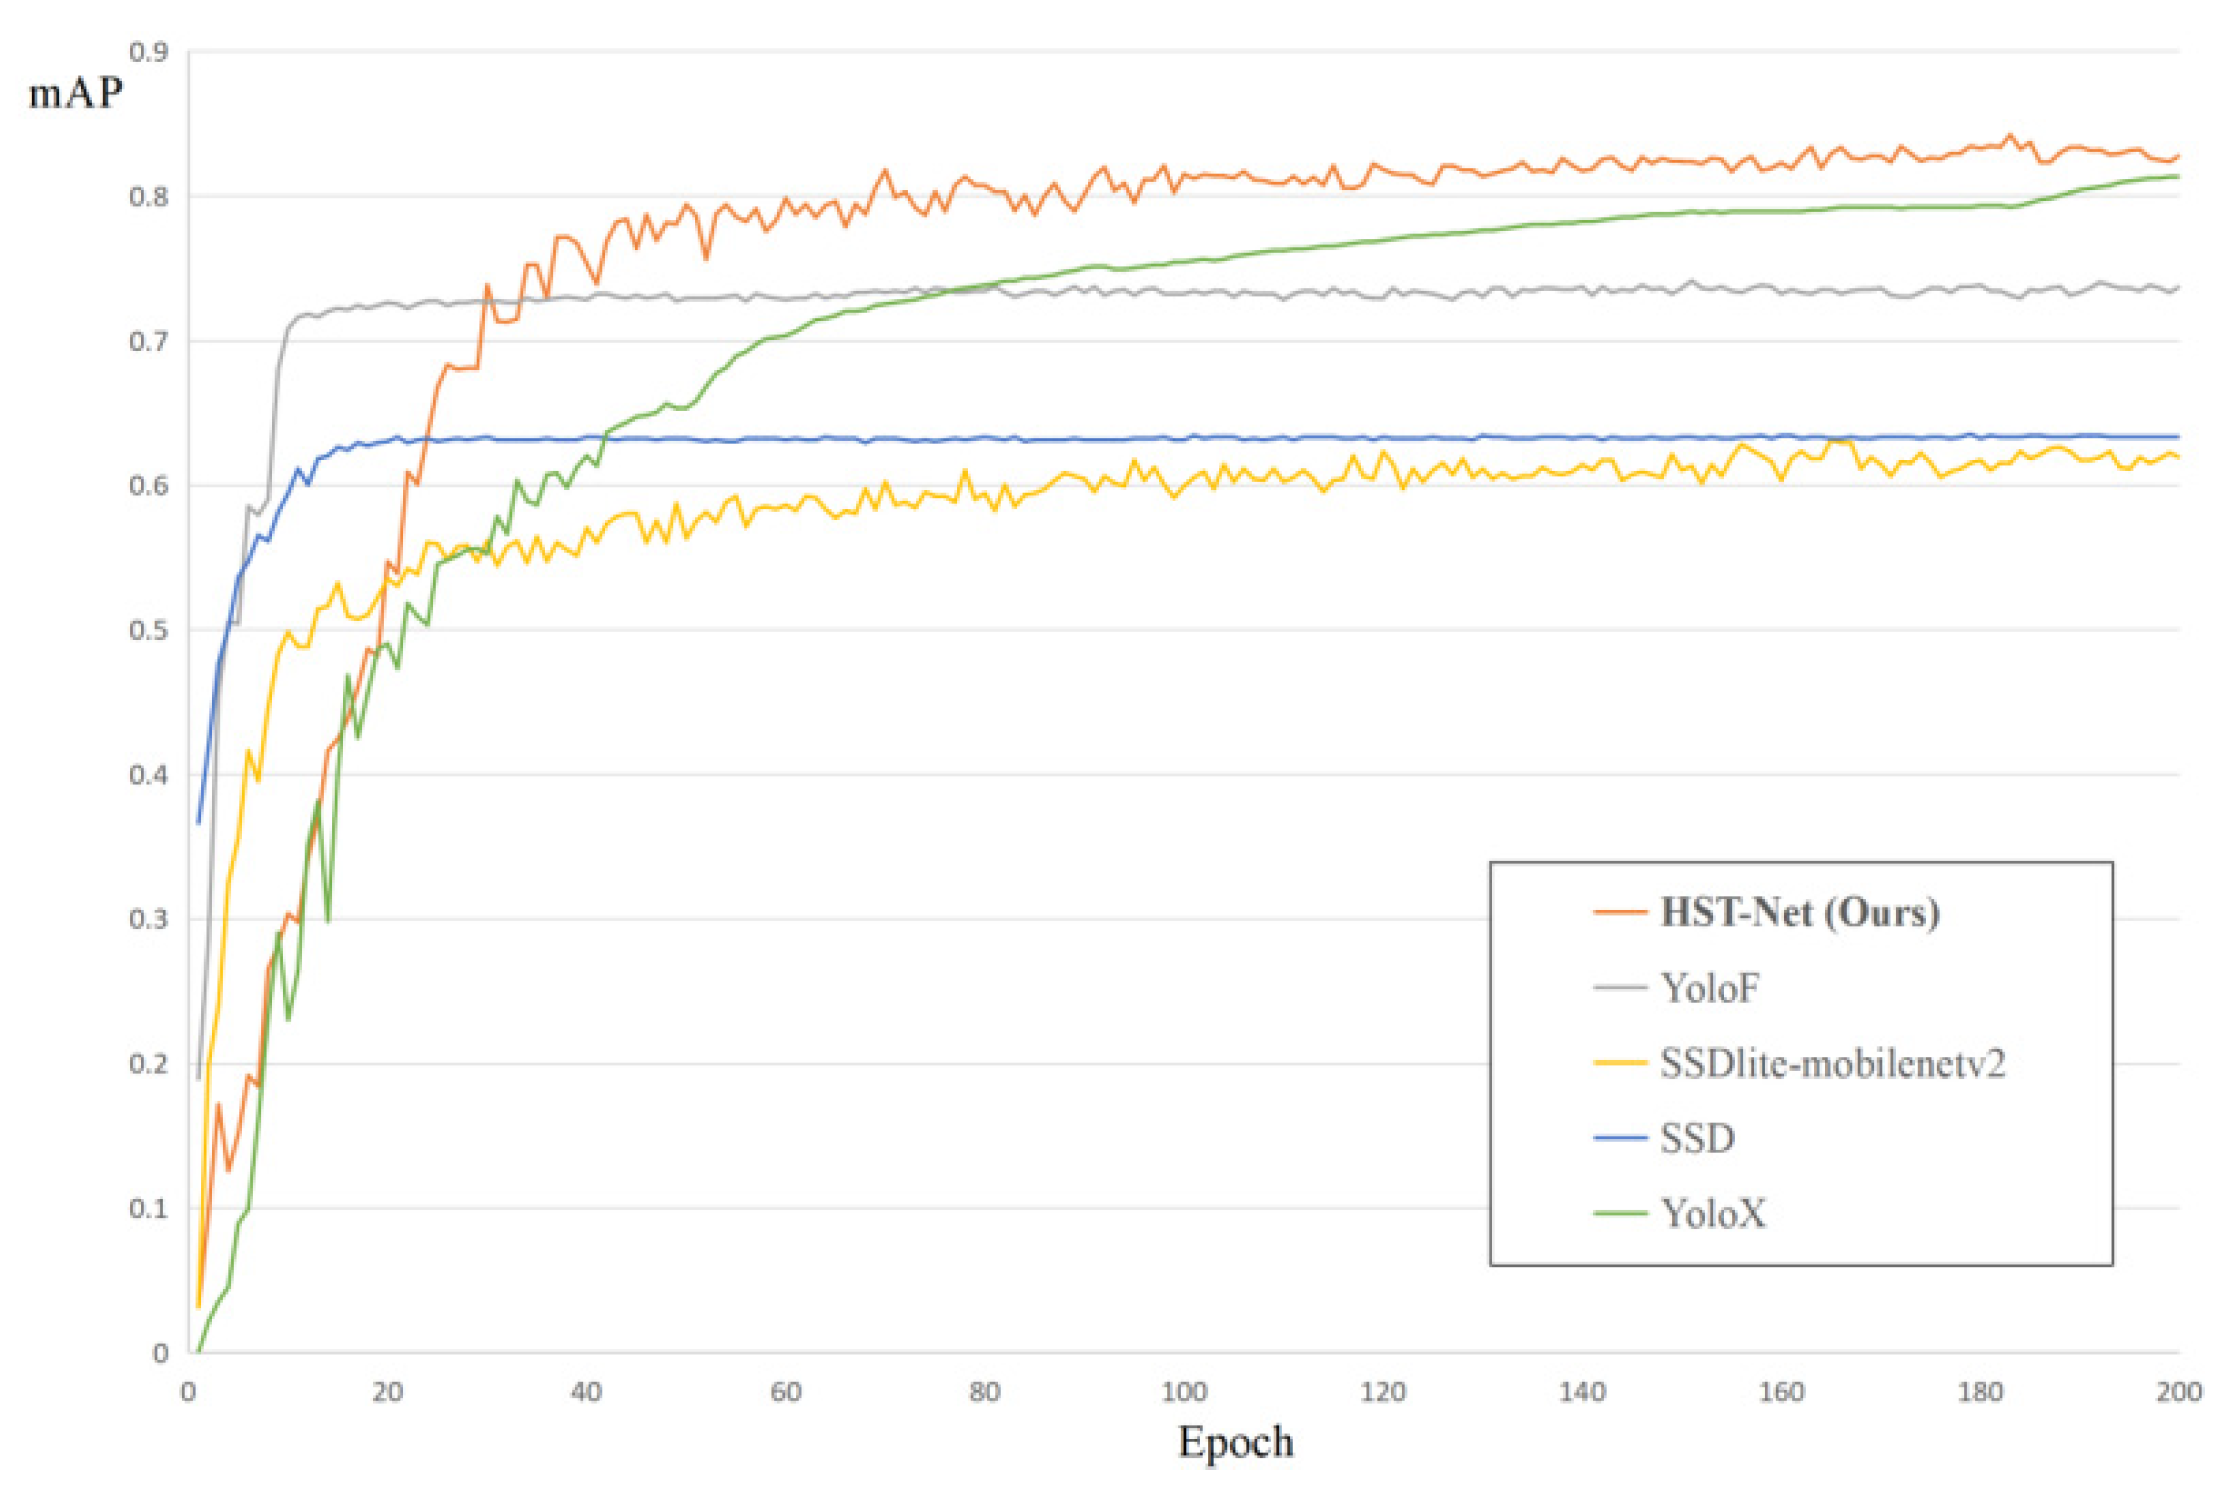
The change curve of mAP from five network models with the training rounds is plotted in Figure 10. As can be clearly observed, with the same 200 Epochs of training, the mAP outcomes on the insulator defect dataset are superior for HST-Net, YOLOF, and YOLOX as compared to SSD and SSDlite-mobilenetv2. Although in the early Epochs, the proposed HST-Net required a longer convergence time, the final mAP peak was 0.02 and 0.10 higher than YOLOX and YOLOF, respectively, attaining a score of 0.84201. SSD and SSDlite-mobilenetv2 scored mAP values of 0.635 and 0.630 respectively, reflecting subpar precision. It further substantiates the effectiveness of our proposed HST-Net model in detecting insulator defect regions. The comparative prediction outcomes are shown in Figure 11.
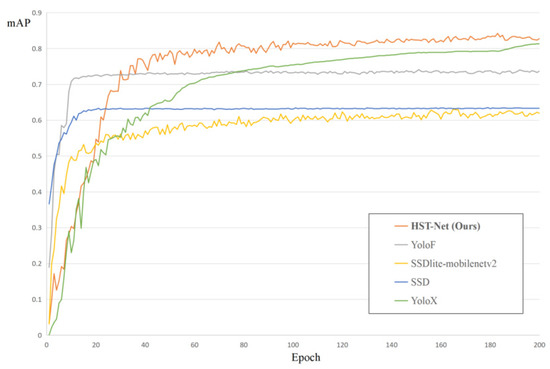
Figure 10.
Comparison of training results with other network models.
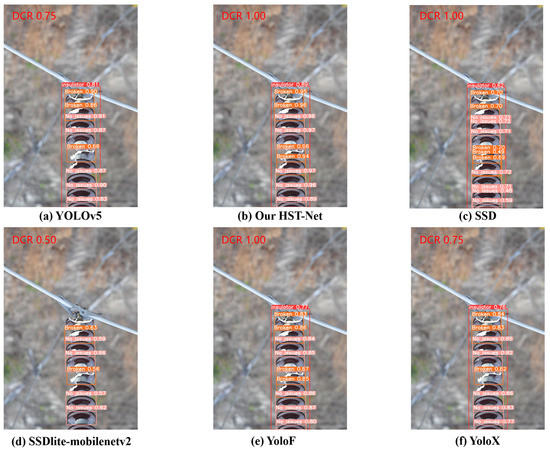
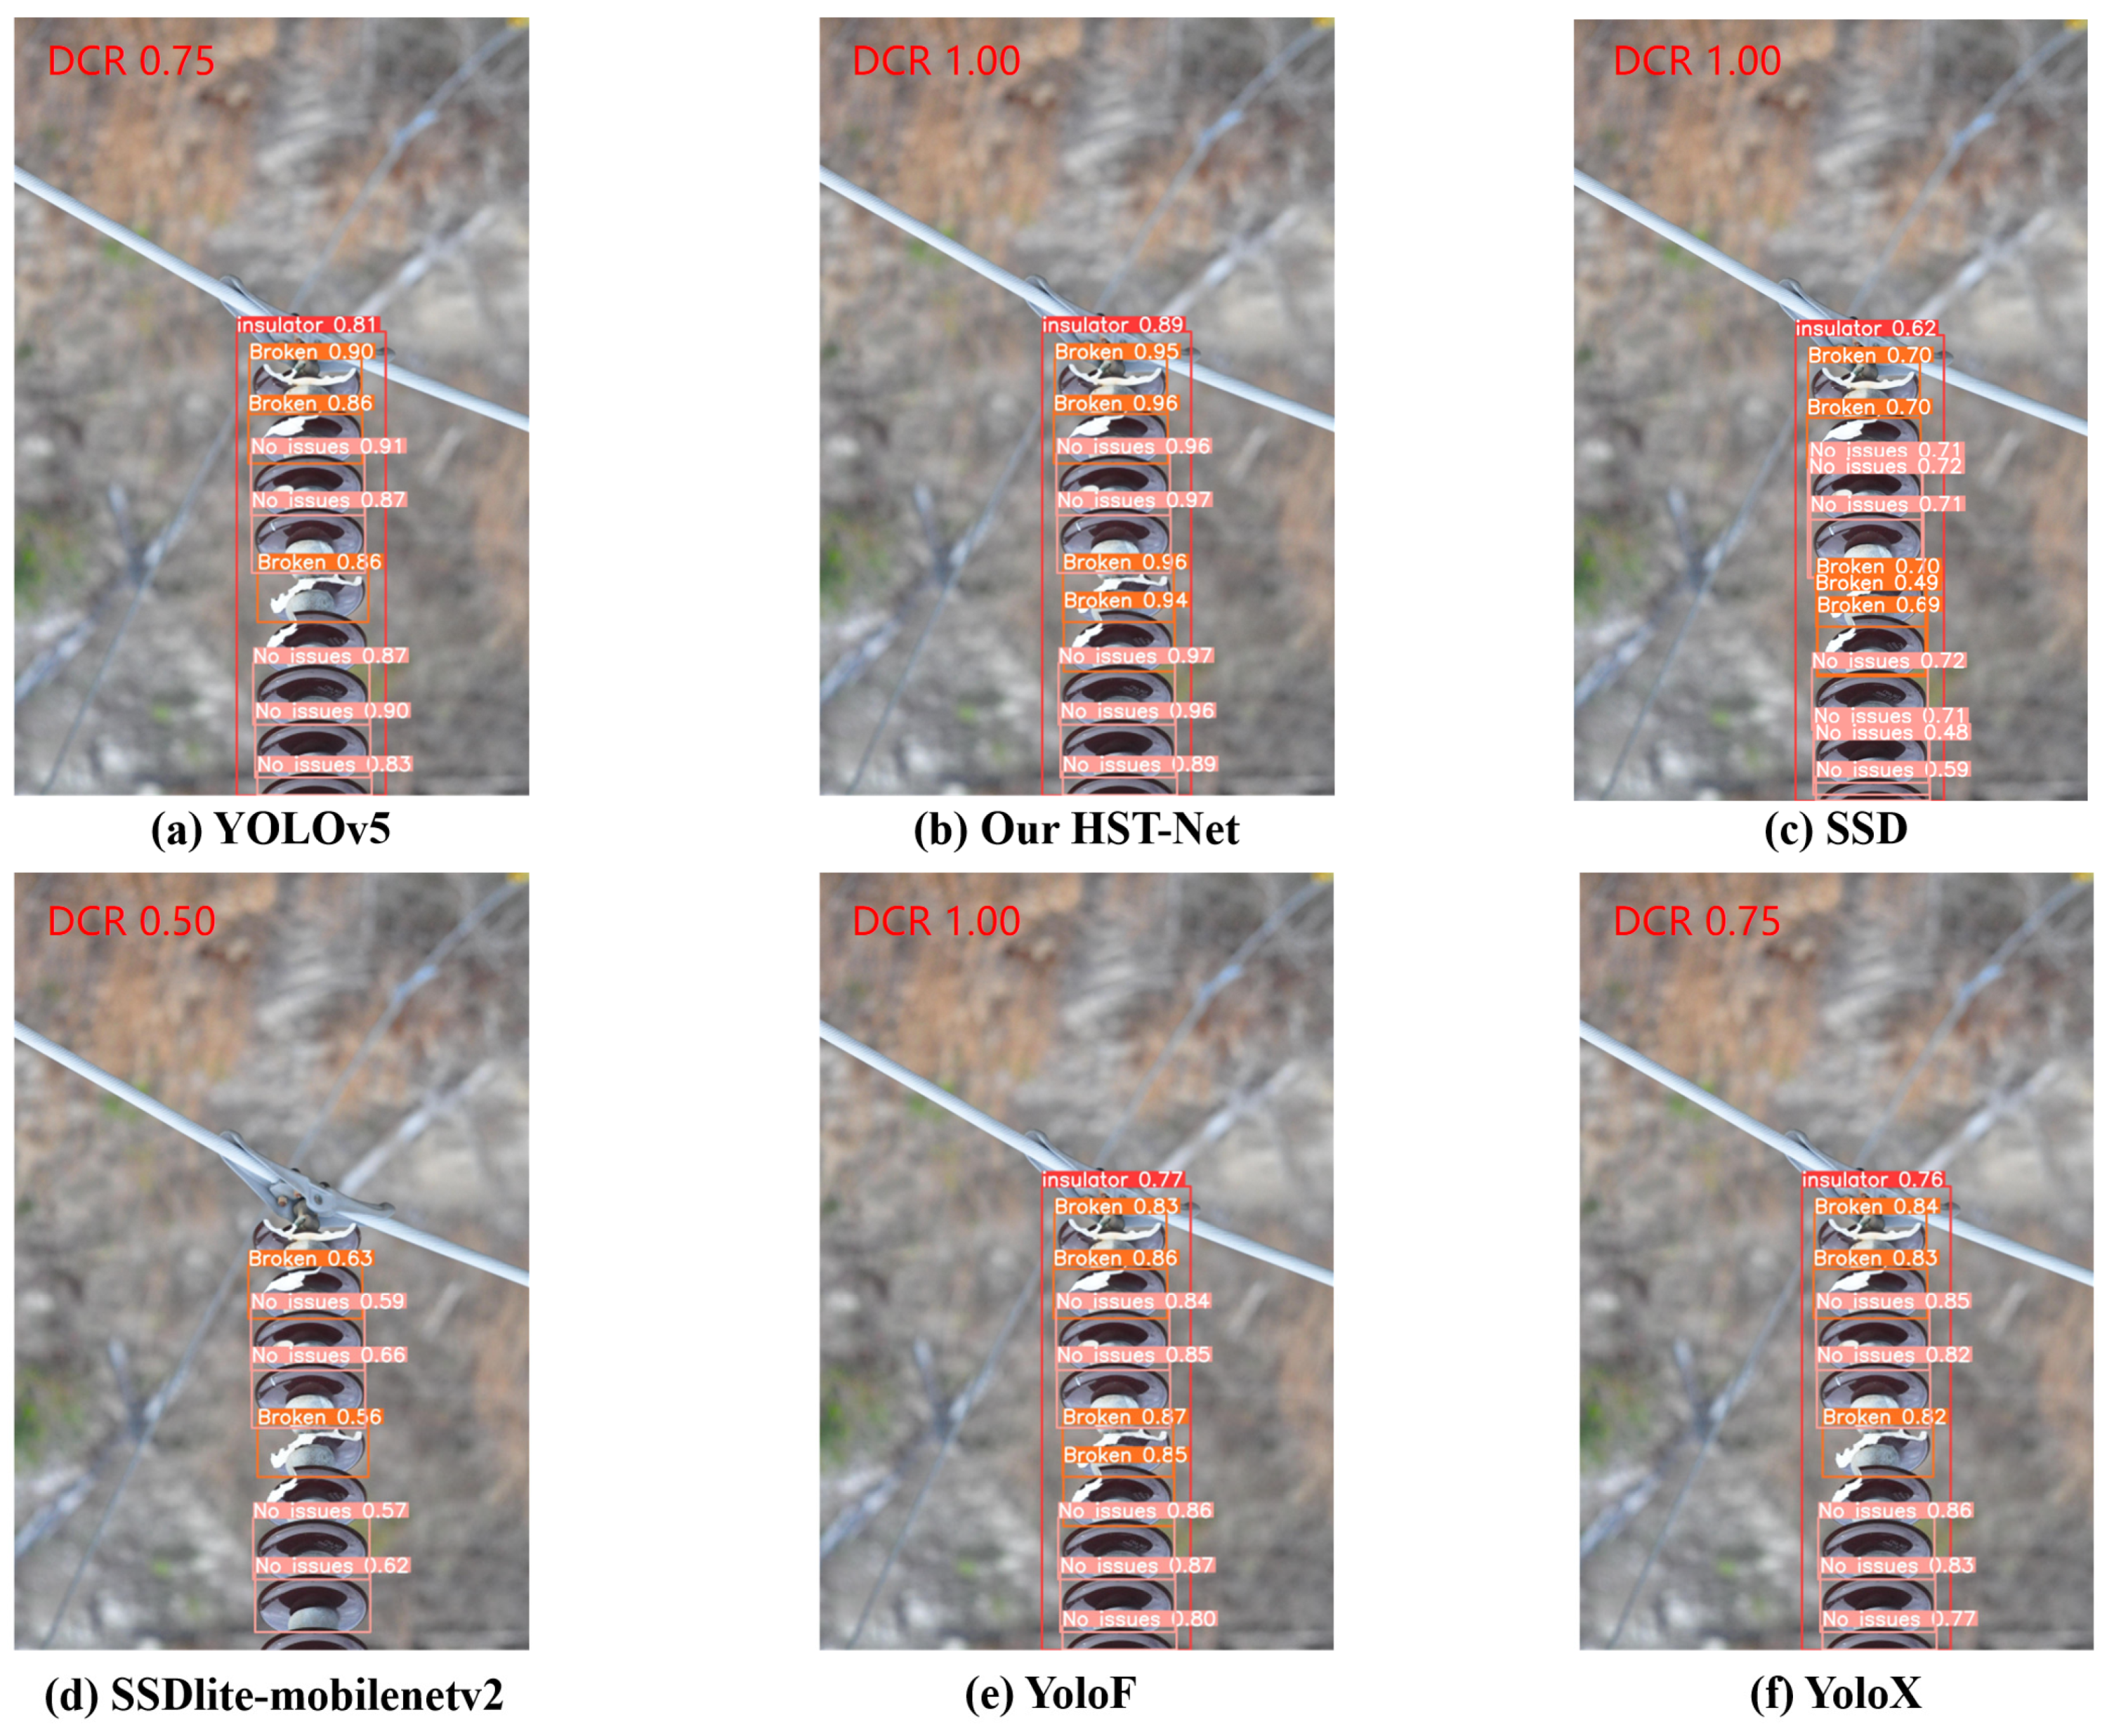
Figure 11.
Detection results of different algorithms.
In assessing the effectiveness of model detection, we gauge the precision of the model by its confidence score and measure its completeness through the defect classification recall (DCR). DCR refers to the recall of insulator defects. As depicted in Figure 11, the proposed HST-Net attains the highest confidence score and a 100% DCR in the test images, thus delivering the most efficient detection results. Notably, the SSDlite-mobilenetv2 model, as illustrated in Figure 11d, overlooks two instances of surface damage and one normal insulator, rendering it the least effective model with a mere 50% DCR. Furthermore, SSD, portrayed in Figure 11c, exhibits numerous instances of redundant detection, resulting in a lower confidence score. Meanwhile, YOLOX suffers from defect omissions, and YOLOF shows a lower confidence score. In conclusion, the enhanced HST-Net demonstrats the most adept detection performance in the test images.
Based on the analysis, the HST-Net defect detection model exhibits a fast speed, boasting high detection precision. This ensures a balance between precision and speed, making it suitable for deployment in unmanned aerial vehicle (UAV) inspections of insulator surface defects in substations. The scalability of this model could facilitate an improvement in the efficiency and efficacy of defect detection in substations across various scales of operation.
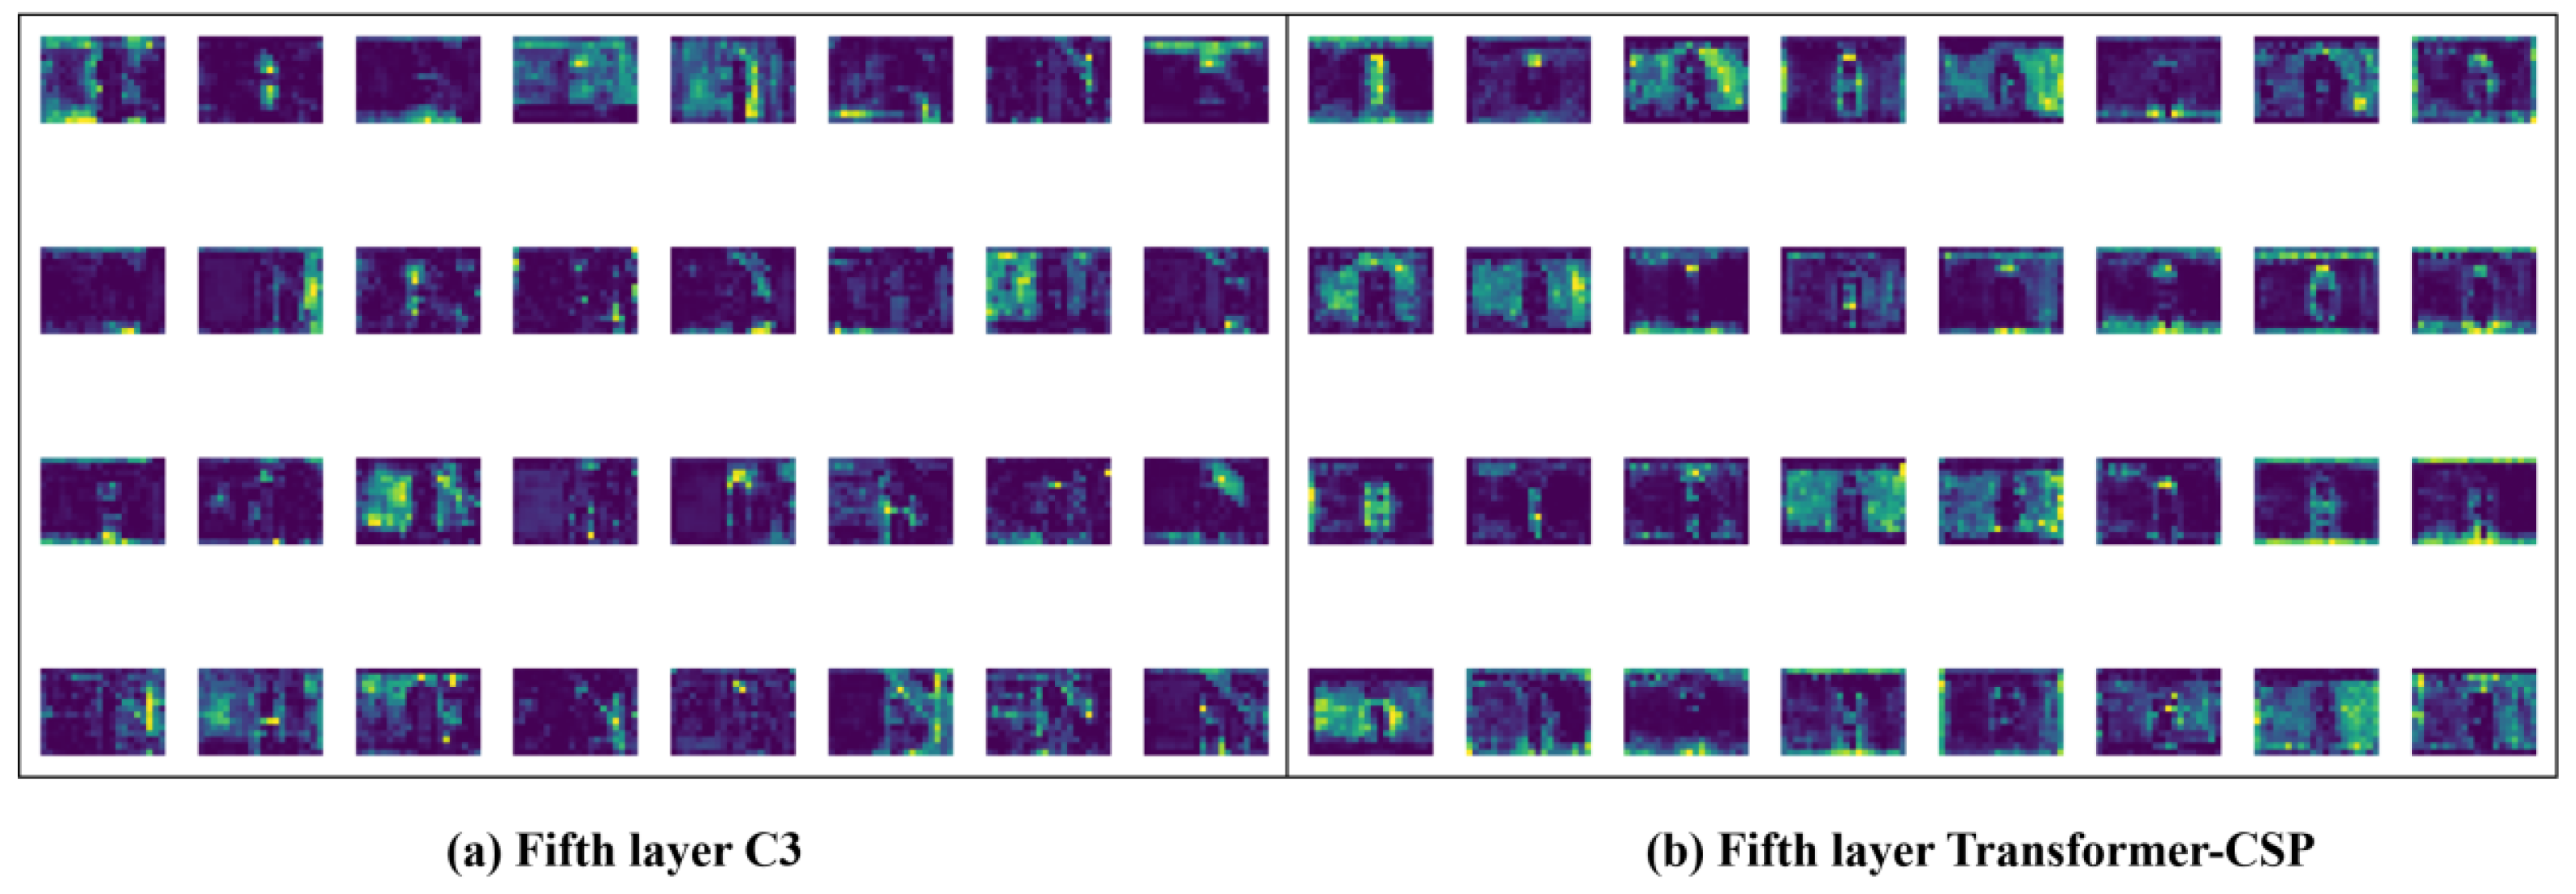
3.6. Visual Analysis of Transformer-CSP Layer Feature Map
In this section, the fifth layer of the backbone network is visualized as shown in Figure 12. Figure 12a is the feature map visualization results of the C3 module of the original YOLOv5, and Figure 12b is the feature map visualization results of the improved Transformer-CSP module of the YOLOv5. It is not difficult to find that the feature images extracted by the Transformer-CSP module are sparser and have more semantic information for the neck network to screen the extracted features. However, the feature images extracted by the original C3 module do not have much geometric information, which is not conducive to target detection. Although some images contain more geometric information, the semantic features of the image are not much, which is not conducive to image classification. The proposed Transformer-CSP module pays more attention to extracting the effective features of the prior box and inhibiting the irrelevant or invalid features.
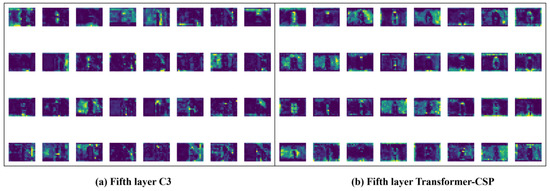
Figure 12.
Comparison of feature map visualization between C3 and Transformer-CSP.
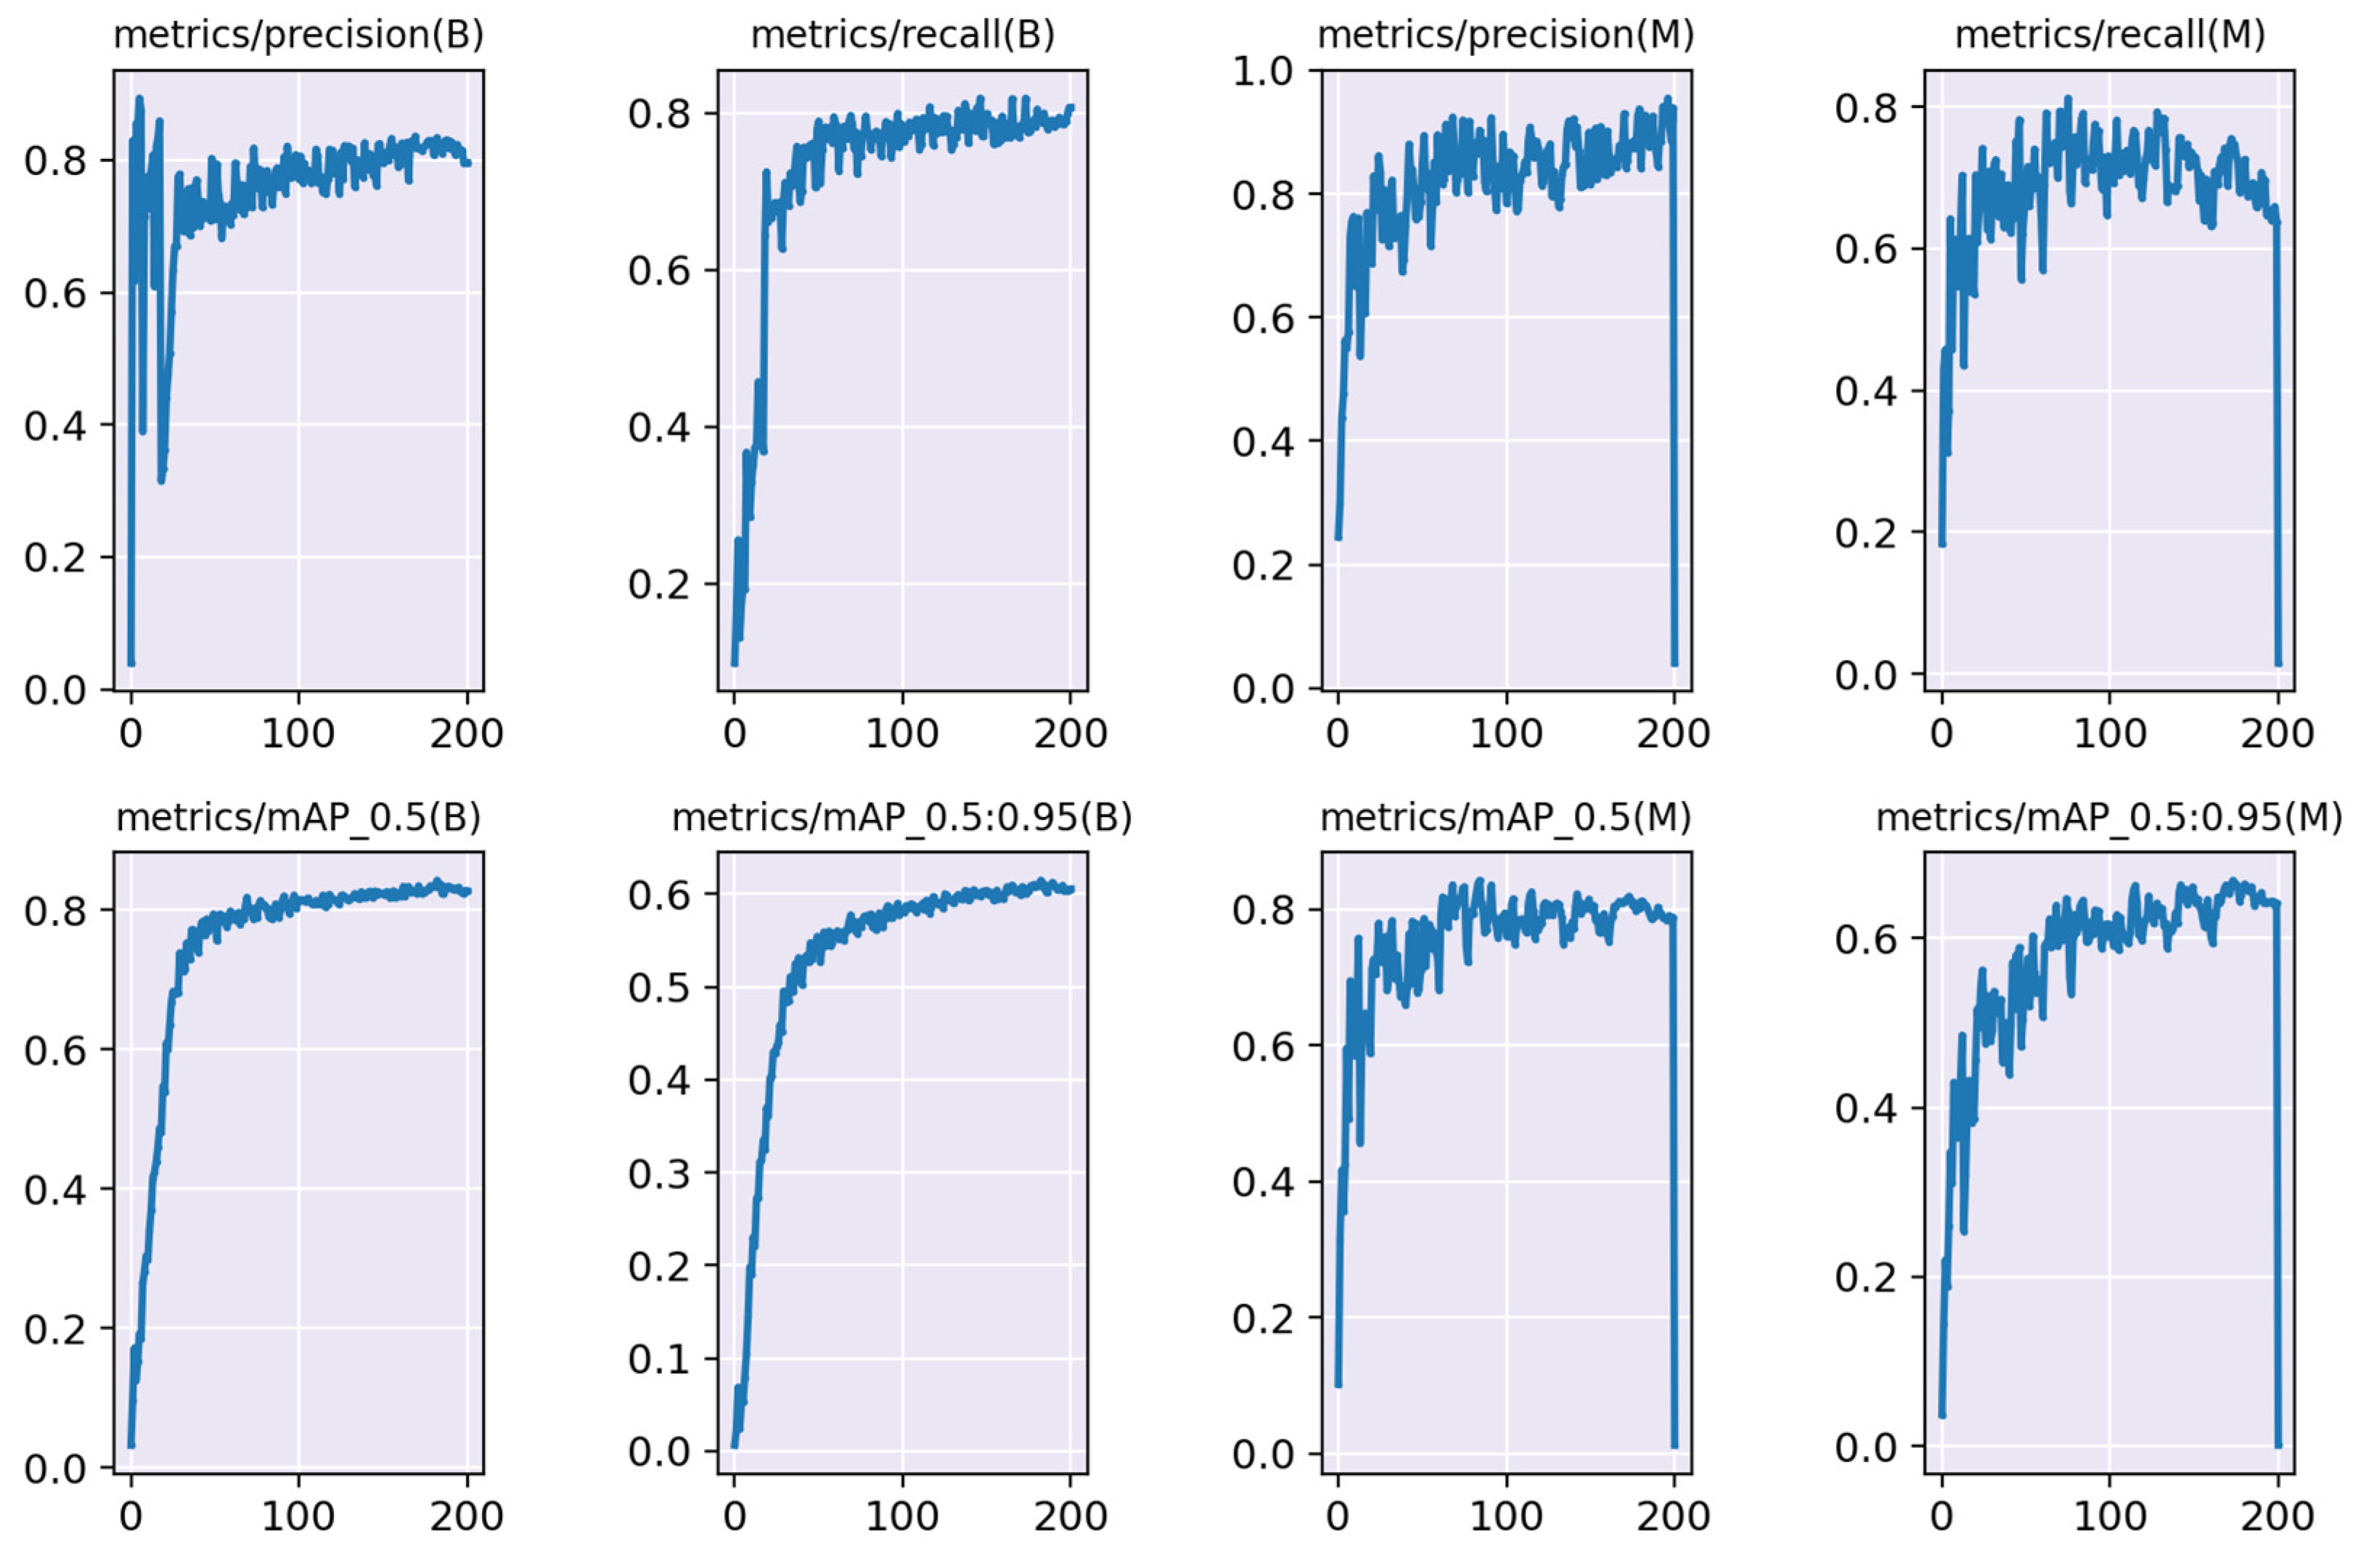
3.7. Experimental Results of Insulator Defect Segmentation
The results from the training of the HST-Net on the insulator defect segmentation dataset are depicted in Figure 13. The model displays a quick convergence rate, reaching a plateau within the first 200 epochs, at which point the training is halted to prevent overfitting. The maximum mAP score on the insulator defect validation set reached 0.84, with a recall rate of 0.81.

Figure 13.
Defect segmentation training results.
Table 5 presents a comparison among four segmentation models: HST-Net, Unet, OCRnet, and U-Segnet-p. Notably, HST-Net operates with an impressive speed of 83.33 FPS and a smaller model size of 93.245 M. It outpaces Unet, OCRnet, and U-Segnet-p, which run at 51.02 FPS, 4.22 FPS, and 54.81 FPS, and have larger model sizes of 221.857 M, 275.573 M, and 113.986 M, respectively. Moreover, HST-Net achieves a commendable AP of 0.82 and a higher mIoU of 0.89. Additionally, it registers a significantly higher Efficiency score of 1100.0. In contrast, Unet, OCRnet, and U-Segnet-p attain lower AP and mIoU scores, as well as lesser Efficiency scores. It is evident that our HST-Net considerably outperforms the other models, underlining its superior performance in environments such as substations where stringent real-time requirements are necessary.
Table 5.
Comparison results of four segmentation models.
Additionally, the HST-Net is designed with a remarkable consideration for model size. Despite being compact and amenable to edge computing platforms, where processing is often conducted via embedded processors, it maintains a model size within the 100 MB range. This allows for more effortless deployment and better utilization of computational resources, offering a strategic advantage in constrained environments. Besides, the HST-Net does not compromise on precision. With an AP score surpassing 0.82 and a mIoU of 0.89, it demonstrates a superior level of segmentation accuracy. This feature, combined with its compact size and high speed, validates the HST-Net as a highly efficient, precise, and resource-friendly solution for insulator defect segmentation.
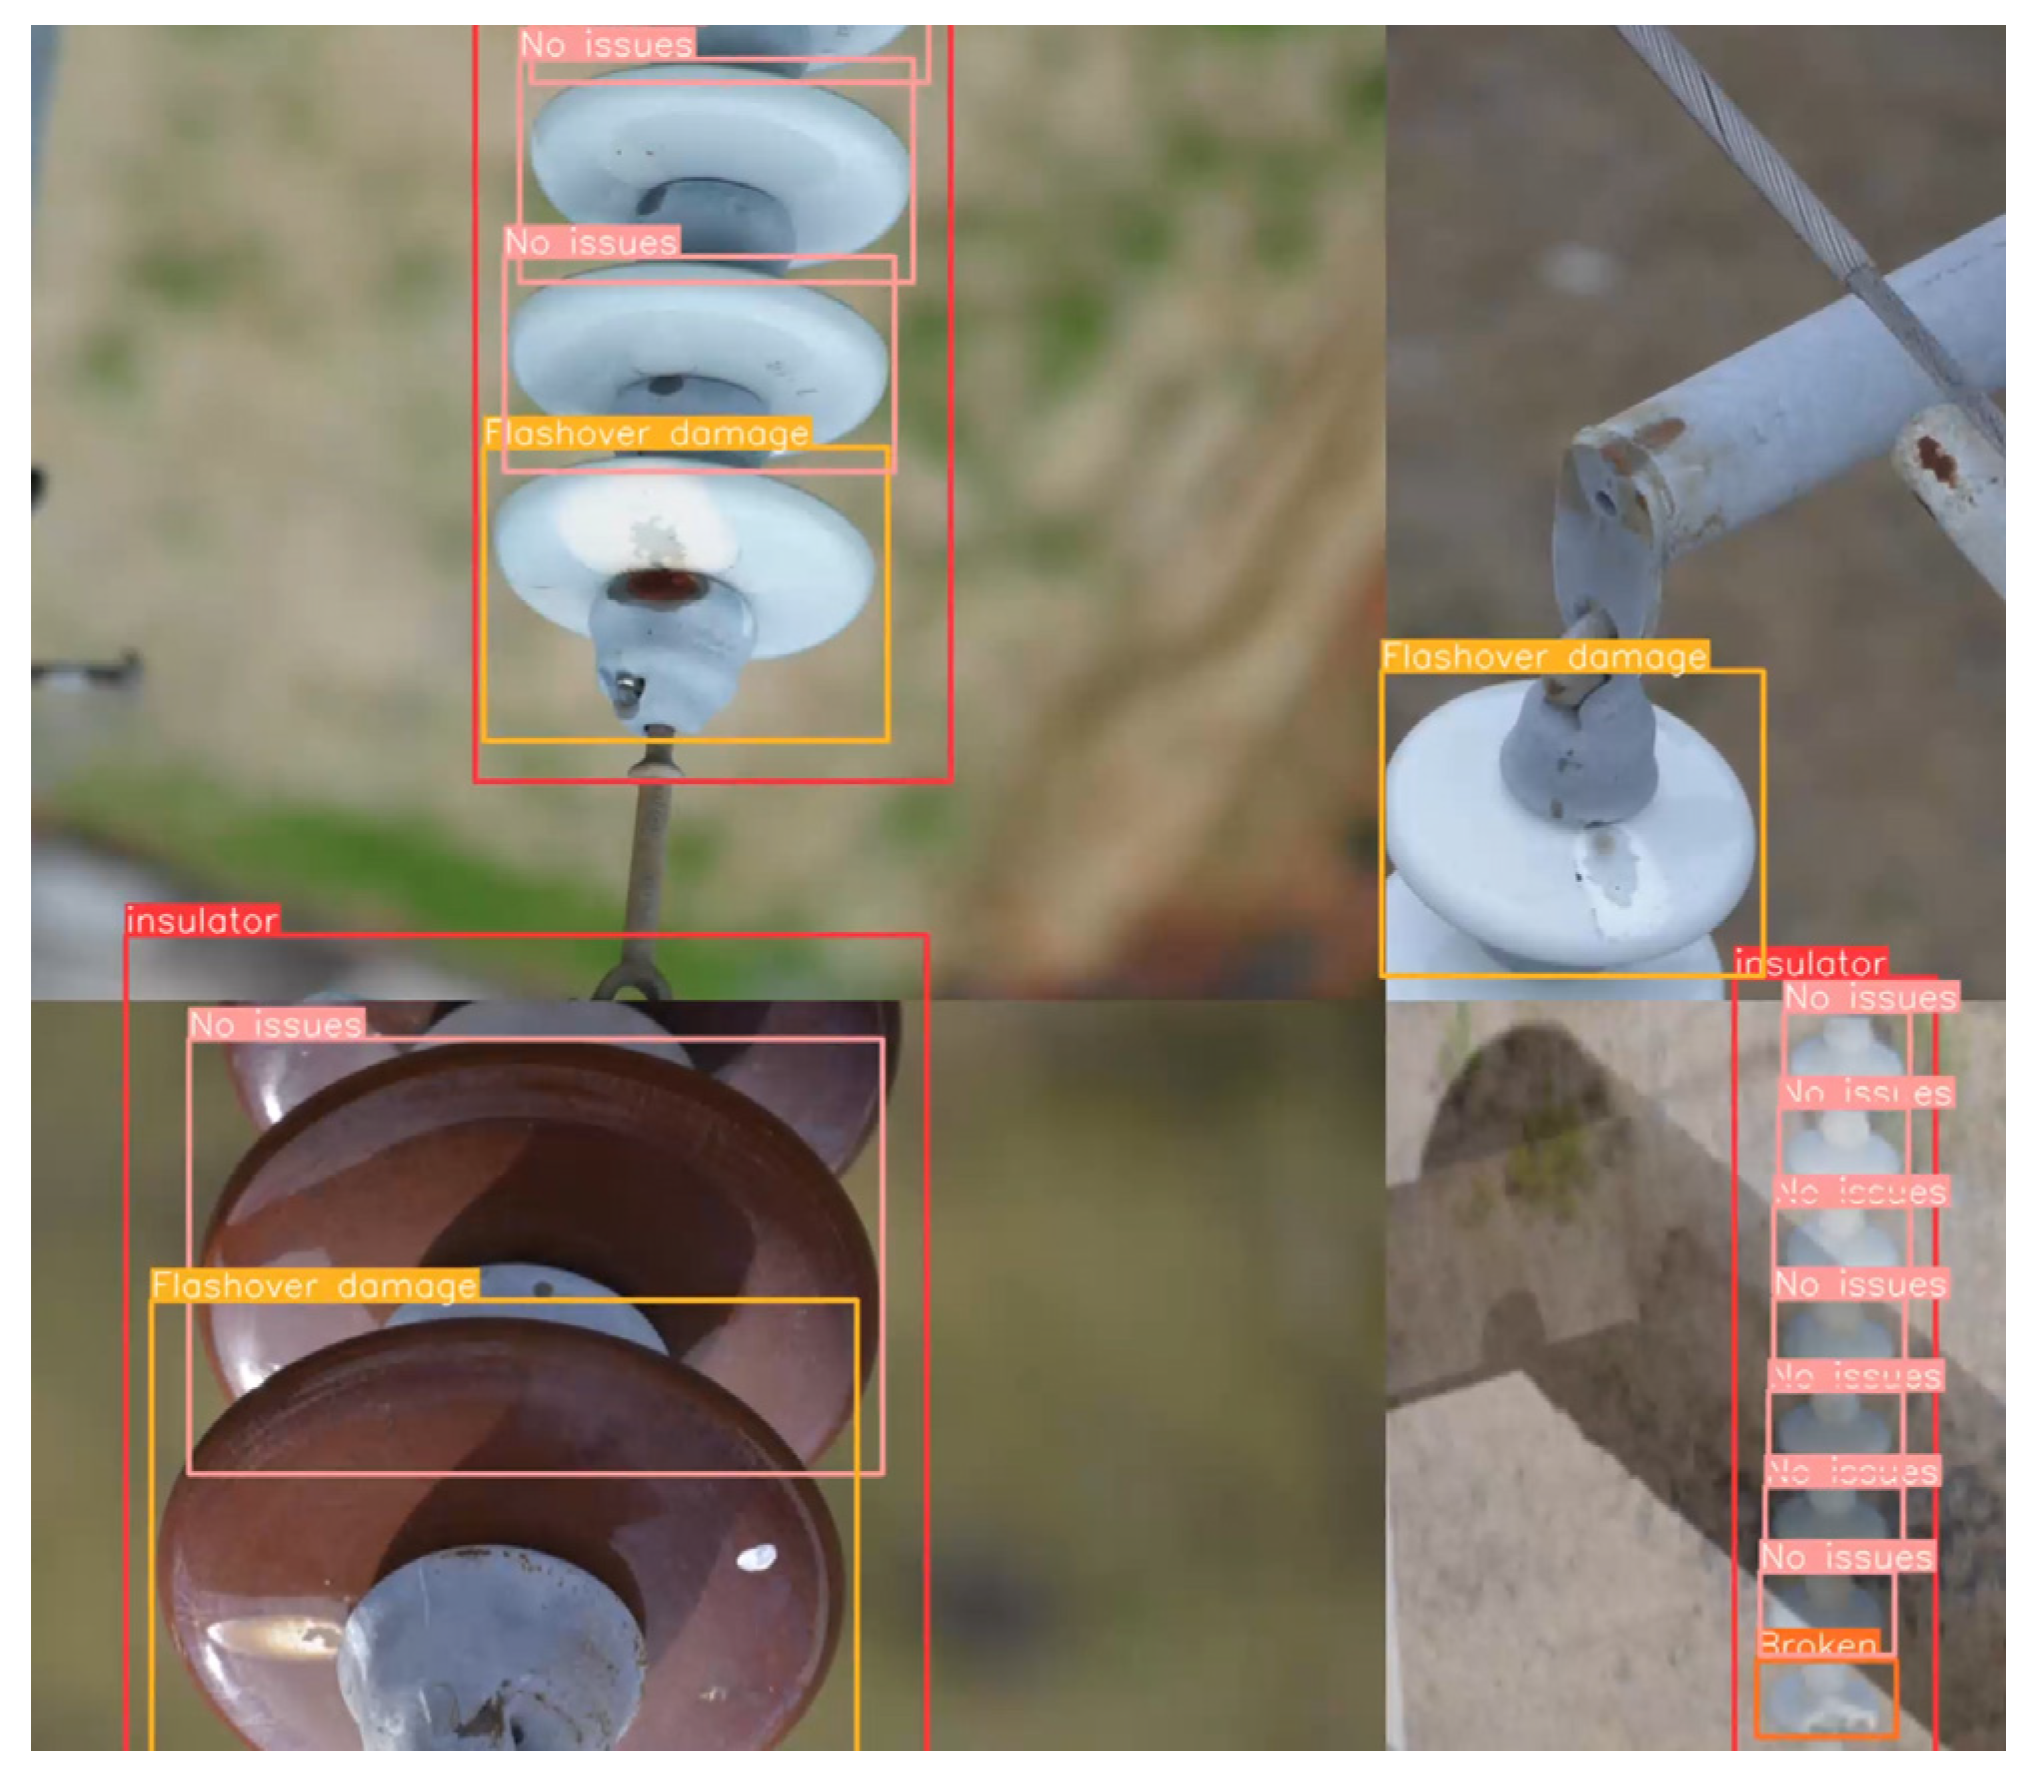
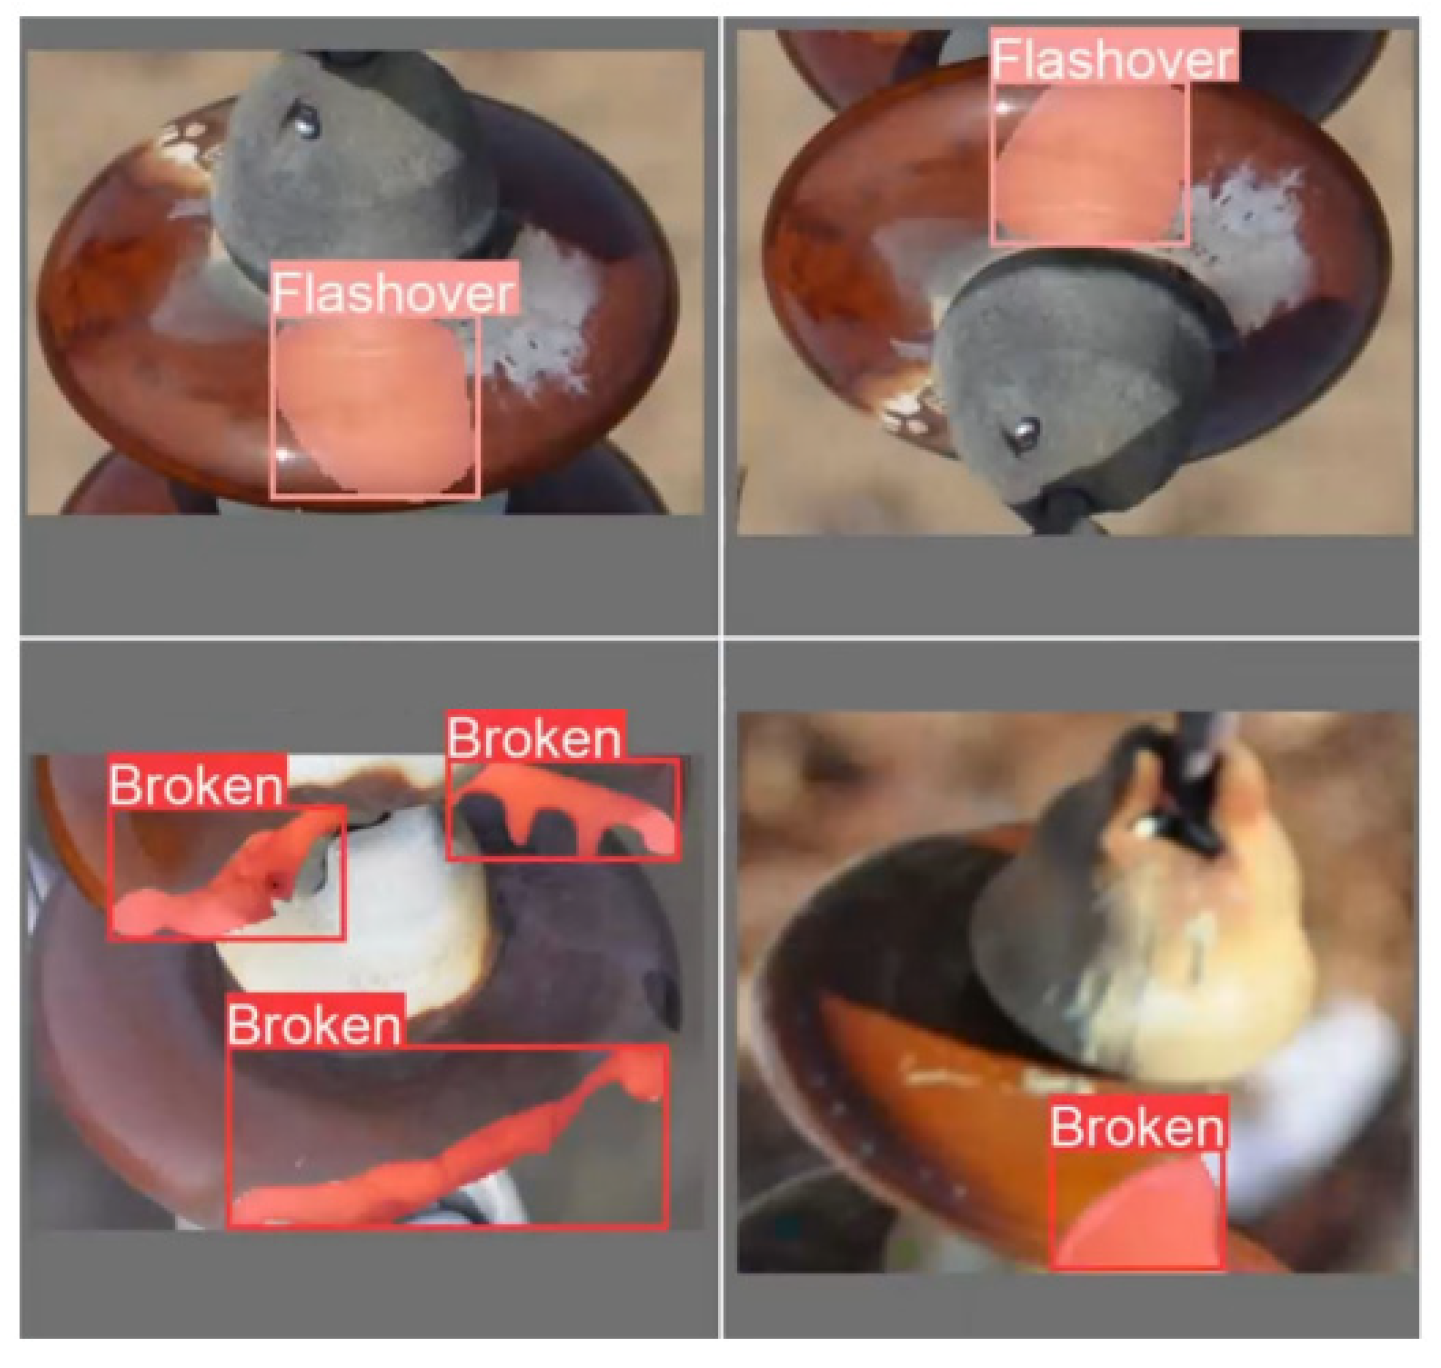
As illustrated in Figure 14, insulator defect detection segmentation is executed at the pixel level. The inspection algorithm primarily identifies two categories of defects: flashover damage to insulator shells and insulator shell breaks. Flashover damage, the first defect type, is typically the result of excessive voltage stresses or contamination on the insulator surface. It presents itself as charred or discolored patches on the insulator shell, indicating areas where electricity has bypassed the intended conductive path and traversed through the insulator instead. Prolonged exposure to such conditions may further weaken the insulator’s dielectric properties and lead to catastrophic system failures. The second defect type, breaks in the insulator shell, usually occur due to mechanical stresses or environmental factors such as wind, ice, and even wildlife interference. Such defects might compromise the insulator’s mechanical integrity and lead to catastrophic equipment failure if not detected and addressed promptly.

Figure 14.
Insulator defect segmentation detection results.
From the segmentation results shown in Figure 15, it is evident that the Unet algorithm provides the least satisfactory performance. Two large areas of insulator defects are overlooked by this algorithm, resulting in a substantial gap in defect identification. The OCRnet model, on the other hand, produces a false positive, mistakenly identifying a normal white area as a “Broken” region. Furthermore, the U-Segnet-p model exhibits a clear instance of missing an evident defect. In stark contrast, the proposed HST-Net model demonstrates superior segmentation results. It achieves a level of precision and style comparable to the ground truth, setting a new standard in image segmentation quality and reliability.
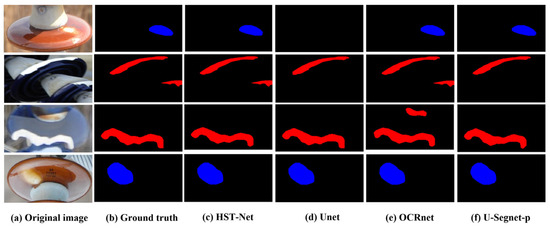
Figure 15.
Comparison of Different Algorithm Segmentation Masks.
The pixel-level defect detection algorithm is a significant breakthrough in the field of insulator health monitoring. It holds the potential to improve the overall efficiency of the inspection process, augmenting the preventative maintenance efforts, and ultimately enhancing the reliability and longevity of power system operations. The efficacy of this approach underscores the importance of incorporating advanced image processing techniques in the realm of power system maintenance and inspection. Further research and optimization in this domain could pave the way for even more robust and effective methods for insulator defect detection and assessment.
4. Conclusions
In localizing minute surface defects on insulators, conventional object detection methods have encountered several limitations, with their comparatively slower processing speeds standing out as a prominent issue. This paper proposes a novel insulator surface defect detection algorithm, HST-Net, based on the improved YOLOv5, by reconstructing the backbone network structure of YOLOv5 and introducing Transformer-CSP modules as replacements for the original C3 modules. A real case is used to verify the effectiveness of the proposed HST-Net. Specifically, the ablation experiments demonstrate the proposed HST-Net achieves a near increment of 5% mAP and outperforms other object detection algorithms. These significant enhancements in detection accuracy are achieved without compromising the detection efficiency. Furthermore, we restructure the head segmentation network, enhancing the output of insulator defect segmentation. It attains an AP50 of 0.82, surpassing the OCRnet. Additionally, this method exceeds the performance of the classic segmentation network Unet. Meanwhile, we manage to maintain model lightness with a detection speed that reaches 83.33 FPS, satisfying the substation’s requirements for inspection efficiency.
For future work, we intend to incorporate more samples of various types of insulator defects to train our network. Additionally, addressing the high rate of missed detections in small insulator defects will be a significant direction for our future research.
Author Contributions
Methodology, J.G.; Software, T.L.; Validation, J.G.; Investigation, B.D.; Writing—original draft, T.L.; Supervision, B.D. All authors have read and agreed to the published version of the manuscript.
Funding
This research received no external funding.
Institutional Review Board Statement
Not applicable.
Informed Consent Statement
Not applicable.
Data Availability Statement
Data will be made available on request.
Conflicts of Interest
The authors declare no conflict of interest.
References
- Zhang, M.; Li, Q. Research on Insulator Detection Algorithm of YOLOv5 Fused with Attention Mechanism. In Proceedings of the 2022 International Conference on Artificial Intelligence, Information Processing and Cloud Computing (AIIPCC), Kunming, China, 19–21 August 2022; pp. 384–388. [Google Scholar]
- Zhang, X.; Zhang, Y.; Hu, M.; Ju, X. Insulator Defect Detection Based on YOLO and SPP-Net. In Proceedings of the 2020 International Conference on Big Data & Artificial Intelligence & Software Engineering (ICBASE), Bangkok, Thailand, 30 October–1 November 2020; pp. 403–407. [Google Scholar]
- Chen, H.; Geng, L.; Zhao, H.; Zhao, C.; Liu, A. Image Recognition Algorithm Based on Artificial Intelligence. Neural Comput. Appl. 2022, 34, 6661–6672. [Google Scholar] [CrossRef]
- Fang, Y.; Qin, W.; Lei, X.; Zhang, B. Electric Fields Distribution of 500 kV AC Transmission Line V-Type Composite Insulator with Conductive Defect. In Proceedings of the 2020 5th Asia Conference on Power and Electrical Engineering (ACPEE 2020), Chengdu, China, 4–7 June 2020; Lie, T.T., Liu, Y., Eds.; IEEE: New York, NY, USA, 2020; pp. 1579–1583. [Google Scholar]
- Mei, H.; Jiang, H.; Chen, J.; Yin, F.; Wang, L.; Farzaneh, M. Detection of Internal Defects of Full-Size Composite Insulators Based on Microwave Technique. IEEE Trans. Instrum. Meas. 2021, 70, 6007710. [Google Scholar] [CrossRef]
- Jiang, H.; Mei, H.; Zou, X.; Li, L.; Wang, L. Microwave Detection Technology for Internal Defects of Composite Post Insulators. In Proceedings of the 2020 International Symposium on Electrical Insulating Materials (ISEIM), Tokyo, Japan, 13–17 September 2020; pp. 513–516. [Google Scholar]
- Zhao, Z.; Xu, G.; Qi, Y. Representation of Binary Feature Pooling for Detection of Insulator Strings in Infrared Images. IEEE Trans. Dielectr. Electr. Insul. 2016, 23, 2858–2866. [Google Scholar] [CrossRef]
- Cheng, L.; Liao, R.; Yang, L.; Zhang, F. An Optimized Infrared Detection Strategy for Defective Composite Insulators According to the Law of Heat Flux Propagation Considering the Environmental Factors. IEEE Access 2018, 6, 38137–38146. [Google Scholar] [CrossRef]
- Wang, R.; Zhang, Z.; Yang, C.; Nie, Z.; Wang, L.; Peng, X.; Huang, Z.; Yang, D. Study on Detection of Insulator Defects in Time Domain Terahertz Wave. In Proceedings of the 2018 IEEE Conference on Electrical Insulation and Dielectric Phenomena (IEEE CEIDP), Cancun, Mexico, 21–24 October 2018; IEEE: New York, NY, USA, 2018; pp. 297–300. [Google Scholar]
- Mei, H.; Jiang, H.; Yin, F.; Wang, L.; Farzaneh, M. Terahertz Imaging Method for Composite Insulator Defects Based on Edge Detection Algorithm. IEEE Trans. Instrum. Meas. 2021, 70, 4504310. [Google Scholar] [CrossRef]
- Zheng, Y.; Hao, Y.; Liu, L.; Zhang, Z.; Yang, L.; Wang, G.; Gao, C.; Zhou, F. An Ultrasonic Nondestructive Testing Method for Density Uniformity of Basin-Type Insulators in GIS. IEEE Trans. Instrum. Meas. 2021, 70, 1–8. [Google Scholar] [CrossRef]
- Reddy, M.J.B.; Mohanta, D.K. Condition Monitoring of 11 KV Distribution System Insulators Incorporating Complex Imagery Using Combined DOST-SVM Approach. IEEE Trans. Dielectr. Electr. Insul. 2013, 20, 664–674. [Google Scholar] [CrossRef]
- Zhao, Z.; Liu, N.; Wang, L. Localization of Multiple Insulators by Orientation Angle Detection and Binary Shape Prior Knowledge. IEEE Trans. Dielectr. Electr. Insul. 2015, 22, 3421–3428. [Google Scholar] [CrossRef]
- Tan, P.; Li, X.-F.; Xu, J.-M.; Ma, J.; Wang, F.-J.; Ding, J.; Fang, Y.; Ning, Y. Catenary Insulator Defect Detection Based on Contour Features and Gray Similarity Matching. J. Zhejiang Univ. Sci. A 2020, 21, 64–73. [Google Scholar] [CrossRef]
- Zhai, Y.; Chen, R.; Yang, Q.; Li, X.; Zhao, Z. Insulator Fault Detection Based on Spatial Morphological Features of Aerial Images. IEEE Access 2018, 6, 35316–35326. [Google Scholar] [CrossRef]
- Gao, Z.; Yang, G.; Li, E.; Liang, Z. Novel Feature Fusion Module-Based Detector for Small Insulator Defect Detection. IEEE Sens. J. 2021, 21, 16807–16814. [Google Scholar] [CrossRef]
- Zhong, J.; Liu, Z.; Yang, C.; Wang, H.; Gao, S.; Núñez, A. Adversarial Reconstruction Based on Tighter Oriented Localization for Catenary Insulator Defect Detection in High-Speed Railways. IEEE Trans. Intell. Transp. Syst. 2022, 23, 1109–1120. [Google Scholar] [CrossRef]
- Zhang, Z.; Huang, S.; Li, Y.; Li, H.; Hao, H. Image Detection of Insulator Defects Based on Morphological Processing and Deep Learning. Energies 2022, 15, 2465. [Google Scholar] [CrossRef]
- Chen, W.; Li, Y.; Zhao, Z. Missing-Sheds Granularity Estimation of Glass Insulators Using Deep Neural Networks Based on Optical Imaging. Sensors 2022, 22, 1737. [Google Scholar] [CrossRef]
- Wang, S.; Liu, Y.; Qing, Y.; Wang, C.; Lan, T.; Yao, R. Detection of Insulator Defects With Improved ResNeSt and Region Proposal Network. IEEE Access 2020, 8, 184841–184850. [Google Scholar] [CrossRef]
- Qiu, Z.; Zhu, X.; Liao, C.; Shi, D.; Qu, W. Detection of Transmission Line Insulator Defects Based on an Improved Lightweight YOLOv4 Model. Appl. Sci. 2022, 12, 1207. [Google Scholar] [CrossRef]
- Xu, S.; Deng, J.; Huang, Y.; Ling, L.; Han, T. Research on Insulator Defect Detection Based on an Improved MobilenetV1-YOLOv4. Entropy 2022, 24, 1588. [Google Scholar]
- Zhang, Z.-D.; Zhang, B.; Lan, Z.-C.; Liu, H.-C.; Li, D.-Y.; Pei, L.; Yu, W.-X. FINet: An Insulator Dataset and Detection Benchmark Based on Synthetic Fog and Improved YOLOv5. IEEE Trans. Instrum. Meas. 2022, 71, 6006508. [Google Scholar] [CrossRef]
- Han, G.; Li, T.; Li, Q.; Zhao, F.; Zhang, M.; Wang, R.; Yuan, Q.; Liu, K.; Qin, L. Improved Algorithm for Insulator and Its Defect Detection Based on YOLOX. Sensors 2022, 22, 6186. [Google Scholar] [CrossRef]
- Tao, X.; Zhang, D.; Wang, Z.; Liu, X.; Zhang, H.; Xu, D. Detection of Power Line Insulator Defects Using Aerial Images Analyzed With Convolutional Neural Networks. IEEE Trans. Syst. MAN Cybern. Syst. 2020, 50, 1486–1498. [Google Scholar] [CrossRef]
- She, L.; Fan, Y.; Xu, M.; Wang, J.; Xue, J.; Ou, J. Insulator Breakage Detection Utilizing a Convolutional Neural Network Ensemble Implemented With Small Sample Data Augmentation and Transfer Learning. IEEE Trans. Power Deliv. 2022, 37, 2787–2796. [Google Scholar] [CrossRef]
- He, Z.; Zeng, Y.; Shao, H.; Hu, H.; Xu, X. Novel Motor Fault Detection Scheme Based on One-Class Tensor Hyperdisk. Knowl. Based Syst. 2023, 262, 110259. [Google Scholar] [CrossRef]
- Wu, W.; Song, C.; Zhao, J.; Xu, Z. Physics-Informed Gated Recurrent Graph Attention Unit Network for Anomaly Detection in Industrial Cyber-Physical Systems. Inf. Sci. 2023, 629, 618–633. [Google Scholar] [CrossRef]
- Tan, P.; Li, X.; Ding, J.; Cui, Z.; Ma, J.; Sun, Y.; Huang, B.; Fang, Y. Mask R-CNN and Multifeature Clustering Model for Catenary Insulator Recognition and Defect Detection. J. Zhejiang Univ. Sci. A 2022, 23, 745–756. [Google Scholar] [CrossRef]
- Lu, X.; Quan, W.; Gao, S.; Zhao, H.; Zhang, G.; Lin, G.; Chen, J.X. An Outdoor Support Insulator Surface Defects Segmentation Approach via Image Adversarial Reconstruction in High-Speed Railway Traction Substation. IEEE Trans. Instrum. Meas. 2022, 71, 5023619. [Google Scholar] [CrossRef]
- Li, X.; Su, H.; Liu, G. Insulator Defect Recognition Based on Global Detection and Local Segmentation. IEEE Access 2020, 8, 59934–59946. [Google Scholar] [CrossRef]
- Antwi-Bekoe, E.; Liu, G.; Ainam, J.-P.; Sun, G.; Xie, X. A Deep Learning Approach for Insulator Instance Segmentation and Defect Detection. Neural Comput. Appl. 2022, 34, 7253–7269. [Google Scholar] [CrossRef]
- Liu, L.; Ke, C.; Lin, H. Dark-Center Based Insulator Detection Method in Foggy Environment. Appl. Sci. 2023, 13, 7264. [Google Scholar] [CrossRef]
- Li, Z.; Rao, Z.; Ding, L.; Ding, B.; Fang, J.; Ma, X. YOLOv5s-D: A Railway Catenary Dropper State Identification and Small Defect Detection Model. Appl. Sci. 2023, 13, 7881. [Google Scholar] [CrossRef]
- Dosovitskiy, A.; Beyer, L.; Kolesnikov, A.; Weissenborn, D.; Zhai, X.; Unterthiner, T.; Dehghani, M.; Minderer, M.; Heigold, G.; Gelly, S.; et al. An Image Is Worth 16 × 16 Words: Transformers for Image Recognition at Scale. arXiv 2021, arXiv:2010.11929. [Google Scholar]
- Jin, G.; Oh, S.; Lee, Y.; Shin, S. Extracting Weld Bead Shapes from Radiographic Testing Images with U-Net. Appl. Sci. 2021, 11, 12051. [Google Scholar] [CrossRef]
- Huang, S.; Han, W.; Chen, H.; Li, G.; Tang, J. Recognizing Zucchinis Intercropped with Sunflowers in UAV Visible Images Using an Improved Method Based on OCRNet. Remote Sens. 2021, 13, 2706. [Google Scholar] [CrossRef]
- Zhou, Y.; Wen, S.; Wang, D.; Mu, J.; Irampaye, R. Object Detection in Autonomous Driving Scenarios Based on an Improved Faster-RCNN. Appl. Sci. 2021, 11, 11630. [Google Scholar] [CrossRef]
- Liao, S.; Huang, C.; Liang, Y.; Zhang, H.; Liu, S. Solder Joint Defect Inspection Method Based on ConvNeXt-YOLOX. IEEE Trans. Compon. Packag. Manuf. Technol. 2022, 12, 1890–1898. [Google Scholar] [CrossRef]
- Wei, H.; Zhang, Q.; Li, X.; Qin, Y.; Qian, Y. YOLOF-F: You Only Look One-Level Feature Fusion for Traffic Sign Detection. In The Visual Computer; Springer: Berlin, Germany, 2023. [Google Scholar]
- Biswas, D.; Su, H.; Wang, C.; Stevanovic, A.; Wang, W. An Automatic Traffic Density Estimation Using Single Shot Detection (SSD) and MobileNet-SSD. Phys. Chem. Earth 2019, 110, 176–184. [Google Scholar] [CrossRef]


Disclaimer/Publisher’s Note: The statements, opinions and data contained in all publications are solely those of the individual author(s) and contributor(s) and not of MDPI and/or the editor(s). MDPI and/or the editor(s) disclaim responsibility for any injury to people or property resulting from any ideas, methods, instructions or products referred to in the content. |
© 2023 by the authors. Licensee MDPI, Basel, Switzerland. This article is an open access article distributed under the terms and conditions of the Creative Commons Attribution (CC BY) license (https://creativecommons.org/licenses/by/4.0/).