Article

Enhancing Air Traffic Management and Reducing Noise Impact: A Novel Approach Integrating Băneasa Airport with Otopeni RO Airport

by
Adina Cristina Toma
1,
Grigore Cican
1,2,* and
Daniel-Eugeniu Crunteanu
2
1
National Research and Development Institute for Gas Turbines COMOTI, 061126 Bucharest, Romania
2
Faculty of Aerospace Engineering, University Politehnica of Bucharest, 1-7 Polizu Street, 1, 011061 Bucharest, Romania
*
Author to whom correspondence should be addressed.
Appl. Sci. 2023, 13(16), 9139; https://doi.org/10.3390/app13169139
Submission received: 18 July 2023 / Revised: 3 August 2023 / Accepted: 8 August 2023 / Published: 10 August 2023
(This article belongs to the Section Aerospace Science and Engineering)

Abstract

:
Over the years, Bucharest’s Henri Coandă International Airport has registered a constant and high increase in air traffic, in terms of both passengers and aircraft movements. This paper presents a traffic diversion solution for the Otopeni RO airport, which aims to alleviate air traffic congestion by redirecting a proportion of the planes to the nearby airport at Băneasa. The primary challenge faced by diversion to Băneasa Airport is the proximity of residential areas to the runway at distances of less than 300 m, resulting in significant noise pollution issues. At Otopeni Airport, the main operators use aircraft equipped with CFM 56 turbo engines; therefore, this study begins with an evaluation of the noise directivity of a CFM aircraft engine via measurement. The data thus collected enabled the identification of the dominant frequencies in the acoustic spectrum of the engine noise. A resonant screen solution has been proposed as a solution for Băneasa Airport, emphasizing the importance of implementing solutions to address the noise pollution faced by those living near Băneasa Airport, due to its proximity to the residential area. Various configurations of perforated metal sheets with different perforation patterns were compared to the test performance of solid sheets to optimize noise absorption. Using the impedance tube tests to achieve the highest absorption coefficient, it was determined that the optimal distance between the perforated metal sheets and the resonant screen was 30 mm. Based on the CFM 56 turbo engine noise directivity and the impedance tube tests, a multitude of numerical simulations were conducted using the IMMI software (IMMI 2011). The simulations were performed for two scenarios with and without an acoustic barrier, accounting for the typical configuration of two engines on an aircraft. The results indicate a reduction of 15 dBA with the implementation of a 4-m-high acoustic barrier, in the case of a CFM 56 engine operating at full throttle while the aircraft is on the ground. Through numerical simulations, the optimized resonant screen demonstrated its potential to significantly reduce noise levels, thereby enhancing the overall acoustic environment and quality of life for the communities surrounding Băneasa Airport. The identified findings could serve as a basis for further research and the implementation of innovative solutions to manage air traffic and reduce the impact of aircraft noise in surrounding areas.

1. Introduction

Bucharest, with a population of approximately 2 million inhabitants, is the largest conurbation and the capital city of Romania. The city has a single large airport, intended for both domestic and international flights [1]. Air travel to and from Bucharest represents a significant mode of transportation for tourists and business travelers, who fly to the city from other locations within Romania, as well as to other destinations worldwide via charter flights to Europe and beyond. In countries such as Romania, which lack a developed high-speed road and railway infrastructure, aviation is expected to remain the fastest mode of transportation. Historically, air traffic consistently increased until 2019 [2], which was the year preceding the COVID-19 pandemic. This increase necessitated airport development, such as the construction of new terminals and runways, or the construction of an entirely new airport in the vicinity of Romania’s capital, which would incur exorbitant costs for the country’s economy. Another issue associated with the increase in traffic or activity at Otopeni Airport is the environmental impact of aviation, which incurs supplementary costs in terms of reducing noise pollution [3].
Nowadays, many other international airports also face challenges regarding expansion and the resulting increase in noise pollution, which affects the residential areas surrounding the airports. Noise pollution in urban areas arises from various sources, including but not limited to the road network [4], railway systems [5], airports [6,7], jet engine test benches [8], or helicopters [9].
In 2017, Snellen et al. [10] attributed the variability of noise from different aircraft to aircraft engine characteristics, such as the engine’s fan types and settings [11], structure (types and configurations), the aircraft’s speed, and changing atmospheric conditions [12]. Airframe characteristics, such as the wingspan, aircraft length, maximum take-off weight, cabin diameter, and the number of tires at the nose and main landing gear were found to show correlations with sound quality values; these are different for different aircraft, regardless of whether they are landing or taking off [13].
As a result, numerous studies have been conducted on airports located near urban areas across the globe, to examine the issues associated with population exposure to sound intensities above permissible levels and the relationship between airport noise and health problems [14]. For example, reference [15] presented a study that outlines the proportion of the population exposed to airport noise levels that exceed the prescribed requirements in the vicinity of Istanbul Ataturk Airport, Turkey.
The airport noise exposure around Viracopos International Airport in Brazil was analyzed by quantifying the proportion of highly affected individuals in the surrounding zones through simulations and GIS data, as presented by Benet et. al. (2013) [16]. The effects of aircraft noise on the population of London due to traffic operations at Heathrow and Gatwick airports were investigated by Wolf et al. (2017) [17]. Heathrow Airport is a major global aviation hub, currently operating close to its full air-traffic movement capacity, while Gatwick Airport, the second busiest airport in the United Kingdom in terms of passenger movement, accommodates more than three-quarters of the passengers who use the London airport system. Larnaka International Airport in Cyprus was studied by Vogiatzis in 2012 [18], who employed environmental noise mapping and land use management as tools for implementing environmental protection measures. The noise levels around Izmir Adnan Menderes Airport during the day, evening, and night periods were computed using SoundPLAN 7.2 software and measured according to the standards of the European Noise Directive, applying the ‘ECAC Doc. 29-Interim’ method for aircraft noise, as examined by Ozkurt et al. (2015) [19]. The findings indicated that approximately 2% of the local populace was subjected to noise levels of 55 dB(A) or more during the daytime in Izmir. The cost of airport noise annoyance around Düsseldorf, Germany, was estimated by analyzing data from the rental apartment market (Püschel et al., 2012) [20]. This study takes into account not only the acoustic discomfort experienced but also its economic impact, such as the decrease in rental prices and other related business issues that are faced by those living around airports with high traffic movement levels. Households in California were investigated by Rahmatian and Cockerill (2004) [21], who found that noise annoyance is still a matter of significant concern for the aviation industry, despite its efforts to mitigate it. This is due to the high transportation demands made by modern societies, changing levels of citizen awareness, and environmental concerns. Although modern aircraft are quieter than older models, the anticipated reduction in complaints has not been observed. There are numerous solutions available for reducing the noise produced by aircraft or their engines [22,23,24]. As a result, the aeronautical industry has endeavored to implement sociological and/or psychological strategies aimed at increasing responsiveness and community engagement, in order to increase acceptance. Effective communication with the public regarding noise is, therefore, crucial for managers and policymakers [25].
Excessive exposure to noise has numerous direct and indirect effects on safety and hygiene. It directly affects our sense of hearing, disrupts sleep, and causes the masking of speech. Otologists consider industrial noise a source of numerous problems related to the ear, such as noise-induced hearing loss, permanent hearing impairment, acoustic trauma, sensorineural hearing loss, tinnitus, etc. Exposure to high noise levels can indirectly affect human psychology and physiology, resulting in an adverse effect on general performance [26]. A number of ailments also have a causal relationship with noise exposure. Figure 1 illustrates the range of effects of noise on humans.
There have been numerous studies conducted on the direct and indirect effects of aircraft noise on human health, spanning borders and continents. These studies have mainly concentrated on examining the impact on individuals living in close proximity to domestic and international airports and their surrounding areas.
Aircraft noise causes some of the most damaging environmental effects on everyday life around airports. It can cause numerous known and undesirable problems: sleep problems, reduced school performance in children, mental illness, metabolic disease, cardiovascular disease, etc. [27,28].
The existing literature has documented the direct and indirect effects of noise on psychosocial health, ranging from auditory to non-auditory associations [29,30]. The health impacts of noise include noise sensitivity, trait anxiety, hypertension, high blood pressure, stroke, heart attack, myocardial infarctions, and arteriosclerotic lesions [31,32,33].
The results of noise exposure on health in areas where aircraft noise was not predominant showed that exposure to aircraft noise significantly affected subjective health [31]. Vieira et al. (2019) [13] quantified aircraft noise annoyance using the psychoacoustic model. They found that there was a good agreement between subjective listening tests and the actual perceived noise level, according to the psychoacoustic annoyance model.
An excess of noise above the individualized noise level threshold that causes annoyance or sensitivity to noise has been shown by studies to be associated with increased risks of certain diseases, from sleep disorders to vegetative-hormonal regulation disorders and negative emotional reactions [34].
Upon reviewing the effects of airplane noise on people’s health, it is crucial to ensure that Baneasa Airport does not become a source of health problems due to airplane noise as its air traffic increases.
Since the number of airplane movements at Otopeni Airport has increased and is expected to continue to increase once flights have resumed after the pandemic period, and due to the fact that the towns around the airport have continuously expanded, the noise pollution levels for local residents near the airport will inevitably become a problem.
A method of decongesting the traffic at Otopeni Airport consists of re-directing part of it to Baneasa Airport; however, it is not only a smaller airport but is also one that is located within the city of Bucharest and is surrounded by houses.
By diverting part of the traffic from the runways, the problem of noise pollution generated by the airport and the problem of overcrowding are solved until the authorities can build a new large-scale airport to serve the capital of Romania—Bucharest.
The objective of this study is to examine the feasibility of reducing noise levels in the vicinity of Otopeni Airport by diverting traffic for international flights that involve large aircraft to Baneasa Airport. However, the proximity of residential areas to the runway at Baneasa Airport poses a challenge, as this may result in excessive noise exposure for nearby residents. In this study, Baneasa Airport was chosen because it is very close to Otopeni Airport and could be a viable solution for reducing congestion at Otopeni Airport, which is the only airport serving the capital of Romania. Besides the obvious economic advantages, having two airports serving Bucharest can offer several advantages and benefits, such as better air traffic distribution, capacity expansion, and more options for airlines to establish routes to different destinations. More importantly, by diverting some air traffic to a second airport, the noise impact on the surrounding communities can be reduced.

2. Materials and Methods

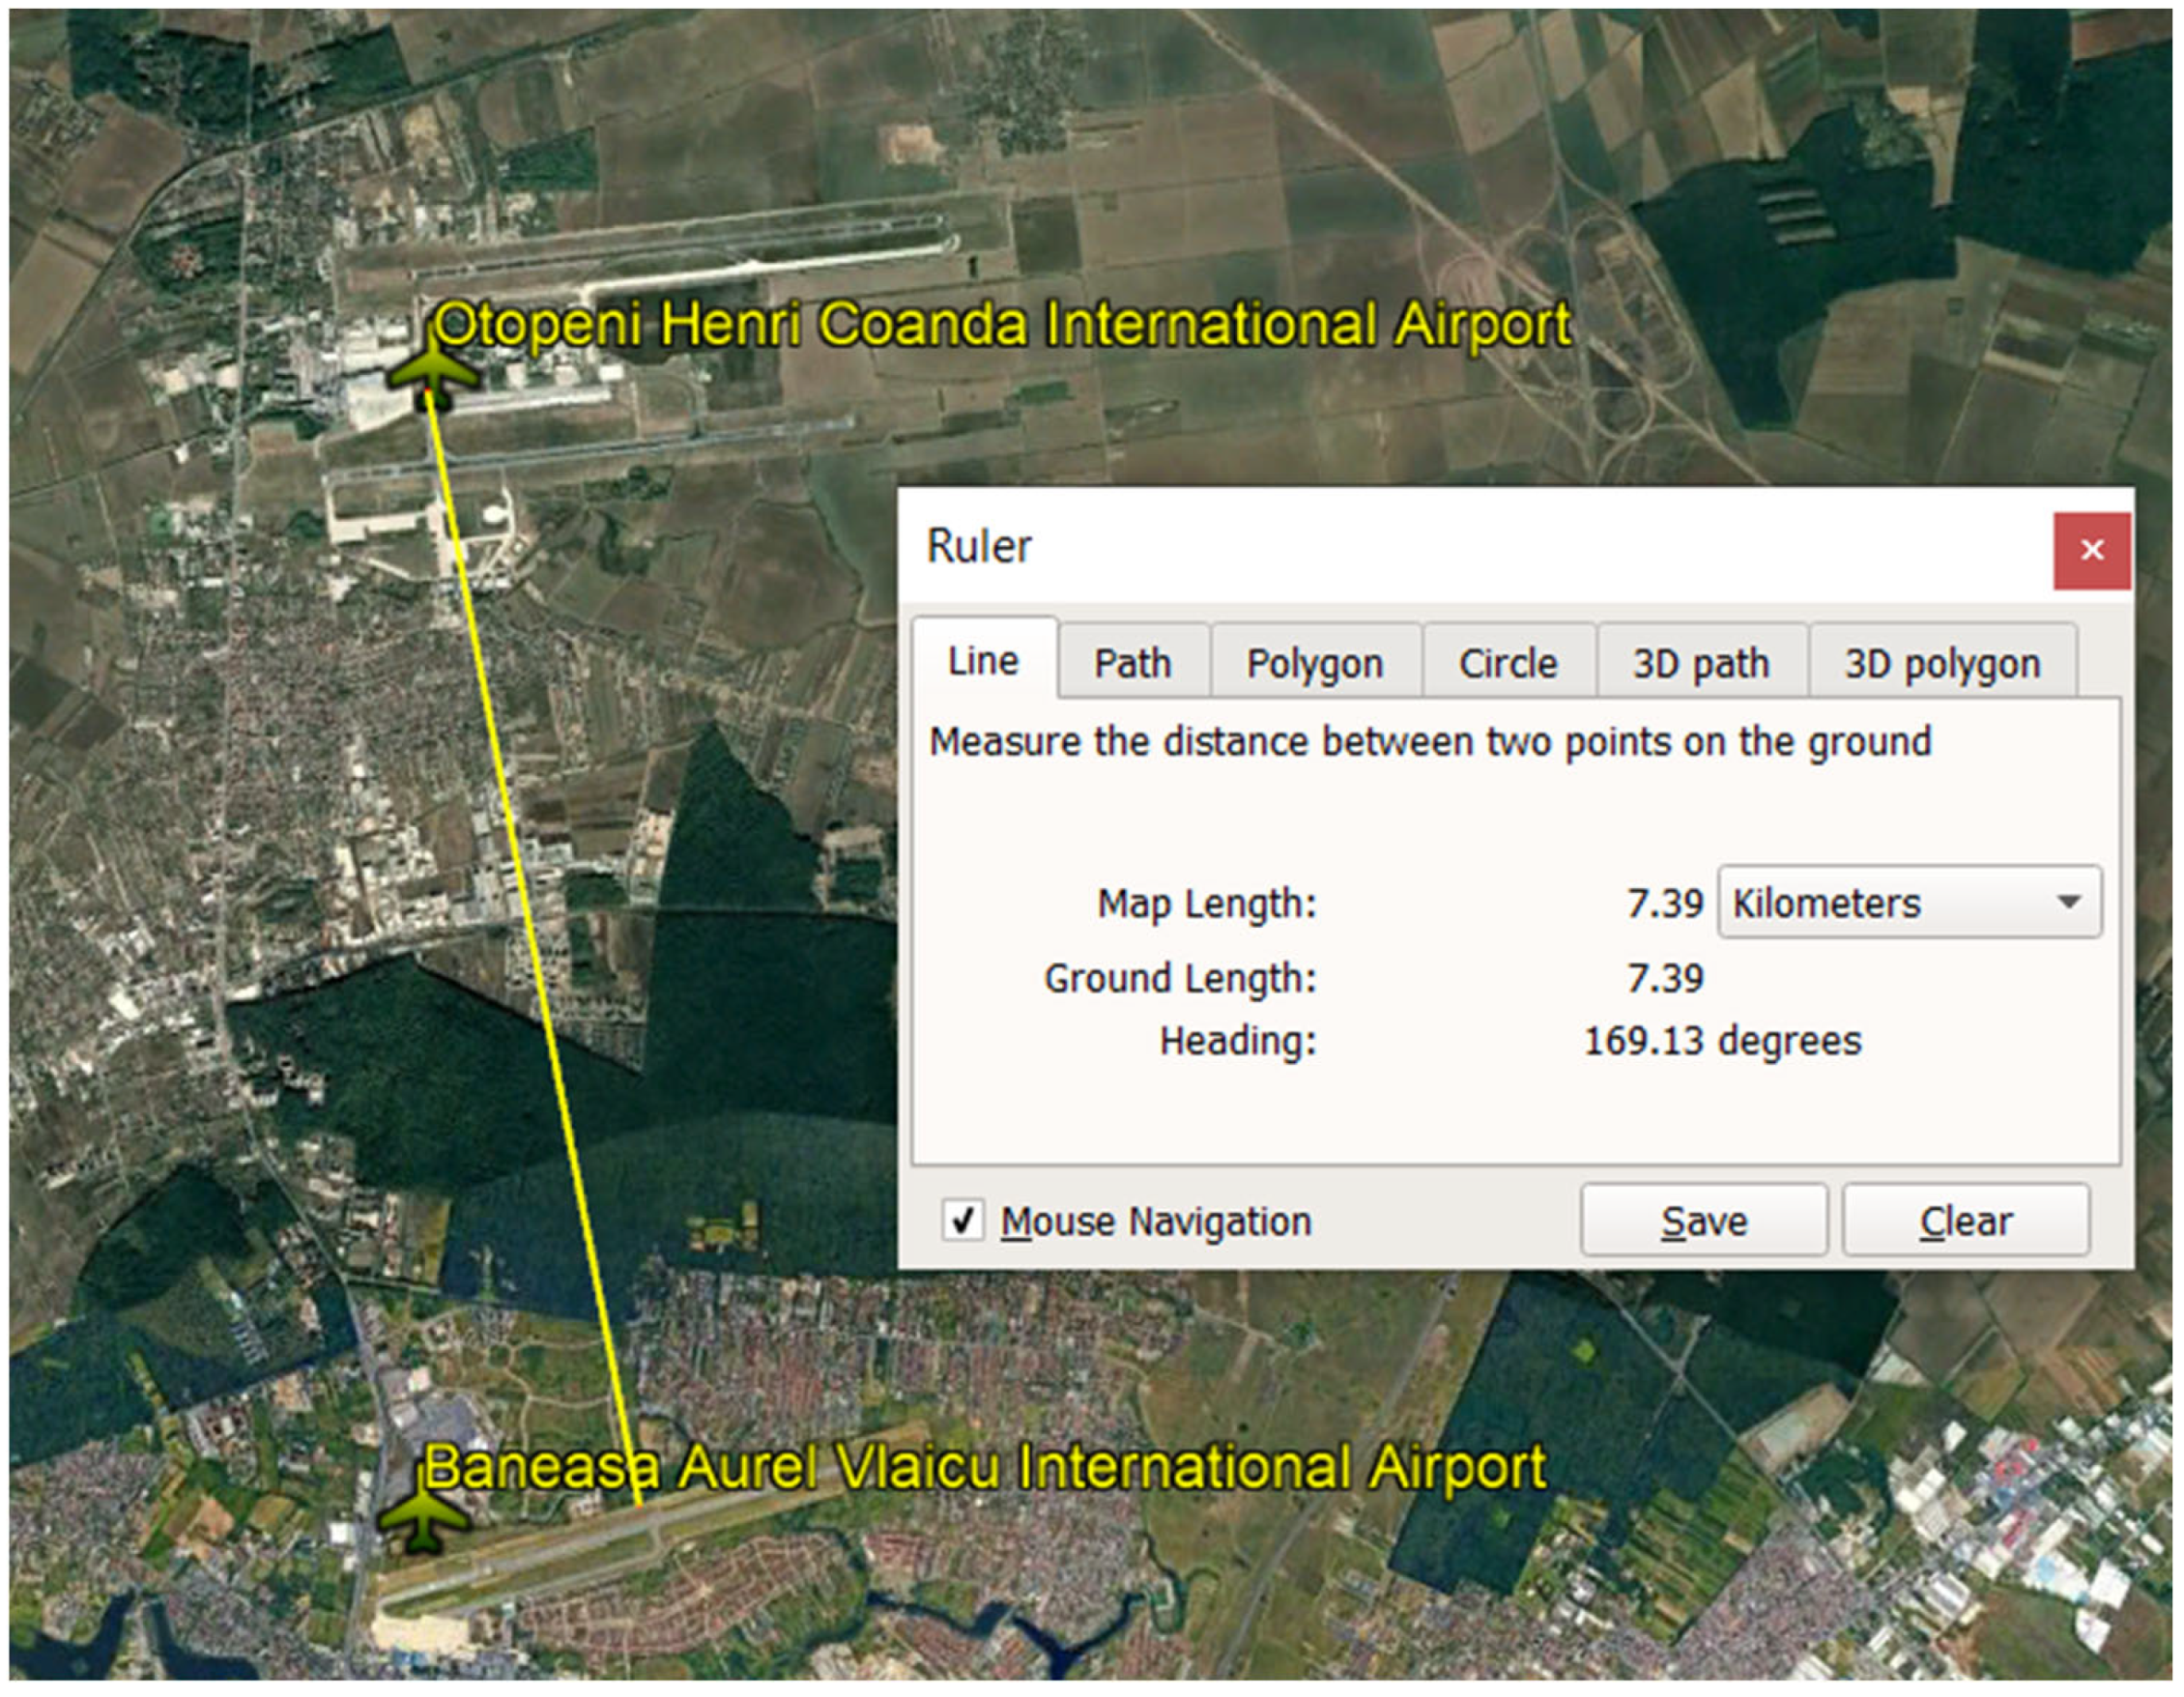
2.1. Bucharest Henri Coanda Airport and Bucharest Baneasa—Aurel Vlaicu Approach

Currently, the only international airport serving the capital of Romania, Bucharest, is Otopeni International Airport (IATA code: OTP, ICAO code: LROP). Figure 2 shows its location in Otopeni City, Ilfov County, 16.5 km north of the center of Bucharest, at 44°34′16″ N, 26°05′06″ E.
The Otopeni Airport characteristics are described in Ref. [35]. The airport has two runways, with the following specifications:
  • 08 R–26 L: 3500 m × 45 m, 11,484 × 148 feet;
  • 08 R track with a precision approach, CAT III B;
  • 26 L track with a precision approach, CAT II;
  • 08 L–26 R: 3500 m × 45 m, 11,484 × 148 feet;
  • 08 L track with a precision approach, CAT III A;
  • 26 R track with a precision approach, CAT II;
  • Total airport area: 605 ha.
The data presented in Figure 3 illustrates the statistics on the movements and passenger numbers at Otopeni Airport [35].
Prior to 2020, which marked the outbreak of the COVID-19 pandemic, there had been a consistent upward trend in air traffic. This growth prompted proposals for airport expansion or even for the construction of a new airport in the vicinity of the capital to accommodate the surge in aircraft flow. However, a more cost-effective and straightforward alternative is to utilize Baneasa Airport.
  • Baneasa Airport Characteristics
Bucharest Baneasa–Aurel Vlaicu International Airport (IATA code: BBU, ICAO code: LRBS) is located in the north of Bucharest Municipality, 8.5 km from the center of Romania’s capital, and in the immediate vicinity of the towns of Otopeni, Voluntari, and Afumati. The airport’s geographical position is at Lat. 44°30.2′ N, Long. 26°02.0′ E.
Technical details include aerodrome elevation: 91 m; reference temperature: 24.9 °C; magnetic variation: 29′ E (1966); transition altitude: 1200 m; runway: 3200 m (07/25); apron: 22 spots; navigation aids: ILS, SRE, PAPI, and PAR; rescue and firefighting equipment: ICAO category 8; operational capacity: 15 aircraft movements/hour; passenger processing capacity: 40 passengers/flow/hour [36].
The airport is surrounded by residential areas in the south, east, southwest, and northeast directions, and by commercial and industrial zones in the north and west areas. The airport’s main activity concerns the provision of services, operation, maintenance, repair, development, and the modernization of assets in its ownership or concession to ensure good conditions for the arrival, departure, and ground handling of aircraft from national and/or international traffic, while providing airport services for the transit of passengers, goods, and mail, as well as services of national public interest.
The airport serves the following aircraft: the Airbus 319, Airbus 310, Airbus 320, Boeing B734, and Boeing B733.
As shown in Figure 4, Baneasa Airport is relatively small.
At present, Baneasa Airport is used for international flights featuring smaller aircraft and has substantially lower traffic volumes compared to Otopeni Airport, as substantiated by the data presented in Figure 5 [35].
As shown in Figure 6, these two airports are located close to each other and could serve the same region. As can be seen in Figure 4, above, Baneasa Airport’s runway is very close to nearby houses, and the nearest houses are only 300 m away. Consequently, using it for larger, more powerful aircraft or in high-traffic situations is almost impossible. The primary obstacle that must be addressed to facilitate the utilization of Baneasa Airport in diverting a portion of the air traffic from Otopeni is the issue of noise pollution, stemming from the close proximity of the residential areas to the runway. It is imperative to evaluate the acoustic response of the area to ascertain the feasibility of rerouting the aircraft currently serviced by Otopeni Airport to Baneasa Airport.
The most frequently used aircraft for takeoff and landing at Otopeni Airport in 2021, listed in decreasing order, were B738, A320, A321, AT76, and B737 [37]. Given that most of the aircraft operating at Otopeni Airport are equipped with CFM 56 engines [37], this study will primarily gather data on and examine the noise generated by this particular engine type, since the engines are the primary source of aircraft noise during take-off and landing [38].

2.2. Acoustic Solutions for Baneasa Airport

A possible acoustic measure to address the issue in Baneasa Airport is the installation of sound-absorbing panels around the runway to mitigate the impact of noise on nearby residential areas. To design sound-absorbing panels and to conduct numerical simulations, knowledge of the directivity of the CFM 56 engine is necessary.

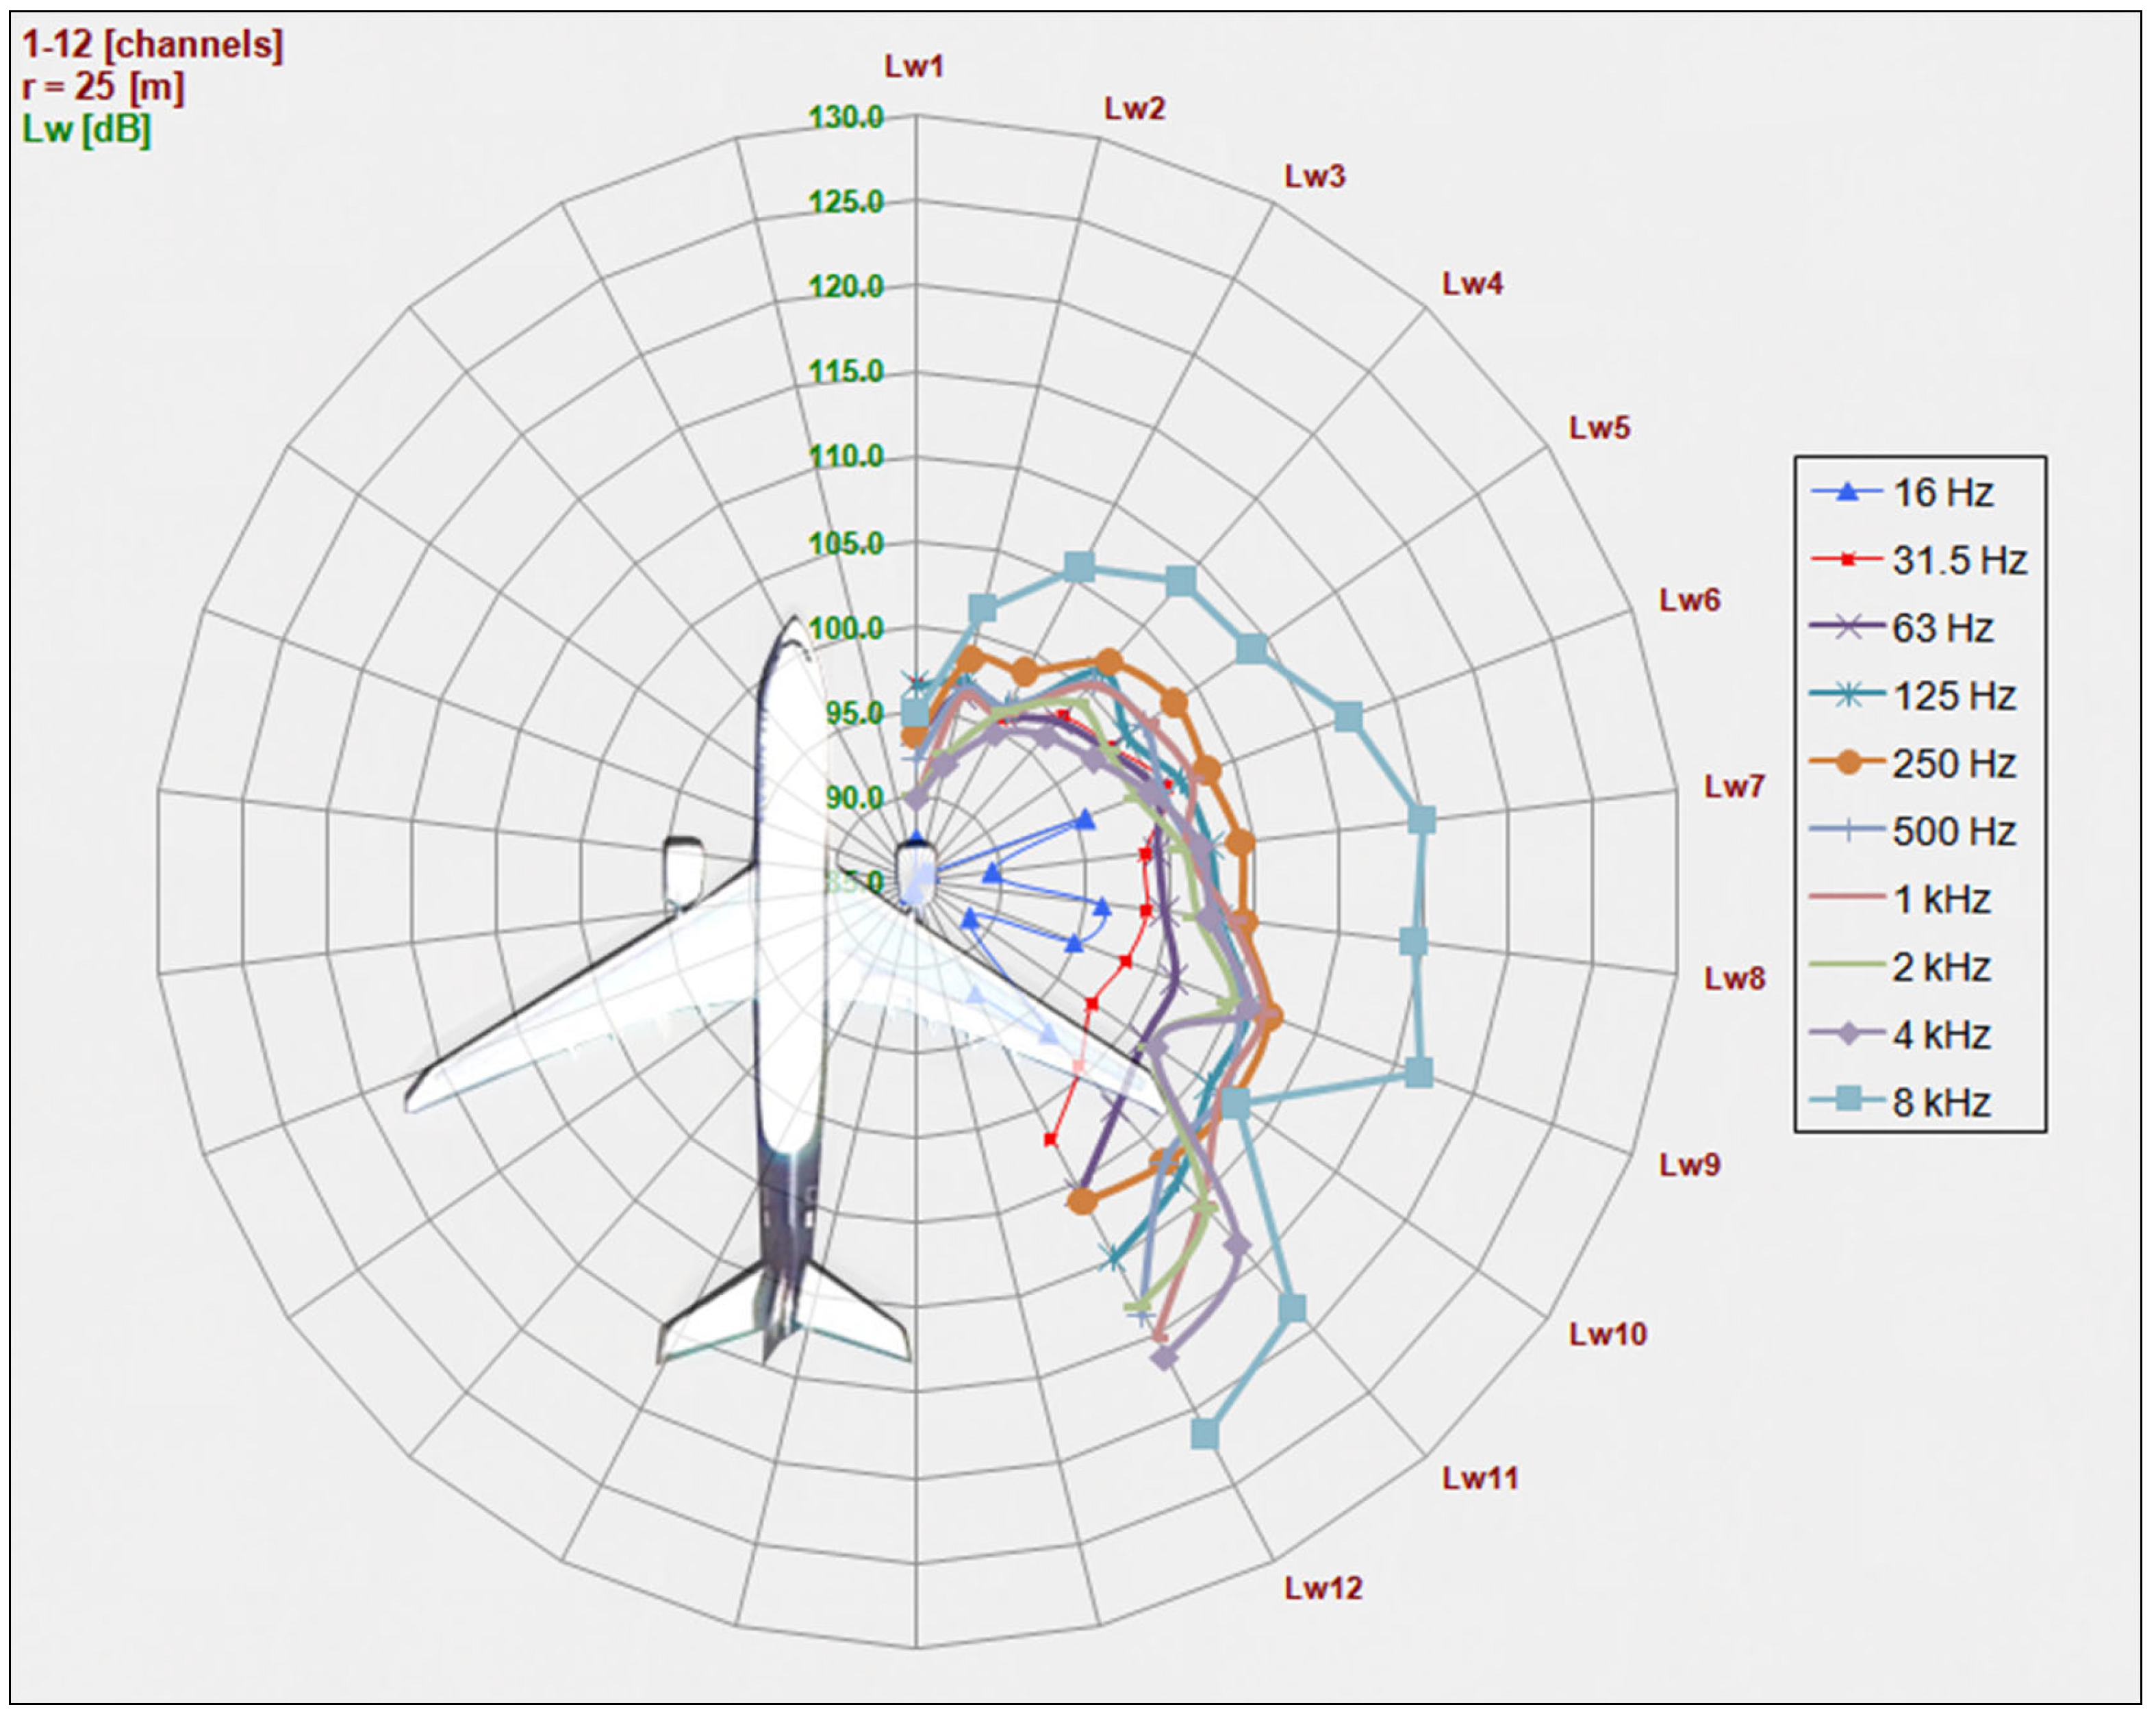
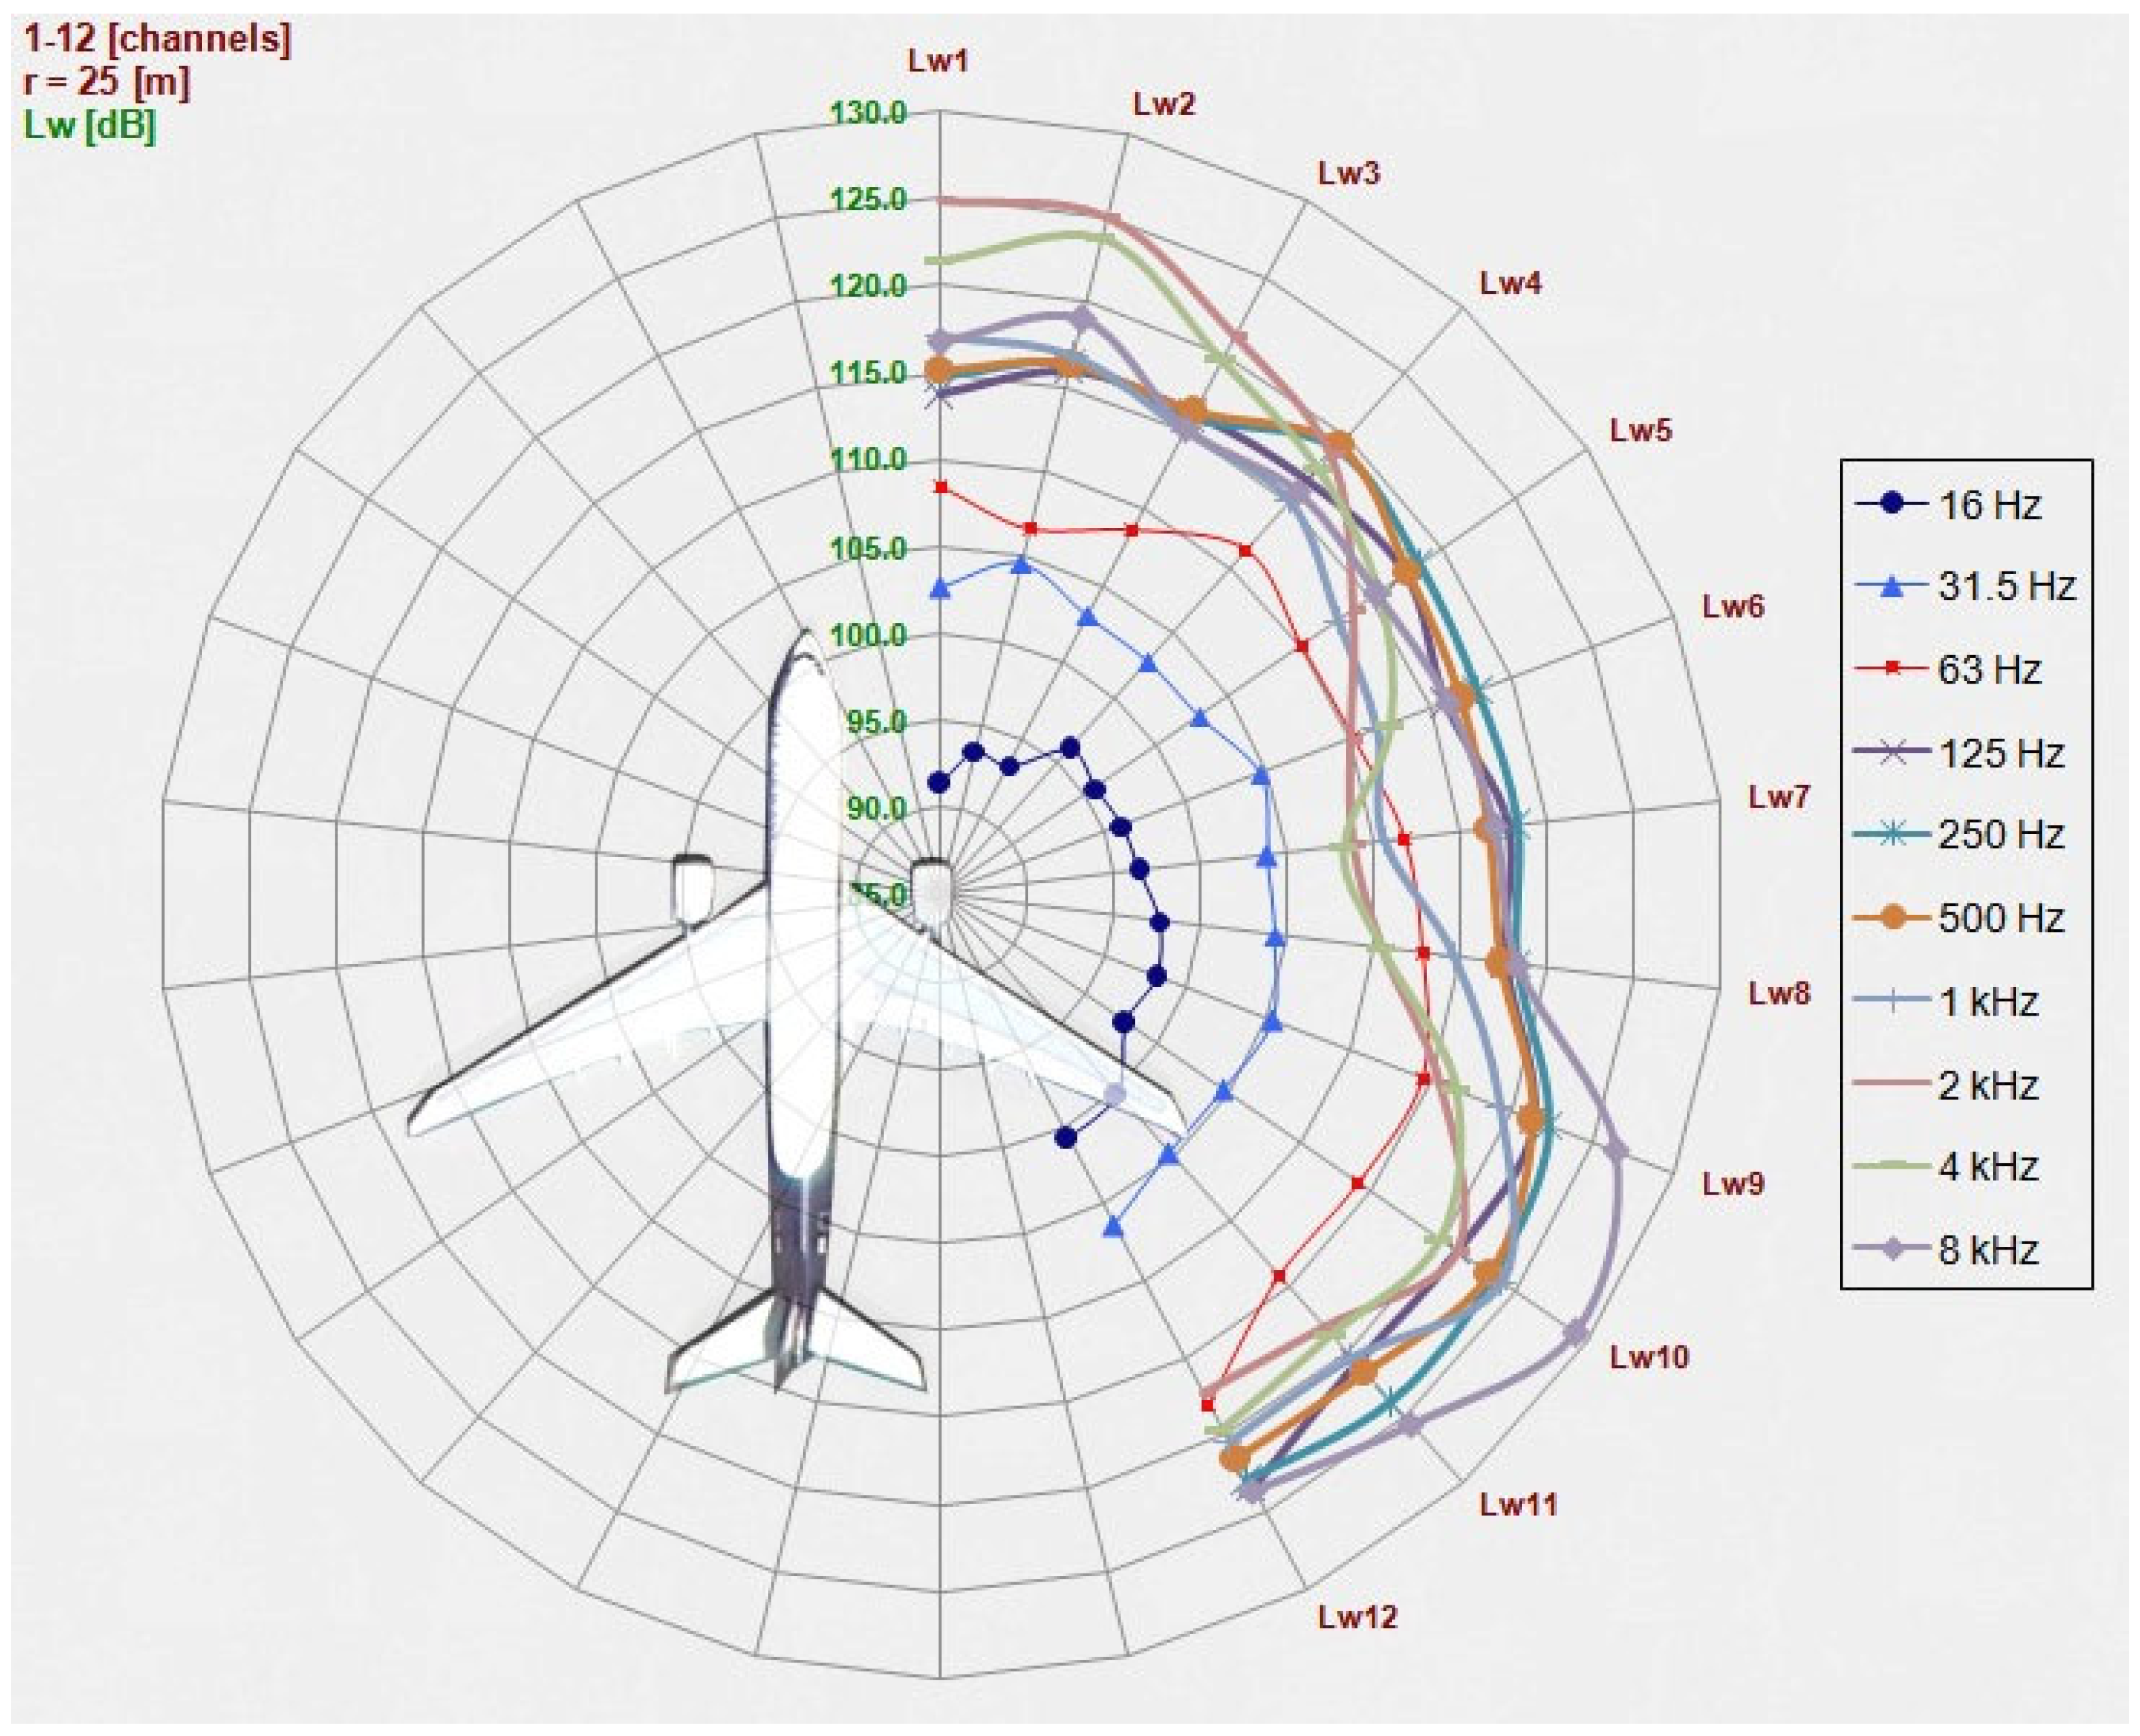
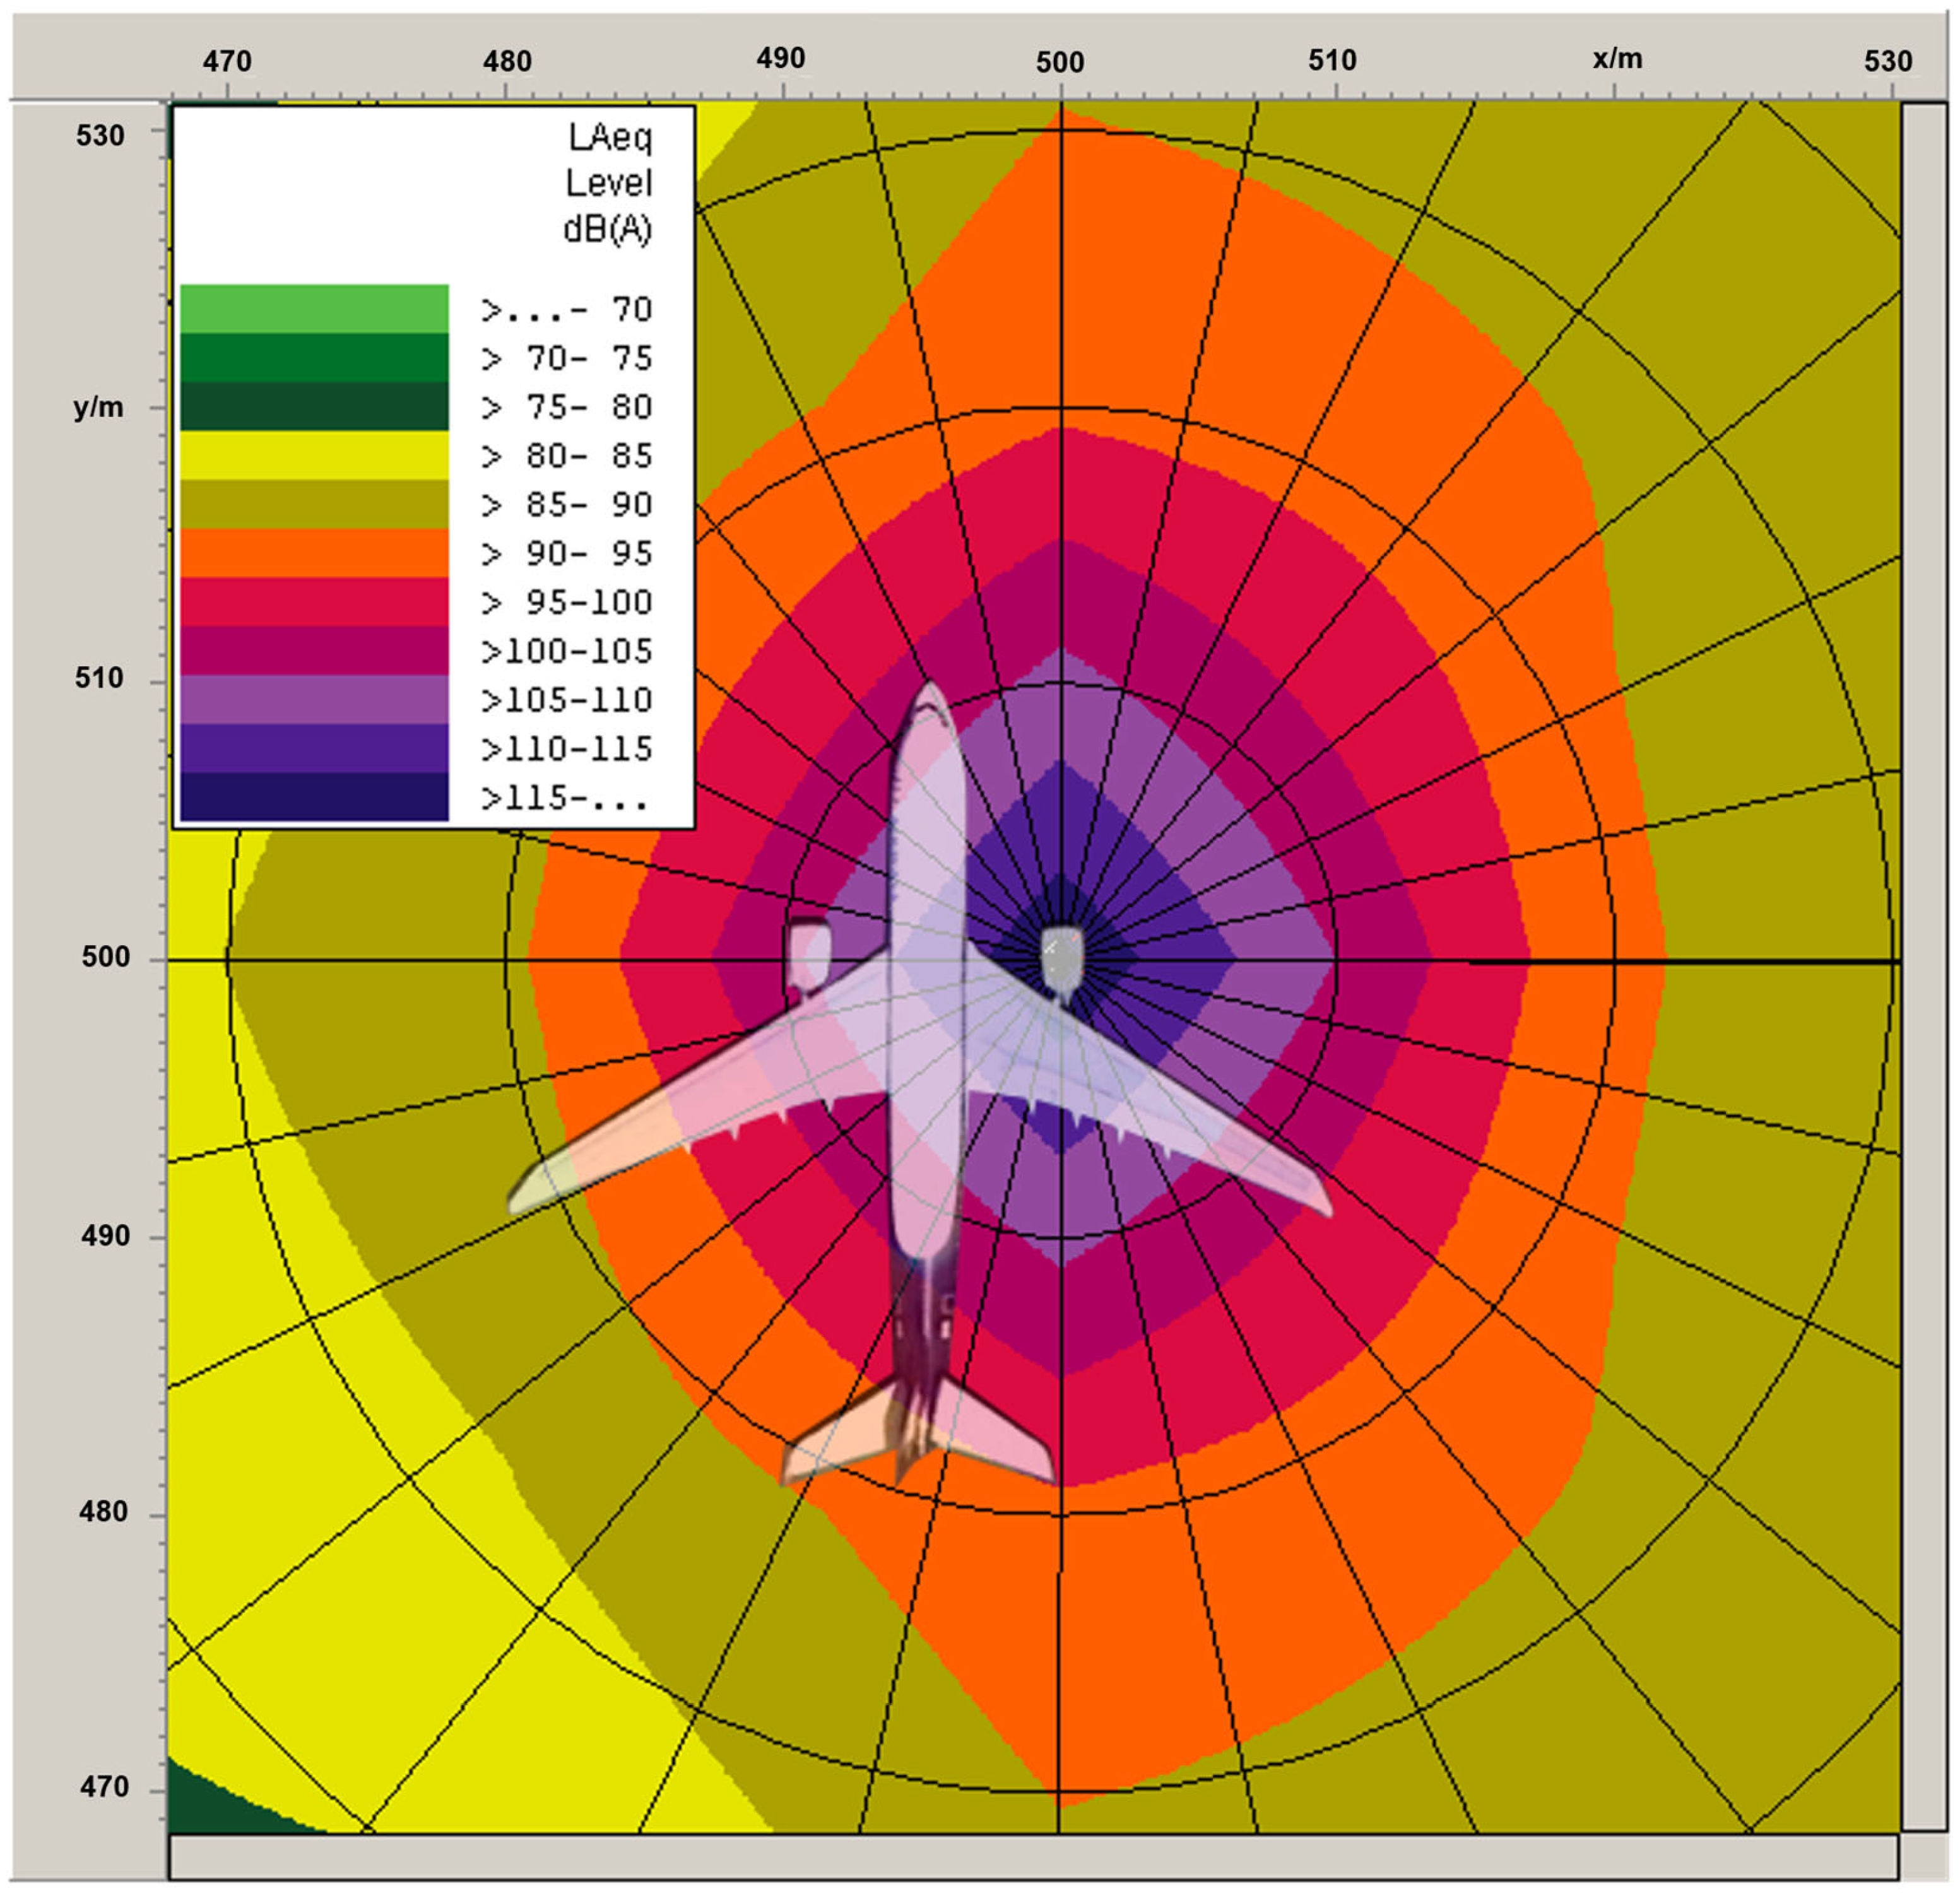
2.2.1. CFM 56 Acoustic Directivity

The first step to improvement is to identify the acoustic directivity of a CFM 56-7D engine, used in the B737 aircraft, during aircraft operation on the ground. This was performed for two operating modes, namely, idle and maximum. For this study, measurements were made with a multi-channel acquisition system, the 01 dB Metravib-Orchestra.
The measurements were taken at 12 different points, as depicted in Figure 7, at intervals of 12.85 degrees. A set of 12 GRAS 40AE microphones was utilized, with a frequency range of 0–25.6 kHz, and an accuracy of class 1. Sensitivities were between 43.9 and 44.3 mV/Pa. The microphones were coupled with 12 GRAS 26CA preamplifiers, with a frequency range of 2–100 kHz and an input impedance of 20 GOhmi and 0.4 pF. The 12 measurement points were positioned 25 m from the source. The data are available from Ref. [39].
After conducting the acoustic measurements, the results were obtained and are presented as a comparative analysis of the 1/3 octave spectra for the idle regime (Figure 8) and the maximum regime (Figure 9).
Based on the spectral analyses conducted at each measurement point, noise polar diagrams have been generated that depict the frequency-dependent directivity of the noise source.
In order to create the noise polar diagrams, the 1/1 octave sound power spectra were used for all 12 measurement points for both engine modes. Table 1 presents the spectrum of sound power as a 1/1 octave for idle mode.
Figure 10 displays the noise polar diagrams, which illustrate the sound power levels corresponding to the central frequencies of the 1/1 octave, which are in the range of 16 Hz to 8 kHz while the engine is running in idle mode.
Table 2 presents the 1/1 octave sound power spectrum for the maximum regime.
Figure 11 displays the noise polar diagrams, which illustrate the sound power levels corresponding to the central frequencies of the 1/1 octave in the range of 16 Hz to 8 kHz.

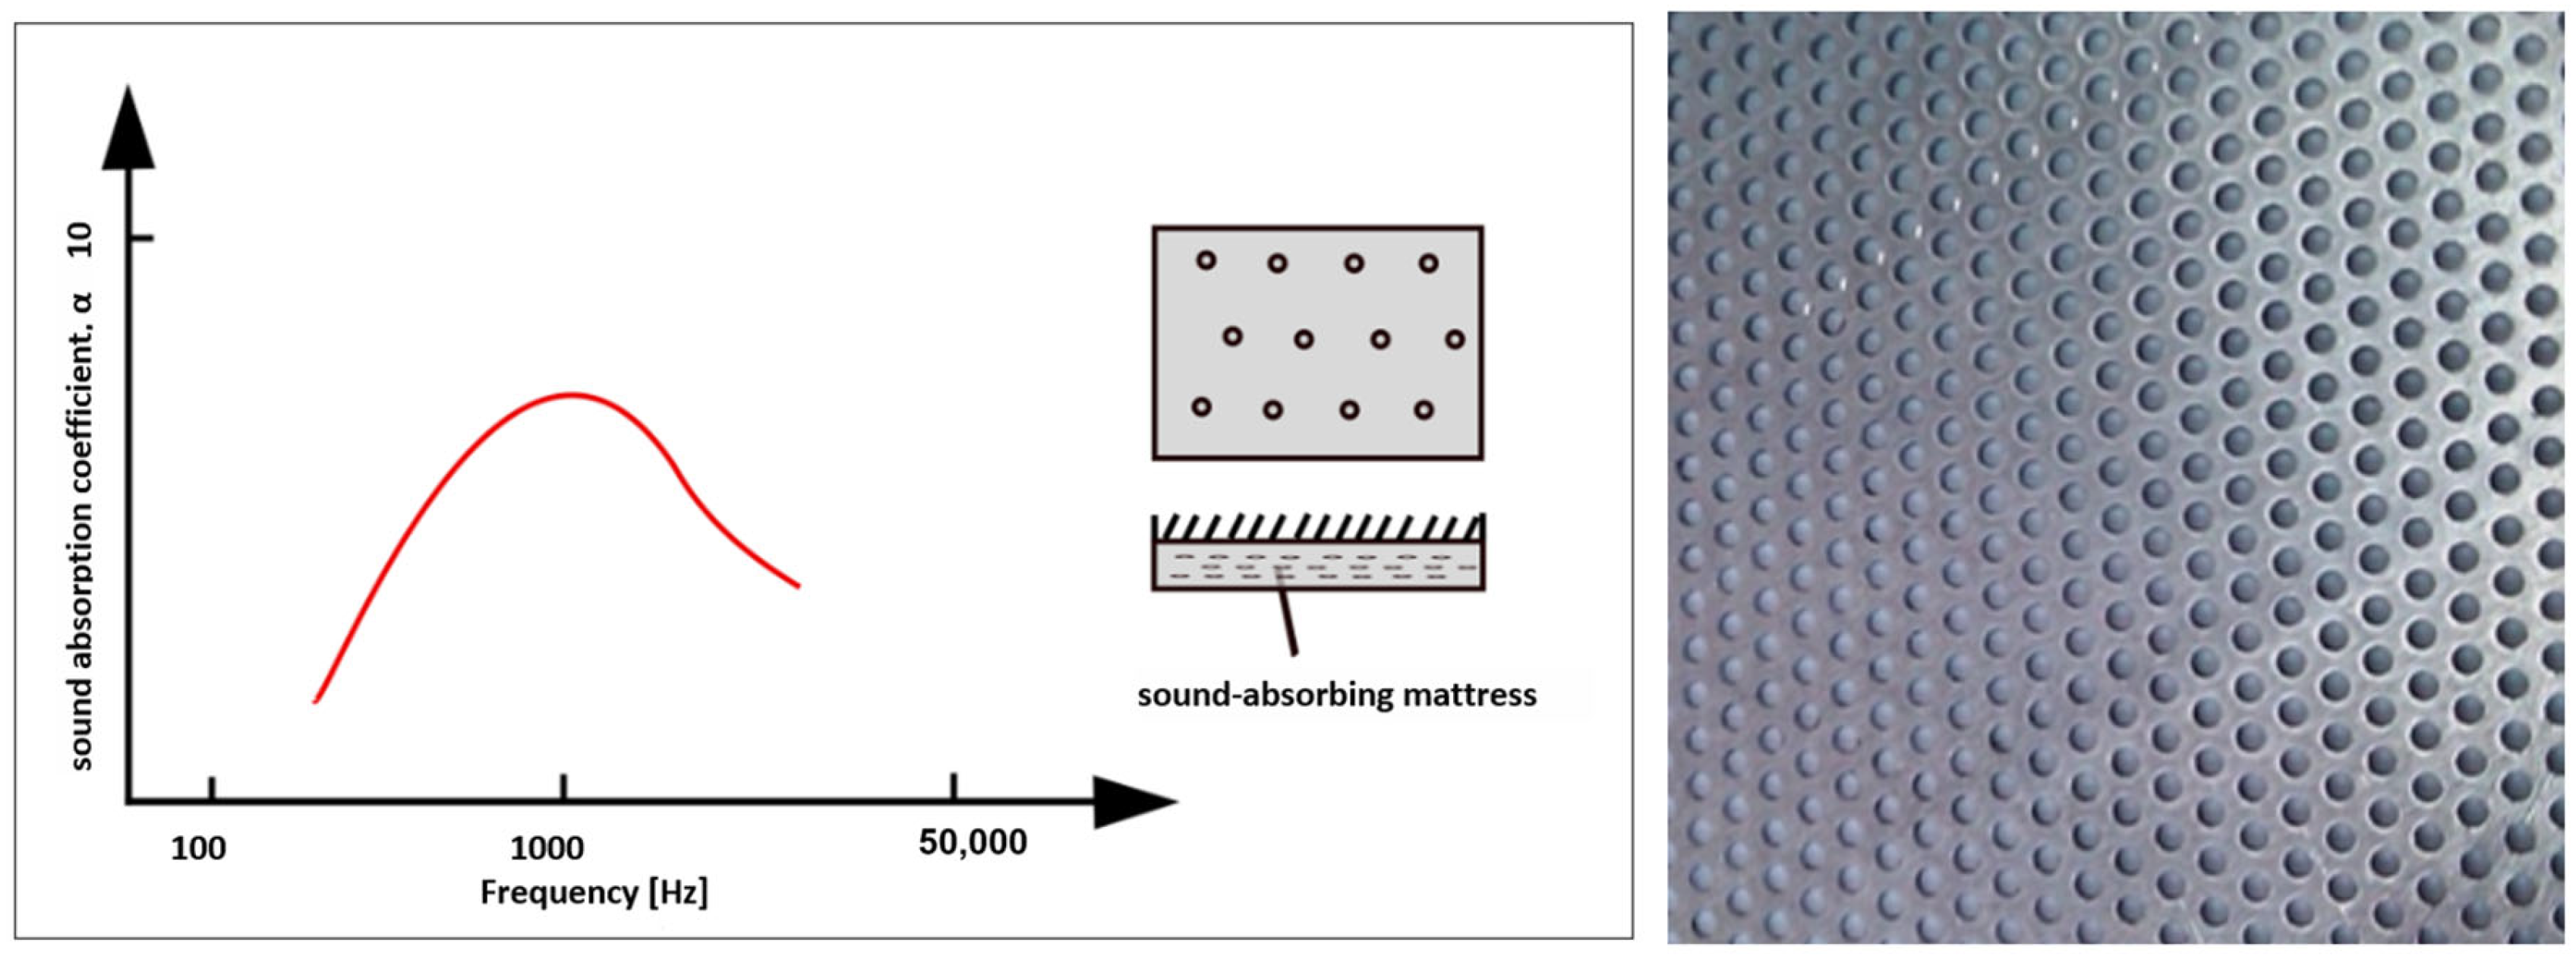
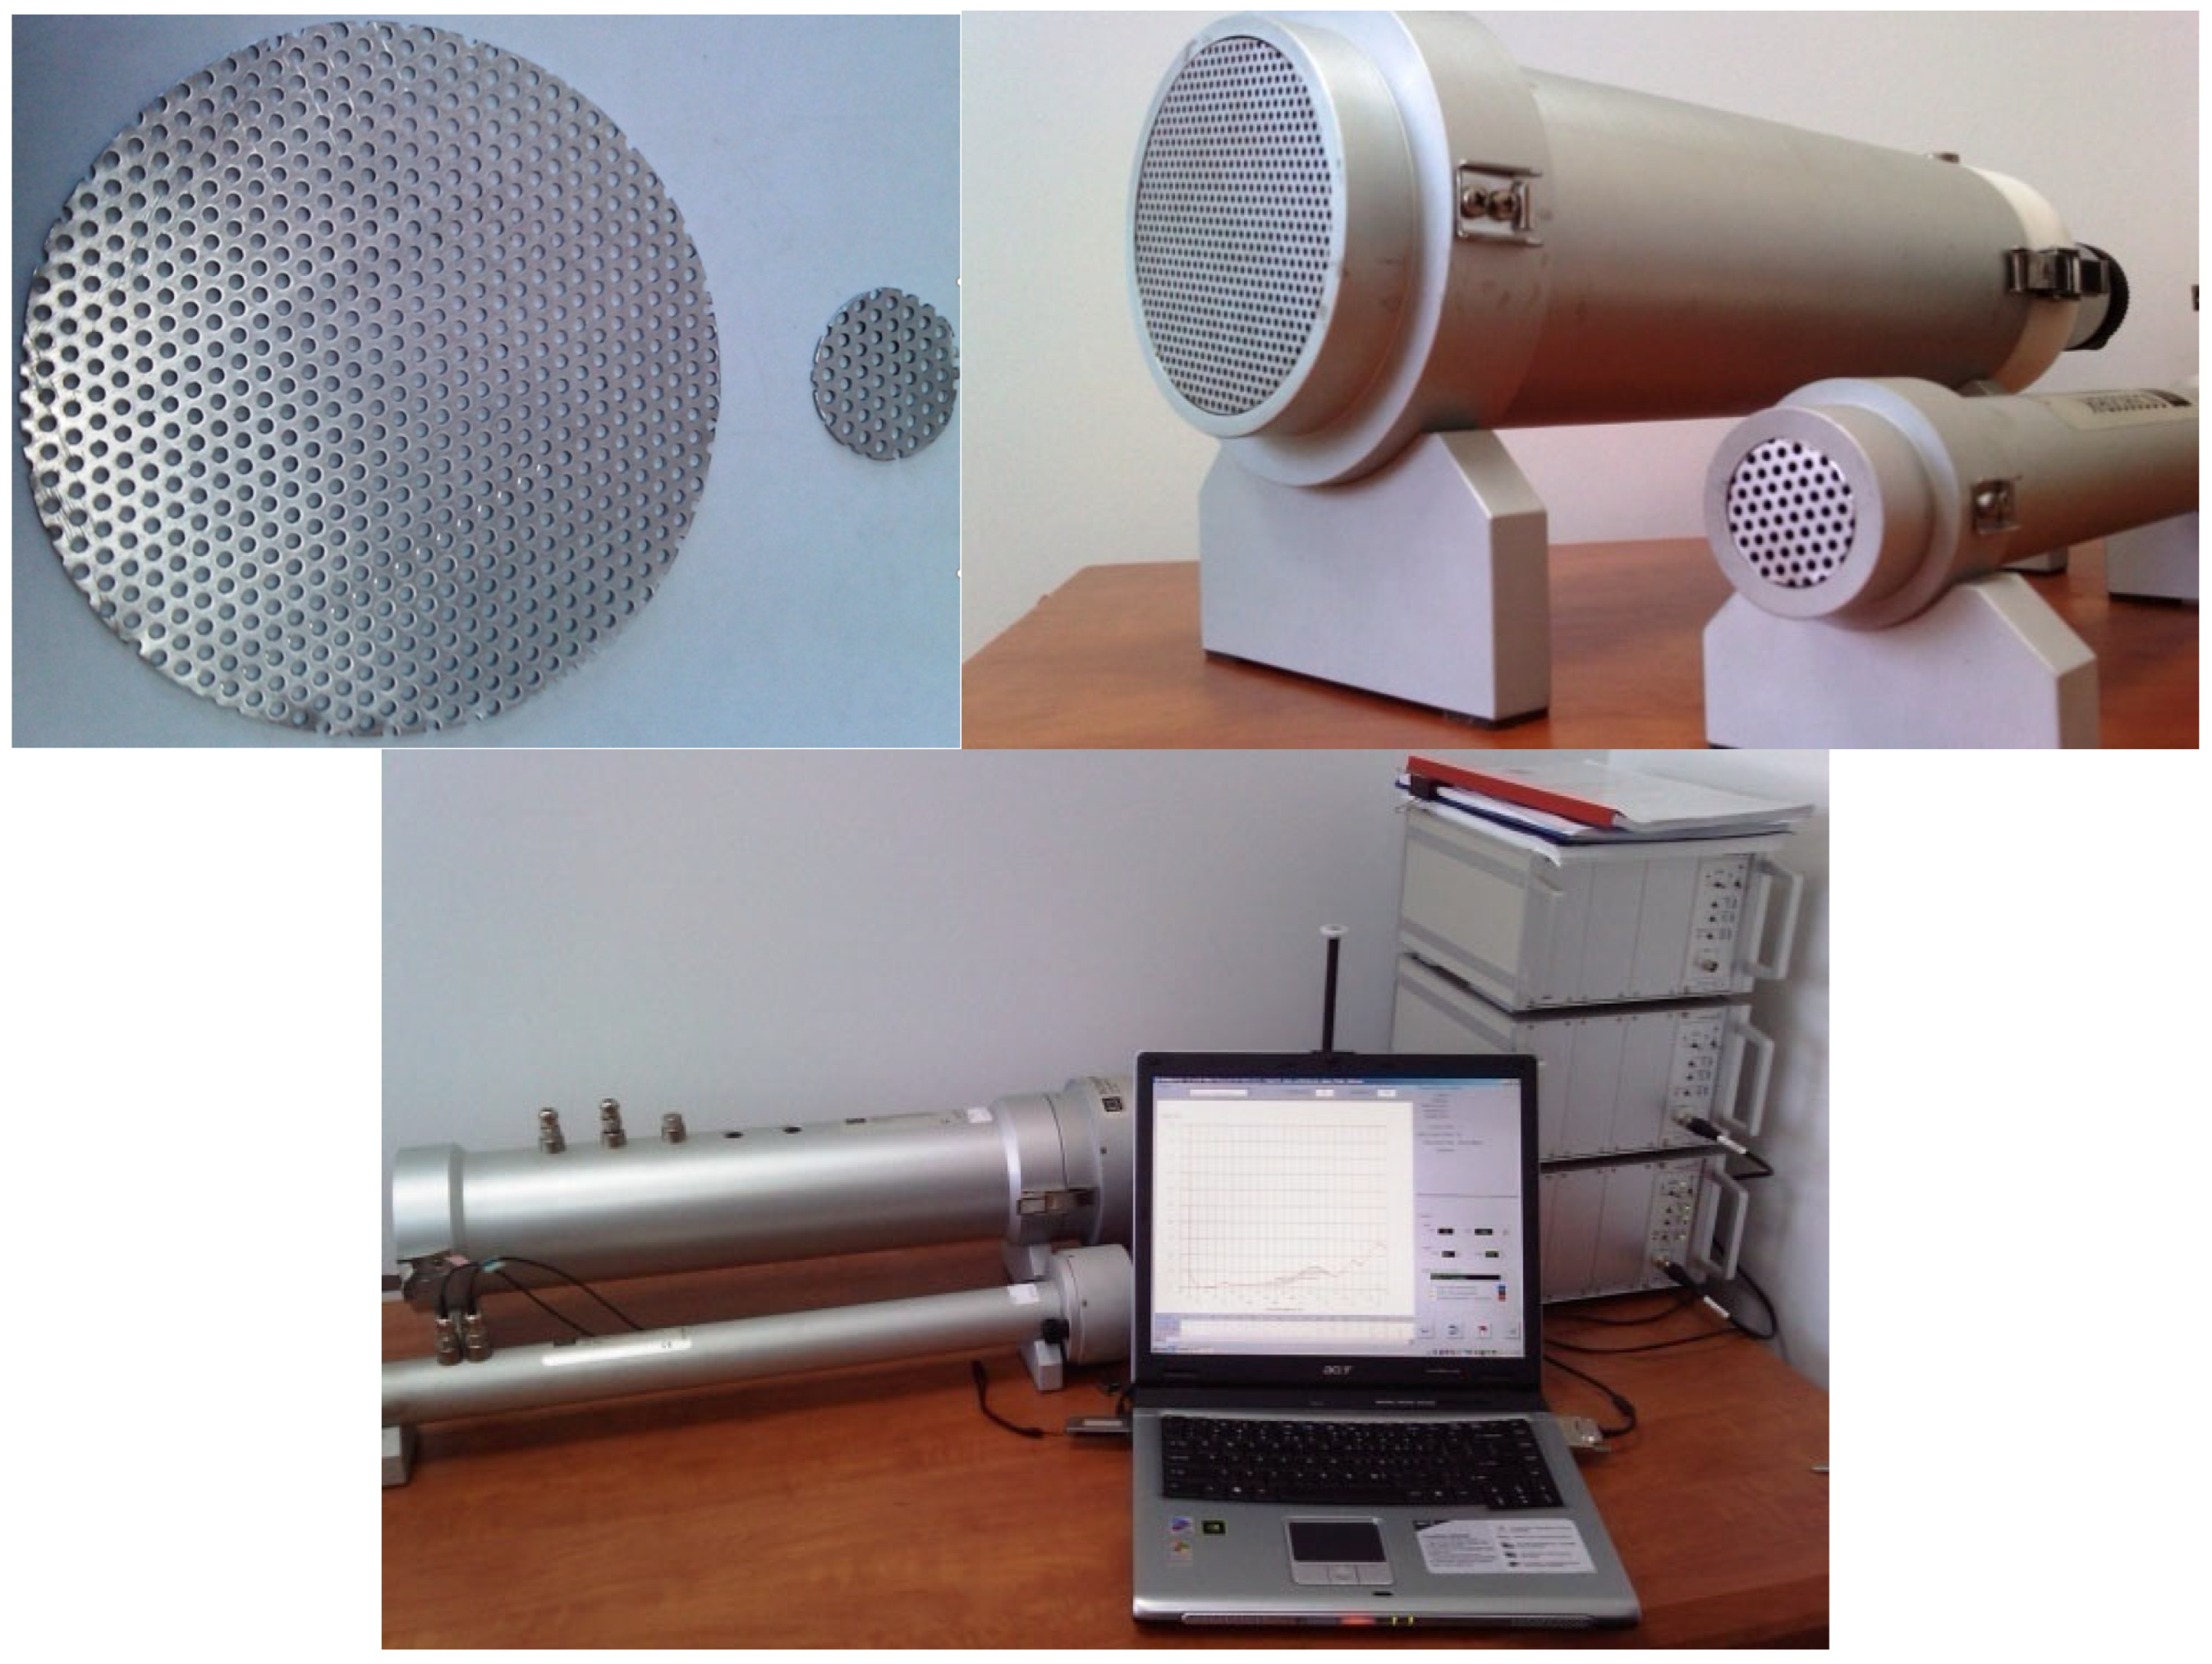
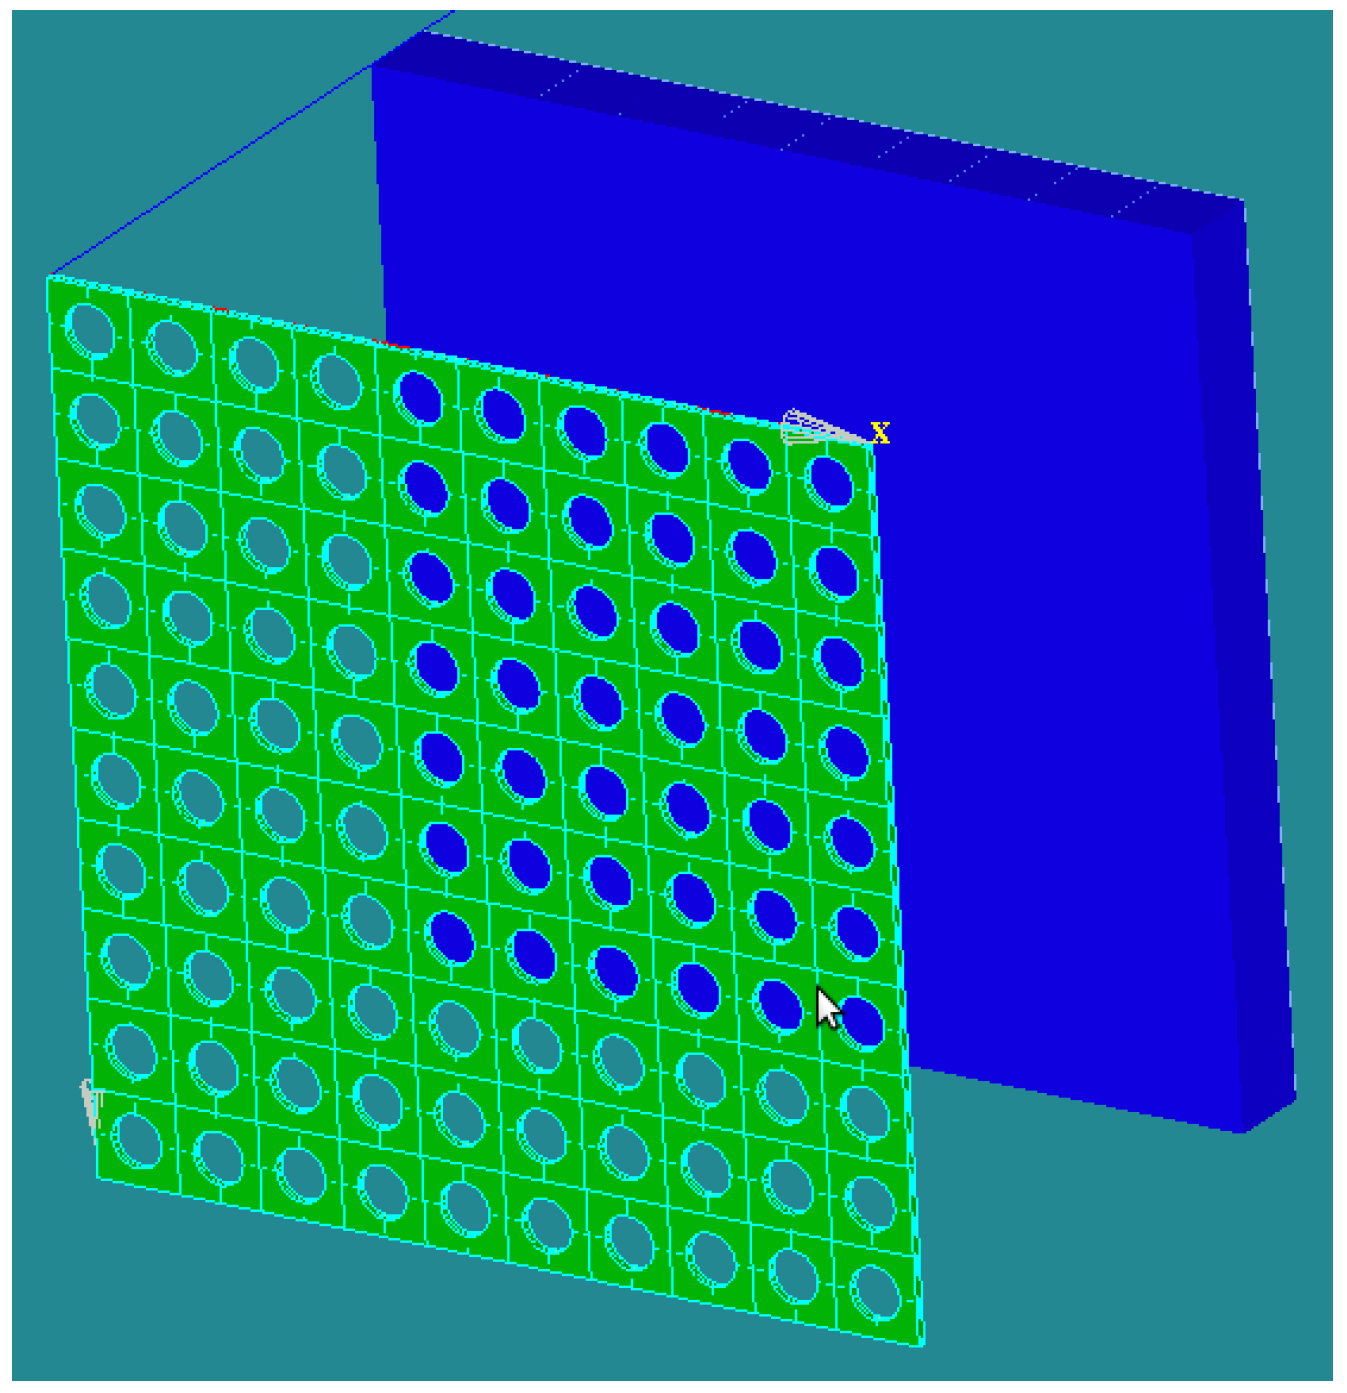
2.2.2. Design of Sound-Absorbing Panels

The novel design of the resonance-absorbent screen will target the area of interest between 1600 Hz and 4000 Hz. The new design will incorporate the benefits of traditional barriers and resonance-absorbent structures for optimal performance.
The resonance-absorbent structures consist of interconnected resonators, created by perforating holes in a plate mounted at a specific distance from a rigid wall, as shown in Figure 12. By inserting a porous absorbent material into the space between the plate and the wall, the system’s absorption efficiency can be significantly improved.
The frequency band of such a system can be calculated using Equation (1) [40]:
f = 4 π f 0 λ 0 D
where:
-
D is the distance of the plate from the rigid wall;
-
f 0 is the frequency of resonance;
-
λ 0 (m) is the wavelength at resonance.
The frequency of resonance is established by the size of the resonator’s neck and the volume of air in the cavity. By adjusting the distance of the plate from the wall and the density of the porous material in the cavity, the frequency band can be broadened to cover up to three octaves.
To ensure low costs for the new absorbent structure, round perforated plates that are widely available on the market were selected and five types of perforated plates were considered for the study, as presented in Table 3.
To determine the optimal perforated plate for our application and for the established frequency range of interest, the distance between the perforated plate and the unperforated plate was varied from 10 to 100 mm, increasing in increments of 10 mm, and the resonance frequency and bandwidth of each plate were calculated. The results are presented in Table 4. For each scenario, the bandwidth (Hz) was identical.
Based on the above calculations, plate number 1 exhibits the broadest frequency range. To confirm the calculations obtained for plate 1 and acoustically characterize the plate, measurements of the sound absorption coefficient were carried out using an impedance tube (Kundt tube, Figure 13) according to the UNI EN ISO 10534 2 standard [41,42].
Following the experiments using the Kundt tubes, the absorption coefficient was calculated. The results are presented in the graph displayed in Figure 14.
The comparative analysis revealed that the optimal distance between the perforated plate and the unperforated rigid plate is 30 mm. At this distance, the perforated plate maintains its highest absorption coefficient over the broadest frequency range (1.25 kHz–5 kHz). This frequency range is important to analyze because it includes the resonance frequencies of the auditory canal of the human ear. Additionally, the best absorption coefficient for a frequency of 1.25 kHz–5 kHz (which was identified in the spectra obtained for the CFM56 regime at 100%) was obtained at a distance of 30 mm, as demonstrated in Figure 15.
The features of the newly designed resonance-absorbent screen, intended to reduce airport noise, are:
  • a perforated plate, with a thickness of 1 mm × perforation diameter of 2 mm × the distance between the centers of perforations 4 mm;
  • a rigid unperforated plate, with a thickness of 10 mm, and a weight of 12 kg/m2;
  • distance between the two plates = 30 mm;
  • minimum height = 4 m.
The proposed material for the construction of the screen is a transparent plastic (polycarbonate) that possesses highly effective acoustic properties. In addition to excellent sound insulation, it offers high impact resistance, requires no maintenance, and has flame-retardant properties, which prevent fire propagation. It is lightweight and comes in a variety of design options.
Plastic sound-absorbing screens exhibit exceptional resistance to extreme weather conditions at both very low and very high temperatures, without suffering any damage. The proposed resonance-absorbent screen is presented in a schematic form in Figure 16.

2.2.3. Acoustic Prediction

The estimation of noise reduction was performed using the IMMI prediction program. IMMI is fully compliant with the latest European guidance on noise modeling. This guidance document represents internationally agreed best practices, as implemented in modern aircraft noise models. The IMMI program system is a detailed noise-mapping software system that also simulates noise events. This program provides algorithms to calculate noise propagation from various types of sounds. IMMI supports the standard data acquisition system used for airports and airfields, which significantly simplifies and speeds up data preparation and input, making the simulation and the frequent calculation of reception points with new input data extremely facile and fast to process [43].
IMMI has also been utilized in Ref. [44] and other studies that model aircraft noise around airports [45]. IMMI comprises:
  • Uploading the noise spectrum produced by the CFM56 turbojet engine, measured on the ground, taking into consideration the directivity and the creation of the noise contour;
  • Modeling the designed screen into IMMI, incorporating the absorption coefficient, as determined in the laboratory;
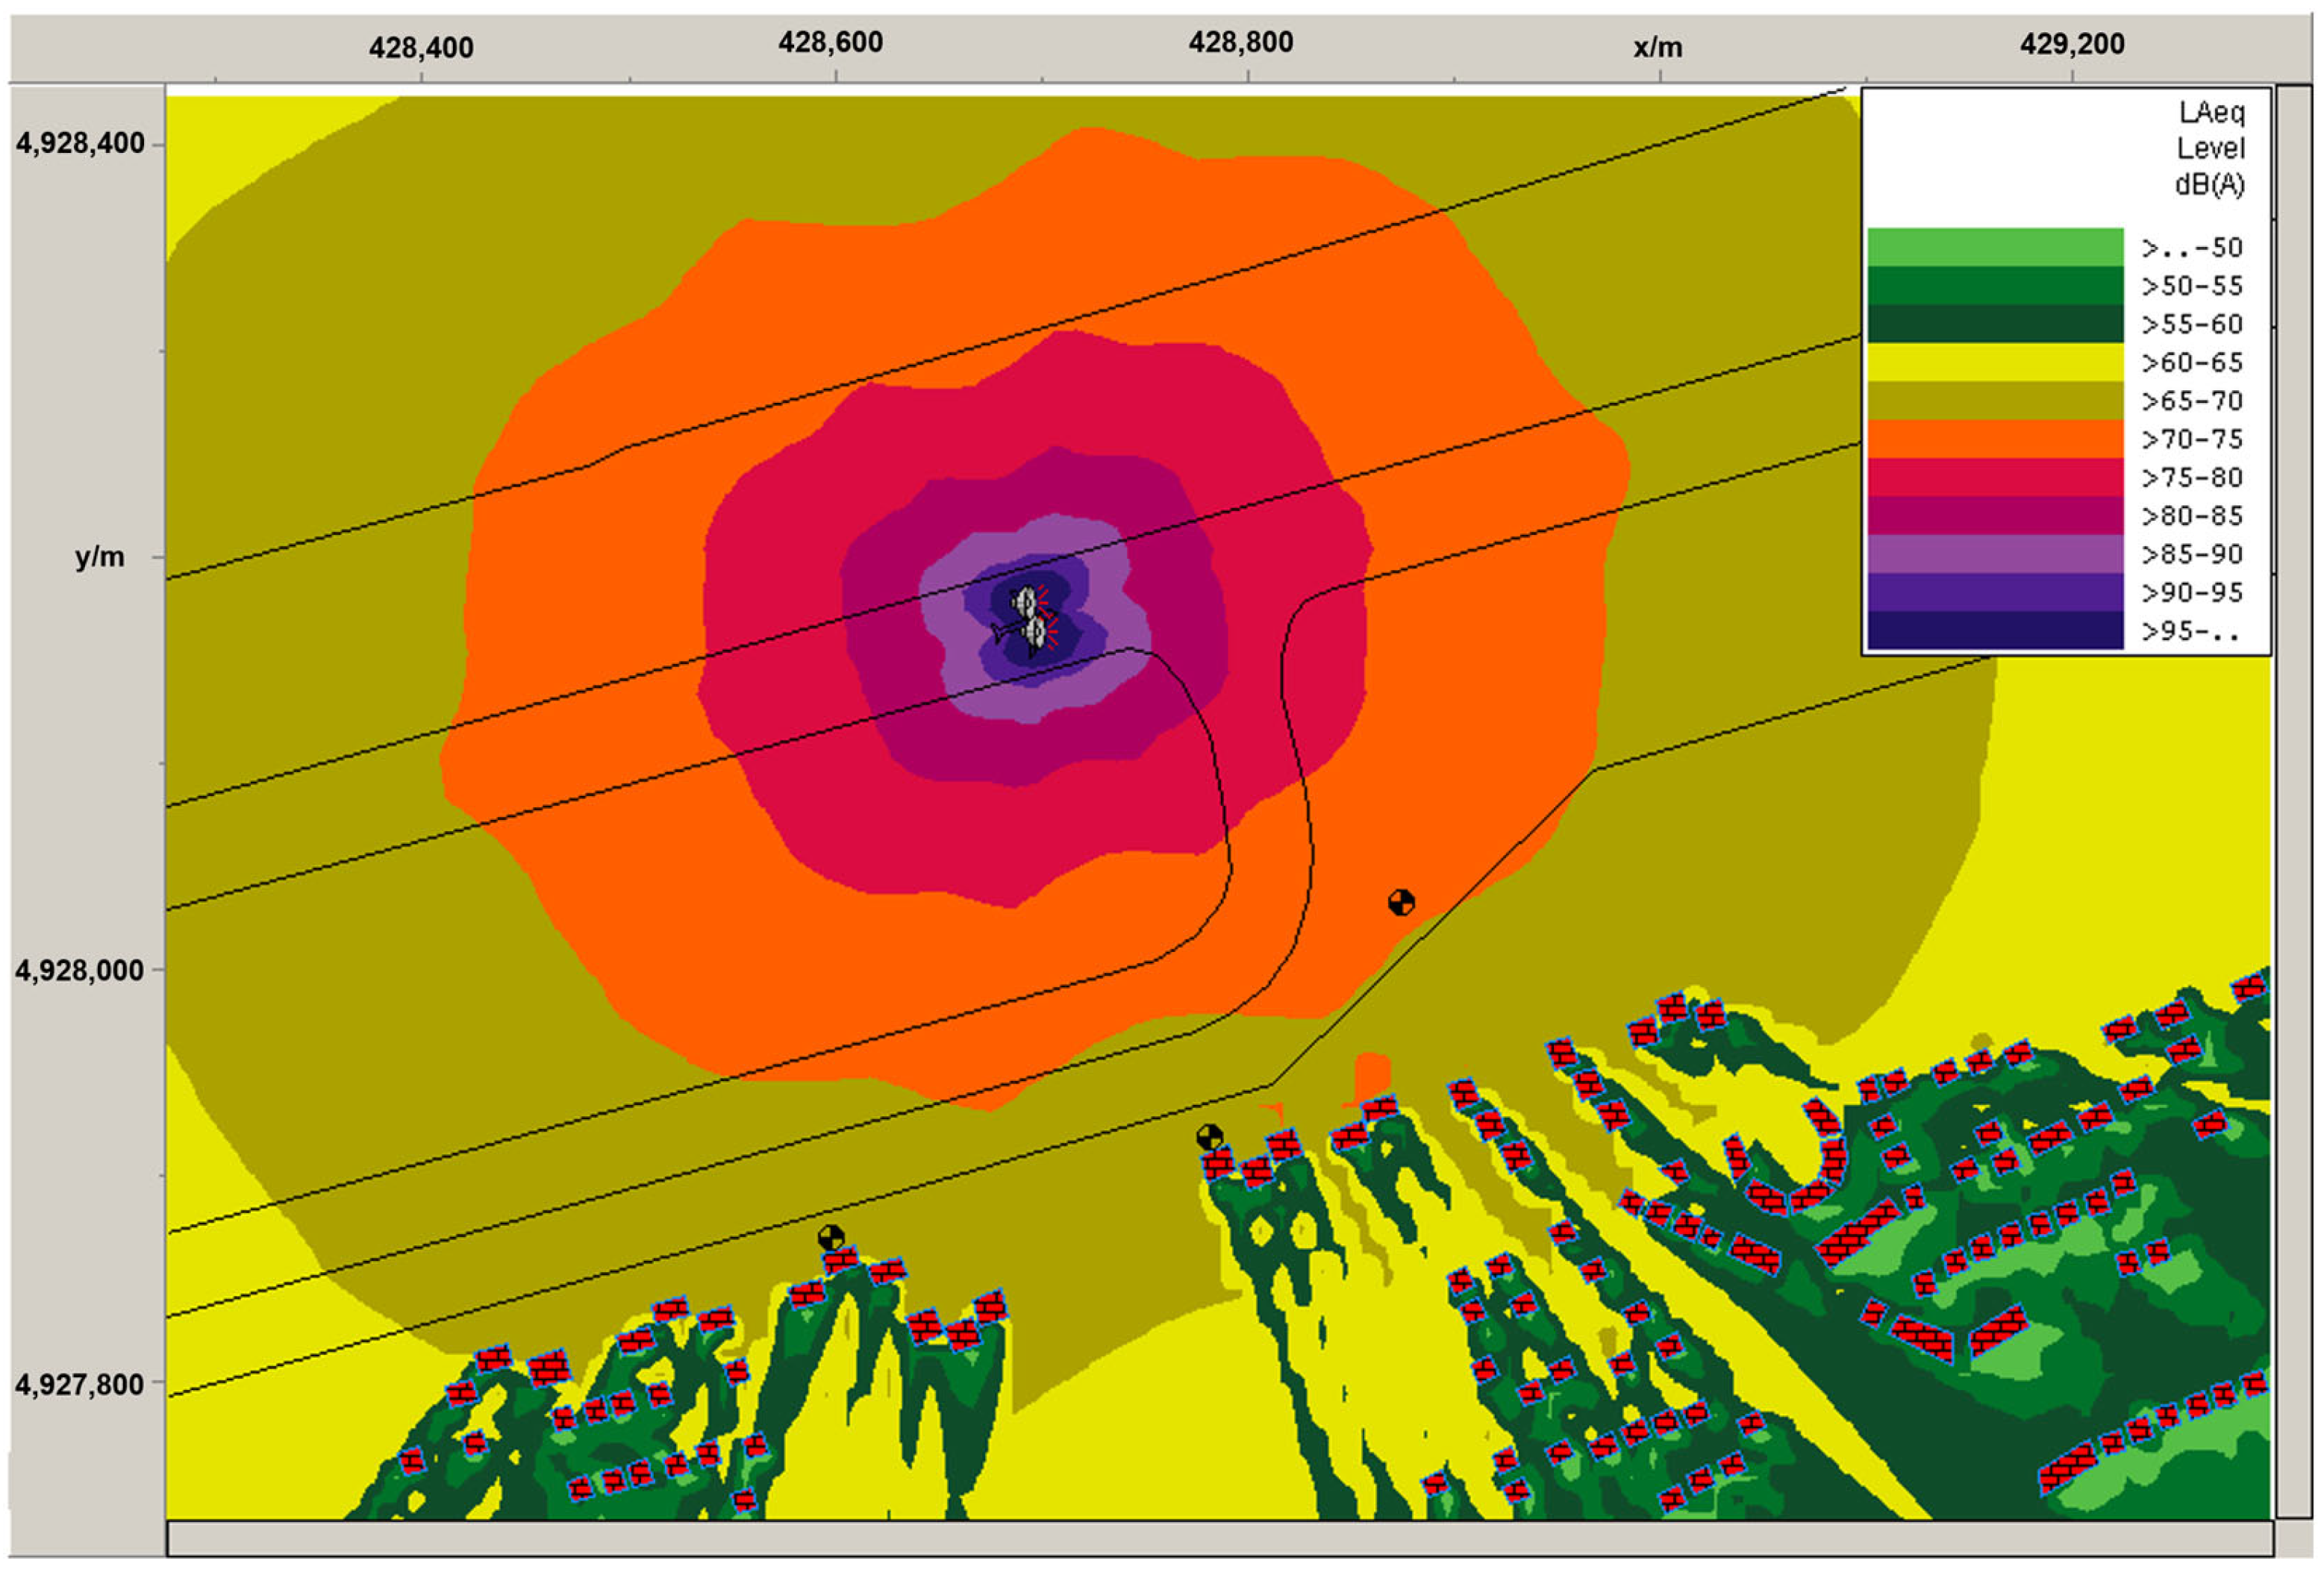
  • Creating the noise contour with the resonance-absorbent screen;
  • Comparing the two contours and assessing the noise reduction.
The objective was to numerically simulate the noise impact produced by the CFM56 turbojet engine (ground operation) and to determine the noise propagation in the adjacent residential area.
The number of buildings and the footprint of each building were determined using Google Maps, then, on the basis of visual observations made on site, the heights of groups of similar buildings in the area of interest were measured with the help of a telemeter.
The sound power spectra (1/1 octave) recorded in dB at the maximum regime, as presented in Table 4, were incorporated into the simulation, assuming a measurement surface area of 1963.50 m2. The calculation area was set at 60 m × 60 m, with a grid resolution of 1 m.

3. Results and Discussion

As shown in Figure 3 and Figure 5, which represent Google Maps captures of the airports, the houses are located close to the runway. Thus, it is necessary to assess the impact of aircraft engine noise on these buildings during the maximum regime and to estimate the noise reduction provided by the proposed solution.
The results are displayed in Figure 17.
To simulate the noise produced by an aircraft during ground operation (taxiing), the source depicted in Figure 17 was duplicated, assuming a mirroring of the directivity vectors. Additionally, the calculation area was expanded to 1000 m × 700 m and the grid resolution was increased to 10 m, then the houses in the neighboring residential area were positioned. The resulting output is shown in Figure 18.
For this study, the area of buildings closest to the runway was selected, as shown in Figure 19.
By utilizing the input data described above, a noise contour incorporating the resonance-absorbent screen was obtained, as shown in Figure 20.
By comparing the two noise contours, it is clear that the reduction achieved by incorporating the redesigned resonance-absorbent screen can reach up to 15 dB, depending on the location of the houses. There are no houses that are exposed to more than 65 dBA in the model, according to Figure 20.
This reduction can be further improved by increasing the height of the screen. Moreover, in areas where houses are closer to the runway, a higher screen height can be used than in those areas where the houses are further away from the runway. It should be noted that the reduction obtained via the prediction software program is consistent with that obtained through calculation. The difference between the two results is due to the positioning of the noise source; in the prediction, the center of the runway is treated as the noise source, while in the calculation, the location closest to the houses is designated as the noise source.

4. Conclusions and Future Studies

Considering the potential rerouting of aeronautic traffic from Otopeni Airport to Baneasa Airport, this study was conducted based on the fact that most of the aircraft operating at OTP are equipped with CFM 56-type engines. Thus, the first step of this research involved measuring the directivity of a CFM 56 engine mounted on an aircraft, during both the idling and maximum-load regimes.
The second step involved designing a sound-absorbing panel through the evaluation of various perforated plate configurations via impedance tubes. Using the directivity data, a simulation was performed using the IMMI software, with the two engines of an aircraft serving as the acoustic power source and the directivity obtained from the experiments. The simulation was performed for the maximum operating regime of the engines when the plane was taking off and was on the ground, assuming a location in the vicinity of the area where the houses are closest to the runway. The subsequent round of simulations was performed by incorporating a panel with the characteristics determined in the laboratory and a height of 4 m. This panel would be made of fireproof and weather-resistant material and would be transparent, avoiding any visual disruptions or alterations to the local landscape for the residents in the area.
The comparison showed a reduction in Leq of approximately 15 dB. These simulations indicate that Baneasa Airport could accommodate aircraft with CFM 56 engines without causing additional acoustic impact to the inhabited area surrounding the runway. The noise reduction could be improved further by increasing the height of the panel.
A 15 dB reduction in Leq is considered to be a substantial improvement in terms of reducing the noise impact on those living near the airport. However, the actual impact on the residents would vary, based on factors such as the initial noise levels, the residents’ sensitivity to noise, and the duration and frequency of noise exposure. Further assessments are necessary to fully determine the impact.
In the future, we aim to expand this study to include other types of aircraft equipped with different types of turbo engines. Additionally, we plan to conduct a study using different types of sound-absorbing panels. Another research direction will involve simulating aircraft movement on the take-off runway, using specialized software.

Author Contributions

Conceptualization, A.C.T. and G.C.; methodology, G.C. and D.-E.C.; software, A.C.T.; validation, G.C.; formal analysis, D.-E.C.; investigation, A.C.T. and G.C.; resources, A.C.T.; data curation, A.C.T. and G.C.; writing—original draft preparation, A.C.T., G.C. and D.-E.C.; writing—review and editing, A.C.T., G.C. and D.-E.C.; visualization, G.C.; supervision, D.-E.C.; project administration, A.C.T. All authors have read and agreed to the published version of the manuscript.

Funding

This work has been carried out through the NUCLEU Program within the National Research, Development and Innovation Plan 2022–2027, implemented with the support of MCID, project no. PN23.12.03.01.

Institutional Review Board Statement

Not applicable.

Informed Consent Statement

Not applicable.

Data Availability Statement

Not applicable.

Conflicts of Interest

The authors declare no conflict of interest.

References

  1. Available online: https://www.bucharestairports.ro/en/ (accessed on 23 July 2023).
  2. European Aviation Environmental Report 2019. Available online: https://www.eurocontrol.int/publication/european-aviation-environmental-report-2019 (accessed on 23 July 2023).
  3. Clarke, J.P. A systems analysis of noise abatement procedures enabled by advance flight guidance technology. AIAA J. Aircr. 2000, 37, 266–273. [Google Scholar] [CrossRef]
  4. Can, A.; Aumond, P. Estimation of road traffic noise emissions: The influence of speed and acceleration. Transp. Res. Part D Transp. Environ. 2018, 58, 155–171. [Google Scholar] [CrossRef]
  5. Bunn, F.; Zannin, P.H.T. Assessment of railway noise in an urban setting. Appl. Acoust. 2016, 104, 16–23. [Google Scholar] [CrossRef]
  6. Gagliardi, P.; Fredianelli, L.; Simonetti, D.; Licitra, G. Ads-B system as a useful tool for testing and redrawing noise management strategies at Pisa airport. Acta Acust. United Acust. 2017, 103, 543–551. [Google Scholar] [CrossRef]
  7. Iglesias-Merchan, C.; Diaz-Balteiro, L.; Soliño, M. Transportation planning and quiet natural areas preservation: Aircraft overflights noise assessment in a National Park. Transp. Res. Part D Transp. Environ. 2015, 41, 1–12. [Google Scholar] [CrossRef]
  8. Deaconu, M.; Cican, G. Turbojet Test Cell and Noise Impact Assessment in the Vicinity of Romanian Research and Development Institute for Gas Turbines COMOTI. Acoust. Aust. 2018, 46, 249–257. [Google Scholar] [CrossRef]
  9. Deaconu, M.; Cican, G.; Toma, A.-C.; Drăgășanu, L.I. Helicopter Inside Cabin Acoustic Evaluation: A Case Study—IAR PUMA 330. Int. J. Environ. Res. Public Health 2021, 18, 9716. [Google Scholar] [CrossRef]
  10. Snellen, M.; Merino-Martinez, R.; Simons, D.G. Assessment of noise variability of landing aircraft using phased microphone array. J. Aircr. 2017, 54, 2173–2183. [Google Scholar] [CrossRef] [Green Version]
  11. Merino-Martinez, R.; Heblij, S.J.; Bergmans, D.H.T.; Snellen, M.; Simons, D.G. Improving aircraft noise predictions considering fan rotational speed. J. Aircr. 2018, 56, 284–294. [Google Scholar] [CrossRef]
  12. Faiyetole, A.A.; Ibrahim, T.T. Predicting the aircraft takeoff noise level. Vibroengineering Procedia 2019, 22, 129–134. [Google Scholar] [CrossRef] [Green Version]
  13. Vieira, A.; Mehmood, U.; Merino-Martinez, R.; Snellen, M.; Simons, D.G. Variability of sound quality metrics for different aircraft types during landing and takeoff. In Proceedings of the 25th AIAA/CEAS Aeroacoustics Conference, Delft, The Netherlands, 20–24 May 2019. [Google Scholar] [CrossRef]
  14. Faulkner, J.-P.; Murphy, E. Estimating the harmful effects of environmental transport noise: An EU study. Sci. Total. Environ. 2022, 811, 152313. [Google Scholar] [CrossRef] [PubMed]
  15. Ozkurt, N.; Sari, D.; Akdag, A.; Kutukoglu, M.; Gurarslan, A. Modeling of noise pollution and estimated human exposure around İstanbul Atatürk Airport in Turkey. Sci. Total. Environ. 2014, 482–483, 486–492. [Google Scholar] [CrossRef] [PubMed]
  16. Bentes, F.M.; Heleno, T.A.; Slama, J.G. Analysis of airport noise exposure around Viracopos International Airport using geographic information systems. J. Air Transp. Manag. 2013, 31, 15–17. [Google Scholar] [CrossRef]
  17. Wolfe, P.J.; Kramer, J.L.; Barrett, S.R. Current and future noise impacts of the UK hub airport. J. Air Transp. Manag. 2017, 58, 91–99. [Google Scholar] [CrossRef]
  18. Vogiatzis, K. Airport environmental noise mapping and land use management as an environmental protection action policy tool. The case of the Larnaka International Airport (Cyprus). Sci. Total Environ. 2012, 424, 162–173. [Google Scholar] [CrossRef] [PubMed]
  19. Ozkurt, N.; Hamamci, S.F.; Sari, D. Estimation of airport noise impacts on public health. A case study of Izmir Adnan Menderes Airport. Transp. Res. Part D 2015, 36, 152–159. [Google Scholar] [CrossRef]
  20. Püschel, R.; Evangelinos, C. Evaluating noise annoyance cost recovery at Düsseldorf International Airport. Transp. Res. Part D 2012, 17, 598–604. [Google Scholar] [CrossRef]
  21. Rahmatian, M.; Cockerill, L. Airport noise and residential housing valuation in southern California: A hedonic pricing approach. Int. J. Environ. Sci. Technol. 2004, 1, 17–25. [Google Scholar] [CrossRef] [Green Version]
  22. Zhao, K.; Okolo, P.; Neri, E.; Chen, P.; Kennedy, J.; Bennett, G.J. Noise reduction technologies for aircraft landing gear-A bibliographic review. Prog. Aerosp. Sci. 2020, 112, 100589. [Google Scholar] [CrossRef]
  23. Cican, G.; Deaconu, M.; Crunteanu, D.-E. Impact of Using Chevrons Nozzle on the Acoustics and Performances of a Micro Turbojet Engine. Appl. Sci. 2021, 11, 5158. [Google Scholar] [CrossRef]
  24. Cican, G.; Frigioescu, T.-F.; Crunteanu, D.-E.; Cristea, L. Micro Turbojet Engine Nozzle Ejector Impact on the Acoustic Emission, Thrust Force and Fuel Consumption Analysis. Aerospace 2023, 10, 162. [Google Scholar] [CrossRef]
  25. Gasco, L.; Asensio, C.; de Arcas, G. Communicating airport noise emission data to the general public. Sci. Total Environ. 2017, 586, 836–848. [Google Scholar] [CrossRef] [PubMed]
  26. Mir, M.; Nasirzadeh, F.; Bereznicki, H.; Enticott, P.; Lee, S.; Mills, A. Construction noise effects on human health: Evidence from physiological measures. Sustain. Cities Soc. 2023, 91, 104470. [Google Scholar] [CrossRef]
  27. Basner, M.; Clark, C.; Hansell, A.; Hileman, J.I.; Janssen, S.; Shepherd, K.; Sparrow, V. Aviation noise impacts: State of the science. Noise Health 2017, 19, 41. [Google Scholar] [CrossRef] [PubMed]
  28. Clark, C.; Paunovic, K. WHO environmental noise guidelines for the European region: A systematic review on environmental noise and quality of life, wellbeing and mental health. Int. J. Environ. Res. Public Health 2018, 15, 2400. [Google Scholar] [CrossRef] [Green Version]
  29. Faiyetole, A.A.; Sivowaku, J.T. The effects of aircraft noise on psychosocial health. J. Transp. Health 2021, 22, 101230. [Google Scholar] [CrossRef]
  30. Basner, M.; Babisch, W.; Davis, A.; Brink, M.; Clark, C.; Jansen, S.; Stansfeld, S. Auditory and nonauditory effects of noise on health. Lancet 2013, 383, 1325–1332. [Google Scholar] [CrossRef] [Green Version]
  31. Swift, H. A Review of the Literature Related to Potential Health Effects of Aircraft Noise. PARTNER Project 19 Final Report; Federal Aviation Administration. Office of Environment and Energy: Washington, DC, USA, 2010.
  32. Jarup, L.; Babisch, W.; Houthuijs, D.; Pershagen, G.; Katsouyanni, K.; Cadum, E.; Dudley, M.-L.; Savigny, P.; Seiffert, I.; Swart, W.; et al. Hypertension and exposure to noise near airports—The HYENA Study. Environ. Health Perspect. 2008, 116, 329–333. [Google Scholar] [CrossRef]
  33. Schmidt, F.P.; Kolle, K.; Kreuder, K.; Schnorbus, B.; Wild, P.; Hechtner, M.; Binder, H.; Gori, T.; Munzel, T. Nighttime aircraft noise impairs endothelial function and increases blood pressure in patients with or at high risk for coronary artery disease. Clin. Res. Cardiol. 2015, 104, 23–30. [Google Scholar] [CrossRef] [Green Version]
  34. Babisch, W.; Pershagen, G.; Selander, J.; Houthuijs, D.; Breugelmans, O.; Cadum, E.; Vigna-Taglianti, F.; Katsouyanni, K.; Haralabidis, A.S.; Dimakopoulou, K.; et al. Noise annoyance—A modifier of the association between noise level and cardiovascular health? Sci. Total Environ. 2013, 50–57, 452–453. [Google Scholar] [CrossRef]
  35. Available online: https://www.bucharestairports.ro/cnab/en/general-info/air-traffic-statistics (accessed on 23 July 2023).
  36. Available online: https://www.bucharestairports.ro/baneasa/en/about/technical-facts (accessed on 23 July 2023).
  37. Available online: https://www.cfmaeroengines.com/engines/cfm56/ (accessed on 23 July 2023).
  38. Torija, A.; Self, R. Aircraft classification for efficient modelling of environmental noise impact of aviation. J. Air Transp. Manag. 2018, 67, 157–168. [Google Scholar] [CrossRef] [Green Version]
  39. Toma, A.C. Contributions on Airport Noise Monitoring and Noise Reduction in Surrounding Areas. Ph.D. Thesis, University Politehnica, Bucharest, Romania, 2011. [Google Scholar]
  40. Barron, R.F. Industrial Noise Control and Acoustics; Louisiana Tech University: Ruston, LO, USA, 2003. [Google Scholar]
  41. UNI EN ISO 10534-2; Acoustics—Determination of Sound Absorption Coefficient and Impedance in Impedance Tubes—Part 2: Transfer-Function Method. ISO: Geneva, Switzerland, 1991.
  42. Ciaburro, G.; Parente, R.; Iannace, G.; Puyana-Romero, V. Design Optimization of Three-Layered Metamaterial Acoustic Absorbers Based on PVC Reused Membrane and Metal Washers. Sustainability 2022, 14, 4218. [Google Scholar] [CrossRef]
  43. IMMI. 2016. Available online: https://www.woelfel.de/en/products/immi.html#c42646 (accessed on 20 May 2023).
  44. Josimovic, B.; Krunic, N.; Nenkovic-Riznic, M. The impact of airport noise as part of a Strategic Environmental Assessment, case study: The Tivat (Montenegro) Airport expansion plan. Transp. Res. Part D 2016, 49, 271–279. [Google Scholar] [CrossRef]
  45. Simons, D.G.; Besnea, I.; Mohammadloo, T.H.; Melkert, J.A.; Snellen, M. Comparative assessment of measured and modelled aircraft noise around Amsterdam Airport Schiphol. Transp. Res. Part D Transp. Environ. 2022, 105, 103216. [Google Scholar] [CrossRef]
Figure 1. Effects of noise on human beings.
Applsci 13 09139 g001
Figure 2. Location of Otopeni airport [35].
Applsci 13 09139 g002
Figure 3. Number of passengers (a) and number of air traffic movements (b) at Otopeni Airport.
Applsci 13 09139 g003
Figure 4. Location of Baneasa Airport.
Applsci 13 09139 g004
Figure 5. The number of passengers (a) and the number of movements (b) at Baneasa Airport.
Applsci 13 09139 g005
Figure 6. Locations of the two airports.
Applsci 13 09139 g006
Figure 7. Illustration of the measurement points utilized to determine the sound-pressure level of the CFM 56 engine.
Applsci 13 09139 g007
Figure 8. Comparative analysis of the 1/3 octave spectra for the A-weighted pressure levels of the 12 measurement points (idle regime).
Applsci 13 09139 g008
Figure 9. Comparative analysis of the 1/3 octave spectra for the A-weighted pressure levels of the 12 measurement points (maximum regime).
Applsci 13 09139 g009
Figure 10. Noise polar diagrams for idle mode.
Applsci 13 09139 g010
Figure 11. Noise polar diagrams for maximum mode.
Applsci 13 09139 g011
Figure 12. Resonance-absorbent structures.
Applsci 13 09139 g012
Figure 13. The chosen perforated plate and its evaluation, using Kundt tubes.
Applsci 13 09139 g013
Figure 14. Comparative analysis of the experimental data obtained with the impedance tubes.
Applsci 13 09139 g014
Figure 15. A detailed examination of the comparative analysis of the experimentally obtained data, within the frequency range of 1.25 kHz–5 kHz.
Applsci 13 09139 g015
Figure 16. Resonance-absorbent screen for mitigating airport noise.
Applsci 13 09139 g016
Figure 17. The noise contour obtained for a single CFM56 engine.
Applsci 13 09139 g017
Figure 18. Noise contour mapped for two CFM56 engines.
Applsci 13 09139 g018
Figure 19. Residential area near the Băneasa airport runway.
Applsci 13 09139 g019
Figure 20. The noise contour for two CFM56 engines and the designed screen.
Applsci 13 09139 g020
Table 1. Sound power spectrum of the 1/1 octave for idling mode in dB.
16 Hz31.5 Hz63 Hz125 Hz250 Hz500 Hz1 kHz2 kHz4 kHz8 kHz
Lw187.696.693.796.593.592.289.890.189.994.9
Lw284.596.996.397.198.496.796.292.892.1101.5
Lw384.295.896.196.498.996.696.196.394.8105.8
Lw485.798.097.6101.5102.2100.6100.499.196.5108.5
Lw585.999.098.7100.1103.4101.2101.498.697.6109.0
Lw695.6100.7100.1101.7103.3100.3102.398.999.6112.2
Lw789.598.599.3102.4104.2101.4101.0100.8101.8115.0
Lw895.998.699.7103.0104.4102.9103.7101.7102.4114.5
Lw994.898.1101.2105.8107.2105.3106.8104.8105.9116.6
Lw1088.797.5101.2106.0107.6106.9106.7101.9102.0107.9
Lw1196.899.4102.7108.2107.0107.0110.3110.6113.5118.4
Lw1292.3102.0105.6109.9106.1113.6115.2113.1116.5121.6
Table 2. The 1/1 octave sound power spectrum for maximum mode, shown in dB.
16 Hz31.5 Hz63 Hz125 Hz250 Hz500 Hz1 kHz2 kHz4 kHz8 kHz
Lw191.4102.6108.4113.7114.7115.1117.1124.9121.3116.7
Lw293.5104.6106.6116.0116.4116.4116.9125.1123.8119.0
Lw393.4103.1108.6116.2115.9116.3115.1121.3119.7115.3
Lw496.1102.9111.4116.8119.3119.5115.2118.8117.6115.9
Lw595.8103.0110.2117.4118.3117.6112.7113.7115.6115.4
Lw696.2104.6110.3115.9118.0116.9111.8110.1112.6116.1
Lw796.4103.9111.8117.8118.3116.6110.6108.8108.3117.0
Lw897.6104.3112.9117.6118.3117.4114.7110.5110.5118.3
Lw998.2105.4114.6121.4122.3121.3119.3115.7116.6126.4
Lw1097.9104.6114.1121.0123.5123.3124.1121.0119.8129.2
Lw11100.3104.8114.2120.9123.9121.6120.5118.1118.8125.6
Lw12100.8106.4118.0123.4122.9121.5120.5117.3119.6123.6
Table 3. The perforated plate types used for the experiments.
Thickness (mm)Perforation Diameter
(mm)
Distance between the Centers of the Perforations
(mm)
plate_1124
plate_2138
plate_31812
plate_4336
plate_5348
Table 4. Outcomes obtained from the analyzed scenarios.
Plate 1Plate 2Plate 3Plate 4Plate 5
The distance between the plate and the wall10 mm
The resonance frequency [Hz]4702.483084.1523716.5232633045.22
The minimum frequency [Hz]2143.481792.101956.111842.731780.59
The maximum frequency [Hz]10,316.565307.737061.225777.925208.01
The distance between the plate and the wall20 mm
The resonance frequency [Hz]3325.1582180.822627.982307.292153.29
The minimum frequency [Hz]1181.901043.241111.021064.731038.28
The maximum frequency [Hz]9354.984558.876216.134999.924465.70
The distance between the plate and the wall30 mm
The resonance frequency [Hz]2714.981780.642145.741883.891758.16
The minimum frequency [Hz]819.67744.30782.07756.46741.47
The maximum frequency [Hz]8992.754259.935887.174691.654168.89
The distance between the plate and the wall40 mm
The resonance frequency [Hz]2351.241542.081858.261631.501522.61
The minimum frequency [Hz]628.13580.54604.77588.42578.70
The maximum frequency [Hz]8801.214096.175709.874523.614006.12
The distance between the plate and the wall50 mm
The resonance frequency [Hz]2103.011379.271662.081459.261361.86
The minimum frequency [Hz]509.38476.53493.43482.07475.23
The maximum frequency [Hz]8682.463992.165598.544417.263902.65
The distance between the plate and the wall60 mm
The resonance frequency [Hz]1919.781259.101517.261332.111243.20
The minimum frequency [Hz]428.48404.42416.89408.53403.45
The maximum frequency [Hz]8601.553920.045522.004343.713830.87
The distance between the plate and the wall70 mm
The resonance frequency [Hz]1777.371165.701404.711233.301150.98
The minimum frequency [Hz]369.79351.40360.99354.57350.65
The maximum frequency [Hz]8542.873867.025466.104289.763778.07
The distance between the plate and the wall80 mm
The resonance frequency [Hz]1662.581090.411313.991153.641076.65
The minimum frequency [Hz]325.26310.74318.35313.27310.14
The maximum frequency [Hz]8498.343826.365423.464248.453737.56
The distance between the plate and the wall90 mm
The resonance frequency [Hz]1567.491028.051238.841087.671015.07
The minimum frequency [Hz]290.31278.56284.74280.62278.07
The maximum frequency [Hz]8463.393794.185389.854215.803705.49
The distance between the plate and the wall100 mm
The resonance frequency [Hz]1487.06975.291175.271031.85962.98
The minimum frequency [Hz]262.15252.44257.57254.15252.03
The maximum frequency [Hz]8435.233768.065362.674189.333679.45
Disclaimer/Publisher’s Note: The statements, opinions and data contained in all publications are solely those of the individual author(s) and contributor(s) and not of MDPI and/or the editor(s). MDPI and/or the editor(s) disclaim responsibility for any injury to people or property resulting from any ideas, methods, instructions or products referred to in the content.

