
Determining Wind Energy Potential Using Geographic Information System Functions: A Case Study in Balıkesir, Turkey


Abstract
:1. Introduction
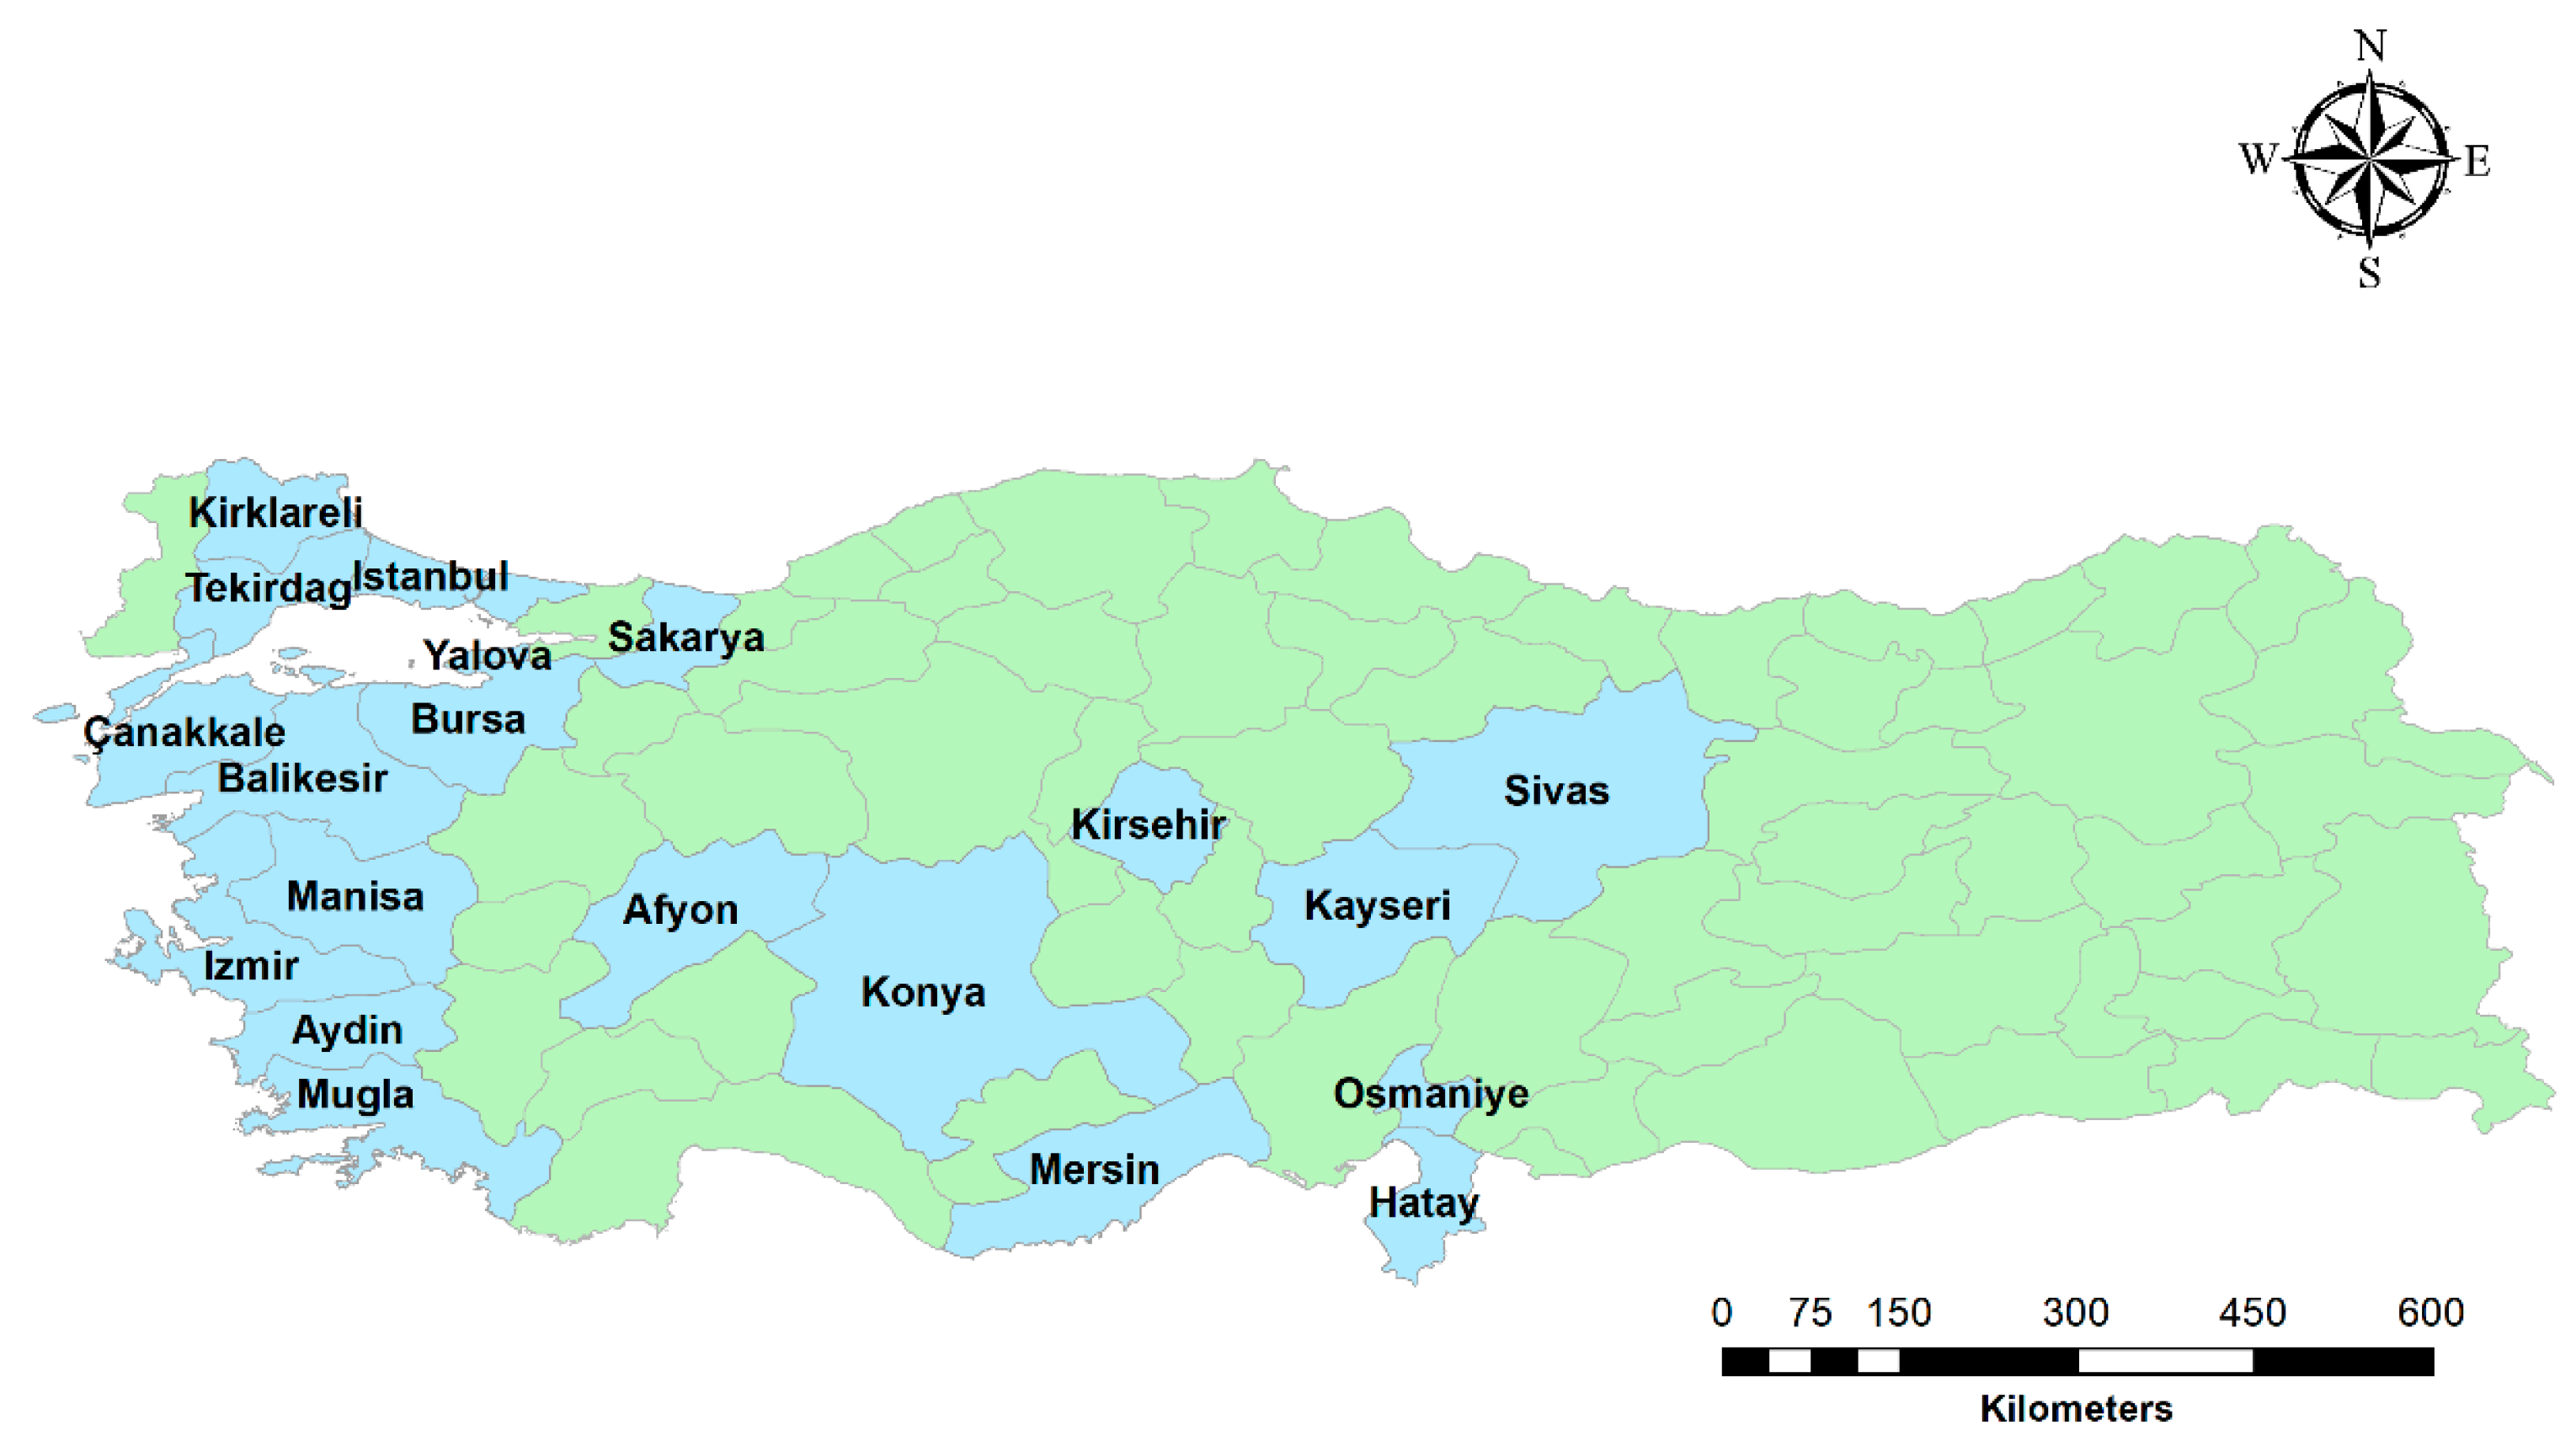
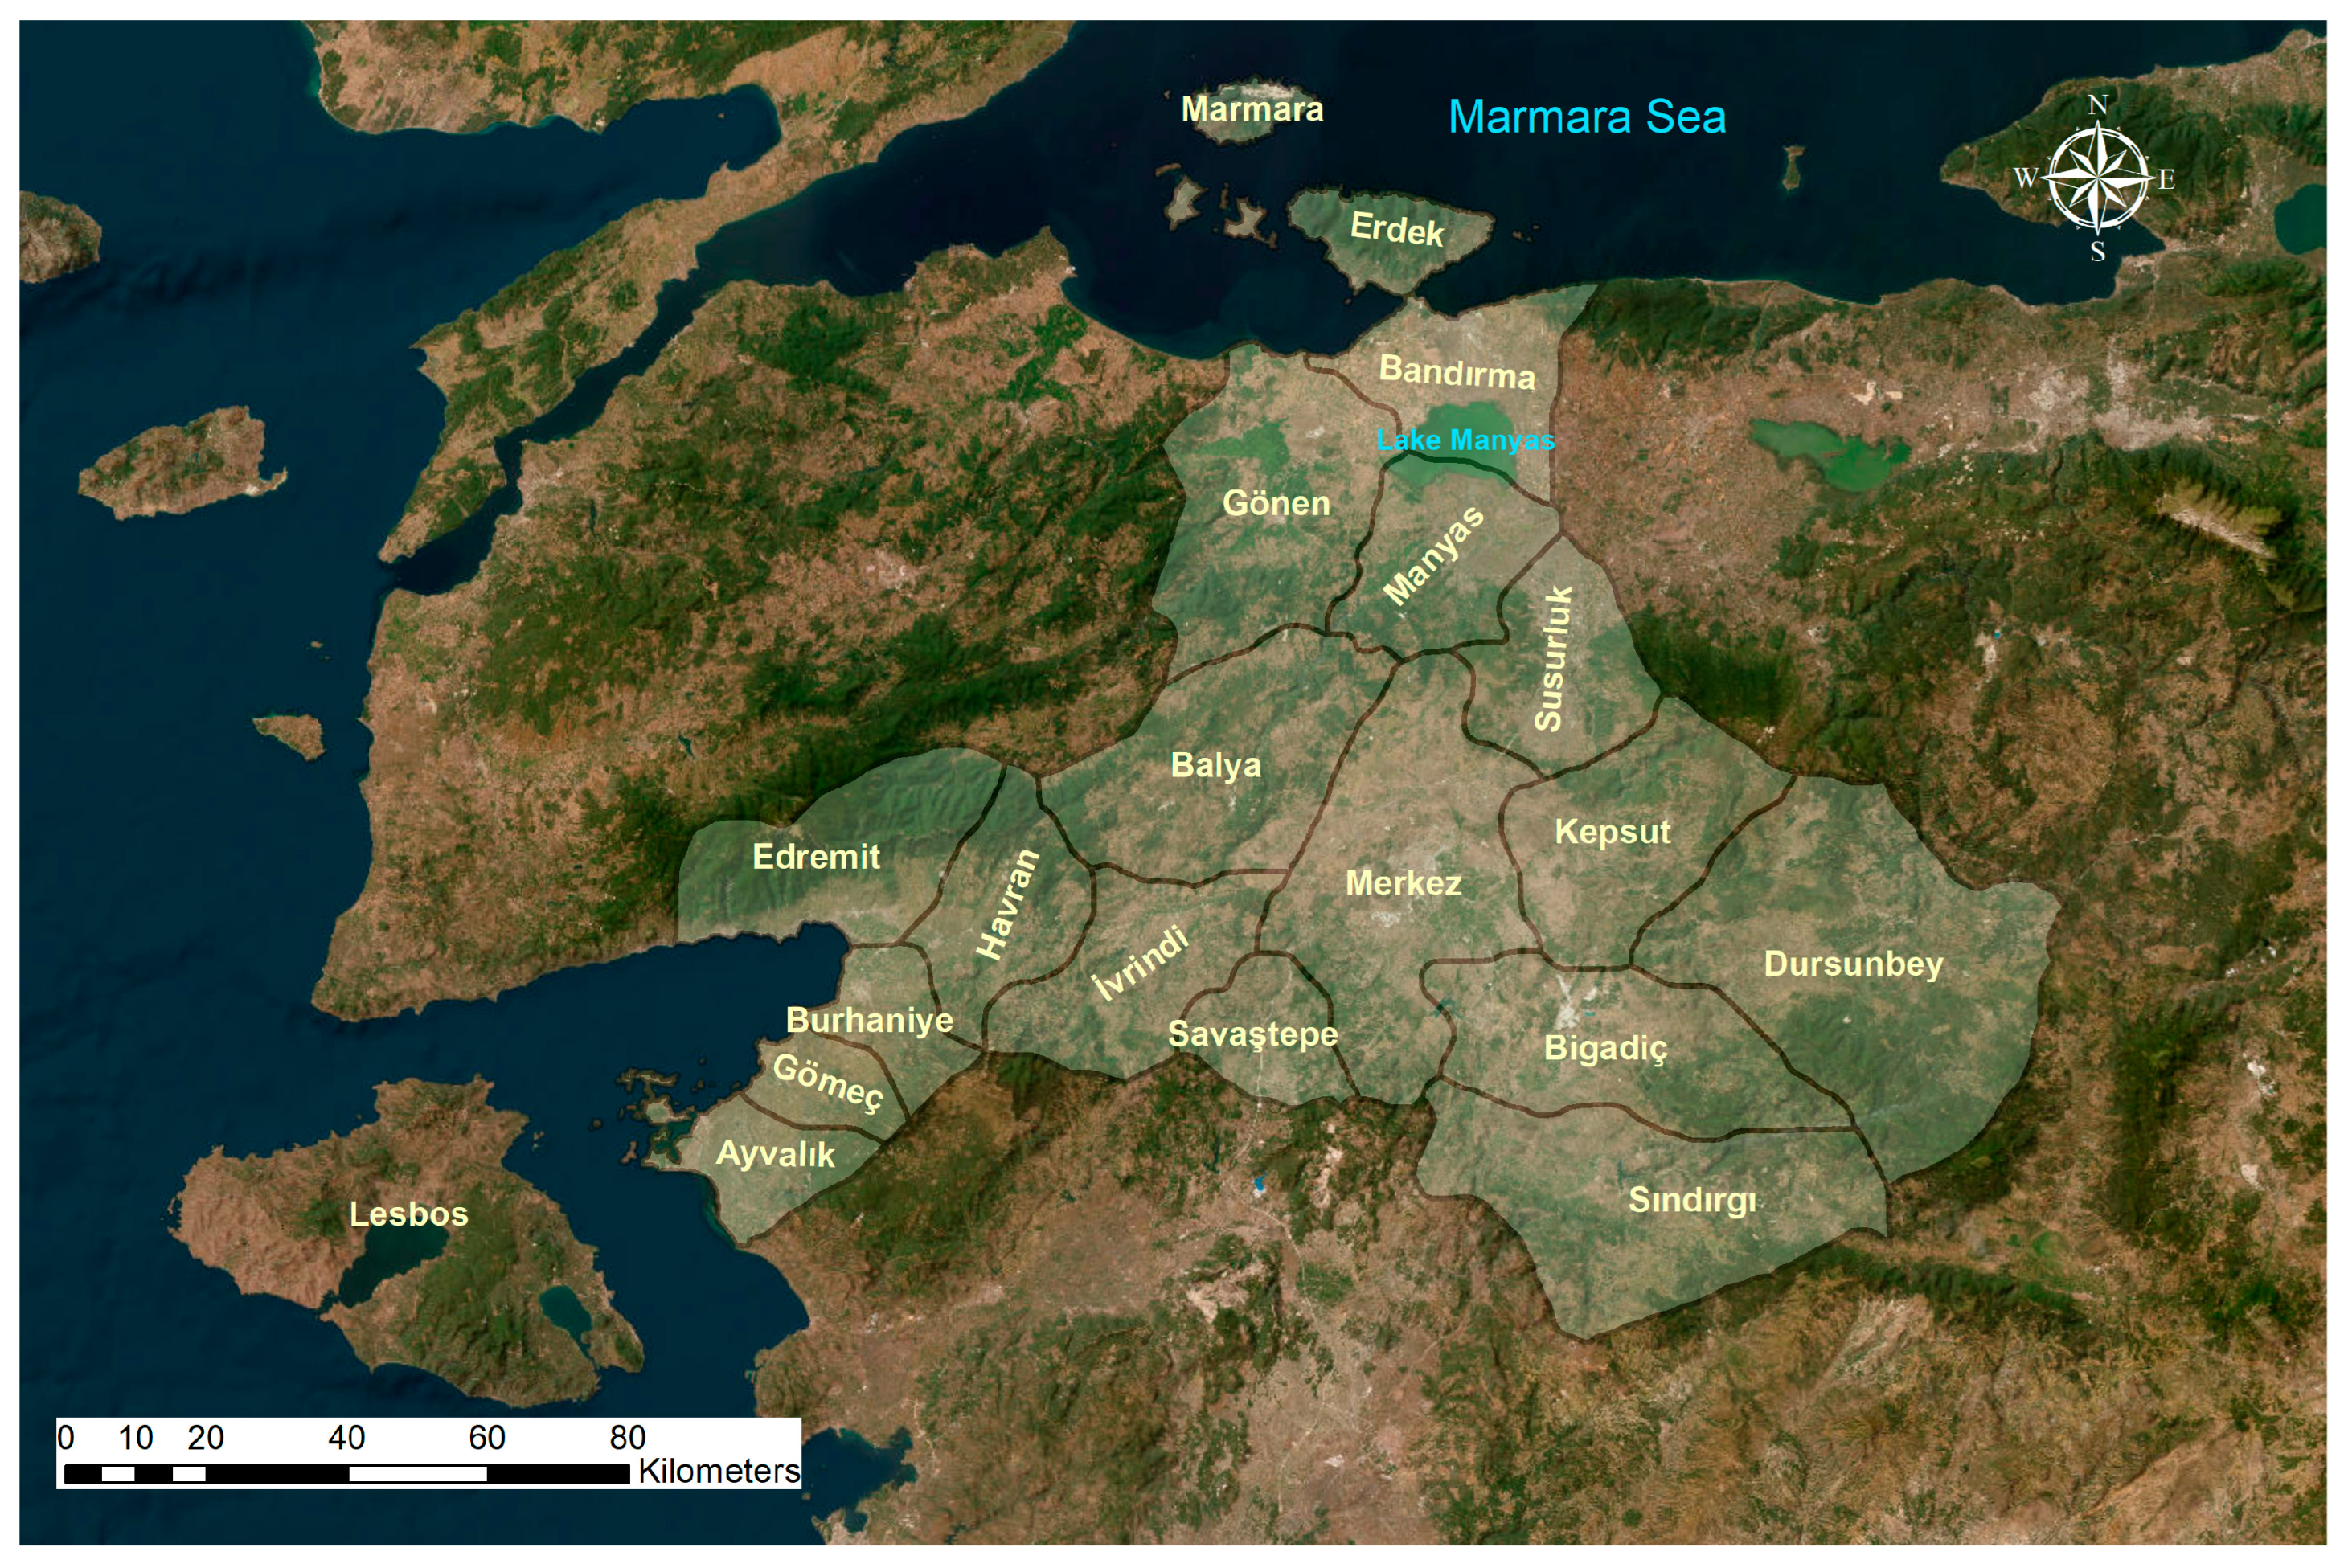
2. Study Area
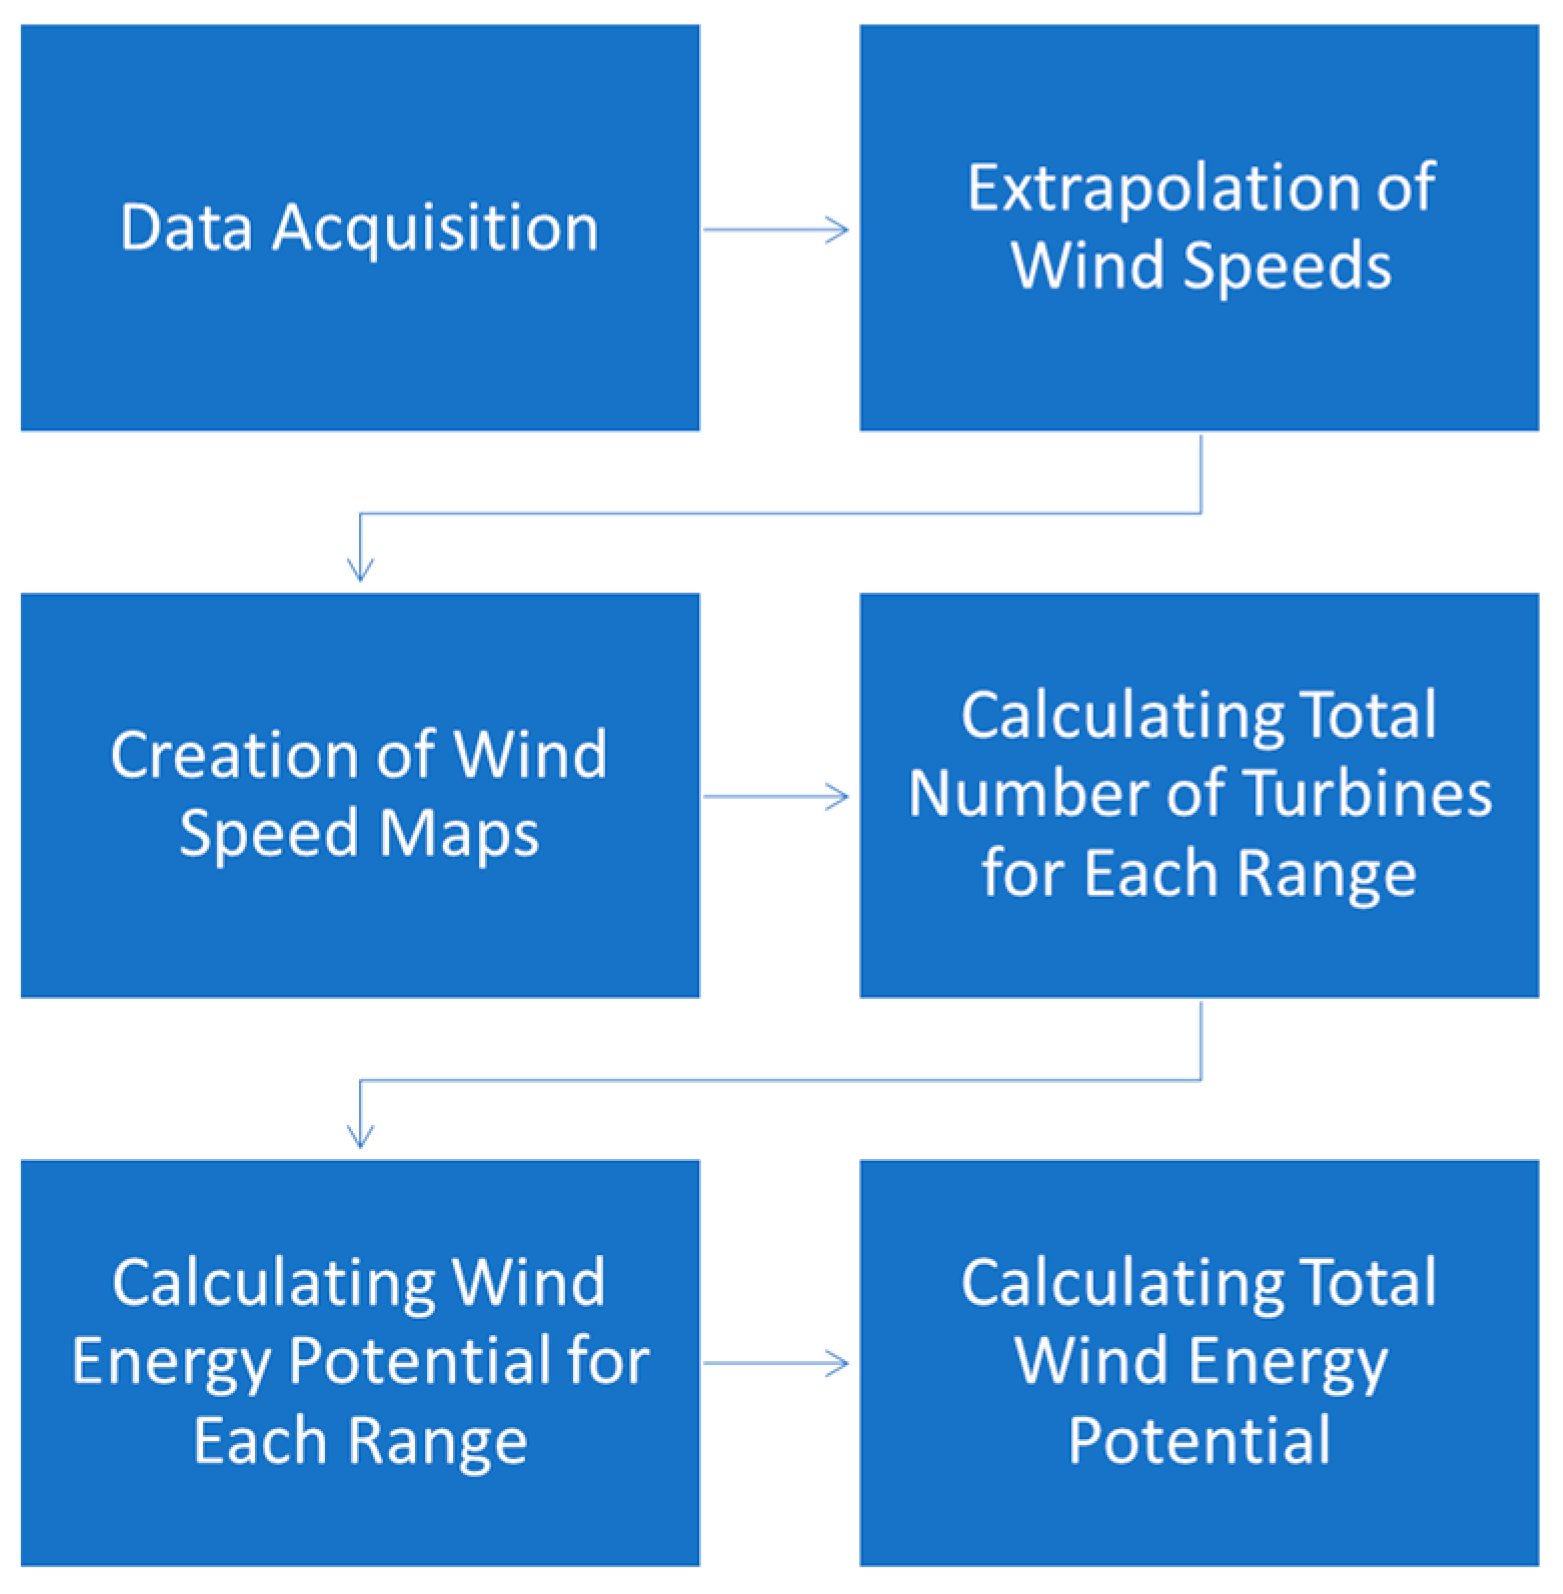
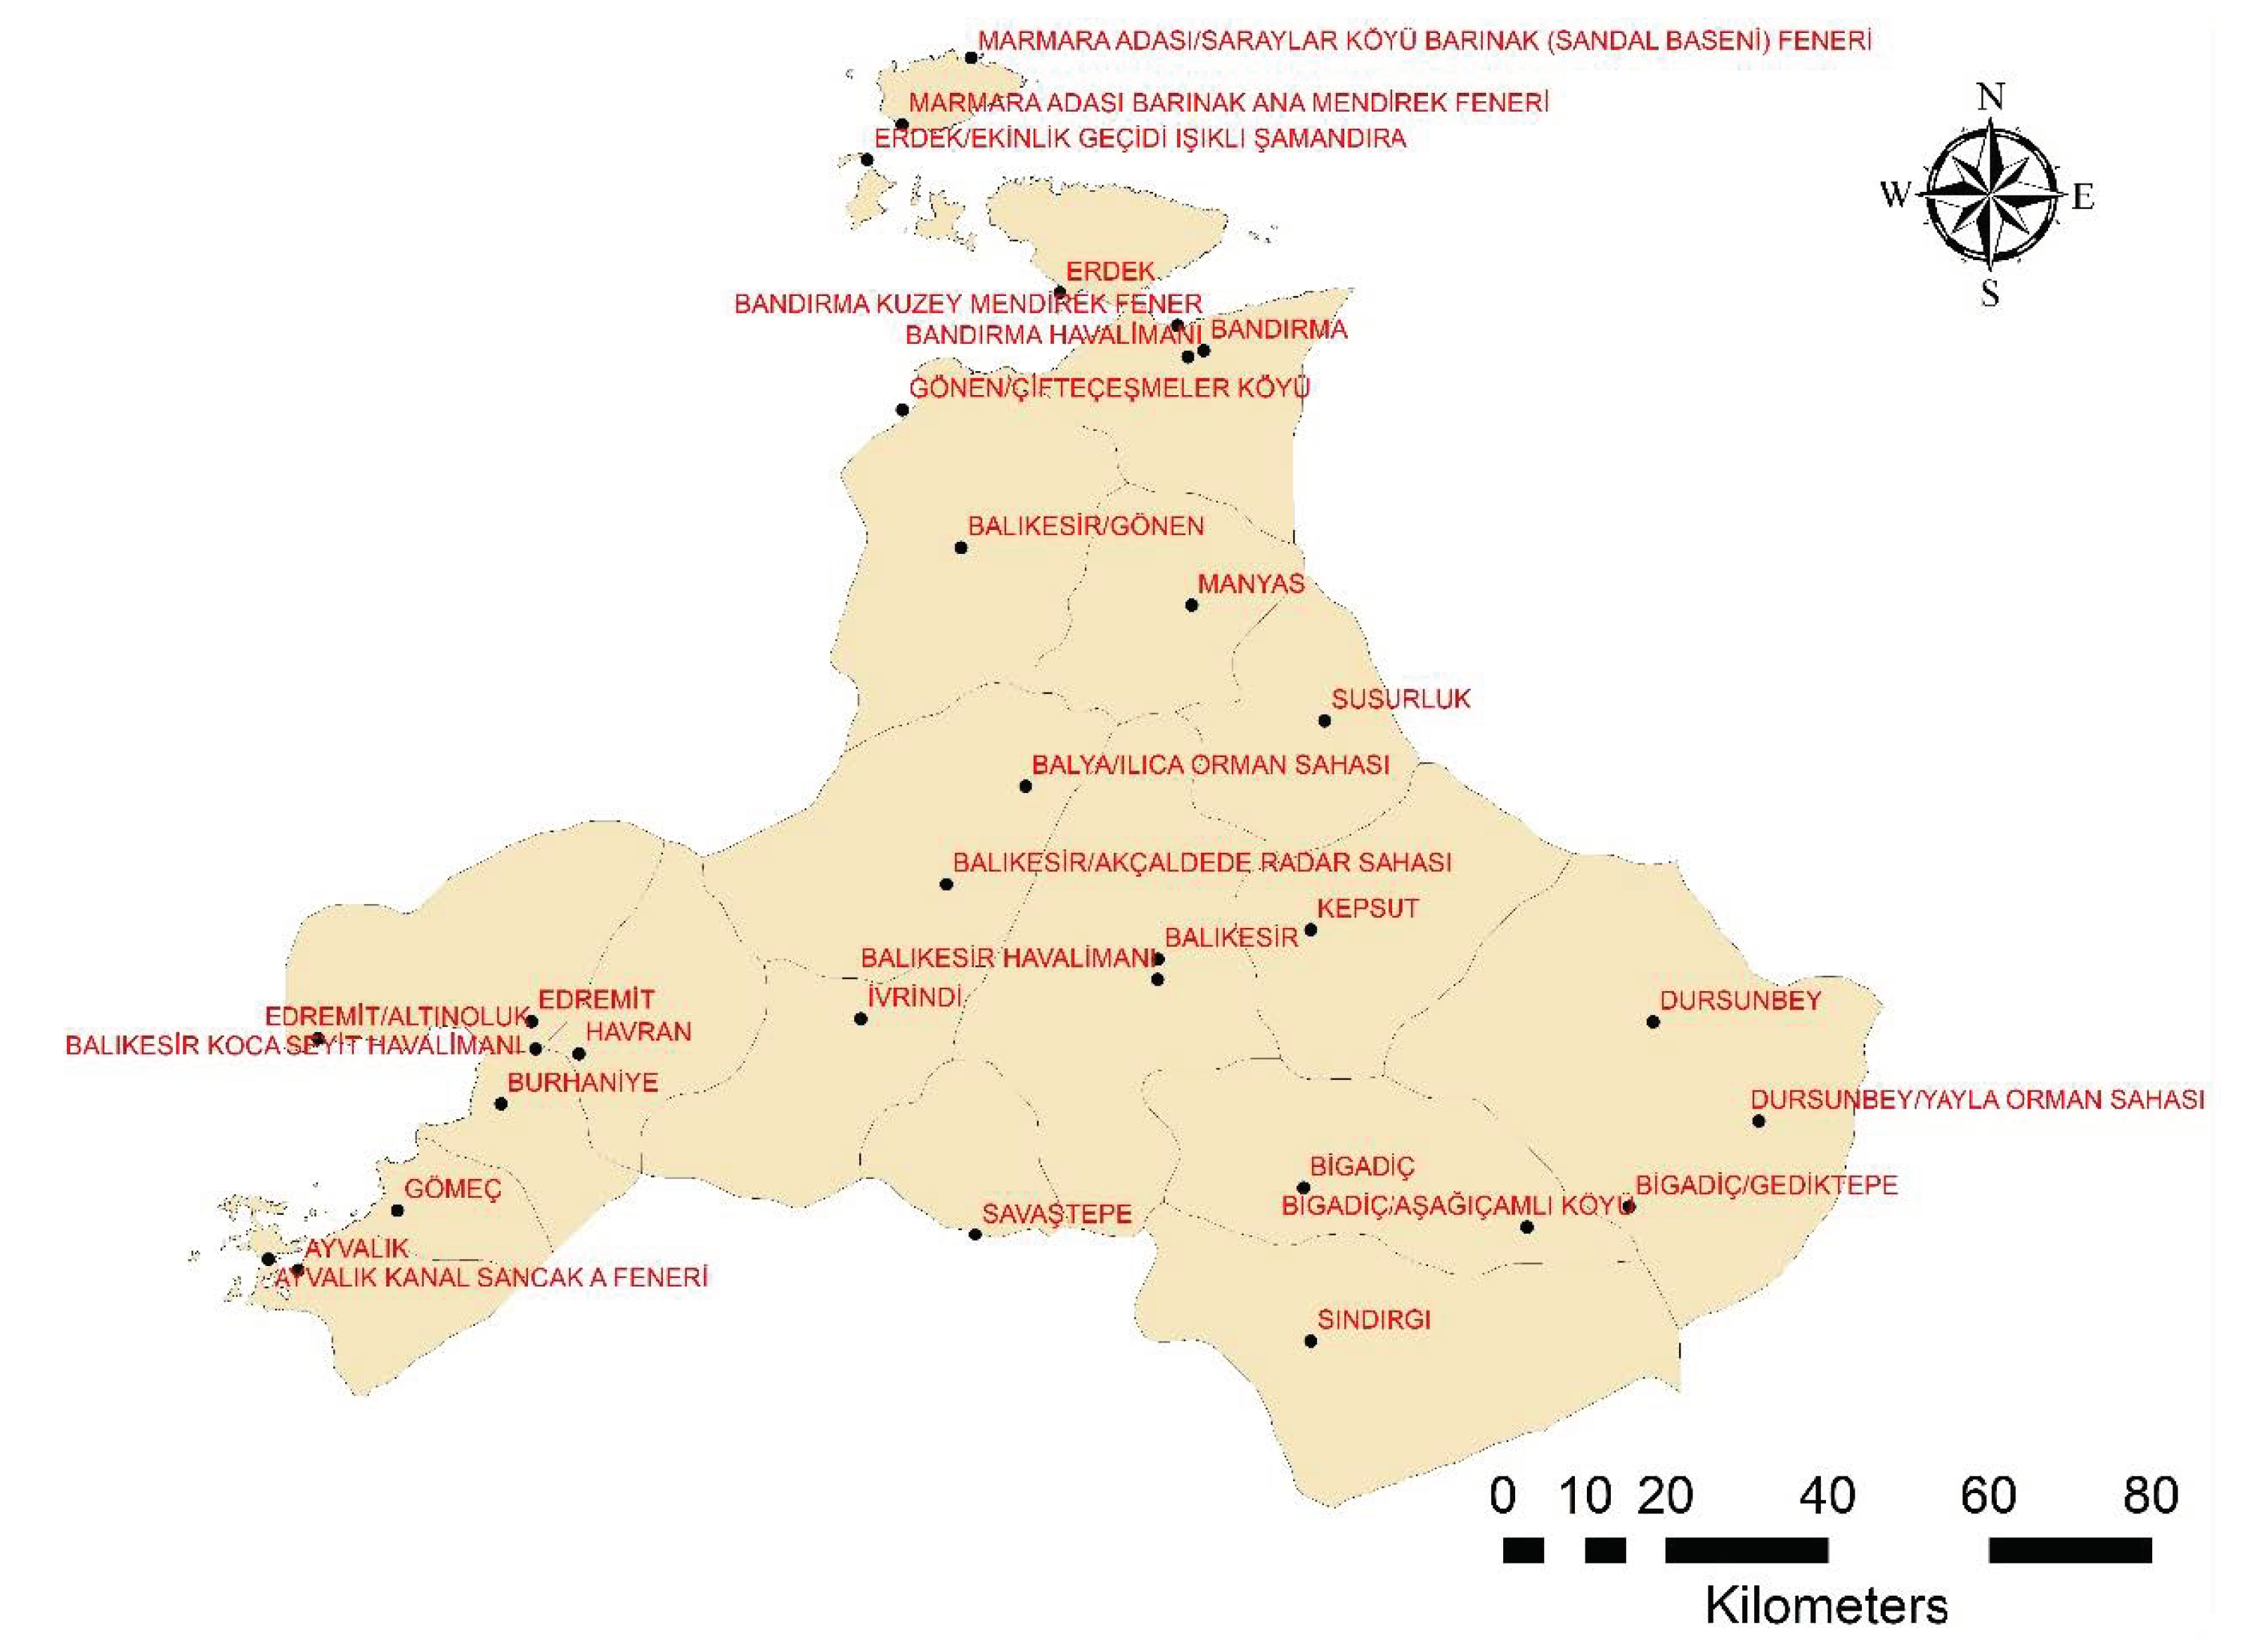
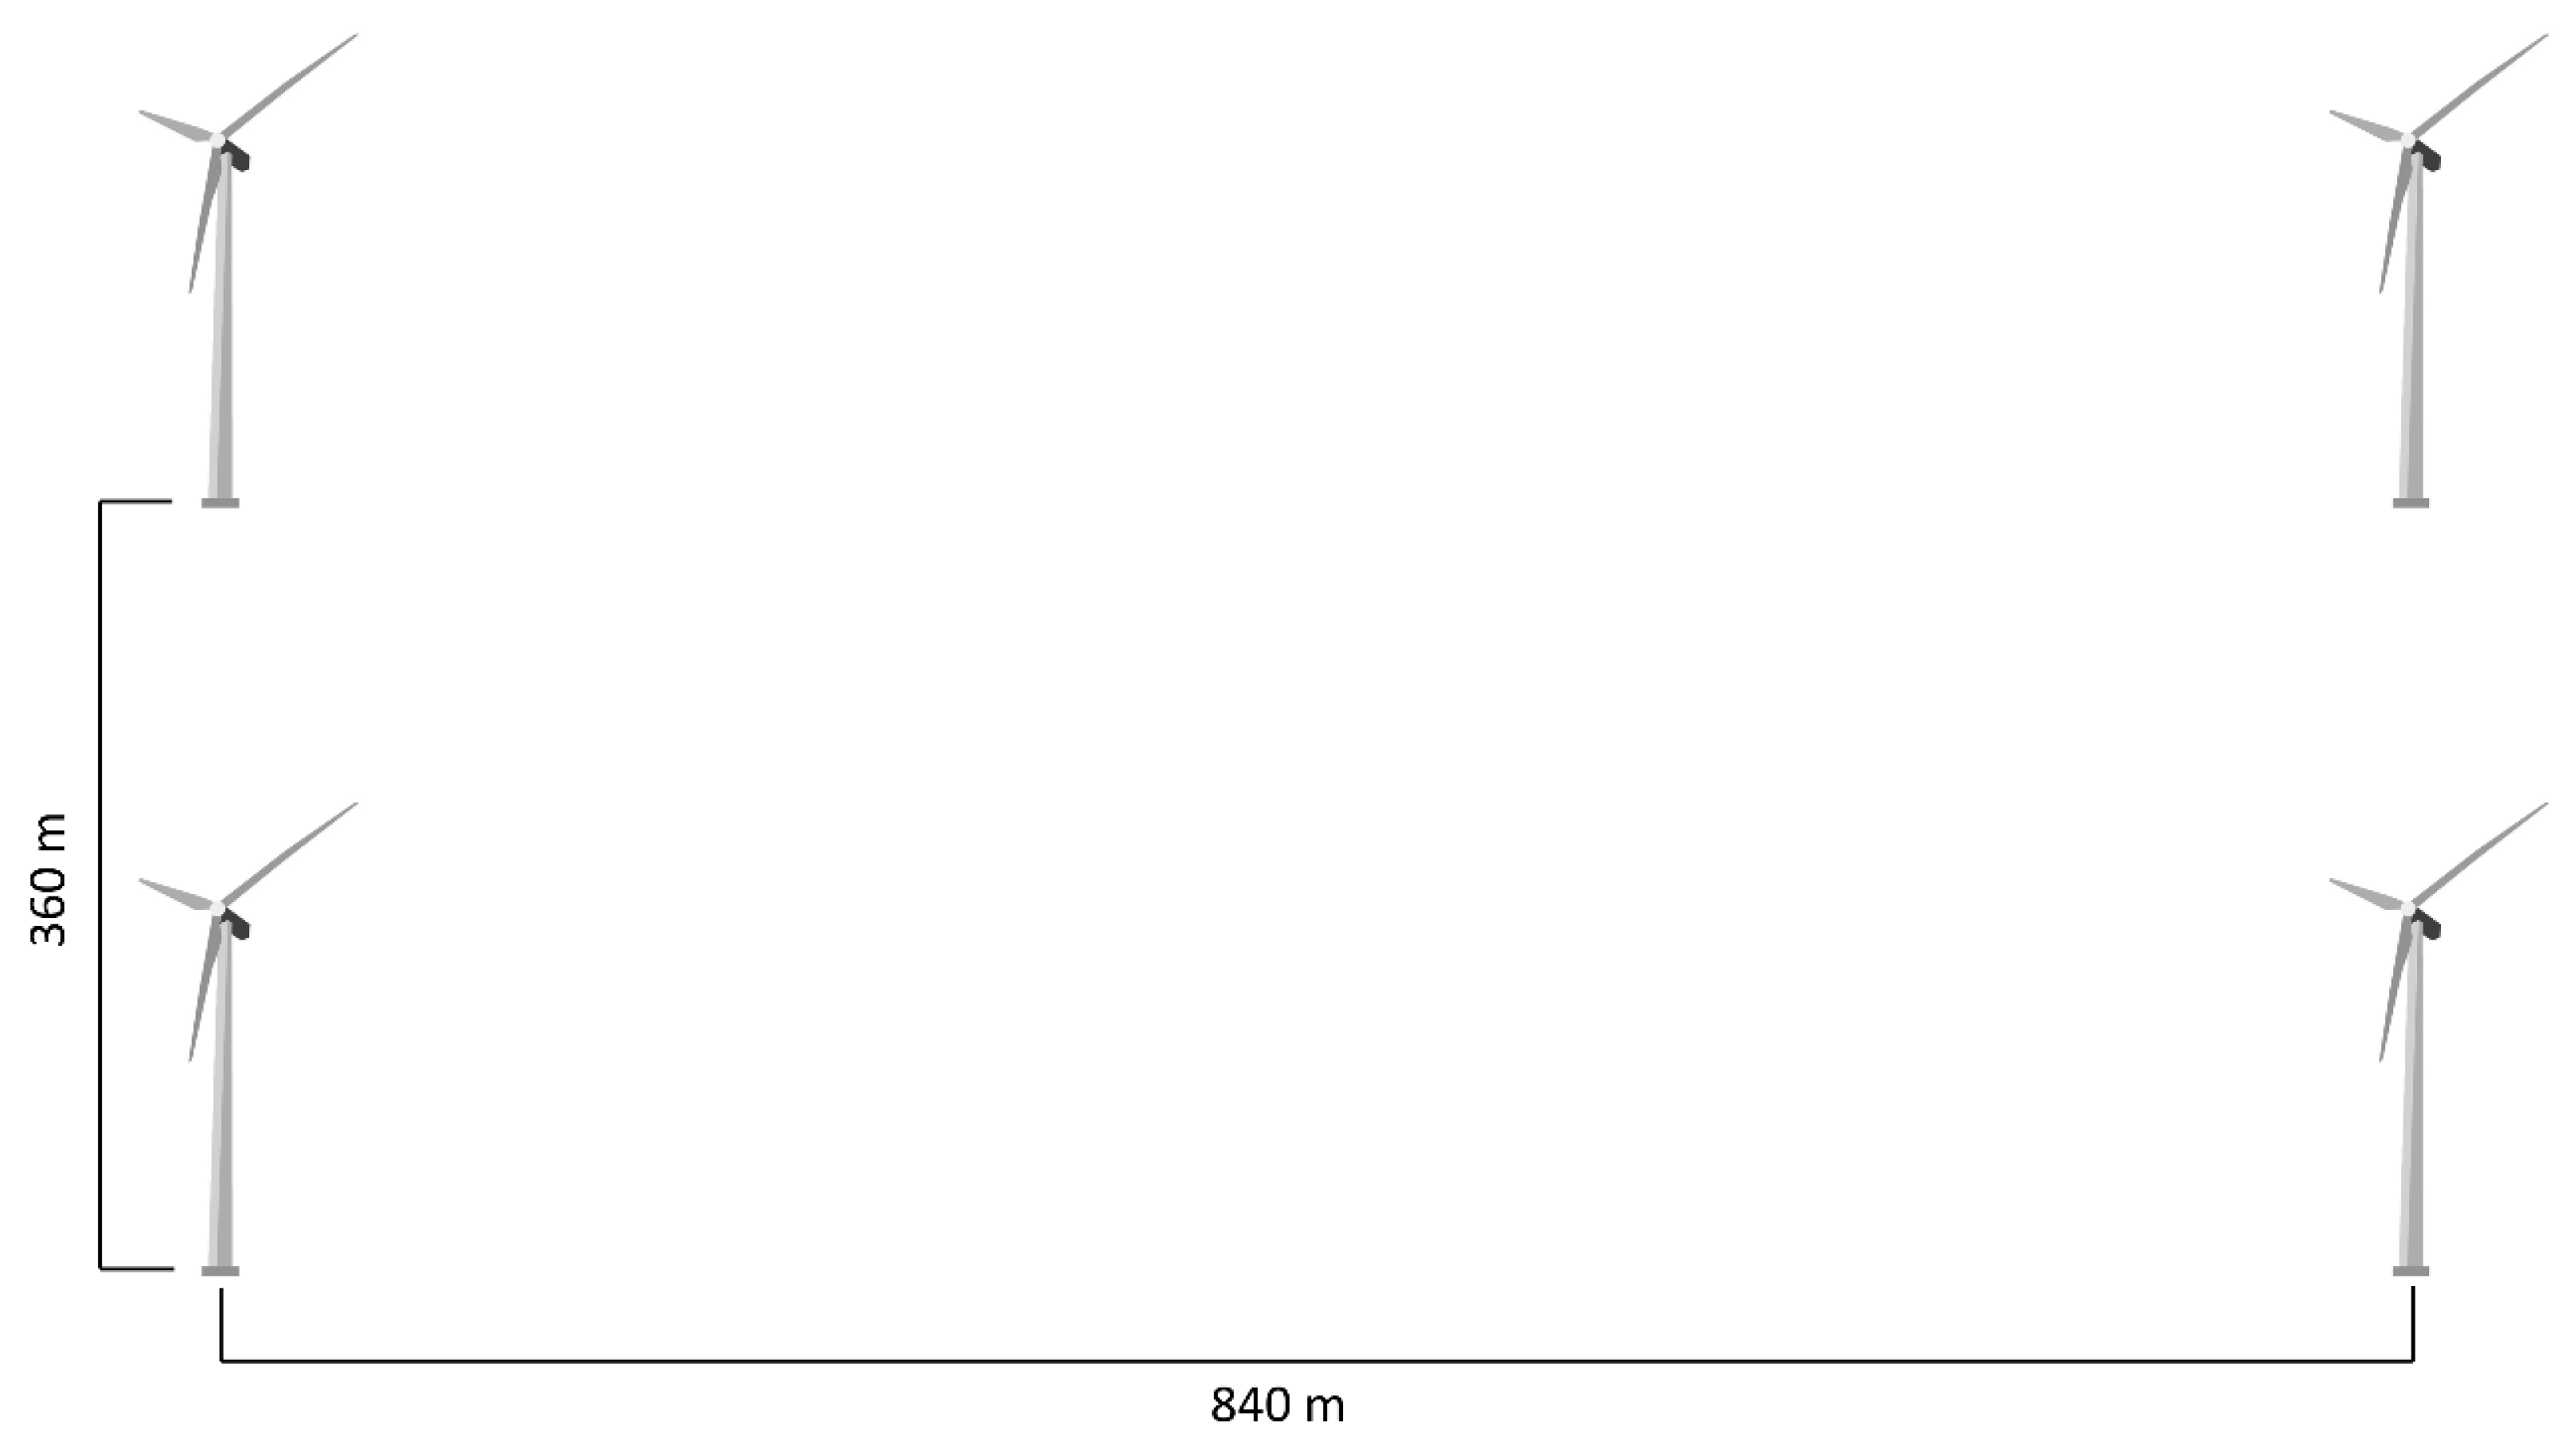
3. Materials and Methods
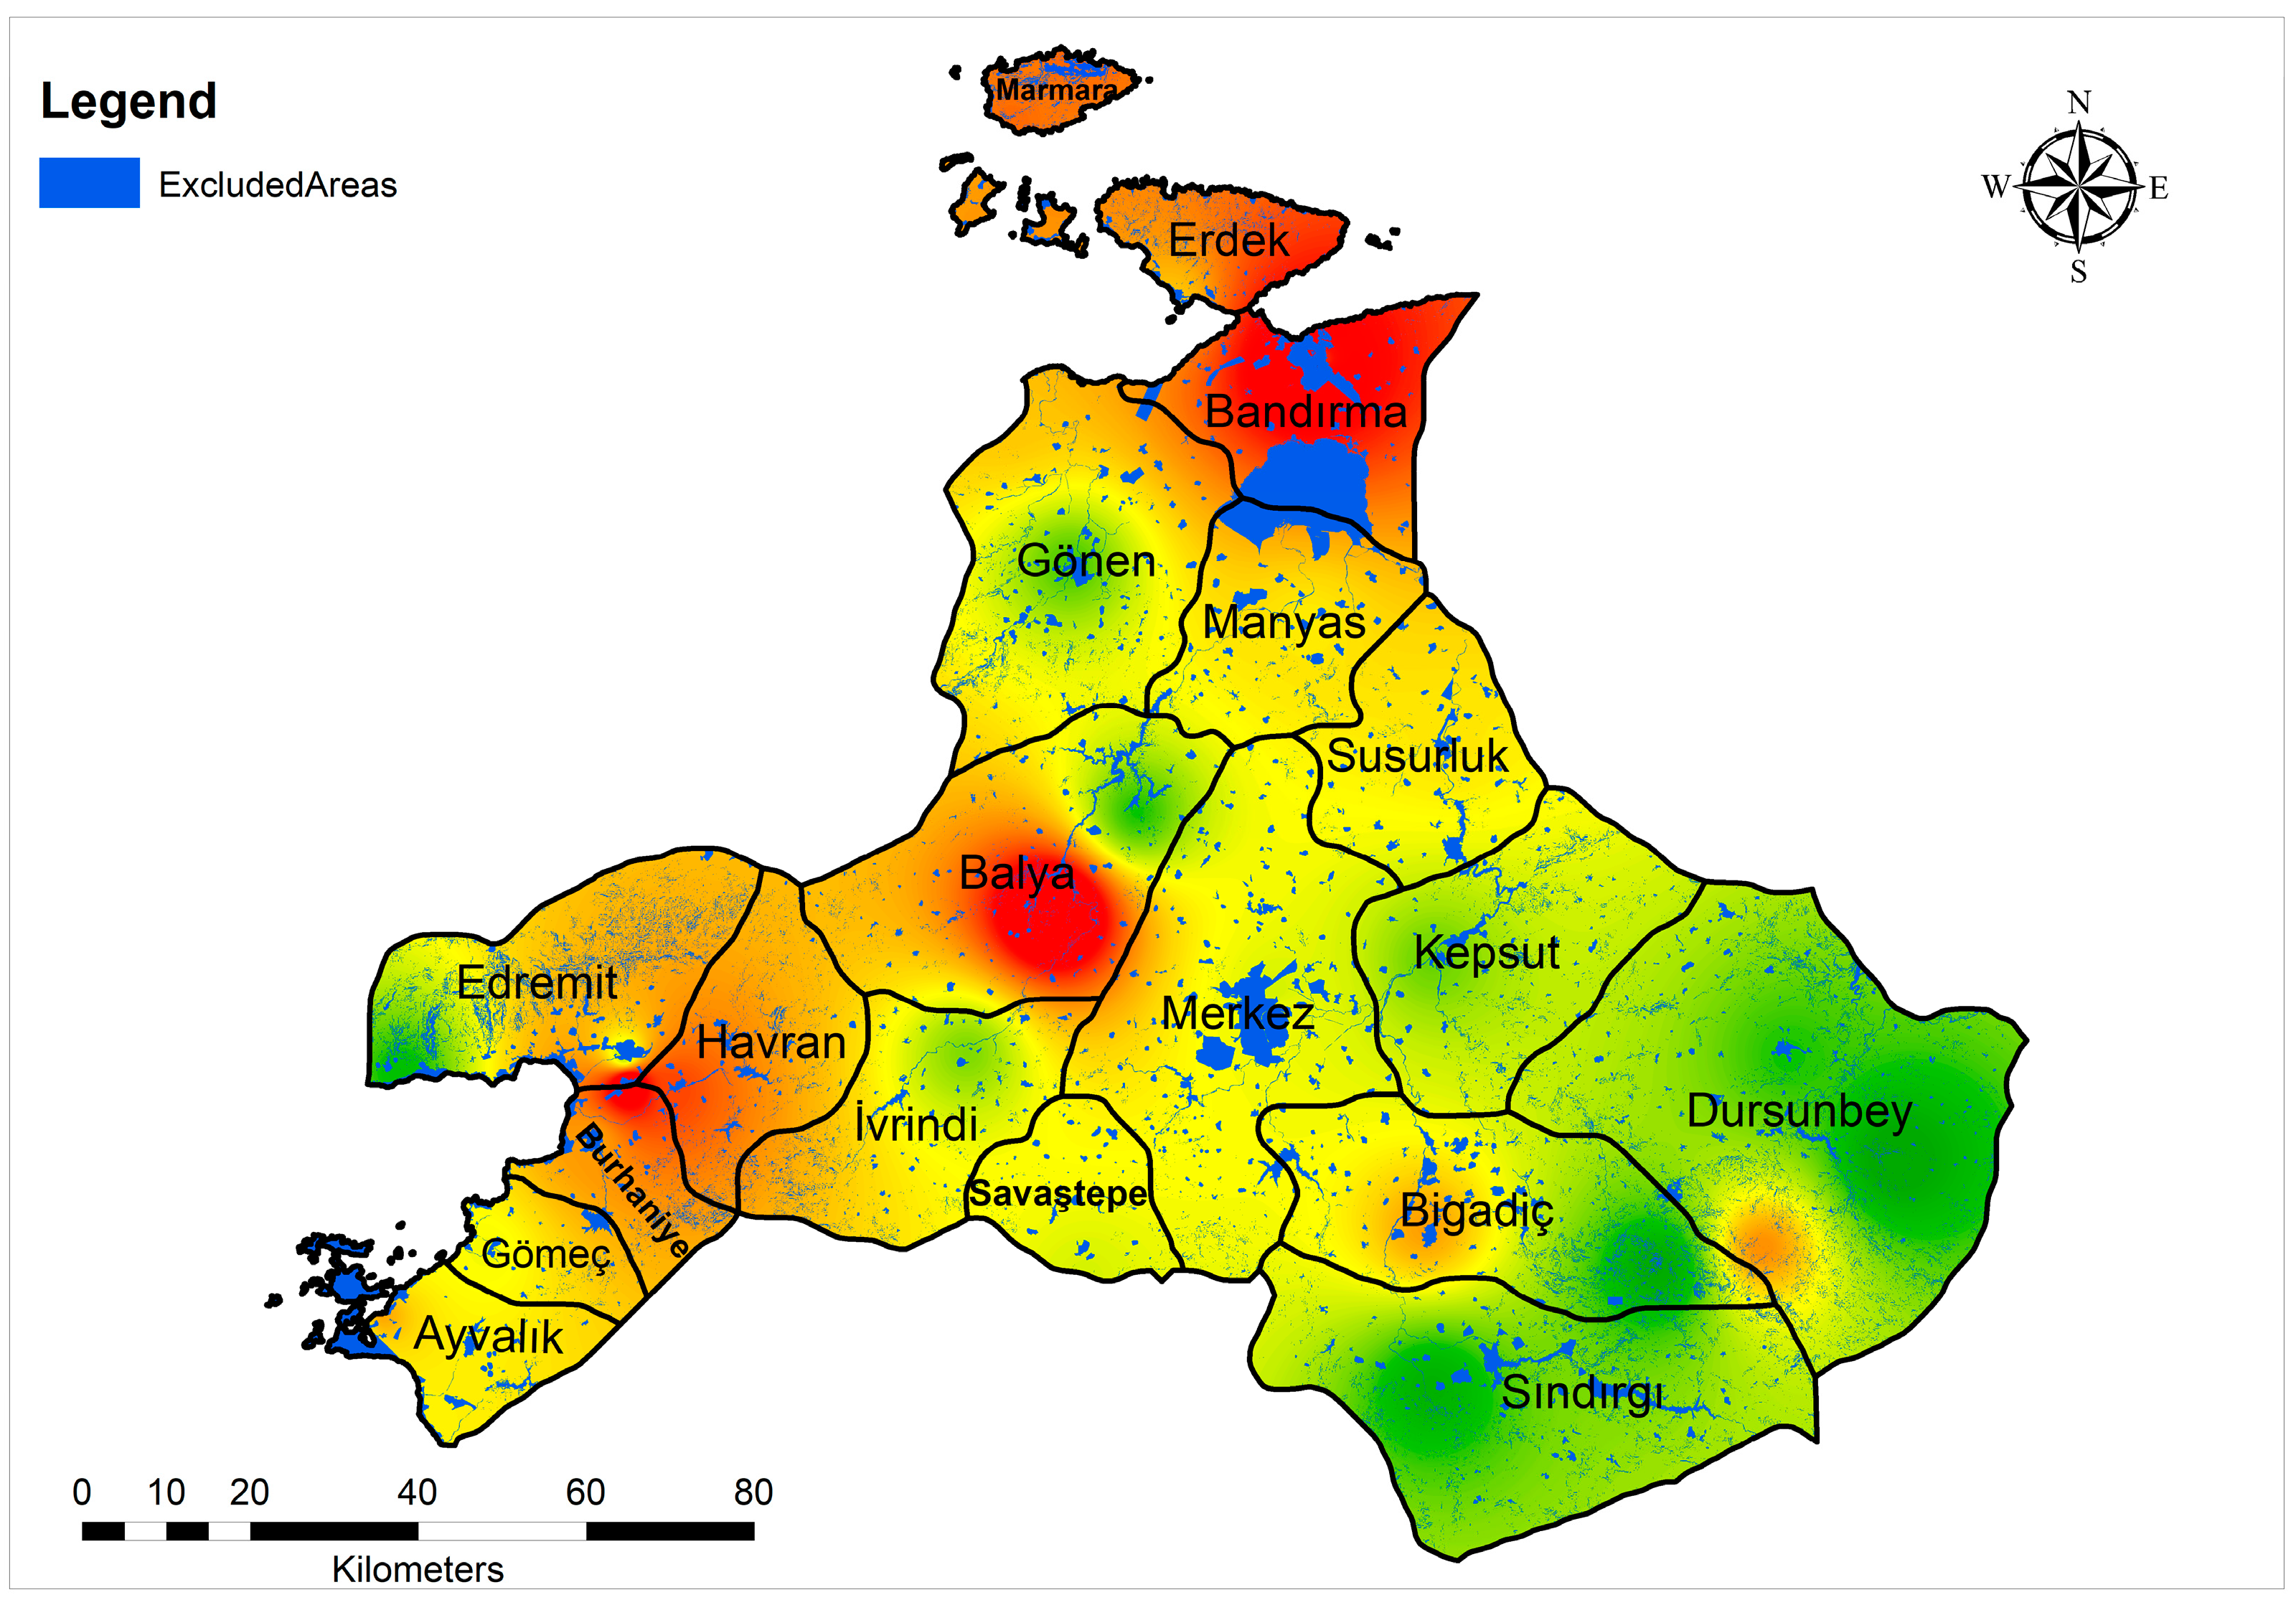
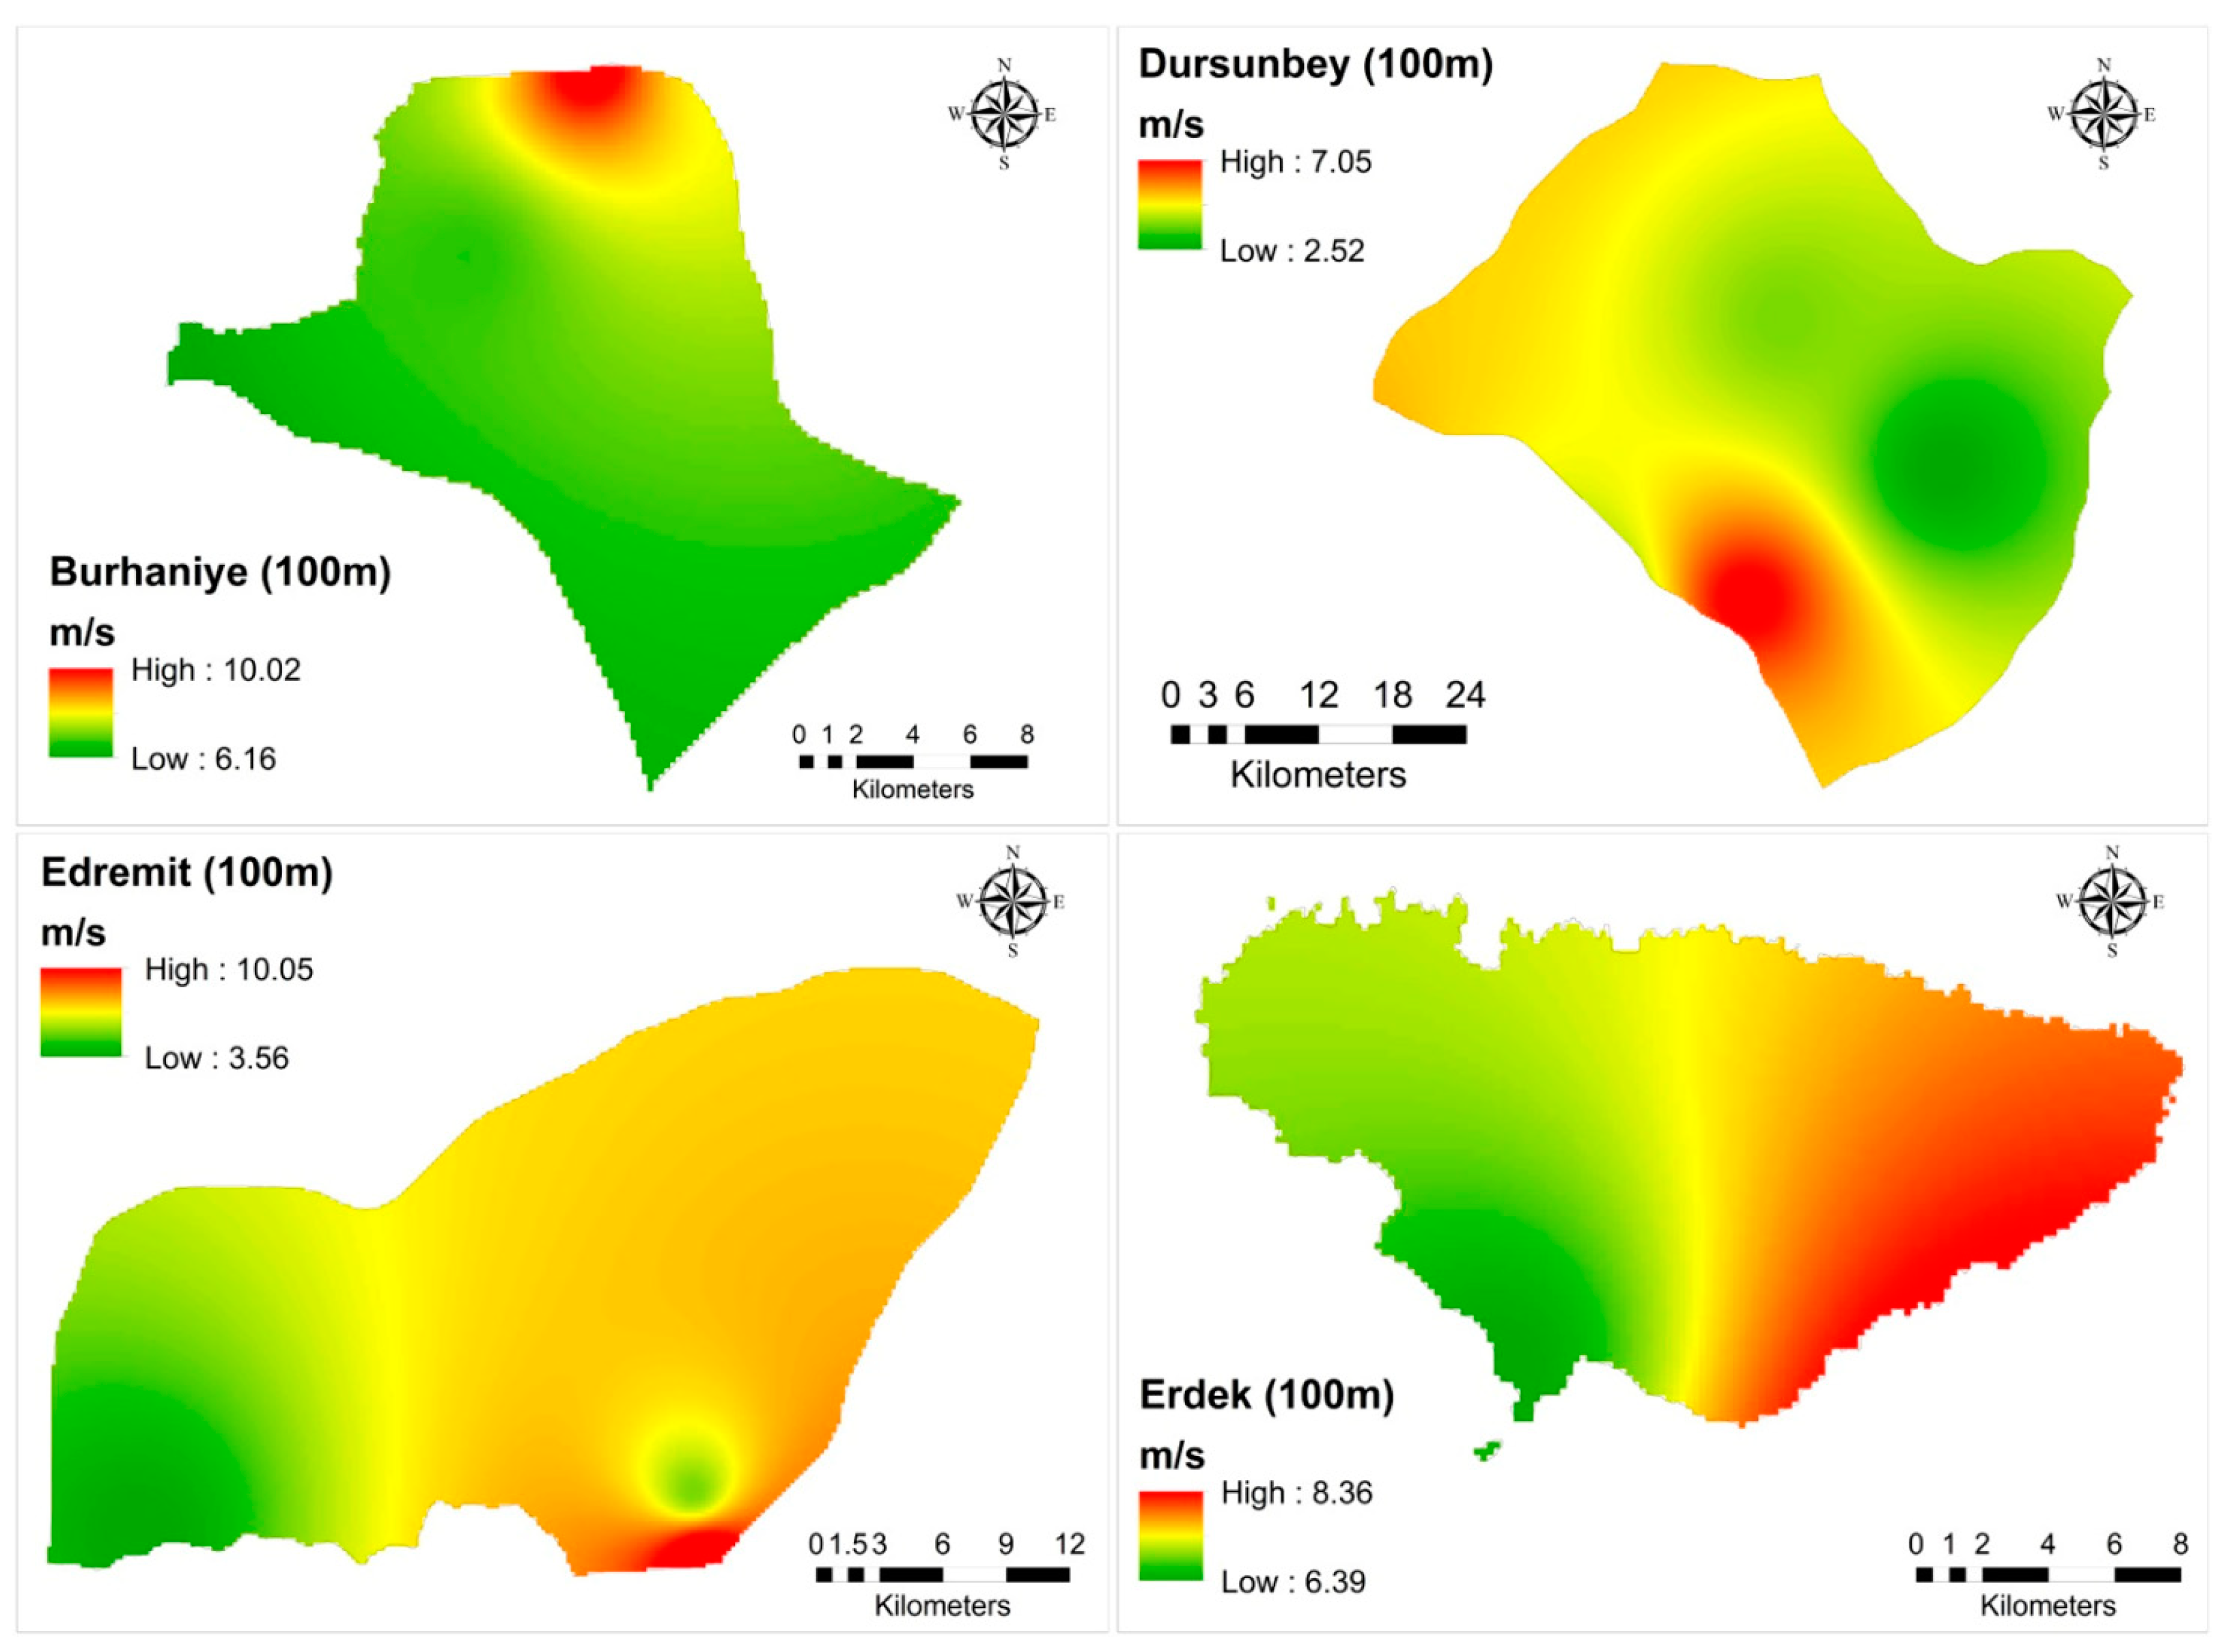
4. Results
5. Discussion and Conclusions
Funding
Institutional Review Board Statement
Informed Consent Statement
Data Availability Statement
Conflicts of Interest
Appendix A


References
- Marks-Bielska, R.; Bielski, S.; Pik, K.; Kurowska, K. The Importance of Renewable Energy Sources in Poland’s Energy Mix. Energies 2020, 13, 4624. [Google Scholar] [CrossRef]
- Piwowar, A.; Dzikuć, M. Development of renewable energy sources in the context of threats resulting from low-altitude emissions in rural areas in poland: A review. Energies 2019, 12, 3558. [Google Scholar] [CrossRef] [Green Version]
- Erdin, C.; Ozkaya, G. Turkey’s 2023 energy strategies and investment opportunities for renewable energy sources: Site selection based on electre. Sustainability 2019, 11, 2136. [Google Scholar] [CrossRef] [Green Version]
- Shahzad, U. The need for renewable energy sources. Int. J. Inf. Technol. Electr. Eng. 2015, 4, 16–18. [Google Scholar]
- Dincer, F. The analysis on wind energy electricity generation status, potential and policies in the world. Renew. Sustain. Energy Rev. 2011, 15, 5135–5142. [Google Scholar] [CrossRef]
- Lee, J.; Zhao, F. GWEC Global Wind Report 2021; Global Wind Energy Council (GWEC): Brussels, Belgium, 2021. [Google Scholar]
- Lee, J.; Zhao, F. GWEC Global Wind Report 2022; Global Wind Energy Council (GWEC): Brussels, Belgium, 2022. [Google Scholar]
- Global Wind Power Statistics by 2021. Available online: https://library.wwindea.org/global-wind-power-statistics/ (accessed on 20 March 2023).
- Dawn, S.; Tiwari, P.K.; Goswami, A.K.; Singh, A.K.; Panda, R. Wind power: Existing status, achievements and government’s initiative towards renewable power dominating India. Energy Strategy Rev. 2019, 23, 178–199. [Google Scholar] [CrossRef]
- Presidency of the Republic of Turkey Presidency of Strategy and Budget: Republic of Turkey’s Eleventh Development Plan Covering the 2019–2023 Period. Available online: https://www.sbb.gov.tr/wp-content/uploads/2022/07/Eleventh_Development_Plan_2019-2023.pdf (accessed on 13 February 2023).
- General Directorate of Energy Affairs: Turkey Electricity Investments in June 2022 Summary Report. Available online: https://enerji.gov.tr//Media/Dizin/EIGM/tr/Raporlar/PRP/EY%C3%96RA/2022/Haziran/ElektrikYat%C4%B1r%C4%B1mlar%C4%B12022HaziranAy%C4%B1%C3%96zetRaporu.pdf (accessed on 13 February 2023).
- Gultekin, U. Development of wind energy investments in Turkey. J. Turk. Stud. 2019, 14, 2333–2348. [Google Scholar] [CrossRef]
- Akdoğan, İ.; Kovancılar, B. Evaluation of Eco-Friendly Renewable Energy Policies in The European Union and Turkey in Terms of Incentive Types. Yönetim ve Ekonomi Dergisi 2022, 29, 69–91. [Google Scholar] [CrossRef]
- Turkish Wind Energy Association. Turkish Wind Energy Statictic Report—January 2022. Available online: https://tureb.com.tr//yayinlar/turkiye-ruzgar-enerjisi-istatistik-raporlari/5 (accessed on 17 March 2023).
- Turkish Wind Energy Association. Turkish Wind Energy Statictic Report—January 2021. Available online: https://tureb.com.tr//yayin/turkiye-ruzgar-enerjisi-istatistik-raporu-ocak-2021/139 (accessed on 17 March 2023).
- Manfren, M.; Nastasi, B.; Groppi, D.; Astiaso Garcia, D. Open data and energy analytics—An analysis of essential information for energy system planning, design and operation. Energy 2020, 213, 118803. [Google Scholar] [CrossRef]
- GoldWind Gw175-8.0MW Smart PMDD Wind Turbine Technical Parameters. Available online: https://www.goldwind.com/en/windpower/product-gw6s/ (accessed on 13 March 2023).
- Vestas V172-7.2 MW™ Wind Turbine Technical Specifications. Available online: https://www.vestas.com/en/products/enventus-platform/V172-7-2-MW (accessed on 13 March 2023).
- Nordex N163/6.X Wind Turbine Technical Data. Available online: https://www.nordex-online.com/en/product/n163-6-x/ (accessed on 13 March 2023).
- Voivontas, D.; Assimacopoulos, D.; Mourelatos, A.; Coromınas, J. Evaluation of Renewable Energy Potential Using A GIS Decision Support System. Renew. Energy 1998, 13, 333–344. [Google Scholar] [CrossRef]
- Rodman, L.C.; Meentemeyer, R.K. A geographic analysis of wind turbine placement in Northern California. Energy Policy 2006, 34, 2137–2149. [Google Scholar] [CrossRef]
- Al-Yahyai, S.; Charabi, Y.; Gastli, A.; Al-Badi, A. Wind farm land suitability indexing using multi-criteria analysis. Renew. Energy 2012, 44, 80–87. [Google Scholar] [CrossRef]
- Gorsevski, P.V.; Cathcart, S.C.; Mirzaei, G.; Jamali, M.M.; Ye, X.; Gomezdelcampo, E. A group-based spatial decision support system for wind farm site selection in Northwest Ohio. Energy Policy 2013, 55, 374–385. [Google Scholar] [CrossRef]
- Höfer, T.; Sunak, Y.; Siddique, H.; Madlener, R. Wind farm siting using a spatial Analytic Hierarchy Process approach: A case study of the Städteregion Aachen. Appl. Energy 2016, 163, 222–243. [Google Scholar] [CrossRef]
- Noorollahi, Y.; Yousefi, H.; Mohammadi, M. Multi-criteria decision support system for wind farm site selection using GIS. Sustain. Energy Technol. Assess. 2016, 13, 38–50. [Google Scholar] [CrossRef]
- Villacreses, G.; Gaona, G.; Martínez-Gómez, J.; Jijón, D.J. Wind farms suitability location using geographical information system (GIS), based on multi-criteria decision making (MCDM) methods: The case of continental Ecuador. Renew. Energy 2017, 109, 275–286. [Google Scholar] [CrossRef]
- Baseer, M.A.; Rehman, S.; Meyer, J.P.; Alam, M.M. GIS-based site suitability analysis for wind farm development in Saudi Arabia. Energy 2017, 141, 1166–1176. [Google Scholar] [CrossRef] [Green Version]
- Kavak Akpinar, E.; Akpinar, S. Determination of the wind energy potential for Maden-Elazig, Turkey. Energy Convers. Manag. 2004, 45, 2901–2914. [Google Scholar] [CrossRef]
- Keyhani, A.; Ghasemi-Varnamkhasti, M.; Khanali, M.; Abbaszadeh, R. An assessment of wind energy potential as a power generation source in the capital of Iran, Tehran. Energy 2010, 35, 188–201. [Google Scholar] [CrossRef]
- Fyrippis, I.; Axaopoulos, P.J.; Panayiotou, G. Wind energy potential assessment in Naxos Island, Greece. Appl. Energy 2010, 87, 577–586. [Google Scholar] [CrossRef]
- Ohunakin, O.S.; Akinnawonu, O.O. Assessment of wind energy potential and the economics of wind power generation in Jos, Plateau State, Nigeria. Energy Sustain. Dev. 2012, 16, 78–83. [Google Scholar] [CrossRef]
- Wu, J.; Wang, J.; Chi, D. Wind energy potential assessment for the site of Inner Mongolia in China. Renew. Sustain. Energy Rev. 2013, 21, 215–228. [Google Scholar] [CrossRef]
- Elnaggar, M.; Edwan, E.; Ritter, M. Wind Energy Potential of Gaza Using Small Wind Turbines: A Feasibility Study. Energies 2017, 10, 1229. [Google Scholar] [CrossRef] [Green Version]
- Elie Bertrand, K.S.; Abraham, K.; Lucien, M. Sustainable Energy Through Wind Speed and Power Density Analysis in Ambam, South Region of Cameroon. Front. Energy Res. 2020, 8, 176. [Google Scholar] [CrossRef]
- Wang, Z.; Liu, W. Wind energy potential assessment based on wind speed, its direction and power data. Sci. Rep. 2021, 11, 16879. [Google Scholar] [CrossRef]
- Çakmakçı, B.A.; Hüner, E. Evaluation of wind energy potential: A case study. Energy Sources Part A Recovery Util. Environ. Eff. 2022, 44, 834–852. [Google Scholar] [CrossRef]
- Paraschiv, S.; Paraschiv, L.; Alexandru, S.; Anisoara-Gabriela, C. Assessment of onshore wind energy potential under temperate continental climate conditions. Energy Rep. 2022, 8, 251–258. [Google Scholar] [CrossRef]
- Jung, C.; Schindler, D. Introducing a new approach for wind energy potential assessment under climate change at the wind turbine scale. Energy Convers. Manag. 2020, 225, 113425. [Google Scholar] [CrossRef]
- Ongaki, L.; Maghanga, C.M.; Kerongo, J. Evaluation of the Technical Wind Energy Potential of Kisii Region Based on the Weibull and Rayleigh Distribution Models. J. Energy 2021, 2021, 6627509. [Google Scholar] [CrossRef]
- Anwar, K.; Deshmukh, S. Parametric study for the prediction of wind energy potential over the southern part of India using neural network and geographic information system approach. Proc. Inst. Mech. Eng. Part A J. Power Energy 2020, 234, 96–109. [Google Scholar] [CrossRef]
- Feng, J.; Feng, L.; Wang, J.; King, C.W. Evaluation of the onshore wind energy potential in mainland China—Based on GIS modeling and EROI analysis. Resour. Conserv. Recycl. 2020, 152, 104484. [Google Scholar] [CrossRef]
- Zahedi, R.; Ghorbani, M.; Daneshgar, S.; Gitifar, S.; Qezelbigloo, S. Potential measurement of Iran’s western regional wind energy using GIS. J. Clean. Prod. 2022, 330, 129883. [Google Scholar] [CrossRef]
- Wind Energy Potential Atlas of Balıkesir, Turkey. Available online: https://repa.enerji.gov.tr/REPA/BALIKESIR-REPA.pdf (accessed on 16 February 2023).
- Corine Land Cover (CLC). 2018. Available online: https://land.copernicus.eu/pan-european/corine-land-cover/clc2018?tab=download (accessed on 11 February 2023).
- The United States Geological Survey (USGS). ASTGTMv003 ASTER Global Digital Elevation Model. Available online: https://lpdaac.usgs.gov/products/astgtmv003/ (accessed on 11 February 2023).
- Tar, K. Some statistical characteristics of monthly average wind speed at various heights. Renew. Sustain. Energy Rev. 2008, 12, 1712–1724. [Google Scholar] [CrossRef]
- Masters, G.M. Renewable and Efficient Electric Power Systems; John Wiley and Sons: Hoboken, NJ, USA, 2004. [Google Scholar]
- Yildiz, S.S. A Comparison of Interpolation Methods in Creation of Wind Speed Maps: A Case Study of Balıkesir. Afyon Kocatepe Univ. J. Sci. Eng. 2021, 21, 130–137. [Google Scholar] [CrossRef]
- Republic of Turkey Ministry of Energy and Natural Resources: Regulation on the Technical Evaluation of Wind Source Based Electricity Generation Applications. Available online: https://www.resmigazete.gov.tr/eskiler/2015/10/20151020-2-1.pdf (accessed on 17 February 2023).
- Turkish Atomic Energy Agency. Alternatif Enerji Kaynakları. İstanbul: Çekmece Nükleer Araştırma ve Eğitim Merkezi. Available online: https://kurumsalarsiv.tenmak.gov.tr/bitstream/20.500.12878/1272/1/3308.pdf (accessed on 18 February 2023).
- Gustavson, M.R. Limits to wind power utilization. Science 1979, 204, 13–17. [Google Scholar] [CrossRef]
- Wood, D. Grand Challenges in Wind Energy Research. Front. Energy Res. 2020, 8, 624646. [Google Scholar] [CrossRef]


| Rank | Country | Installed Capacity 2020 (MW) | New Installations 2021 (MW) | Growth Rates (%) | Installed Capacity 2021 (MW) | Share in the World (%) |
|---|---|---|---|---|---|---|
| 1 | P.R. China | 288,029 | 58,641 | 20.4 | 346,670 | 41.0 |
| 2 | United States | 122,328 | 12,518 | 10.2 | 134,846 | 15.9 |
| 3 | Germany | 62,208 | 1716 | 2.8 | 63,924 | 7.6 |
| 4 | India | 38,625 | 1732 | 4.5 | 40,357 | 4.8 |
| 5 | Spain | 27,446 | 750 | 2.7 | 28,196 | 3.3 |
| 6 | United Kingdom | 24,167 | 2645 | 10.9 | 26,812 | 3.2 |
| 7 | Brazil | 18,010 | 3827 | 21.2 | 21,837 | 2.6 |
| 8 | France | 17,949 | 1132 | 6.3 | 19,081 | 2.3 |
| 9 | Canada | 13,627 | 677 | 5.0 | 14,304 | 1.7 |
| 10 | Sweden | 9922 | 2175 | 21.9 | 12,097 | 1.4 |
| 11 | Italy | 10,850 | 258 | 2.4 | 11,108 | 1.3 |
| 12 | Turkey | 9305 | 1797 | 19.3 | 11,102 | 1.3 |
| 13 | Others | 99,992 | 12,964 | 13.0 | 112,956 | 13.4 |
| Rank | Province | Installed Capacity January 2022 (MW) | New Installations 2021 (MW) | Growth Rates (%) | Installed Capacity January 2021 (MW) | Share in the Country (%) |
|---|---|---|---|---|---|---|
| 1 | İzmir | 1886.70 | 88.55 | 4.9 | 1798.15 | 17.0 |
| 2 | Balıkesir | 1375.05 | 155.00 | 12.7 | 1220.05 | 12.4 |
| 3 | Çanakkale | 917.35 | 166.03 | 22.1 | 751.32 | 8.3 |
| 4 | Manisa | 727.55 | 10.80 | 1.5 | 716.75 | 6.6 |
| 5 | İstanbul | 684.39 | 350.09 | 104.7 | 334.30 | 6.2 |
| 6 | Kırklareli | 481.68 | 150.08 | 45.3 | 331.60 | 4.3 |
| 7 | Hatay | 437.85 | 23.20 | 5.6 | 414.65 | 3.9 |
| 8 | Afyon | 368.45 | 0.00 | 0.0 | 368.45 | 3.3 |
| 9 | Aydın | 365.60 | 72.00 | 24.5 | 293.60 | 3.3 |
| 10 | Konya | 337.80 | 24.00 | 7.6 | 313.80 | 3.0 |
| 11 | Yalova | 308.95 | 174.60 | 130.0 | 134.35 | 2.8 |
| 12 | Bursa | 286.00 | 143.40 | 100.6 | 142.60 | 2.6 |
| 13 | Kayseri | 274.35 | 0.00 | 0.0 | 274.35 | 2.5 |
| 14 | Osmaniye | 265.30 | 0.00 | 0.0 | 265.30 | 2.4 |
| 15 | Mersin | 253.55 | 0.00 | 0.0 | 253.55 | 2.3 |
| 16 | Muğla | 237.25 | 32.00 | 15.6 | 205.25 | 2.1 |
| 17 | Tekirdağ | 187.95 | 10.25 | 5.8 | 177.70 | 1.7 |
| 18 | Kırşehir | 168.00 | 0.00 | 0.0 | 168.00 | 1.5 |
| 19 | Sakarya | 162.70 | 135.10 | 489.5 | 27.60 | 1.5 |
| 20 | Sivas | 155.30 | 0.00 | 0.0 | 155.30 | 1.4 |
| Data | Content | Source |
|---|---|---|
| Wind speed | Wind speed at a height of 10 m | Turkish State Meteorological Service |
| Corine land cover | Land cover types | European Environment Agency (EEA) [44] |
| ASTGTM v003 | Digital elevation model | The United States Geological Survey (USGS) Earth Explorer [45] |
| Regional environmental plan | Residential areas, tourism areas, airports, areas of nature reserves, military areas, mining areas, organized industrial regions, logistics centers, small industrial areas, organized agriculture and livestock regions, work areas such as industry and storage areas, and water surfaces | General Directorate of Spatial Planning |
| GADM boundary map | Province and district boundaries | Global Administrative Areas |
| Land Use Characteristic | Friction Coefficient (α) |
|---|---|
| Smooth hard ground, calm water | 0.10 |
| Tall grass on level ground | 0.15 |
| High crops, hedges, and shrubs | 0.20 |
| Wooded countryside, many trees | 0.25 |
| Small town with trees and shrubs | 0.30 |
| Large city with tall buildings | 0.40 |
| Name of District | Wind Speed (m/s) | |||
|---|---|---|---|---|
| Max | Min | Mean | Std. Dev. | |
| Ayvalık | 6.79 | 4.21 | 6.00 | 0.37 |
| Balya | 10.91 | 3.79 | 6.73 | 1.44 |
| Bandırma | 10.82 | 6.63 | 8.17 | 0.67 |
| Bigadiç | 6.86 | 2.85 | 5.27 | 0.93 |
| Burhaniye | 10.02 | 6.16 | 7.12 | 0.55 |
| Dursunbey | 7.05 | 2.52 | 4.47 | 0.79 |
| Edremit | 10.05 | 3.56 | 6.16 | 0.88 |
| Erdek | 8.36 | 6.39 | 7.44 | 0.48 |
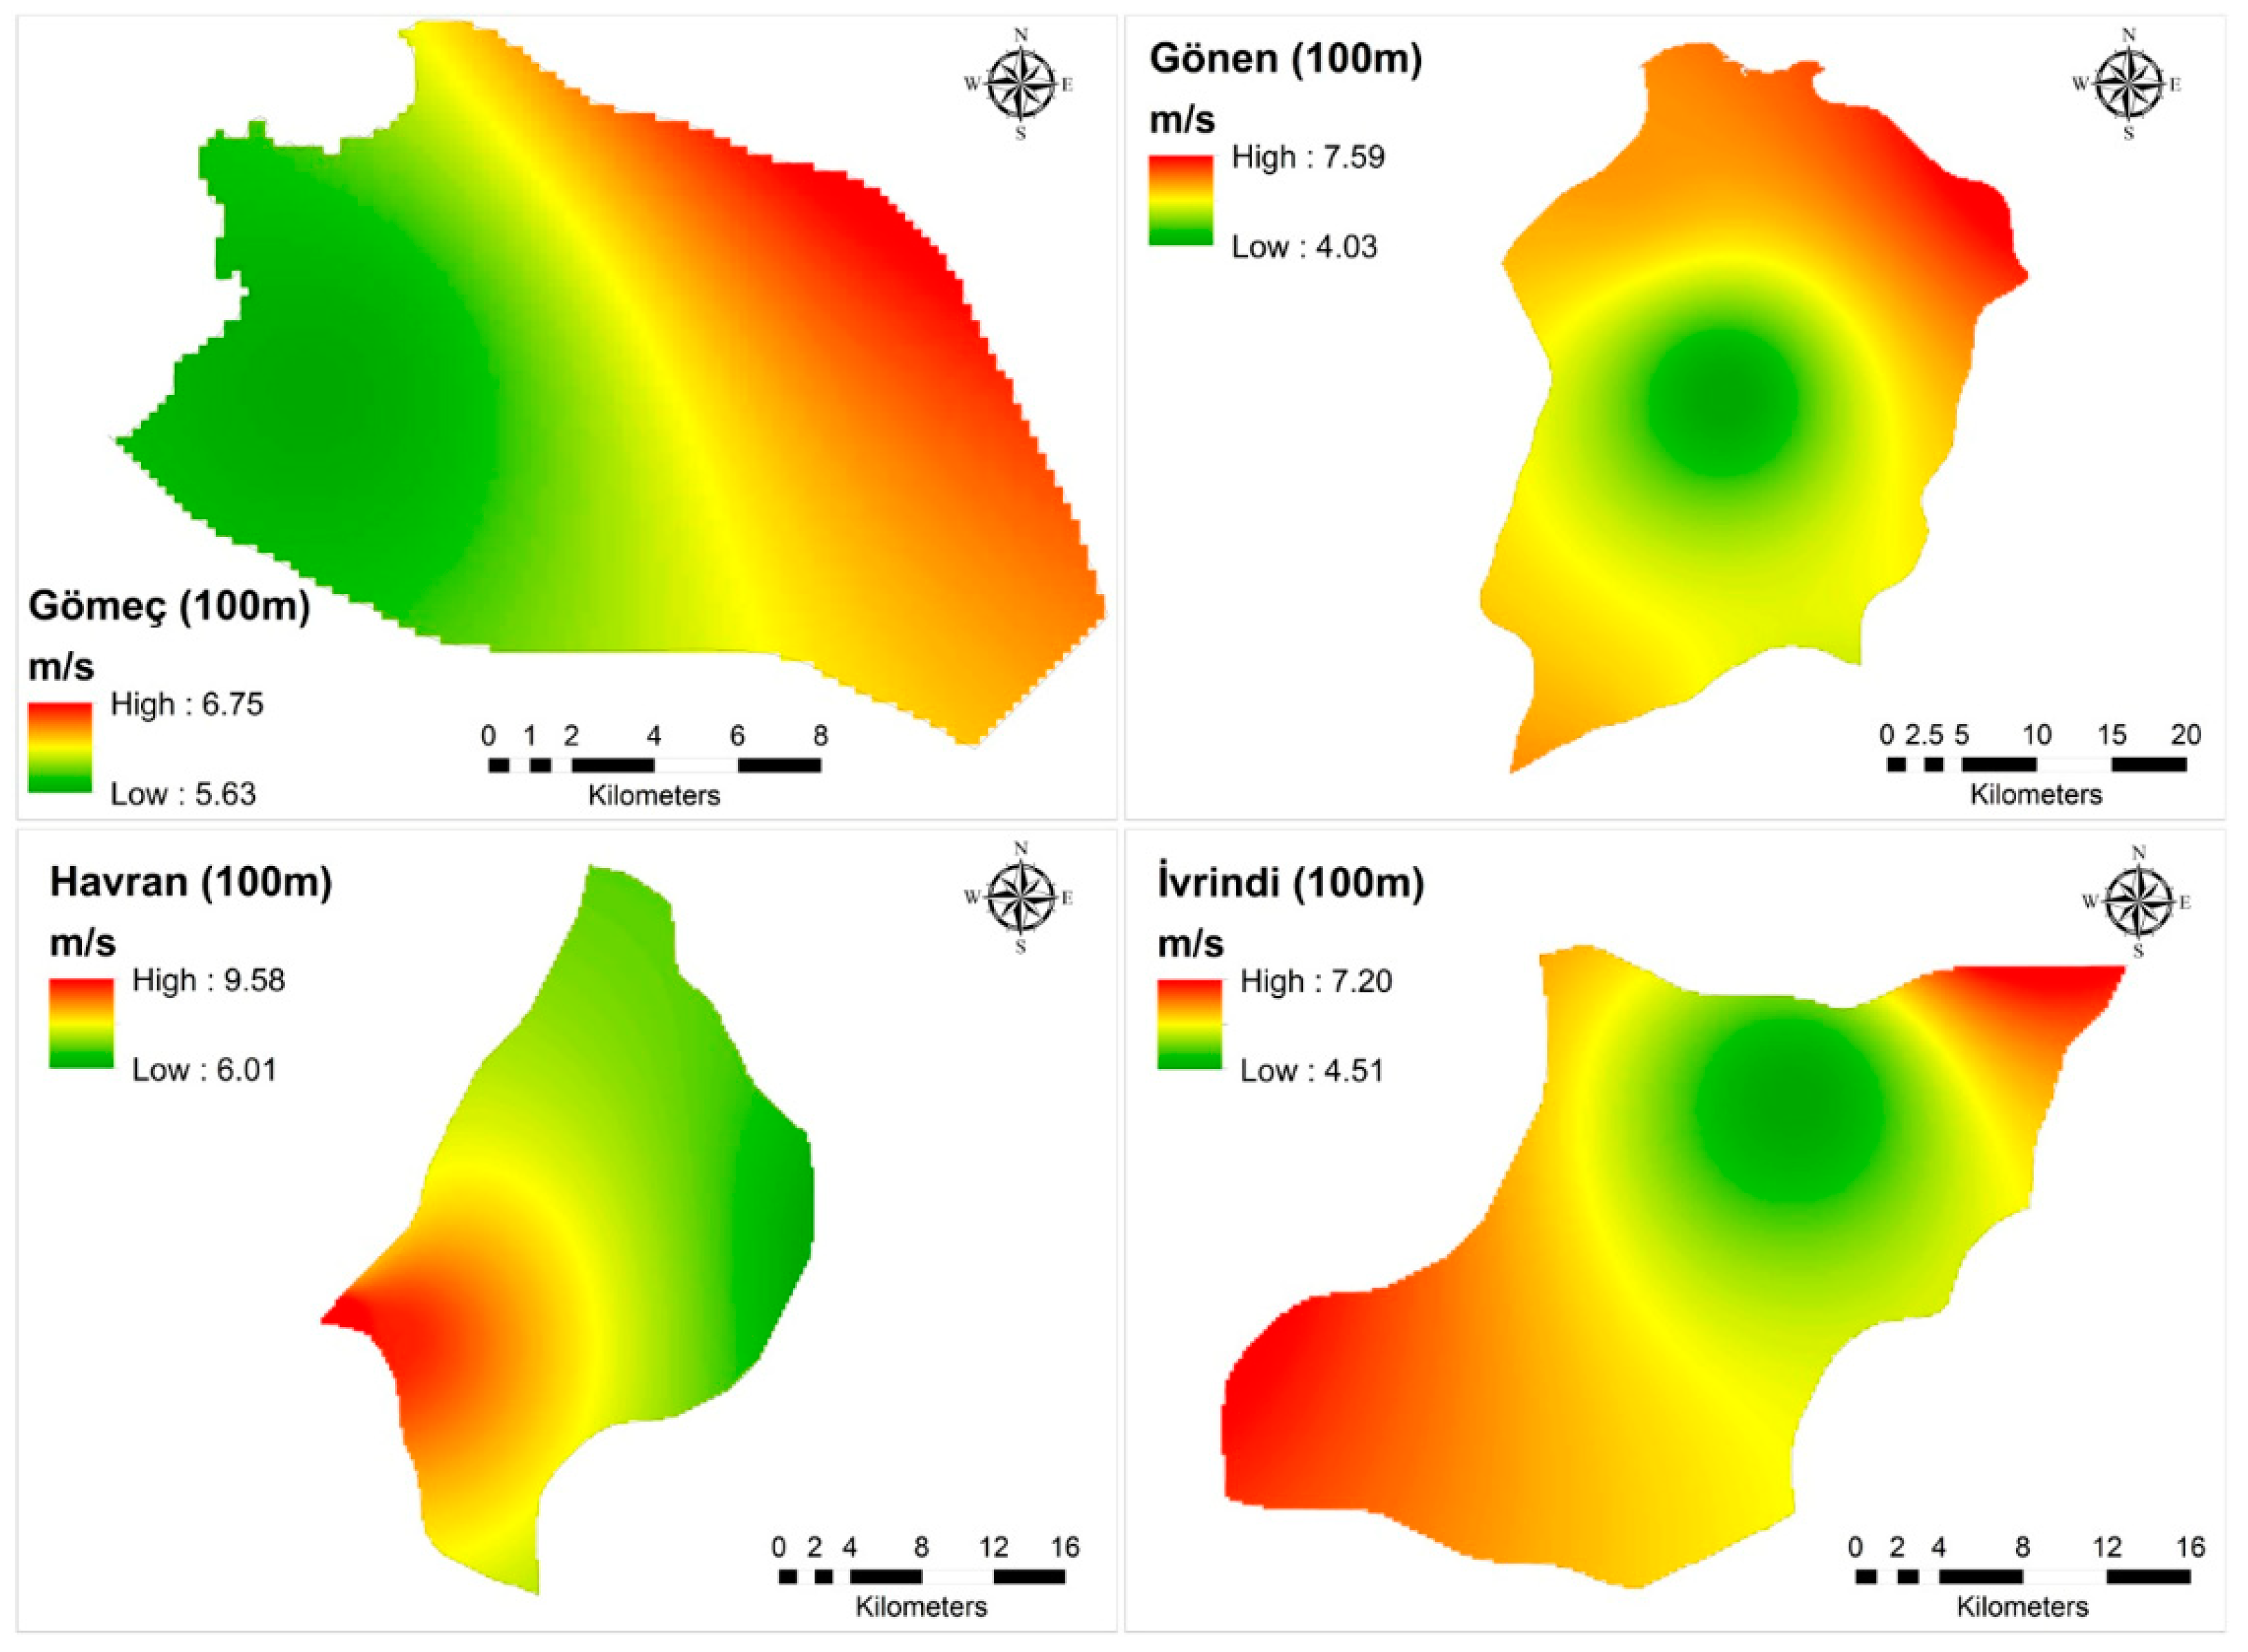
| Gömeç | 6.75 | 5.63 | 6.11 | 0.31 |
| Gönen | 7.59 | 4.03 | 5.80 | 0.68 |
| Havran | 9.58 | 6.01 | 6.91 | 0.43 |
| İvrindi | 7.20 | 4.51 | 5.86 | 0.59 |
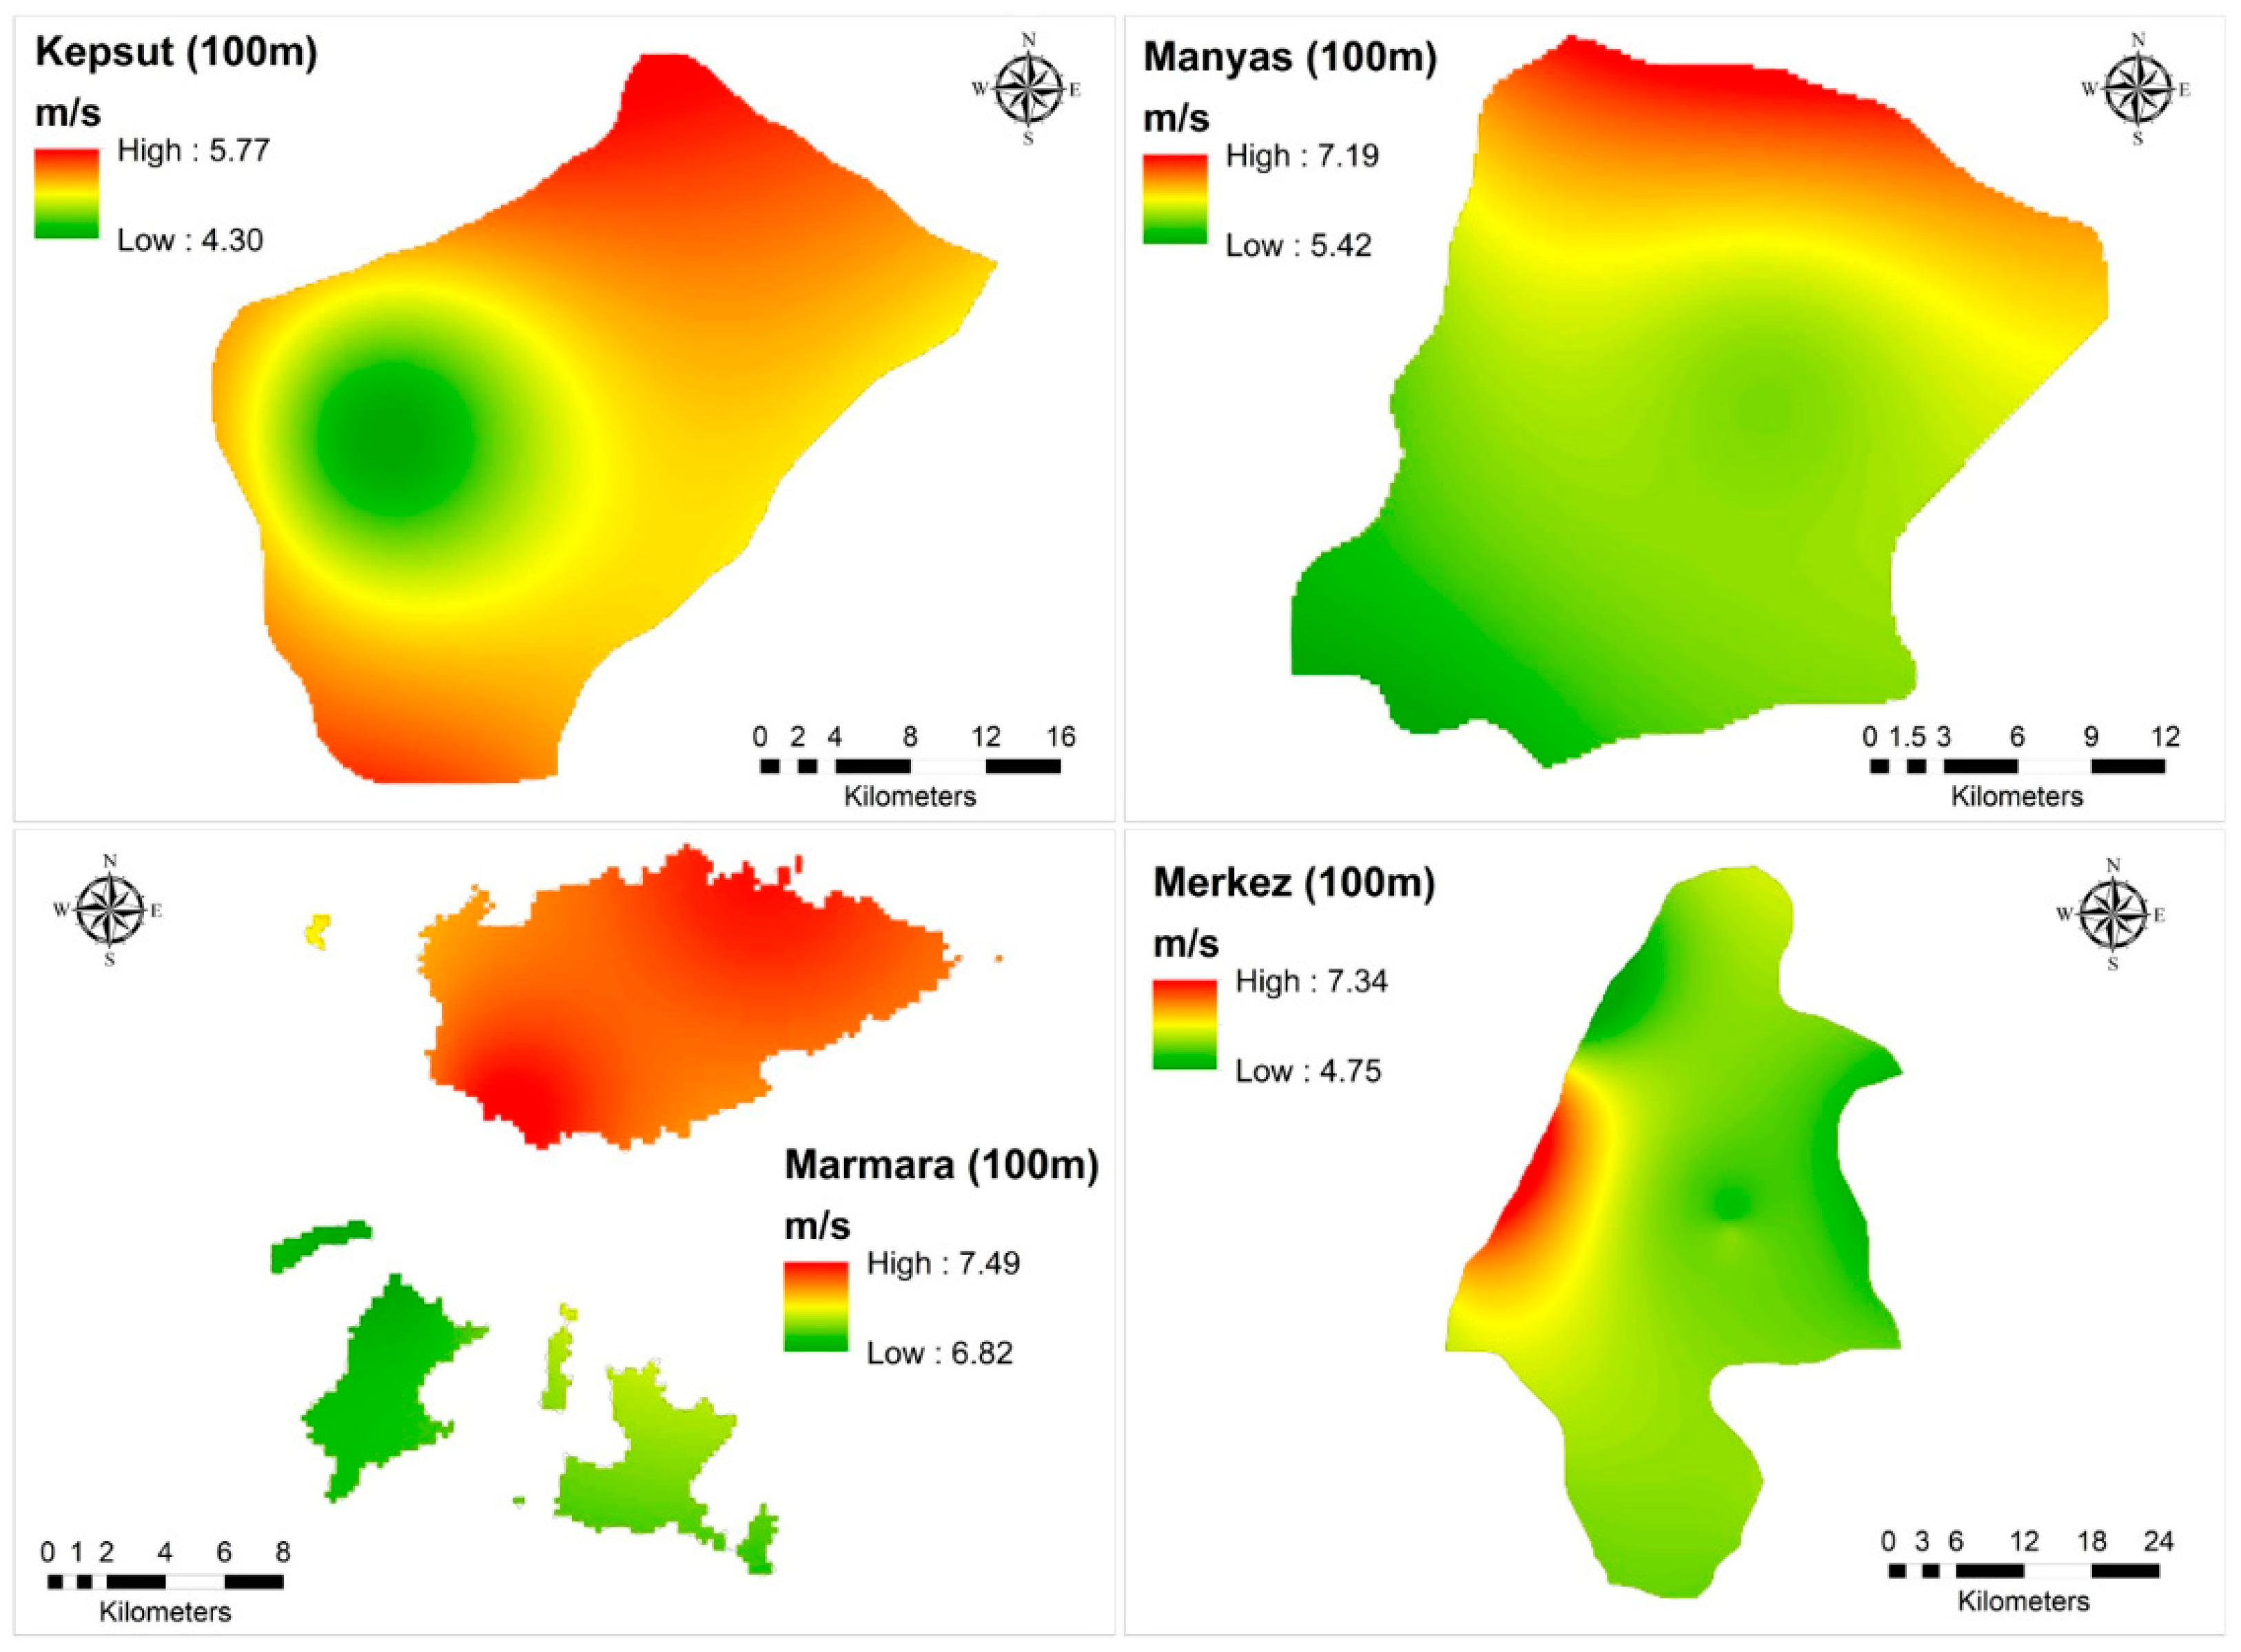
| Kepsut | 5.77 | 4.30 | 5.13 | 0.29 |
| Manyas | 7.19 | 5.42 | 6.10 | 0.34 |
| Marmara | 7.49 | 6.82 | 7.27 | 0.19 |
| Merkez (Altıeylül-Karesi) | 7.34 | 4.75 | 5.71 | 0.31 |
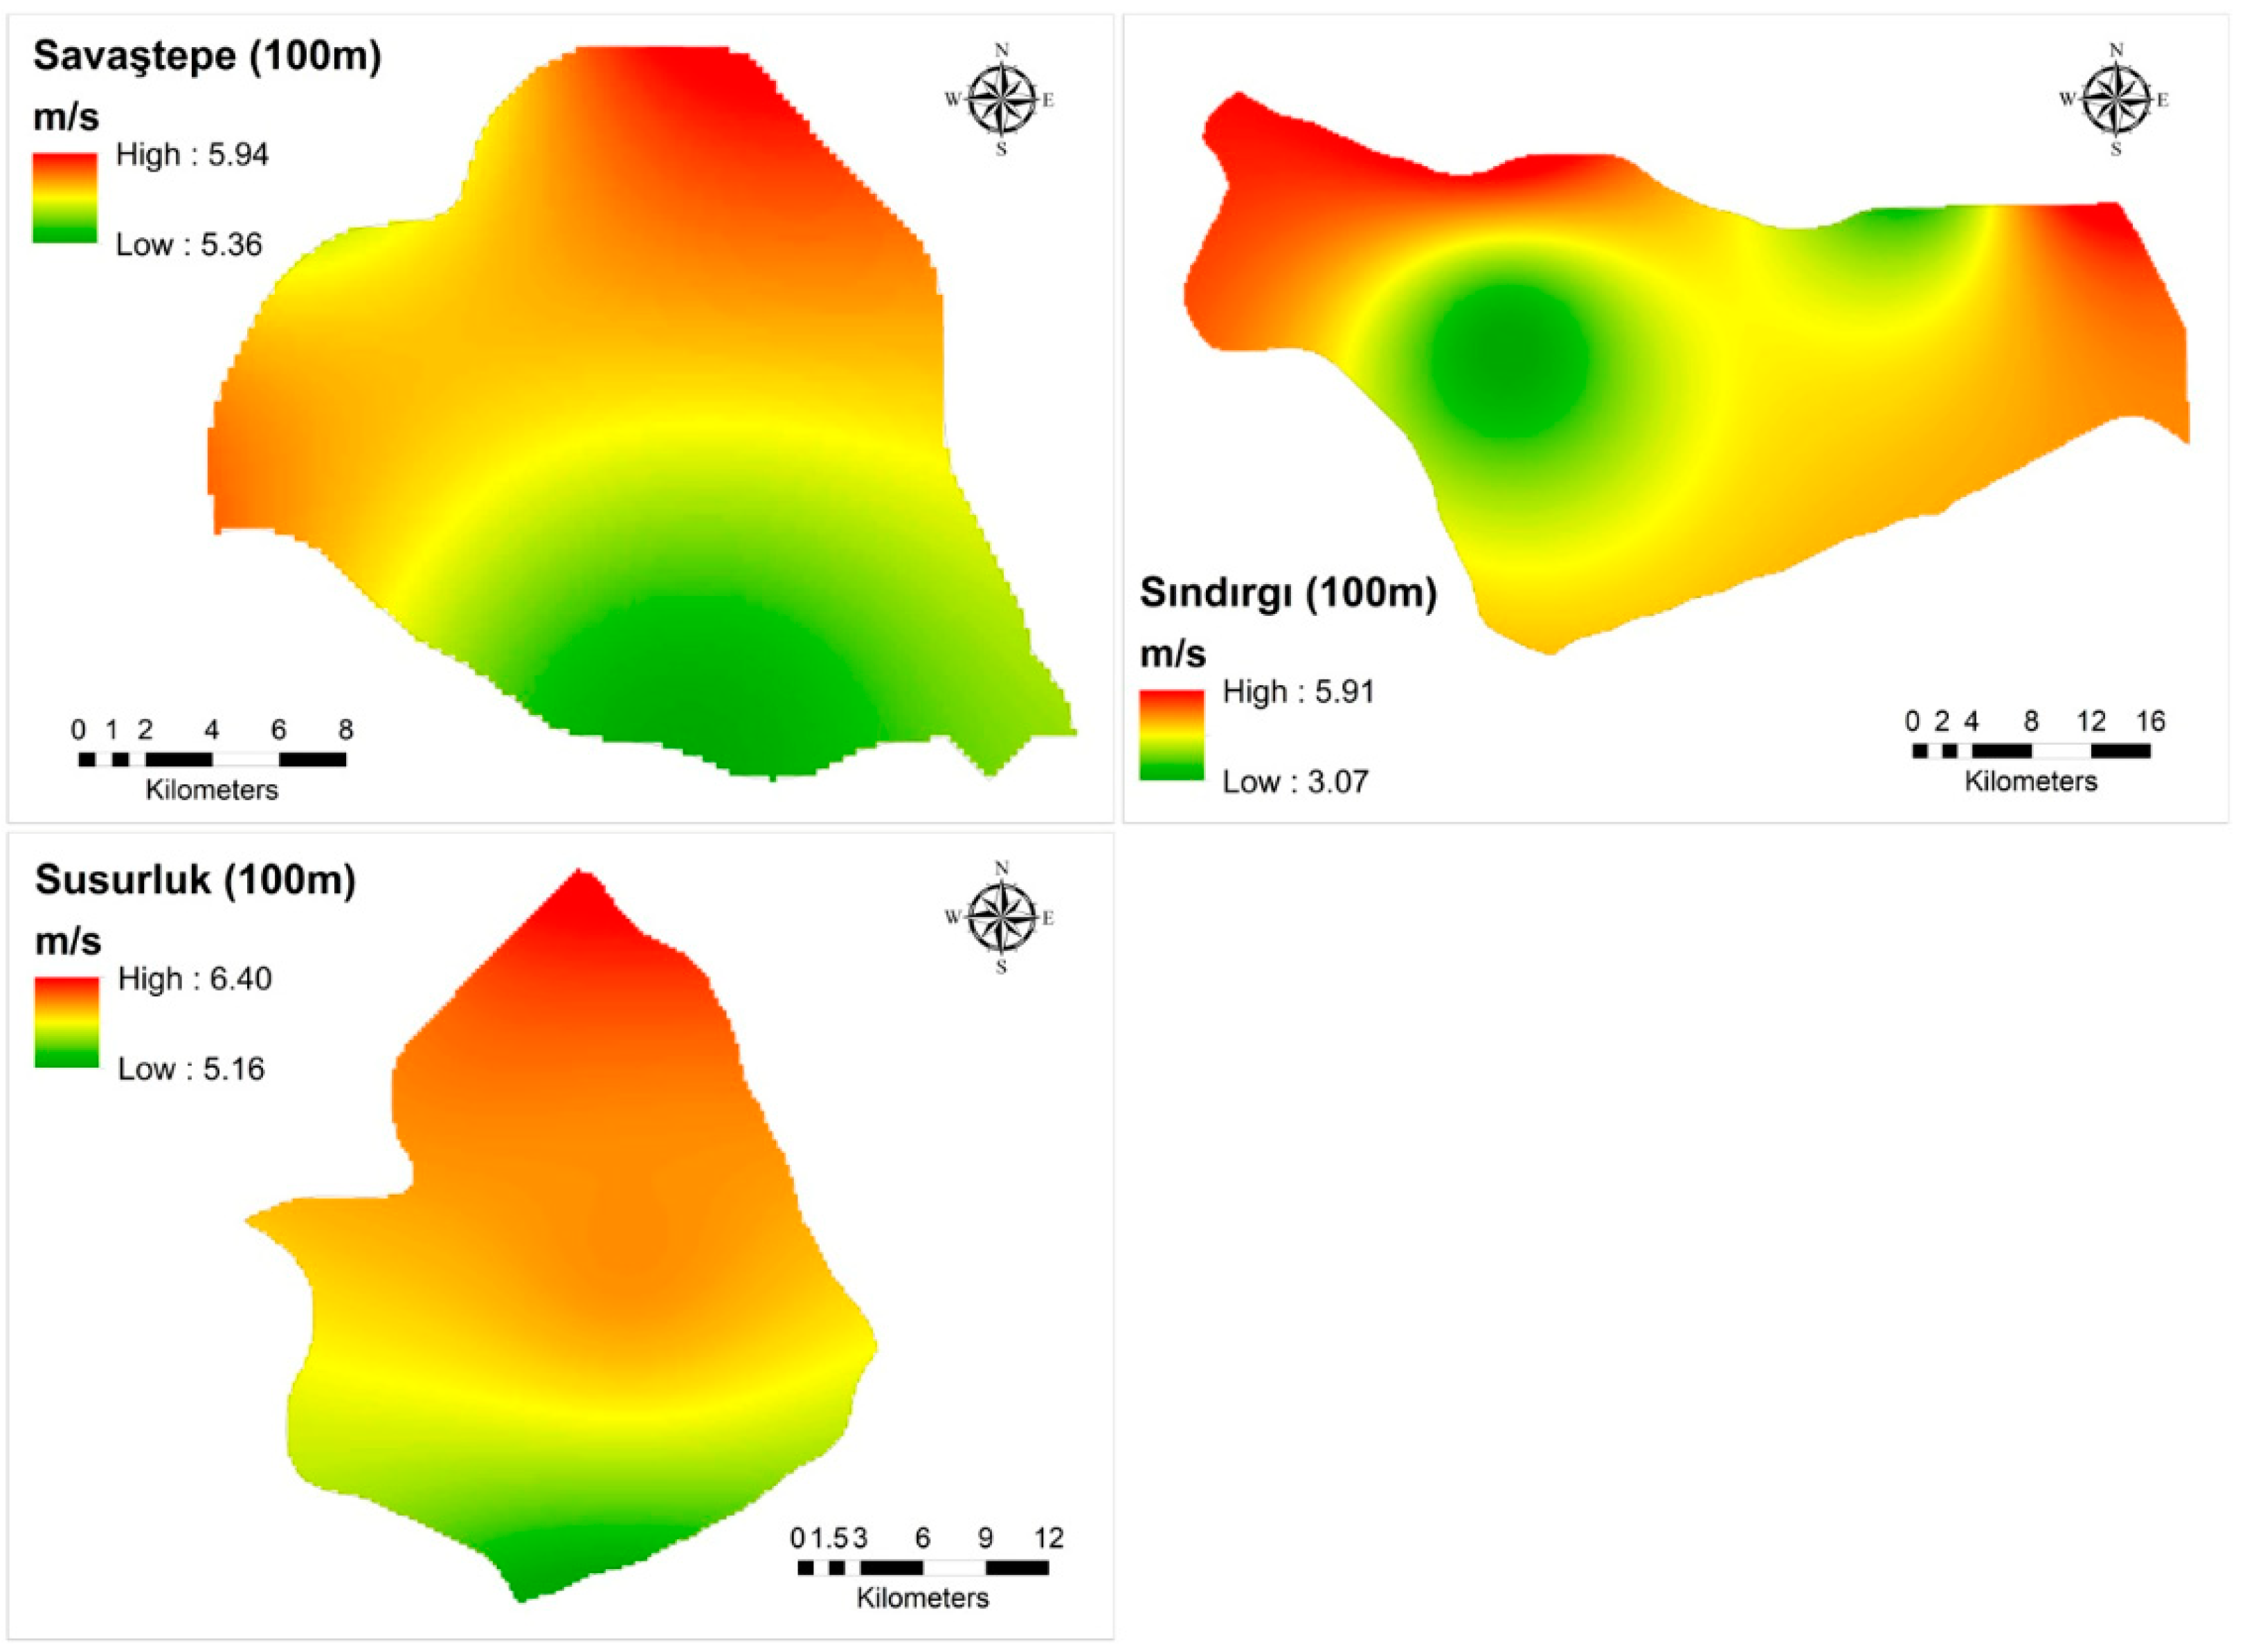
| Savaştepe | 5.94 | 5.36 | 5.64 | 0.13 |
| Sındırgı | 5.91 | 3.07 | 4.53 | 0.55 |
| Susurluk | 6.40 | 5.16 | 5.89 | 0.21 |
| Name of District | Wind Energy Potential (MW) | ||
|---|---|---|---|
| >6 m/s | >7 m/s | >8 m/s | |
| Ayvalık | 548.49 | 0.00 | 0.00 |
| Balya | 5758.53 | 3780.93 | 2416.78 |
| Bandırma | 4957.45 | 4839.97 | 3668.77 |
| Bigadiç | 848.04 | 0.00 | 0.00 |
| Burhaniye | 1625.17 | 929.52 | 265.30 |
| Dursunbey | 334.24 | 23.90 | 0.00 |
| Edremit | 2031.30 | 236.08 | 83.45 |
| Erdek | 1639.09 | 1466.05 | 427.49 |
| Gömeç | 674.11 | 0.00 | 0.00 |
| Gönen | 2010.05 | 275.84 | 0.00 |
| Havran | 2986.36 | 1451.84 | 51.75 |
| İvrindi | 1294.61 | 56.03 | 0.00 |
| Kepsut | 0.00 | 0.00 | 0.00 |
| Manyas | 1679.05 | 0.00 | 0.00 |
| Marmara | 664.25 | 553.82 | 0.00 |
| Merkez (Altıeylül-Karesi) | 875.36 | 64.96 | 0.00 |
| Savaştepe | 0.00 | 0.00 | 0.00 |
| Sındırgı | 0.00 | 0.00 | 0.00 |
| Susurluk | 1101.49 | 0.00 | 0.00 |
| Wind Speed Range (m/s) | Number of Cells | Total Area (km2) | Wind Potential (P) (MW) |
|---|---|---|---|
| 2.5–4.5 | 42,794 | 1711.76 | 1345.22 |
| 4.5–6.0 | 157,450 | 6298.00 | 16,702.09 |
| 6.0–7.0 | 76,122 | 3044.88 | 15,325.79 |
| 7.0–7.5 | 14,768 | 590.72 | 4127.50 |
| 7.5–8.0 | 7616 | 304.64 | 2601.31 |
| 8.0–8.5 | 6645 | 265.80 | 2738.29 |
| 8.5–9.0 | 4067 | 162.68 | 2000.94 |
| 9.0–9.5 | 1483 | 59.32 | 823.39 |
| 9.5–10.0 | 784 | 31.36 | 537.81 |
| >10 | 853 | 34.12 | 730.26 |
| Wind Speed Range (m/s) | Current Study | REPA | ||
|---|---|---|---|---|
| Total Area (km2) | Wind Potential (P) (MW) | Total Area (km2) | Wind Potential (P) (MW) | |
| 6.8–7.5 | 965.28 | 6468.10 | 1511.42 | 7557.12 |
| 7.5–8.1 | 364.64 | 3173.79 | 850.96 | 4254.80 |
| 8.1–8.6 | 252.88 | 2701.24 | 284.51 | 1422.56 |
| 8.6–9.5 | 174.92 | 2380.15 | 115.23 | 576.16 |
| >9.5 | 65.48 | 1205.53 | 3.34 | 16.72 |
| Total | 1823.20 | 15,928.81 | 2765.47 | 13,827.36 |
Disclaimer/Publisher’s Note: The statements, opinions and data contained in all publications are solely those of the individual author(s) and contributor(s) and not of MDPI and/or the editor(s). MDPI and/or the editor(s) disclaim responsibility for any injury to people or property resulting from any ideas, methods, instructions or products referred to in the content. |
© 2023 by the author. Licensee MDPI, Basel, Switzerland. This article is an open access article distributed under the terms and conditions of the Creative Commons Attribution (CC BY) license (https://creativecommons.org/licenses/by/4.0/).
Share and Cite
Yildiz, S.S. Determining Wind Energy Potential Using Geographic Information System Functions: A Case Study in Balıkesir, Turkey. Appl. Sci. 2023, 13, 9183. https://doi.org/10.3390/app13169183
Yildiz SS. Determining Wind Energy Potential Using Geographic Information System Functions: A Case Study in Balıkesir, Turkey. Applied Sciences. 2023; 13(16):9183. https://doi.org/10.3390/app13169183
Chicago/Turabian StyleYildiz, Selim Serhan. 2023. "Determining Wind Energy Potential Using Geographic Information System Functions: A Case Study in Balıkesir, Turkey" Applied Sciences 13, no. 16: 9183. https://doi.org/10.3390/app13169183
APA StyleYildiz, S. S. (2023). Determining Wind Energy Potential Using Geographic Information System Functions: A Case Study in Balıkesir, Turkey. Applied Sciences, 13(16), 9183. https://doi.org/10.3390/app13169183