Article

Aggregation Dispatch and Control Strategies for Multi-Type Loads in Industrial Parks

Guangdong Key Laboratory of Green Energy Technology, South China University of Technology, Guangzhou 510641, China
*
Author to whom correspondence should be addressed.
Appl. Sci. 2023, 13(16), 9205; https://doi.org/10.3390/app13169205
Submission received: 7 July 2023 / Revised: 9 August 2023 / Accepted: 10 August 2023 / Published: 13 August 2023
(This article belongs to the Special Issue Advances in Microgrids and Smartgrids Control Systems)

Abstract

:
With the continuous expansion of renewable energy construction, the power system requires a larger-scale flexible dispatchable and controllable resource for power balance. Fully tapping into the power regulation capability of multi-type loads in industrial parks, making them a low-cost flexible dispatchable and controllable resource, is an effective approach to establish power regulation capability at scale in the new power system. However, the control characteristics of multi-type loads in industrial parks vary greatly, and their control delay characteristics, response speed, and sustainable response time are all different. Traditional dispatch and control methods cannot achieve precise control of the massive and multi-type loads in industrial parks. Therefore, this paper establishes unified models for the control characteristics of multi-type loads in industrial parks, quantitatively characterizes their control delay characteristics, start–stop characteristics, and control response speed. Based on this, the aggregated dispatch and control model and dispatch and control strategy for multi-type loads in industrial parks are developed, which provide a predictive control rate for individual loads considering the delay and segmented response characteristics to achieve precise aggregation control of multi-type loads in industrial parks. Simulation results show that the aggregated dispatch and control model and its aggregated dispatch and control strategy achieve precise control of multi-type loads in industrial parks. Flexible dispatchable and controllable loads can provide low-cost power regulation capability for the new power system.

1. Introduction

As the scale of renewable energy construction continues to increase, the random fluctuations in its power generation have a huge impact on the power system. Power systems with a high proportion of renewable energy require large-scale flexible dispatchable and controllable resources to balance and regulate the system. Industrial parks, as the concentration areas of China’s industrial enterprises, have a diverse range of high-power loads that provide diverse power regulation capability. Fully tapping into the power regulation capability of the multi-types loads in the industrial park and making them into low-cost flexible controllable resources through lightweight modification is an effective approach to build the power regulation capability of the new power system on a large scale. However, the types of loads in industrial parks are varied, and some equipment cannot be regulated due to process limitations. The regulation capability of controllable equipment also varies greatly, and their control delay characteristics, response speed, and sustainable response time are different. The control response process is also restricted by the production plans of park enterprises. Therefore, it is necessary to comprehensively consider the production plans of each enterprise and the control characteristics of each load to achieve precise control of the multi-type loads in the industrial park. Otherwise, it will cause significant deviations in the control execution and have adverse effects on the operation of the power system.
The research on load dispatch and control strategies, both domestically and internationally, mostly focuses on the classification modeling of controllable loads and the analysis of control benefits for various types of loads. Regarding the classification modeling of controllable loads, Liu et al. [1] study classify controllable loads and establish various steady-state control models for controllable loads. Chen et al. [2] study the classification method of temperature-controlled loads and establishes steady-state control models for air-conditioning loads and electric water heaters, proposing an optimized scheduling strategy for temperature-controlled load clusters to participate in demand response. Liu et al. [3] study the characteristics of residential load participation in demand response and establishes an aggregated dispatch model for residential loads. Espinosa et al. [4] studies the characteristics of coordinating multiple controllable loads to participate in the demand response. Bian et al. [5] propose a management method for using multiple demand-side resources to respond to renewable energy power fluctuations, to improve the speed of the demand response. The study by Marcos Tostado-Véliz et al. [6] separately conducts the model for curtailable loads and deferrable loads, but it does not provide descriptions of response characteristics such as response delay and response speed. Xueqian Fu et al. [7] and Xueqian Fu et al. [8] establish a greenhouse load control model, including an artificial lighting model, a heating load model, and a load shifting model. A novel optimal operation strategy for rural microgrid and clean energy systems is proposed considering greenhouse load control.
Regarding the dispatch and control strategies of various controllable loads, Tu et al. [9] consider linear and nonlinear response models and proposes a dynamic economic dispatch strategy combined with demand response. Wang et al. [10] propose an interruptible load dispatch model considering user subsidy rates, which effectively reduces peak loads and operating costs. Gao et al. [11] establish a revenue model for controllable load aggregation merchants, comprehensively considering the game relationship between users and aggregation merchants, and providing the optimal compensation pricing strategy for aggregation merchants. Sun et al. [12] summarize the business of foreign aggregation merchants, analyzing the operating mechanisms, dispatch, and control strategies of multiple types of controllable resources such as controllable loads, energy storage devices, and distributed power sources. Xu et al. [13] propose a multi-time scale optimization dispatch model considering wind power uncertainty and demand response, using demand response to reduce control errors caused by wind power uncertainty. Do Prado et al. [14] propose a decision-making model for electricity retailers considering short-term demand response, achieving the maximization of profits from participating in the electricity market. Saavedra et al. [15] propose a flexible load management mode based on elastic bands to achieve the aggregation response of a large number of flexible loads. Ryu et al. [16] propose an operation strategy for virtual power plants in electricity markets, improving the flexibility of demand response resources and the revenue of virtual power plants. According to Wang et al. [17], the demand response is carried out based on real-time electricity prices, adjusting the total load of users to maximize their profits and alleviate the imbalance between electricity supply and demand. Zhang et al. [18] propose a two-layer model with a single leader and multiple followers to optimize the real-time transaction strategy of the demand response aggregator. Zara Oskouei et al. [19] proposes a load decomposition algorithm to identify different user behaviors and derive the optimal dispatch strategy for the demand response aggregator.
The existing literature has studied the uncertainty of the errors generated by the controllable load aggregation response. Zhu et al. [20] consider the uncertainty of user load response and construct an optimization model for demand response aggregator contract decisions. Wang et al. [21], based on the characteristics of information physical fusion system of demand response, only consider incentive-based DR, and model the incentive and reliability constraints of the distribution network on the aggregator, the reliability of the user response, and the reliability of the aggregator to study the impact of uncertainty in the user response on the response capability, reliability, and operational economy of the aggregator. Cui et al. [22] propose a demand-response method that considers multiple flexible loads, classifies flexible loads using a physical process analysis and reasoning model, and models the load using an improved WGAN gradient penalty model, effectively reducing modeling errors and improving the responsiveness of the park’s load. Xu et al. [23] propose a demand response perception and decision-making method based on dynamic consumer classification, effectively controlling the deviation between response and bidding amounts and improving the aggregator’s transaction revenue. Zheng et al. [24] uses energy storage devices to handle power deviations due to uncertainty in renewable energy output and user response, effectively reducing the cost of multi-energy aggregators and improving risk management capability. Han et al. [25] propose a two-layer scheduling model that considers the uncertainty of demand response, design the operating modes of two energy storage systems for energy arbitrage and deviation mitigation, and improve the net profit of the load service entity. Zhuoli Zhao et al. [26] propose a distributed robust model predictive control for islanded multi-microgrids, which will reduce the adverse effects of uncertain renewable energy output and improve the robustness of the micro-grid system.
The above studies did not consider the control characteristics of multi-type loads in industrial parks, such as control response delay, response speed, and sustainable response time. For example, in a cement plant in an industrial park, it takes several hours to arrange the response time from receiving instructions to starting the cement mill, while for a thermal storage boiler, it takes about 30 min from the start of the response to the end. Ignoring the control-response characteristics of different time scales will result in significant deviations between the control results of each controlled object and the control target, making it impossible to achieve precise control. Therefore, this paper presents a unified modeling of the control characteristics of multi-type loads in industrial parks, quantifying the control-delay characteristics, start–stop characteristics, and control response speed during their control response process. Based on this, the paper proposes a model for the aggregated control of multi-type loads in industrial parks and their control strategies, providing a predictive control rate for individual load that considers delay and segmented response characteristics to achieve precise control of multi-type loads in industrial parks. The main innovations of this paper are listed as follows:
  • The paper abstracts and unifies the multidimensional control-response characteristics of multi-type of controllable loads in industrial parks, including control-delay characteristics, start–stop characteristics, and control-response-speed characteristics, and establishes a phased response model for controllable loads. This lays the foundation for achieving precise system-level control in industrial parks.
  • Establish a day-ahead and intra-day aggregate optimization dispatch model for an industrial park that includes controllable loads with multidimensional control response characteristics. The optimization dispatch objective is to minimize the overall operation cost of the industrial park. A two-stage solving method is implemented to transform the mixed-integer nonlinear programming problem into a mixed-integer linear programming problem, achieving efficient solutions for both day-ahead optimization dispatch and intra-day rolling optimization dispatch strategies.
  • Based on the multidimensional control response characteristics and phased response model of controllable loads in the industrial park, a real-time forecast and control model for a single controllable load unit is established. The minimum variance control rate of the controllable load is calculated with the goal of minimizing the error while tracking the rolling optimization dispatch strategy. Precise control of controllable loads is realized through rolling forecasting and closed-loop optimization control.

2. Aggregated Dispatch and Control Framework for Multi-Type Loads in Industrial Parks

The electricity consumption behavior of multi-type loads in industrial parks is affected by changes in production plans, which may result in significant deviations in the day-ahead load forecasts for individual companies. To address the control and response characteristics of multi-type loads in industrial parks, a model for the aggregation and control of multi-type loads and a predictive control model for controllable loads are proposed, in order to achieve precise and unified aggregation and control of multi-type loads in industrial parks.

2.1. Control Characteristics of Multi-Type Loads in Industrial Parks

Curtailable loads, interruptible loads, and shiftable loads are all considered as one type of controllable load in this paper. These three types of loads all have three operational stages: start-up, operation, and shutdown. After receiving start-up, power regulation, and shut-down commands, multi-type loads in industrial parks need to determine whether to participate in control based on the current production plan requirements and load control constraints. Controllable loads often have start-up and shut-down delays, and there are response phases of power increase or decrease during start-up and shut-down. In the process of control response, their operating power can be regulated according to the control requirements based on the load operating rules. Therefore, most of the multi-type loads in industrial parks are restricted control objects. The control process for these restricted control objects can be abstracted into three stages: start-up, operation, and shut-down, each of which has different control response-time characteristics. Typical operational characteristics curves of controllable loads in industrial parks are shown in Figure 1.
Controllable loads exhibit different control response characteristics during the stages of startup, operation, and shutdown. Non-parametric models are utilized separately to model the control response characteristics of these three stages.
  • Startup stage: After receiving a startup command, the controllable load starts from a shutdown state after a delay and operates under the specified conditions. The startup process can be regarded as zero initial-state step response with an invariant input, which is the inherent startup characteristic of controllable load, and can be described by a non-parametric model.
Perform a unit step response experiment when the controllable load is in a shutdown state, measure the power output value of the controllable load, which is denoted as a k = a k T , k = 1,2 , , and T T = 15   m i n presents the sampling period. Assuming that the controllable load is an asymptotically stable object, and its output reaches steady state after N steps of change, the unit step response sequence of the controllable load in startup stage is denoted as a k = 0 , , 0 , a θ + 1 , a θ + 2 , , a N , θ T is the startup response delay of the controllable load.
Considering the controllable load as a linear object, by the homogeneity of a linear system, the output of the controllable load during the startup stage can be expressed as:
p k = a k u k s ,   k k s , k s + N T 1  
Δ u k = u k u k 1 = 0 ,   k   k s + 1 , k s + N T 1
  • Operation stage: The output power of controllable load can be adjusted within a certain range. After receiving a control command, it responds after a delay, and the response process is regarded as a non-zero state response, described by a non-parametric model.
Perform a unit step response experiment during operation stage when the controllable load is in a steady state, using the same method as in the startup stage. The unit step response sequence of the controllable load during operation is obtained as b k = 0 , , 0 , a τ + 1 , a τ + 2 , , a V , and its output reaches steady state after V steps of change, τ T is the control response delay of the controllable load during operation stage.
According to the homogeneity and superposition of the linear system, the power output of the controllable load during the operation stage is:
p k = b V u k V + i = 1 V 1 b i Δ u ( k i ) ,   k k r , k r + V T 1  
The output of the controllable load during the operation stage at time k is related to the control action at time k V and the change in the control action during the period from time k V to time k .
  • Shutdown stage: After receiving a shutdown command, the controllable load enters the shutdown stage after a delay, and its shutdown process can be regarded as a zero-input response, which is the inherent startup characteristic of the controllable load, and can be described by a non-parametric model.
Perform a shutdown response experiment when the controllable load is in a steady state, using the same method as in the startup stage. The unit step response sequence of the controllable load during shutdown is obtained as c k = 1 , , 1 ,   c δ + 1 , a δ + 2 , ,   a L = 0 , and its output reaches steady state after L steps of change, δ T is the control response delay of the controllable load during shutdown stage.
The controllable load enters the shutdown process immediately after receiving a shutdown command, the power output of the controllable load during shutdown stage can be obtained as:
p k = c i p k c ,   k k c , k c + L T 1
The model of controllable load proposed in this paper is a non-parametric model, in which the response characteristic curve is obtained through fitting with measured data. When implementing a unit step response test on a controllable load, the time at which the control command is issued is considered as the time when the control action starts to take effect. Therefore, the impact of communication delay has already been reflected in the measured response results. The response delay considered in the model includes not only the response delay of the load itself but also the communication delay.
The start-up delay and start-up response time of multi-type loads in industrial parks are different, which leads to different advance notice times required for their participation in regulation. Some types of loads need to be given regulation instructions one day in advance to make production plans for the regulation period, while some types of loads only need to be given regulation instructions 15 min in advance to respond quickly. At the same time, there is a large difference in the sustained response time of different types of loads, with some loads having a response duration of only 30 min and others being able to respond flexibly within a duration of 15 min to 3 h as needed. Therefore, it is necessary to determine the types of loads and their regulation power that participate in regulation based on the regulation instruction issuance time and regulation power curve requirements. It can be seen that modeling the response characteristics of multi-type loads in industrial parks is a prerequisite for precise control.

2.2. Aggregated Control Framework for Multi-Type Loads in Industrial Parks

Due to the different control characteristics of multi-type loads in industrial parks at different time scales, as well as their behaviors being affected by daily production plan changes, it is necessary to establish a real-time closed-loop predictive control model for controllable loads based on their control characteristics and response delays. Based on this, an aggregated control model for multi-type loads in industrial parks can be established to achieve precise unified aggregation and control of multi-type loads in industrial parks.
As shown in Figure 2, the three-level aggregated control framework belongs to a funnel structure of controllable loads: for controllable loads whose start-up delay and start-up response time sum is less than one day, they can all participate in day-ahead optimal dispatch; for controllable loads whose start-up delay and start-up response time sum is less than one hour, they can continue to participate in intra-day rolling optimal dispatch after participating in day-ahead optimal dispatch. The real-time predictive control part of a single load determines its control power.

3. Aggregated Control Strategy for Multi-Type Loads in Industrial Parks

To achieve precise unified aggregation and control of multi-type loads in industrial parks, the aggregated control strategy needs to include day-ahead and intra-day optimal dispatch, as well as real-time predictive control strategy for individual controllable loads. This is to provide the aggregated day-ahead optimal dispatch strategy and intra-day rolling optimal dispatch strategy for multi-type loads in industrial parks, and based on real-time predictive control of individual controllable loads, to achieve precise aggregated control of the entire multi-type loads in industrial parks.

3.1. Day-Ahead Optimal Dispatch of Aggregated Multi-Type Loads in Industrial Parks

Day-ahead optimal dispatch is used to determine the start–stop combination and power regulation plan for each controllable load in 15 min intervals for the next day.

3.1.1. Day-Ahead Power Balance Equation of Industrial Park with Multi-Type Loads

P G r i d , t = P N L , t + i = 1 N L P A L , i , t P R E , t

3.1.2. Optimization Objective of Day-Ahead Dispatch

The industrial park, with the aggregated multiple types of loads, participates in the day-ahead electricity spot market as a virtual power plant. The day-ahead clearing curve is formed, which serves as the day-ahead pre-dispatch plan curve for the industrial park. If there is a deviation between the actual execution curve and the day-ahead pre-dispatch curve, the industrial park will bear the deviation penalty. Considering the deviation penalty, the optimization objective for day-ahead is to minimize the overall operation cost:
m i n C D h = t = 1 T d a y C G r i d , t + C D r , t
C G r i d , t = P G r i d , t R t
C D r , t = max 0 , P G r i d , t P b a s e , t R d r , t u + m a x ( 0 , P b a s e , t P G r i d , t ) R d r , t l

3.1.3. Constraints of Day-Ahead Dispatch

  • Constraint on interconnection lines:
    P G r i d , t , m a x P G r i d , t P G r i d , t , m a x
  • Constraint on controllable load operation:
    P A L , i , t m i n P A L , i , t P A L , i , t m a x ,   t ( t r , t c )
    s i . m i n R t = 1 T s i , t R s i . m a x R
    s i . s t R t = t r t c s i . t R
    t = 1 T s i , t S s i , m a x S N i , s
    s i , t R = 0 ,   t t s t a r t , t e n d

3.1.4. Day-Ahead Optimal Dispatch Strategy

From the comprehensive analysis of the day-ahead power balance equation, optimization objective function, interconnection line constraints, and controllable load-operation constraints, it can be seen that when the load start–stop process is not considered, the optimization problem is a mixed-integer linear programming problem. However, after considering the load start–stop process, the day-ahead optimization dispatch is no longer a mixed-integer linear programming problem. Ignoring the load start–stop process, the solution method based on mixed-integer linear programming can obtain the start–stop status of each load. After determining the start–stop status of each load, the day-ahead optimal control problem of the industrial park load aggregation can be solved by transforming it into a mixed-integer linear programming problem. Therefore, a two-stage solution strategy is adopted to transform the original problem into two convex optimization problems: day-ahead controllable load start–stop status optimization and day-ahead controllable load economic control optimization.
Solution Stage 1: Assuming that the controllable load start–stop process has no transitional process, the original problem is a mixed-integer linear programming problem, and a feasible solution set of the controllable load start–stop status can be obtained after solving.
Solution Stage 2: Based on the feasible solution set of the controllable load start–stop status, the problem in Stage 2 is also a mixed-integer linear programming problem, and the final solution of other decision variables is obtained.
It can be seen that the two-stage solution method, on the one hand, does not change the time complexity of the original problem even if the power sequence during the start-up process is nonlinear. On the other hand, due to the polynomial time complexity of the two-stage problem, the original complex problem can still be efficiently solved by transforming it into a mixed-integer linear programming problem using the two-stage solution method, even when facing large-scale multi-type load characteristics of industrial parks.

3.2. Intra-Day Rolling Optimization Dispatch of Aggregated Multi-Type Loads in Industrial Parks

Based on the results of the previous day’s optimization, more accurate ultra-short-term new energy output forecasts and rigid load forecasts are used to perform rolling optimization of the start–stop and operation power of controllable loads for the next 4 h every hour of the day.
Considering the cost of purchasing and selling electricity in industrial parks and the deviation assessment of power execution, the goal of the intra-day rolling optimization is to minimize the overall operating cost:
m i n C D i n , t 0 = t = t 0 t 0 + 16 C G r i d , t + C D r , t  
The power balance equation and constraints for the intra-day rolling optimization dispatch are the same as those for the previous day, and the solution process is also the same as the previous day. The results obtained are the ideal reference values for the start–stop and power adjustment plans of various controllable loads in real-time predictive control of multi-type loads in industrial parks.

3.3. Real-Time Predictive Control of Multiple Types Loads in Industrial Parks

Controllable loads in industrial parks generally have a d-step response delay, and the control action u ( k ) at the current time k must be delayed by d cycles to affect the output of controllable loads. Therefore, in order to minimize the variance between the actual and ideal values of output power, it is necessary to predict the actual value of output power d steps ahead, and then calculate the appropriate control action u ( k ) based on the predicted value to compensate for the effect of random interference on the output at time t + d . Through real-time iterative prediction and control, the actual value of output power can always be kept with the minimum steady-state variance from the ideal value.

3.3.1. Real-Time Predictive Control Model

During the operating stage, the controllable loads are predicted and controlled using a model. The prediction horizon is P and the control horizon is M = P τ , where τ is the response delay duration of the controllable loads during the operating stage.
k + i | k represents the prediction from k to k + i , and the i t h predicted output value of the controllable load at the time k ( k [ t r , t c ] in the future is:
p ¯ k + i k = p 0 ¯ k + i k + Δ p ¯ k + i k
In the equation:
p 0 ¯ k + i k is the predicted output value considering the control action that has already occurred:
p 0 ¯ k + i k = b V u k + i V + j = i + 1 V b j Δ u ( k + i j )
Δ p ¯ k + i k is the predicted output variation value considering the control action after prediction and control:
Δ p ¯ k + i k = b i Δ u k + b i 1 Δ u k + 1 k + + b 1 Δ u k + i k
In the prediction horizon P:
Δ p ¯ k + P k = b P Δ u k + b P 1 Δ u k + 1 k + + b τ + 1 Δ u k + P τ k
Due to unknown factors such as model mismatch and environmental interference, the actual predicted value may deviate from the actual value. The model prediction result can be corrected based on real-time feedback information:
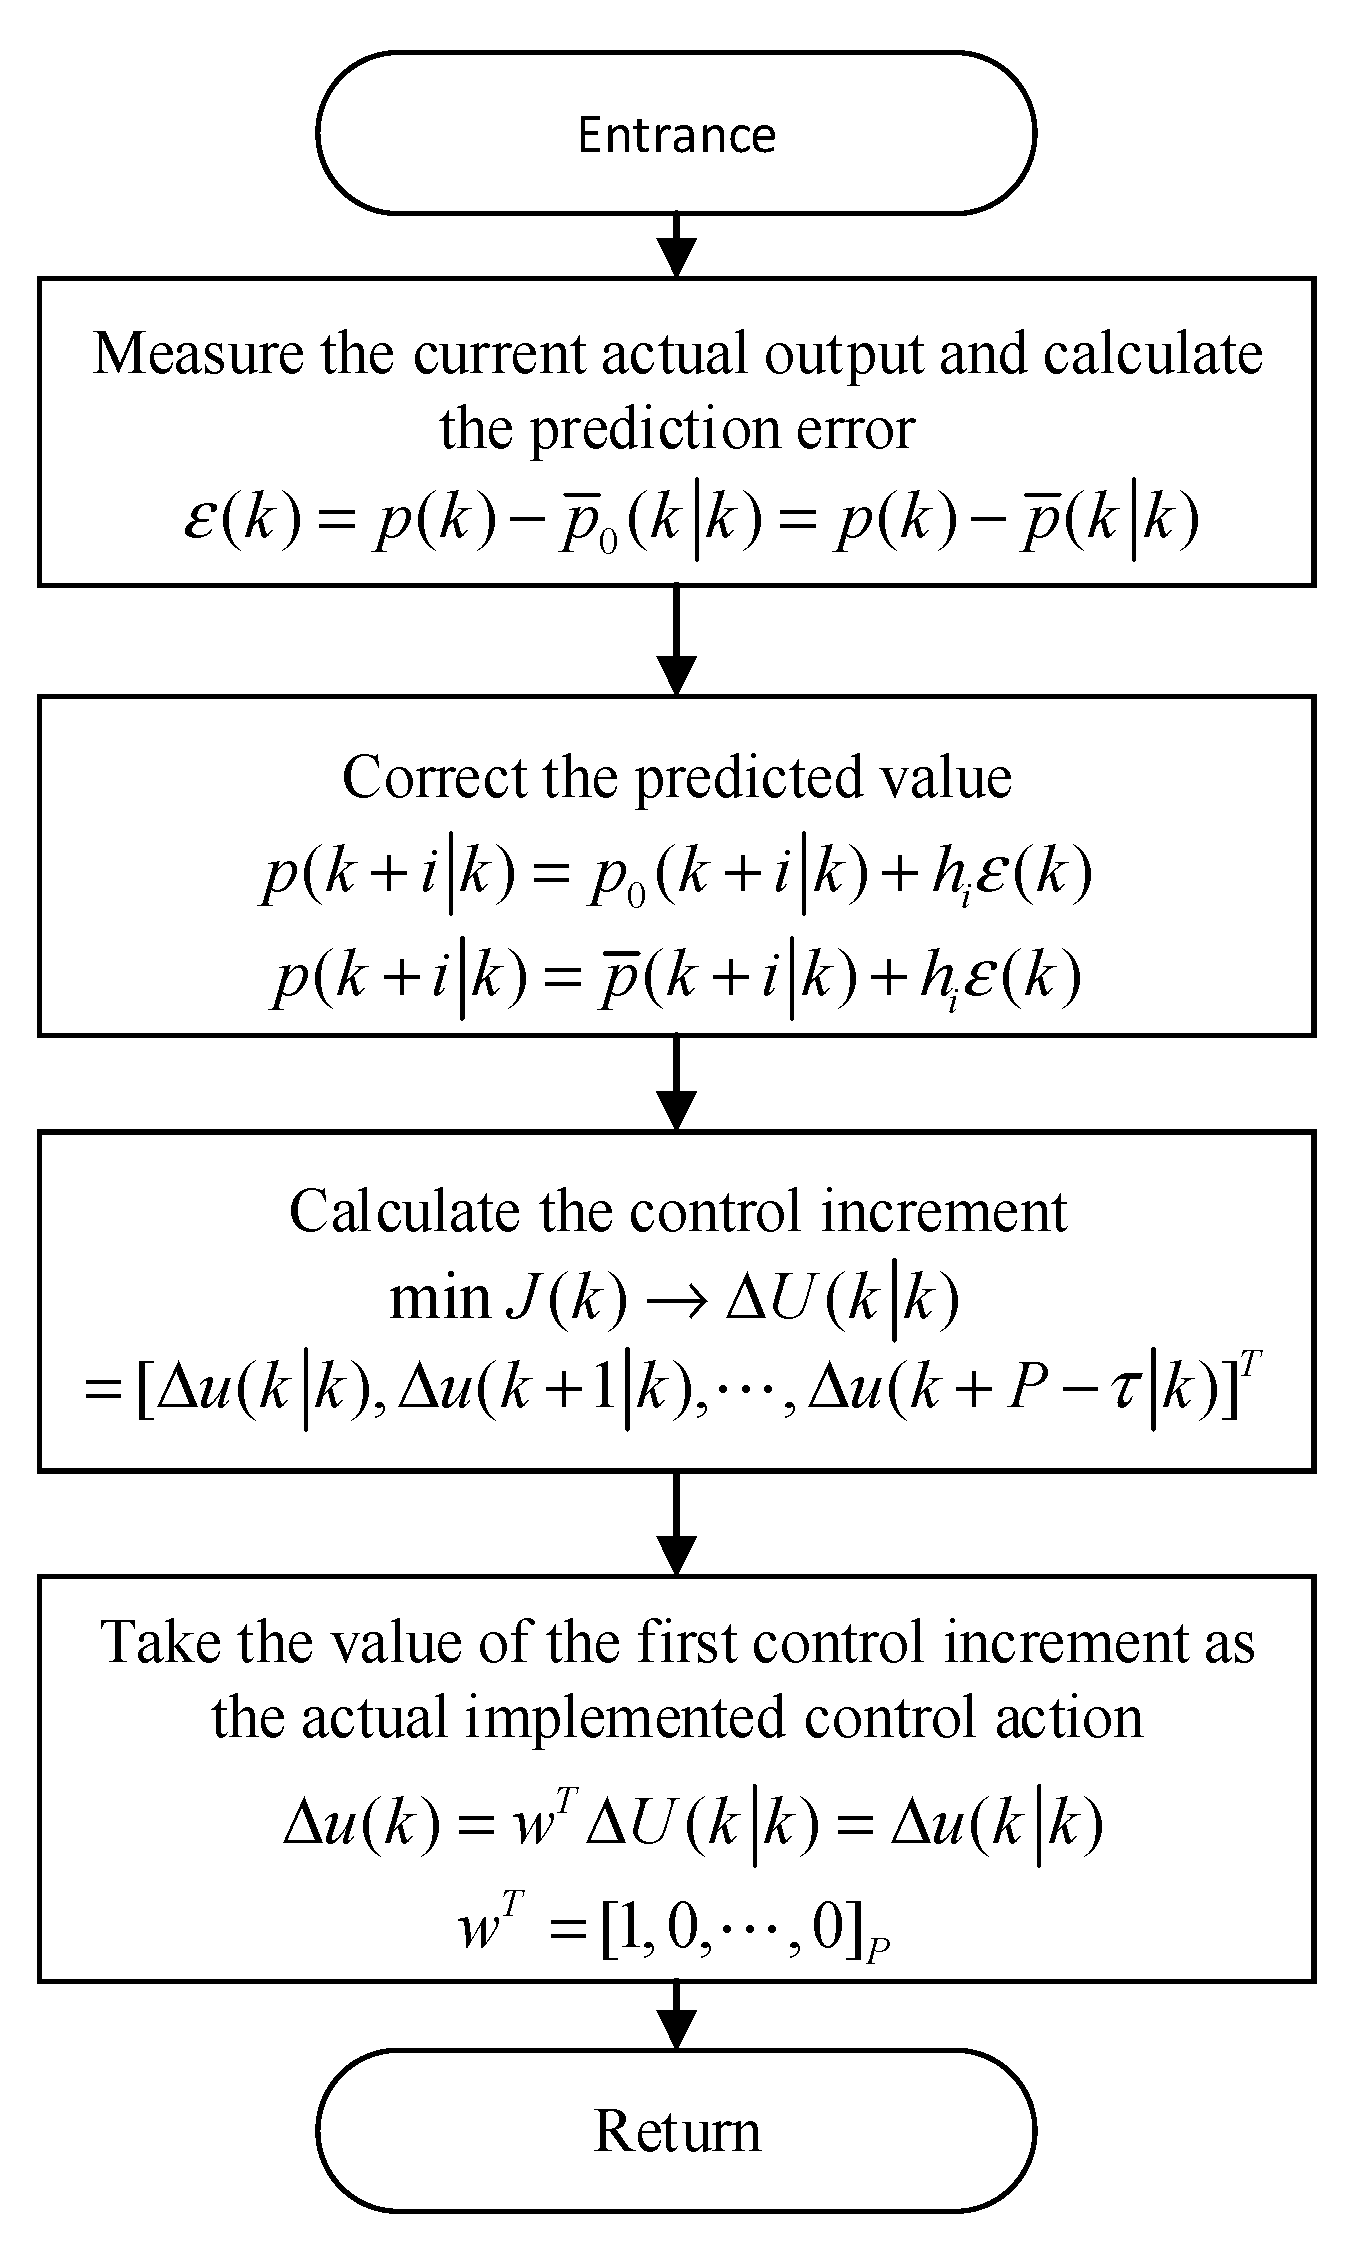
ε k = p k p 0 ¯ k k = p k p ¯ k k
p 0 k + i k = p 0 ¯ k + i k + h i ε k
p k + i k = p ¯ k + i k + h i ε k
The corrected prediction model can be written in matrix form:
P k k = P 0 k k + A Δ U k k
in the equation:
P k k = p k + 1 k , p k + 2 k , , p k + P k T
P 0 k k = p 0 k + 1 k , p 0 k + 2 k , , p 0 k + P k T
Δ U k k = Δ u k k , Δ u k + 1 k , , Δ u k + P τ k T
A = b 1 b 2 b P 0 b 1 b P 1 0 0 b P τ

3.3.2. Real-Time Predictive Control Strategy

Based on the daily rolling optimization dispatch strategy of the industrial park, ideal reference values for various controllable loads during the operating stage are provided. The optimization control objective of controllable loads can be set as the output of controllable loads in the prediction horizon tracking the reference value with the minimum error, and the control variable increment is hoped to be within an acceptable range without being too drastic. Considering both tracking error and the robustness of the control process, the optimization control objective of the load can be set as:
m i n J k = P k k R k k Λ 2 + Δ U k k Γ 2
In the equation: R k k = [ r k , r k + 1 , r k + P ] T , presume:
Λ = d i a g α 1 , α 2 , , α P
Γ = d i a g β 1 , β 2 , , β P
Substituting P k k = P 0 ¯ k k + A Δ U k k into the objective function, we get:
m i n J k = P 0 ¯ k k + A Δ U k k R k k Λ 2 + Δ U k k Γ 2
In the equation, P 0 ¯ k k and R ( k | k ) are both known, and the necessary condition to obtain the extremum J ( k ) by making d J ( k ) / d Δ U ( k / k ) = 0 is:
Δ U k k = ( A T Λ A + Γ ) 1 A T Λ ( R k k P 0 ¯ k k )
where, A T Λ A + Γ is a reversible matrix.
Taking the first value of Δ U ( k / k ) as the actual control amount applied to the controllable load at time k:
Δ u k = w T ( A T Λ A + Γ ) 1 A T Λ ( R k k P 0 ¯ k k )
In the equation, w T = [ 1,0 , 0 ] P .
The control block diagram of the real-time predictive control is shown in Figure 3.
The operation of controllable loads in industrial parks are influenced by various uncertain factors, including external uncertainty and internal uncertainty. External uncertainty includes random disturbances, while internal uncertainty includes model mismatch, parameter estimation errors, measurement errors, etc. These uncertainties result in errors between the predicted trajectory and the actual operating trajectory of controllable loads. When there are dynamic conditions such as fault conditions or sudden changes in load, the errors will be greater. Implementing the following measures can improve the stability and robustness of predictive control models:
  • Most controllable loads are first-order inertial objects with response-delay characteristics. The stability and robustness of these objects are influenced by the predicted time domain. It can be demonstrated that the stability and robustness of predictive control can be improved with a larger prediction time horizon. However, selecting a large prediction time horizon will lead to loss in control speed. In practical applications, it is advisable to select several hours as the appropriate prediction time horizon.
  • Add a feedback correction process, utilizes real-time measured information to estimate and correct the effects of uncertainty. This approach can effectively overcome the impact of external uncertainty and internal uncertainty and improve the robustness of the proposed control model. Meanwhile, the robustness of the control model is influenced by the feedback correction coefficient. It can be demonstrated that the robustness of the control model can be improved with a smaller feedback correction coefficient.

3.3.3. Model Parameter Tuning

In predictive control algorithm, the parameters that need to be tuned include the sampling period, optimization horizon, control horizon, error weighting matrix, and control weighting matrix, as well as correction parameters. Below are the tuning methods for each parameter:
  • Optimization horizon P : Needs to match with the intra-day rolling optimization horizon, and covers the delayed response time and dynamic response time of the controllable load. Due to the intra-day rolling optimization horizon being 4 h, and the sum of delayed response time and dynamic response time of the controllable load not exceeding 4 h, the optimization horizon is selected as 4 h.
  • Control horizon M : Needs to satisfy M P . With a smaller M , the computational workload for model solving decreases, but the tracking performance worsens. To achieve precise control of controllable loads, the control horizon is selected as 3 h.
  • Sampling time T : With a comprehensive consideration of hardware conditions, response dynamic characteristics, optimization horizon, control horizon, model dimensions, and control scale, the sampling time is selected as 15 min.
  • Error weight matrix Λ and control weight matrix Γ : As the deviation assessment coefficient is consistent across all control time intervals, the error weight coefficient can be selected as α 1 = α 2 = = α P = 1 . The control weight coefficient can be initially set to 0, and if there is excessive variation in control action, adjust the control weight coefficient to a higher value step by step.
  • Feedback correction parameters h i : The selection of feedback correction parameters will affect the anti-interference capability and robustness of the control model. To improve the anti-interference capability, select h i = 1 .

4. Case Study

To verify the three-layer control architecture and control strategy of multiple types of load aggregation in the industrial park, a simulation verification is carried out using a certain industrial park in Guangdong Province as a simulation example.

4.1. Scenario Description for the Case Study

The peak–valley–flat electricity price of a certain industrial park in Guangdong Province is shown in Table 1.
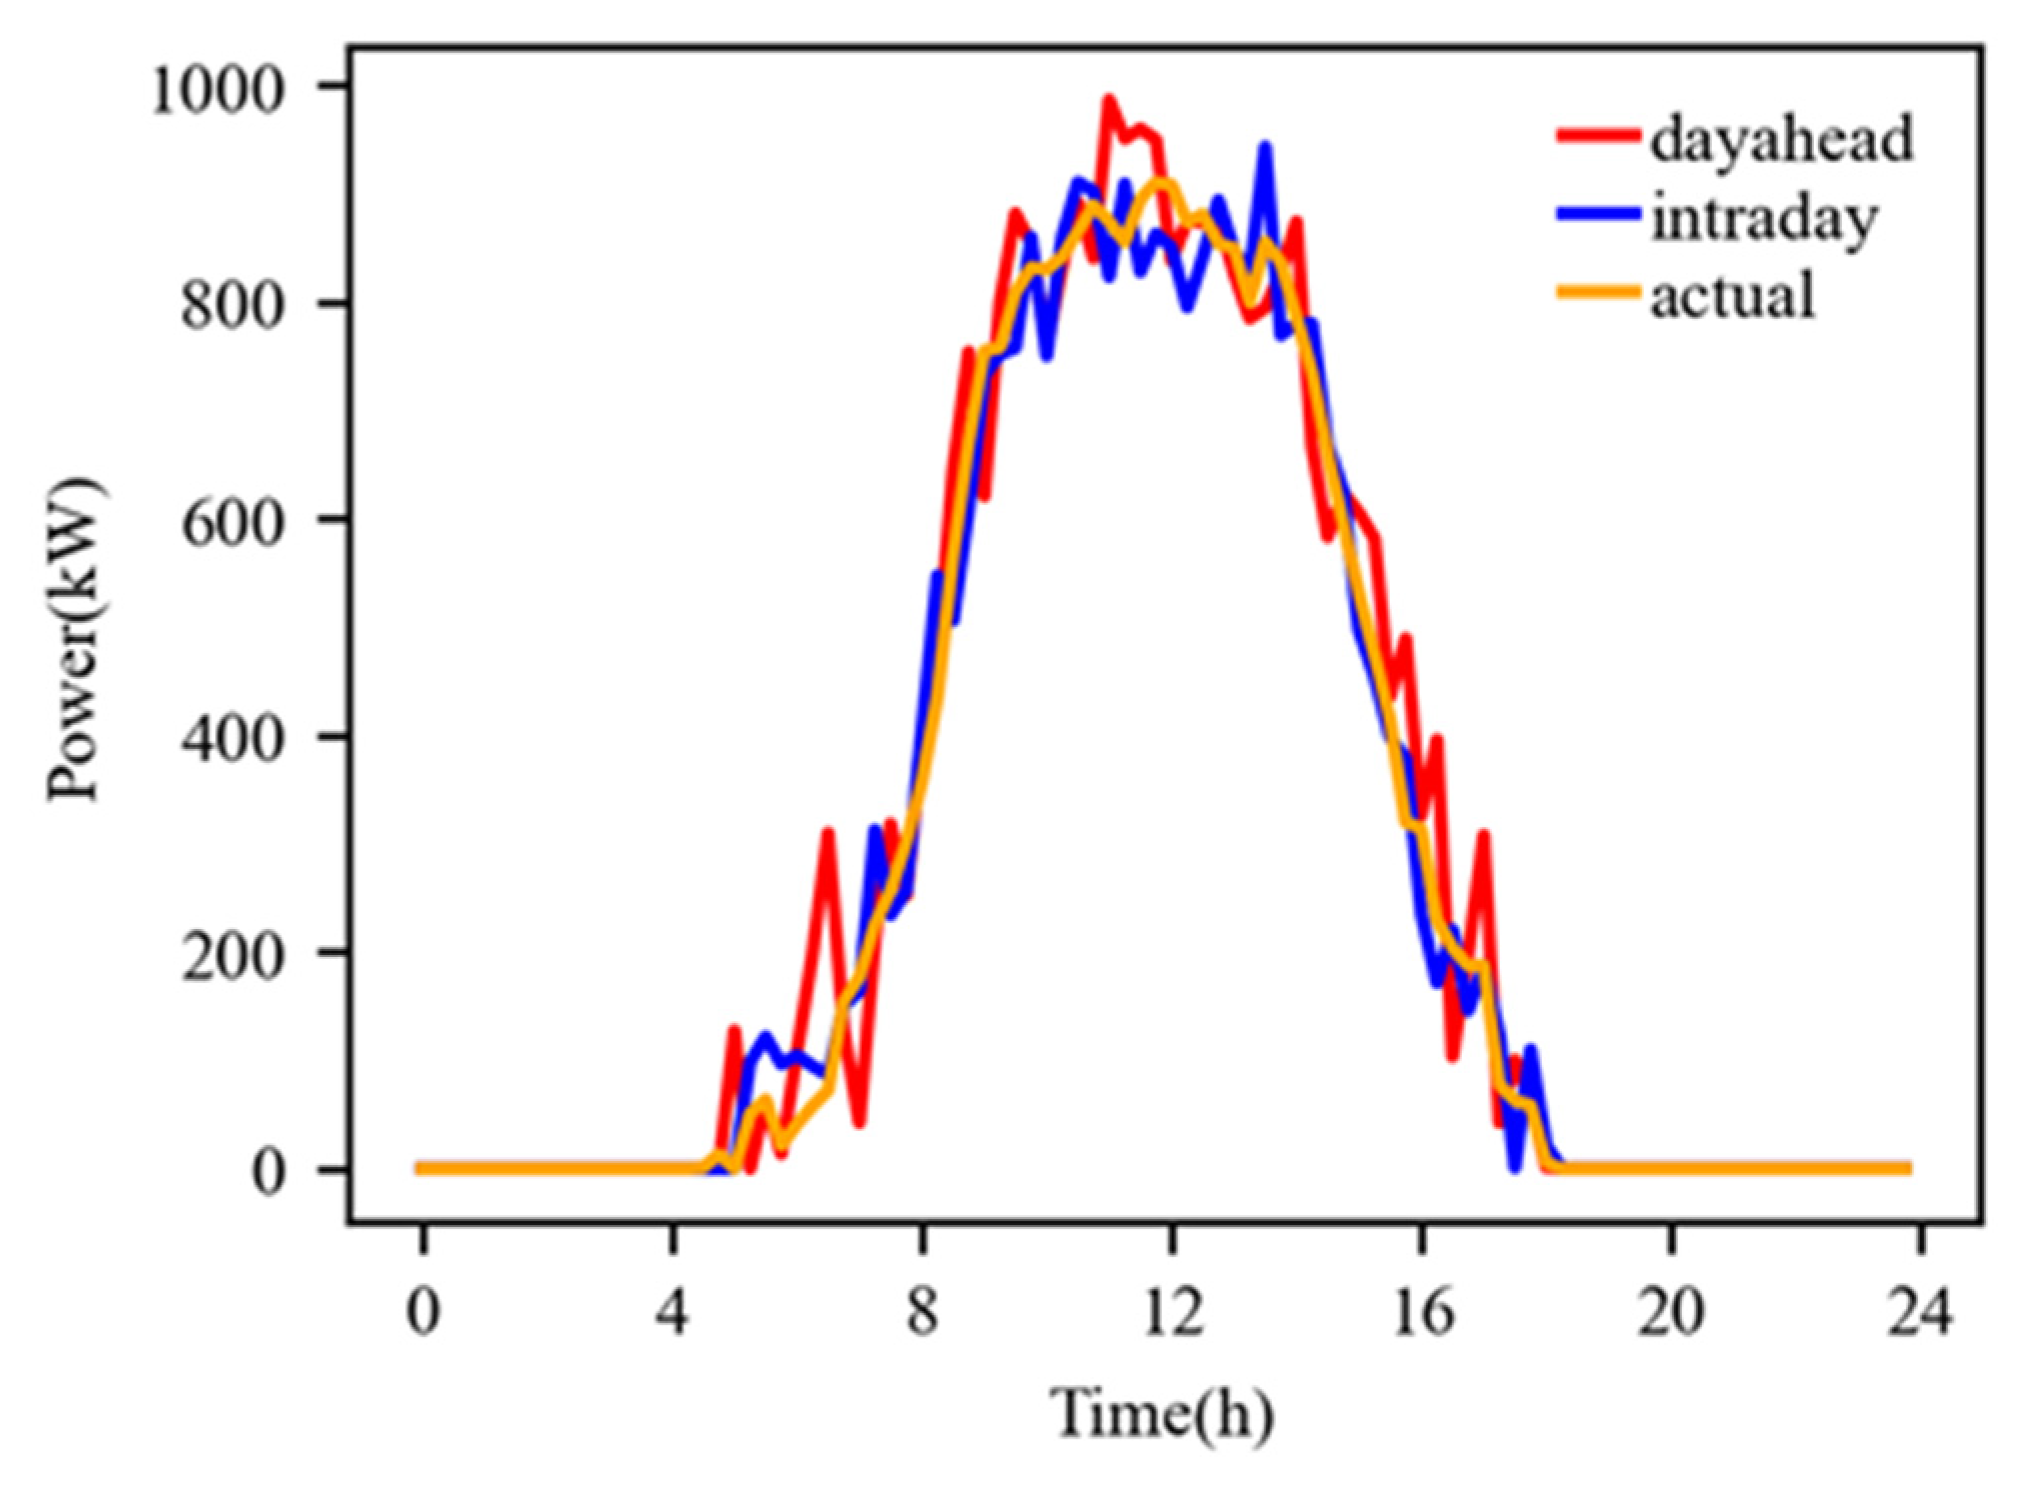
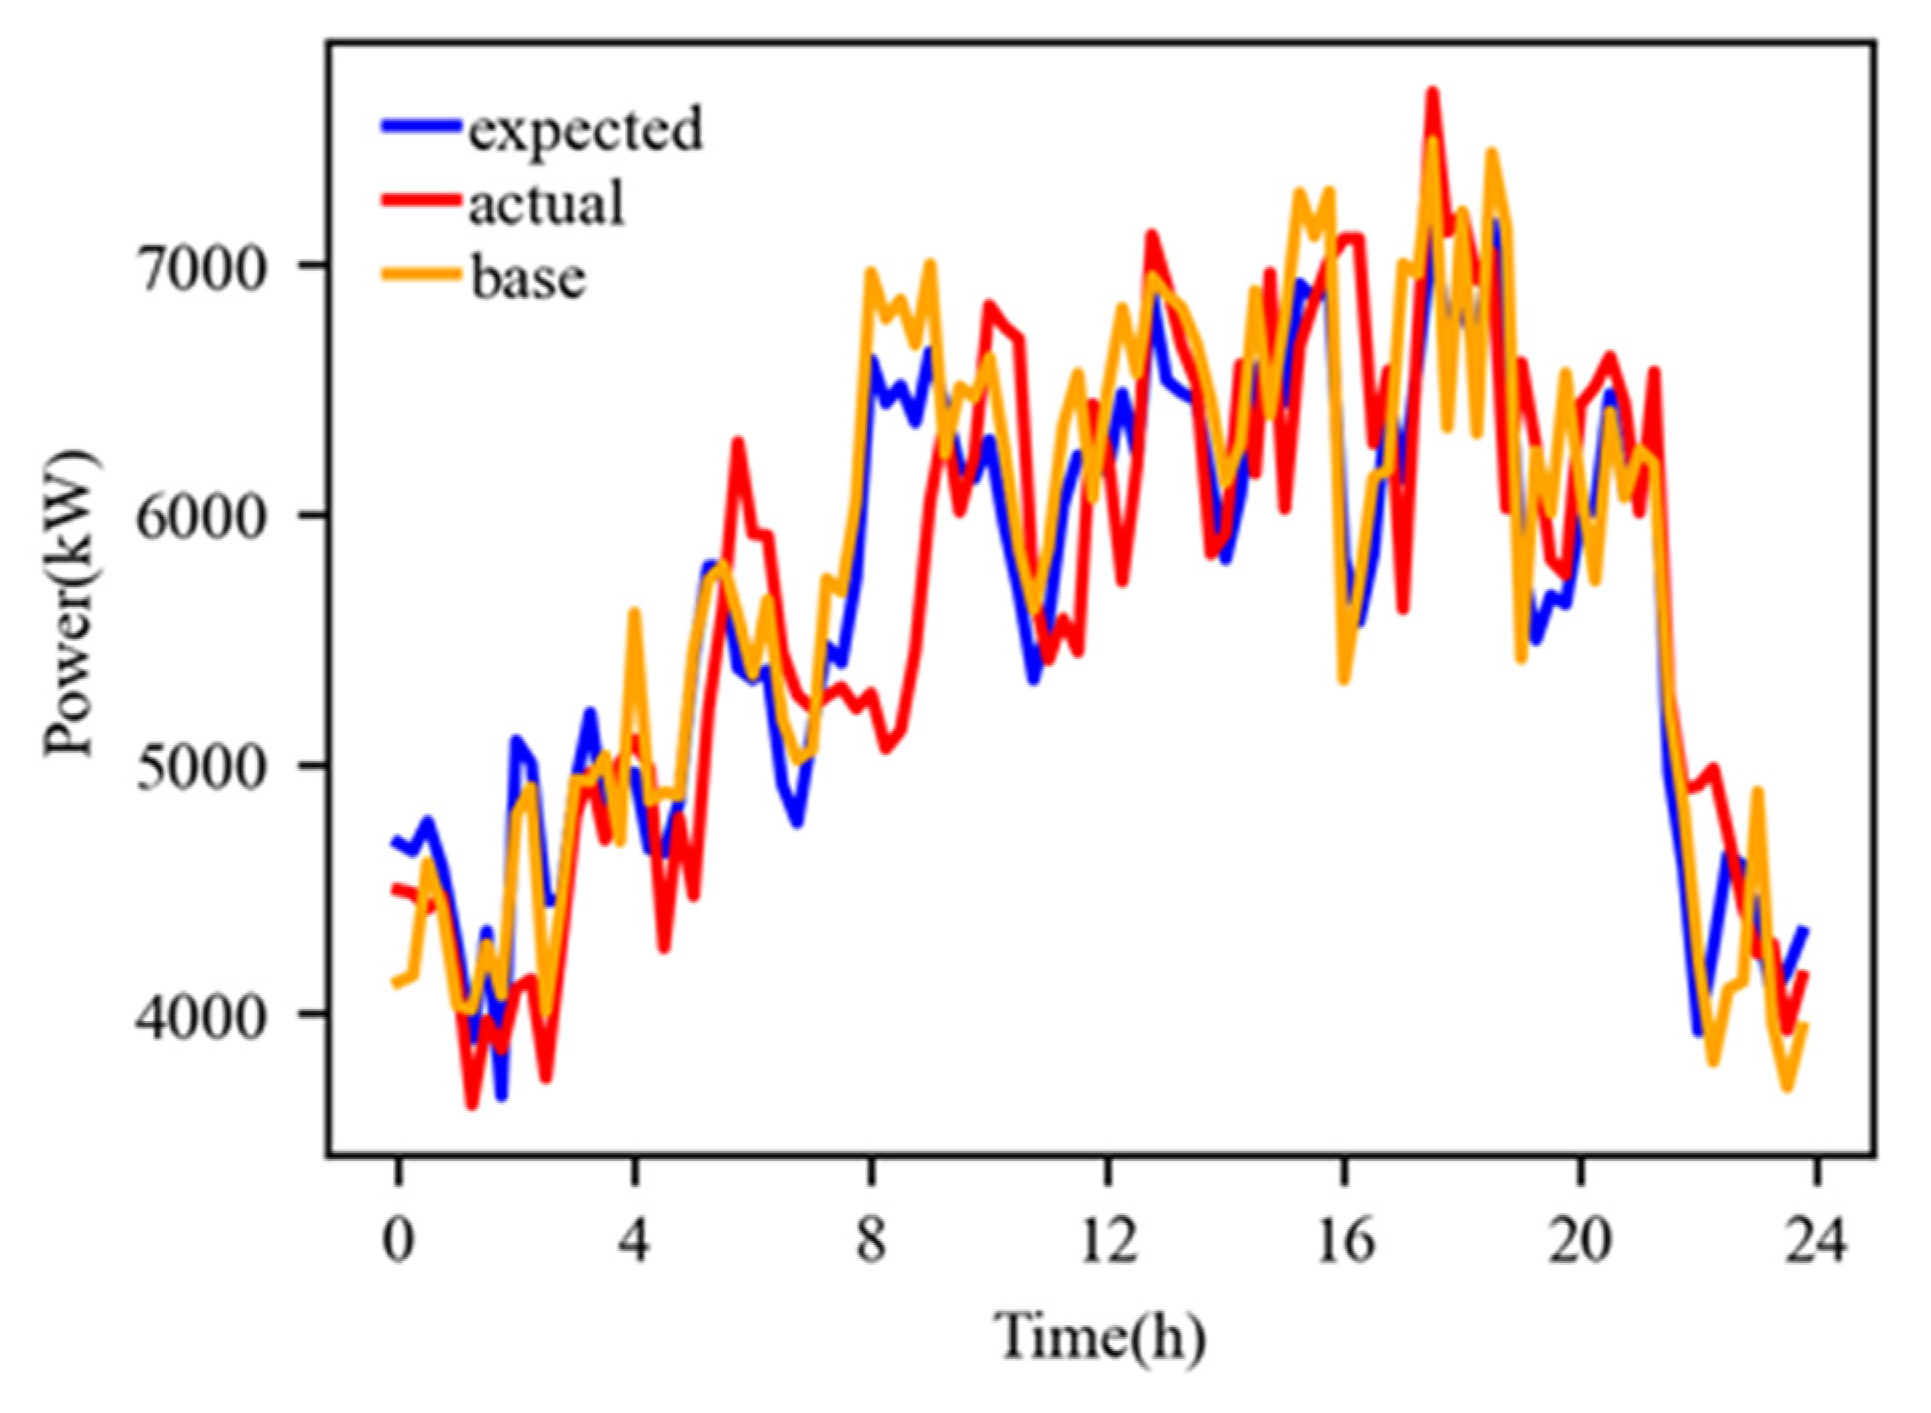
The photovoltaic pre-forecast power curve, intra-day ultra-short-term power forecast curve, and actual power generation curve of a certain operation day in the park are shown in Figure 4, and the pre-forecast power curve and actual rigid load power curve are shown in Figure 5.
The industrial park includes various types of controllable load resources with different characteristic parameters, which are shown in Table 2.
To analyze the impact of different control strategies on the operating cost of the industrial park, the following four scenarios are set:
  • Scenario 1: The day-ahead optimal dispatch strategy of the industrial park is used as the execution strategy, and no further optimization control is performed on the controllable loads within the day, ignoring the response characteristics of the controllable loads.
  • Scenario 2: Based on the day-ahead optimal dispatch plan of the industrial park, considering the forecast errors of photovoltaic power generation and rigid loads, the controllable loads are continuously rolling optimized and scheduled within the day, ignoring the response characteristics of the controllable loads.
  • Scenario 3: Based on the intra-day rolling optimization dispatch plan in an industrial park, using a neural network model [27] to perform real-time control of controllable loads, and the specific steps are as follows: Firstly, based on the control inputs and the actual power output of controllable loads, the sample data are constructed to train the neural network model in order to describe the control-response characteristics of controllable loads. Secondly, based on the sample data of planned output power, a neural network model is trained to obtain a control input model, which allows controllable loads to follow the intra-day rolling optimization dispatch plan after receiving real-time control instructions.
  • Scenario 4: Based on the rolling optimization and dispatch plan within the day of the industrial park and considering the response characteristics of the controllable loads, real-time predictive control is performed on the controllable loads.

4.2. Simulation Analysis

4.2.1. Analysis of Scenario One

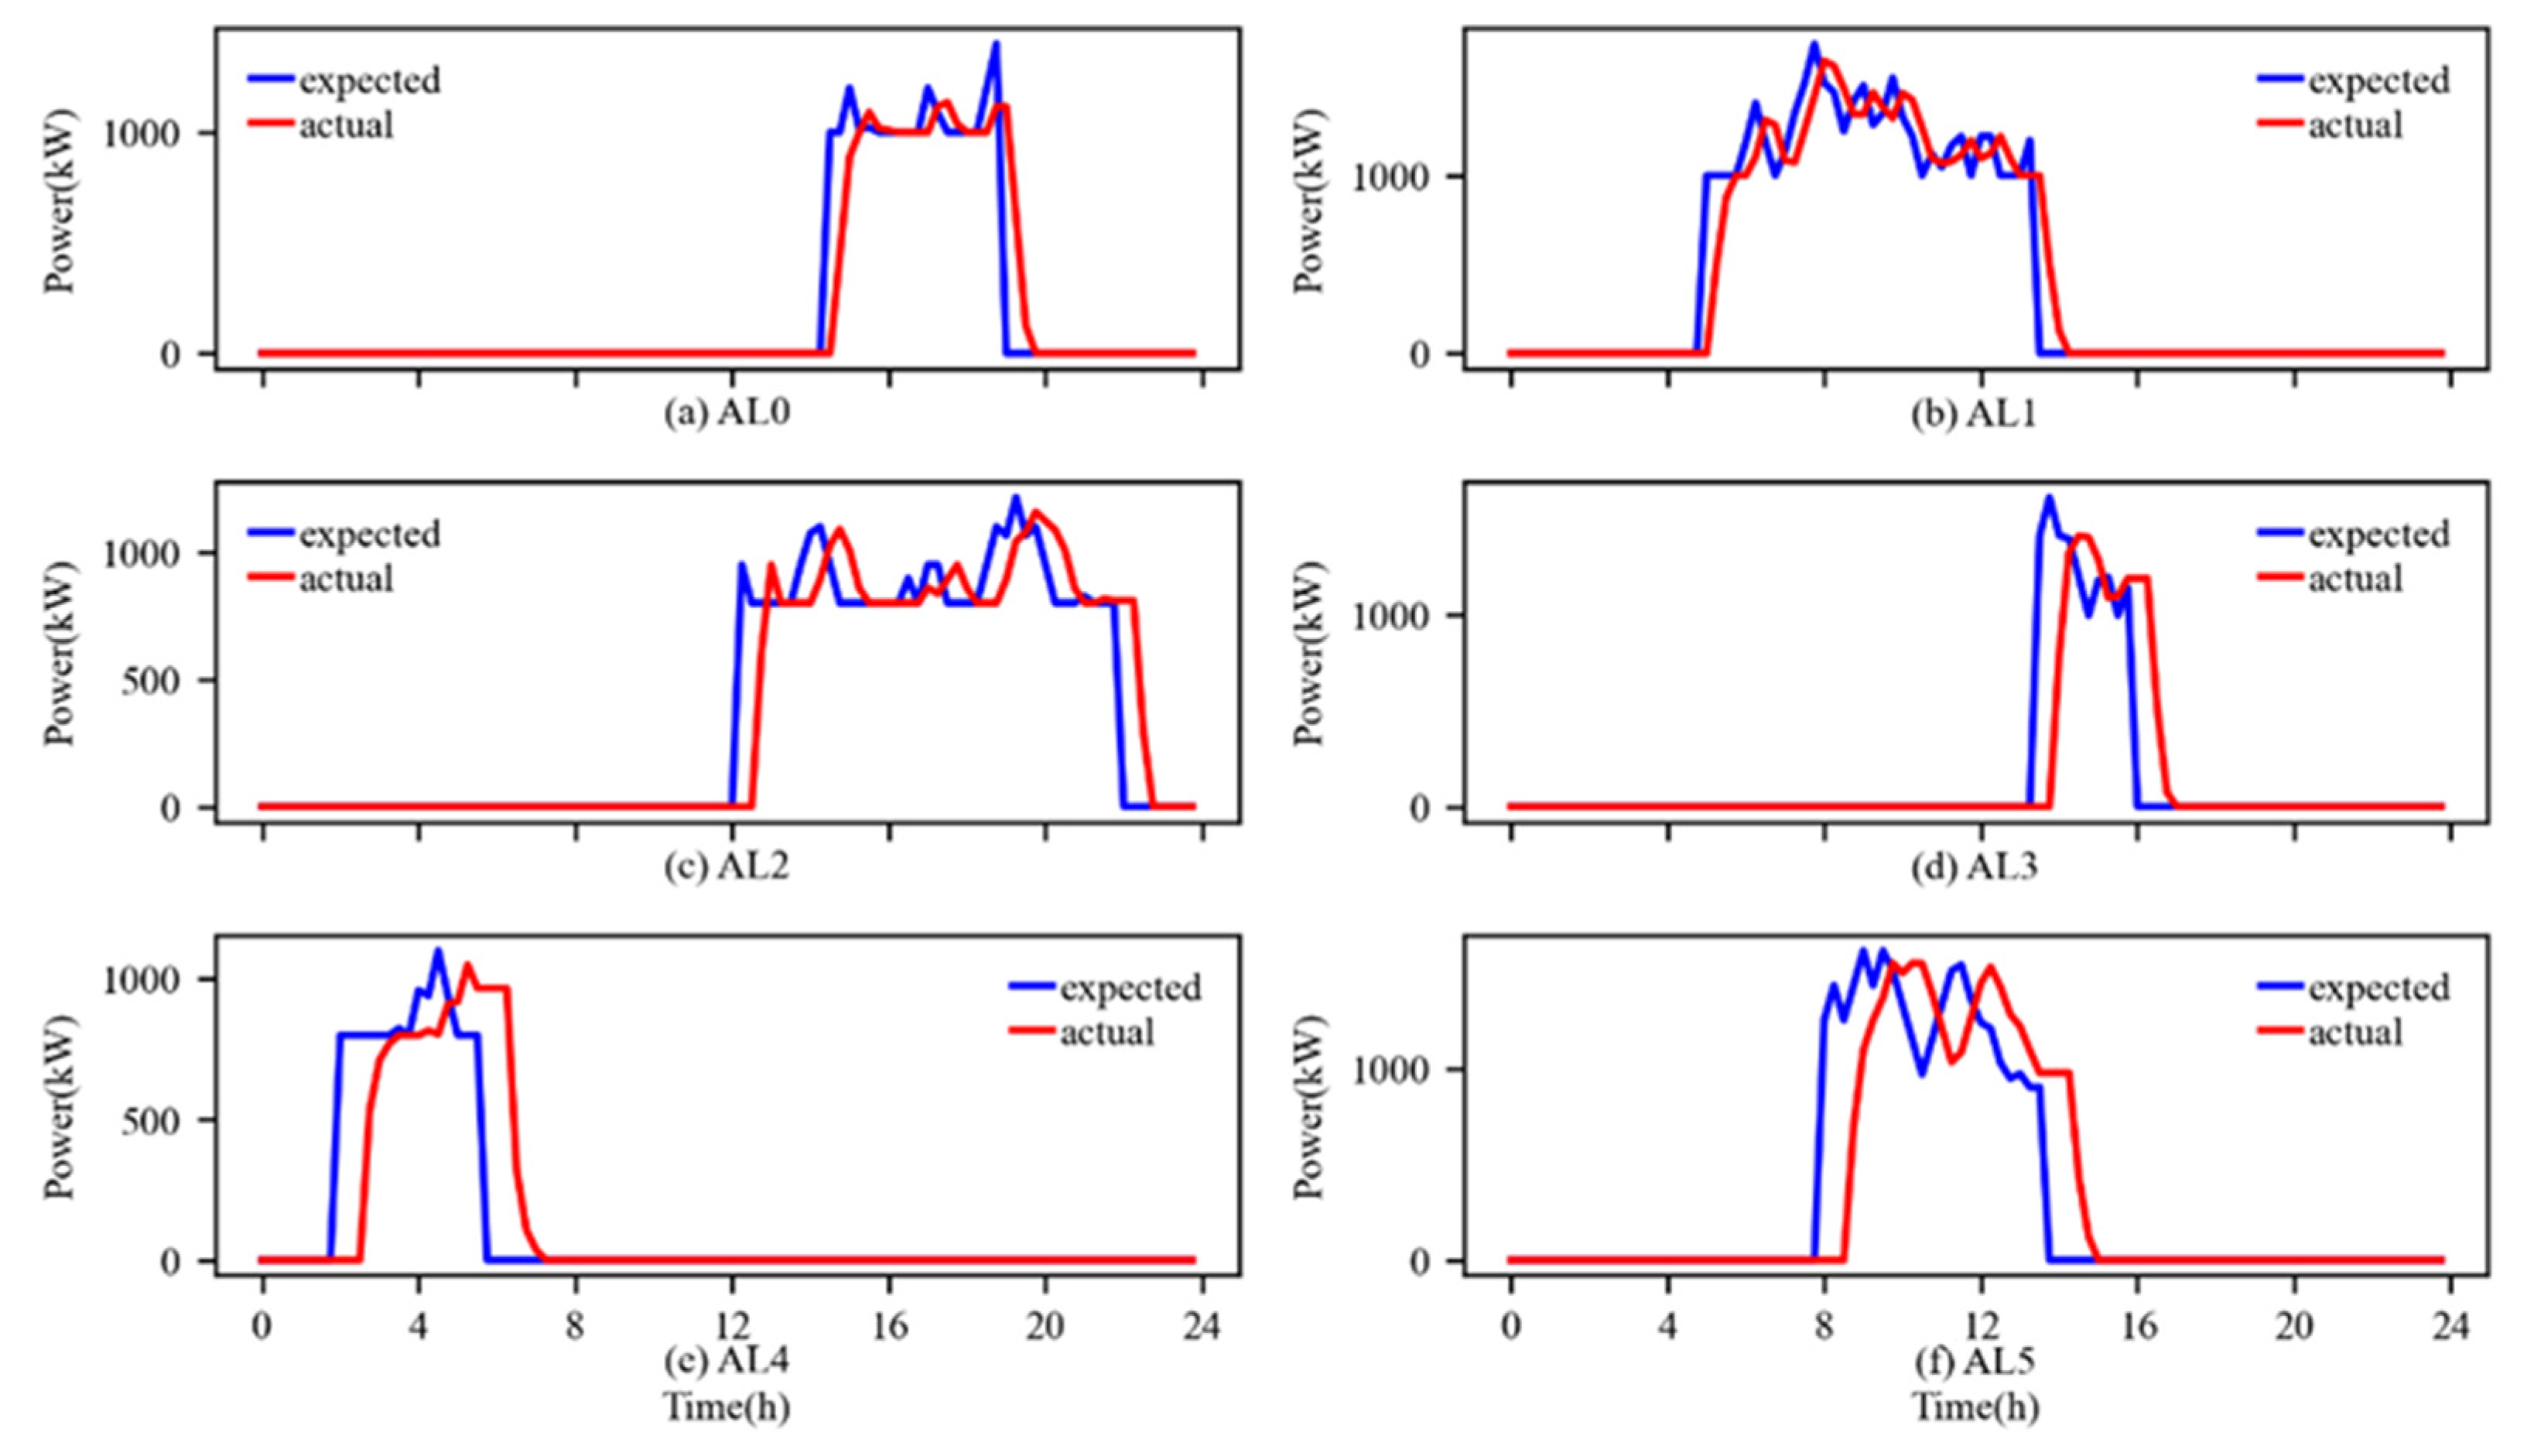
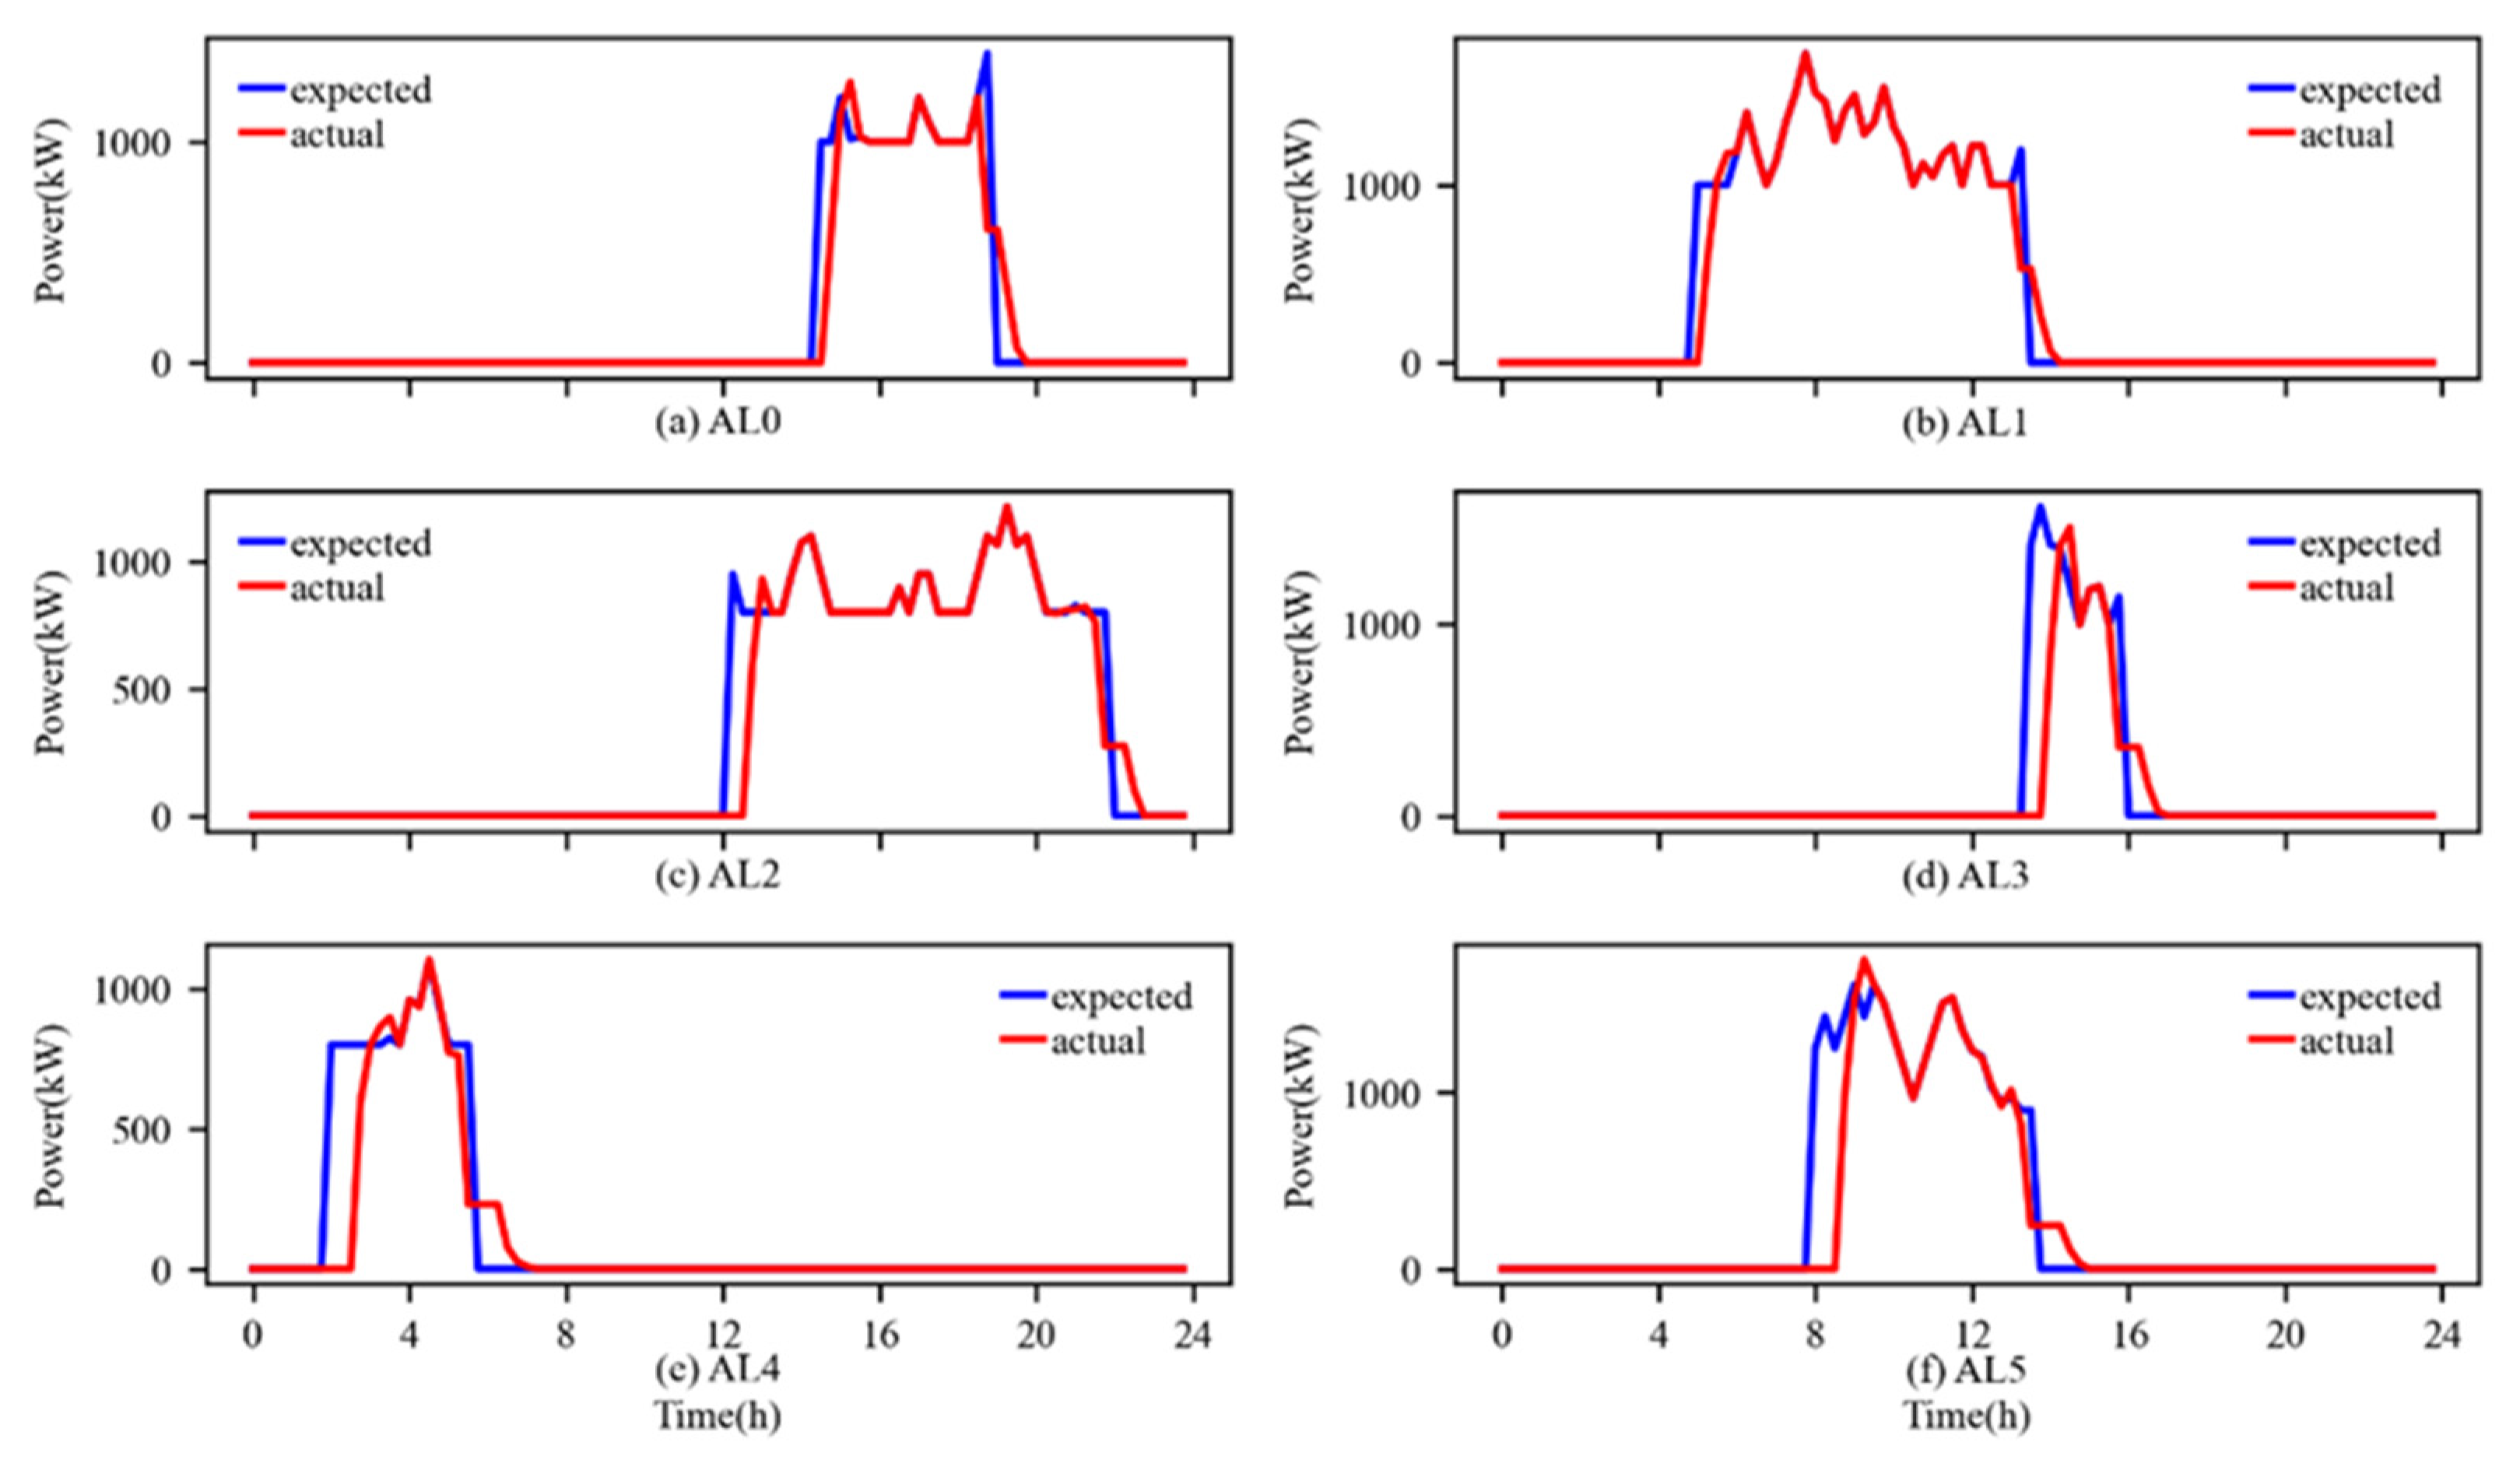
In order to minimize the overall operating cost of the industrial park, the optimized dispatch provides the start–stop and output plans for each controllable load unit in the industrial park. However, most existing research ignores the response characteristics of controllable loads and assumes that they can respond accurately to power control plan instructions. However, in the actual execution process, due to the control delay and response characteristics of controllable loads, only issuing control instructions to controllable loads without considering their closed-loop predictive control will cause significant control execution deviation. The dispatch instructions for controllable loads and the actual power curve are shown in Figure 6 for this industrial park.
Due to the neglect of the control response characteristics of controllable loads, there is a significant response delay in the actual power curve compared to the day-ahead dispatch plan. Different controllable loads have different control response characteristics, such as their response delays. When the control response delay of controllable load is ignored, there is a certain difference in the amplitude of the actual power curve compared to the day-ahead dispatch plan, the actual power curve cannot follow the day-ahead dispatch plan well.
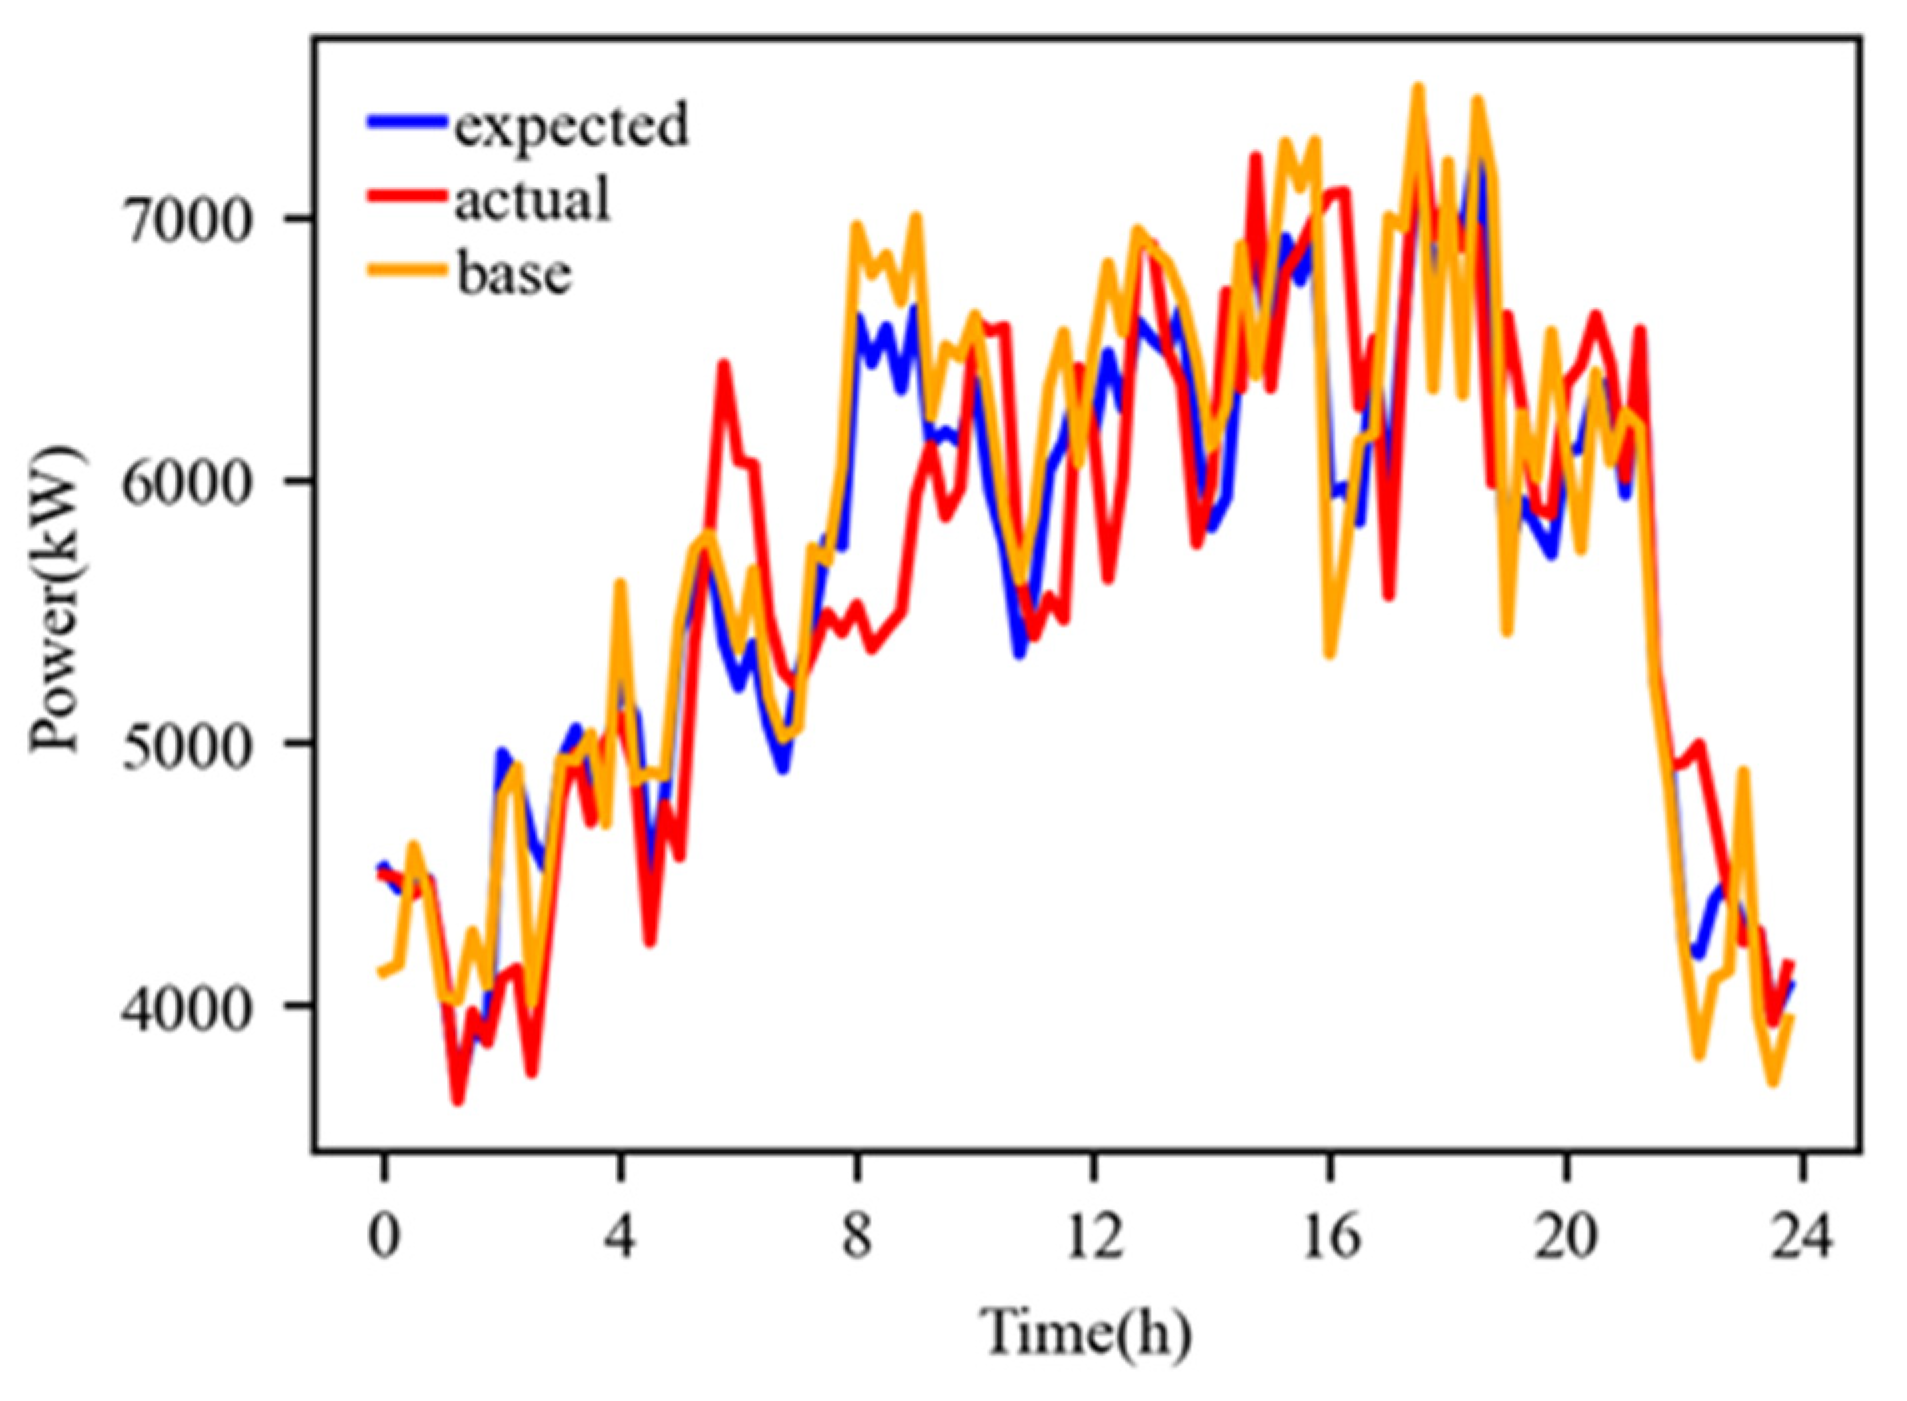
The day-ahead pre-dispatch plan curve, the optimized dispatch curve, and the actual operating curve for the interconnection line in the industrial park are shown in Figure 7.
There is a significant deviation between the expected and actual power of the interconnection line in the industrial park, which is due to errors in the day-ahead prediction of solar and rigid loads, as well as the fact that controllable loads cannot follow the day-ahead dispatch plan well. The error between the expected and actual power on the interconnection line will increase the assessment costs.
The expected cost of purchasing electricity based on the pre-optimized strategy for the industrial park is Y11 = CYN 398,618.06, and the assessment cost is Y12 = CYN 15,628.36, with a total cost of Y1 = CYN 414,246.42; the actual cost of purchasing electricity is S11 = CYN 403,184.11, the assessment cost is S12 = CYN 75,260.48, and the total cost is S1 = CYN 478,444.60.

4.2.2. Analysis of Scenario Two

In order to minimize the overall operating cost of the industrial park, based on the ultra-short-term power forecasting results of photovoltaics and rigid loads, the controllable load’s start–stop and output modification plans during the day are provided, optimized every 15 min, and the rolling optimization time domain is 4 h. Similarly, ignoring the response characteristics of controllable loads will also cause significant control execution deviation. The scheduled instructions for controllable loads and the actual power curve for the industrial park during the day are shown in Figure 8.
Similar to the day-ahead dispatch, due to ignoring the response characteristics of controllable loads, there is a significant response delay and amplitude difference in the actual power curve compared to the intra-day dispatch plan. When ignoring the response characteristics of controllable loads, the actual power curve cannot follow the intra-day dispatch command well.
The rolling optimization curve for the power of the interconnection line in the industrial park during the day and the actual operating curve are shown in Figure 9.
Due to the inability of the actual power curve of controllable loads to follow the intra-day dispatch plan well, there is also a significant deviation between the expected and actual power of the interconnection line in the industrial park for the intra-day period. However, due to more accurate prediction of solar and rigid loads during the day, the deviation between the expected and actual power on the interconnection line is smaller than that of the day-ahead, resulting in lower assessment costs than the day-ahead.
The expected cost of purchasing electricity based on the rolling optimization strategy for the industrial park during the day is Y21 = CYN 399,991.38, and the assessment cost is Y22 = CYN 15,063.10, with a total cost of Y2 = CYN 415,054.48; the actual cost of purchasing electricity is S21 = CYN 402,262.37, the assessment cost is S22 = CYN 72,245.10, and the total cost is S2 = CYN 474,507.47.

4.2.3. Analysis of Scenario Three

Building on scenario 2, a neural network model was trained based on the intra-day dispatch plan of controllable load to obtain real-time control commands for controlling the controllable load in real-time. The dispatch plan and the actual power output curve of the controllable load in industrial park are shown in Figure 10.
It can be observed that there still exist significant deviations in the actual power output curve from the intra-day dispatch plan, and using a neural network model cannot make the actual power output curve follow the intra-day dispatch plan very well.
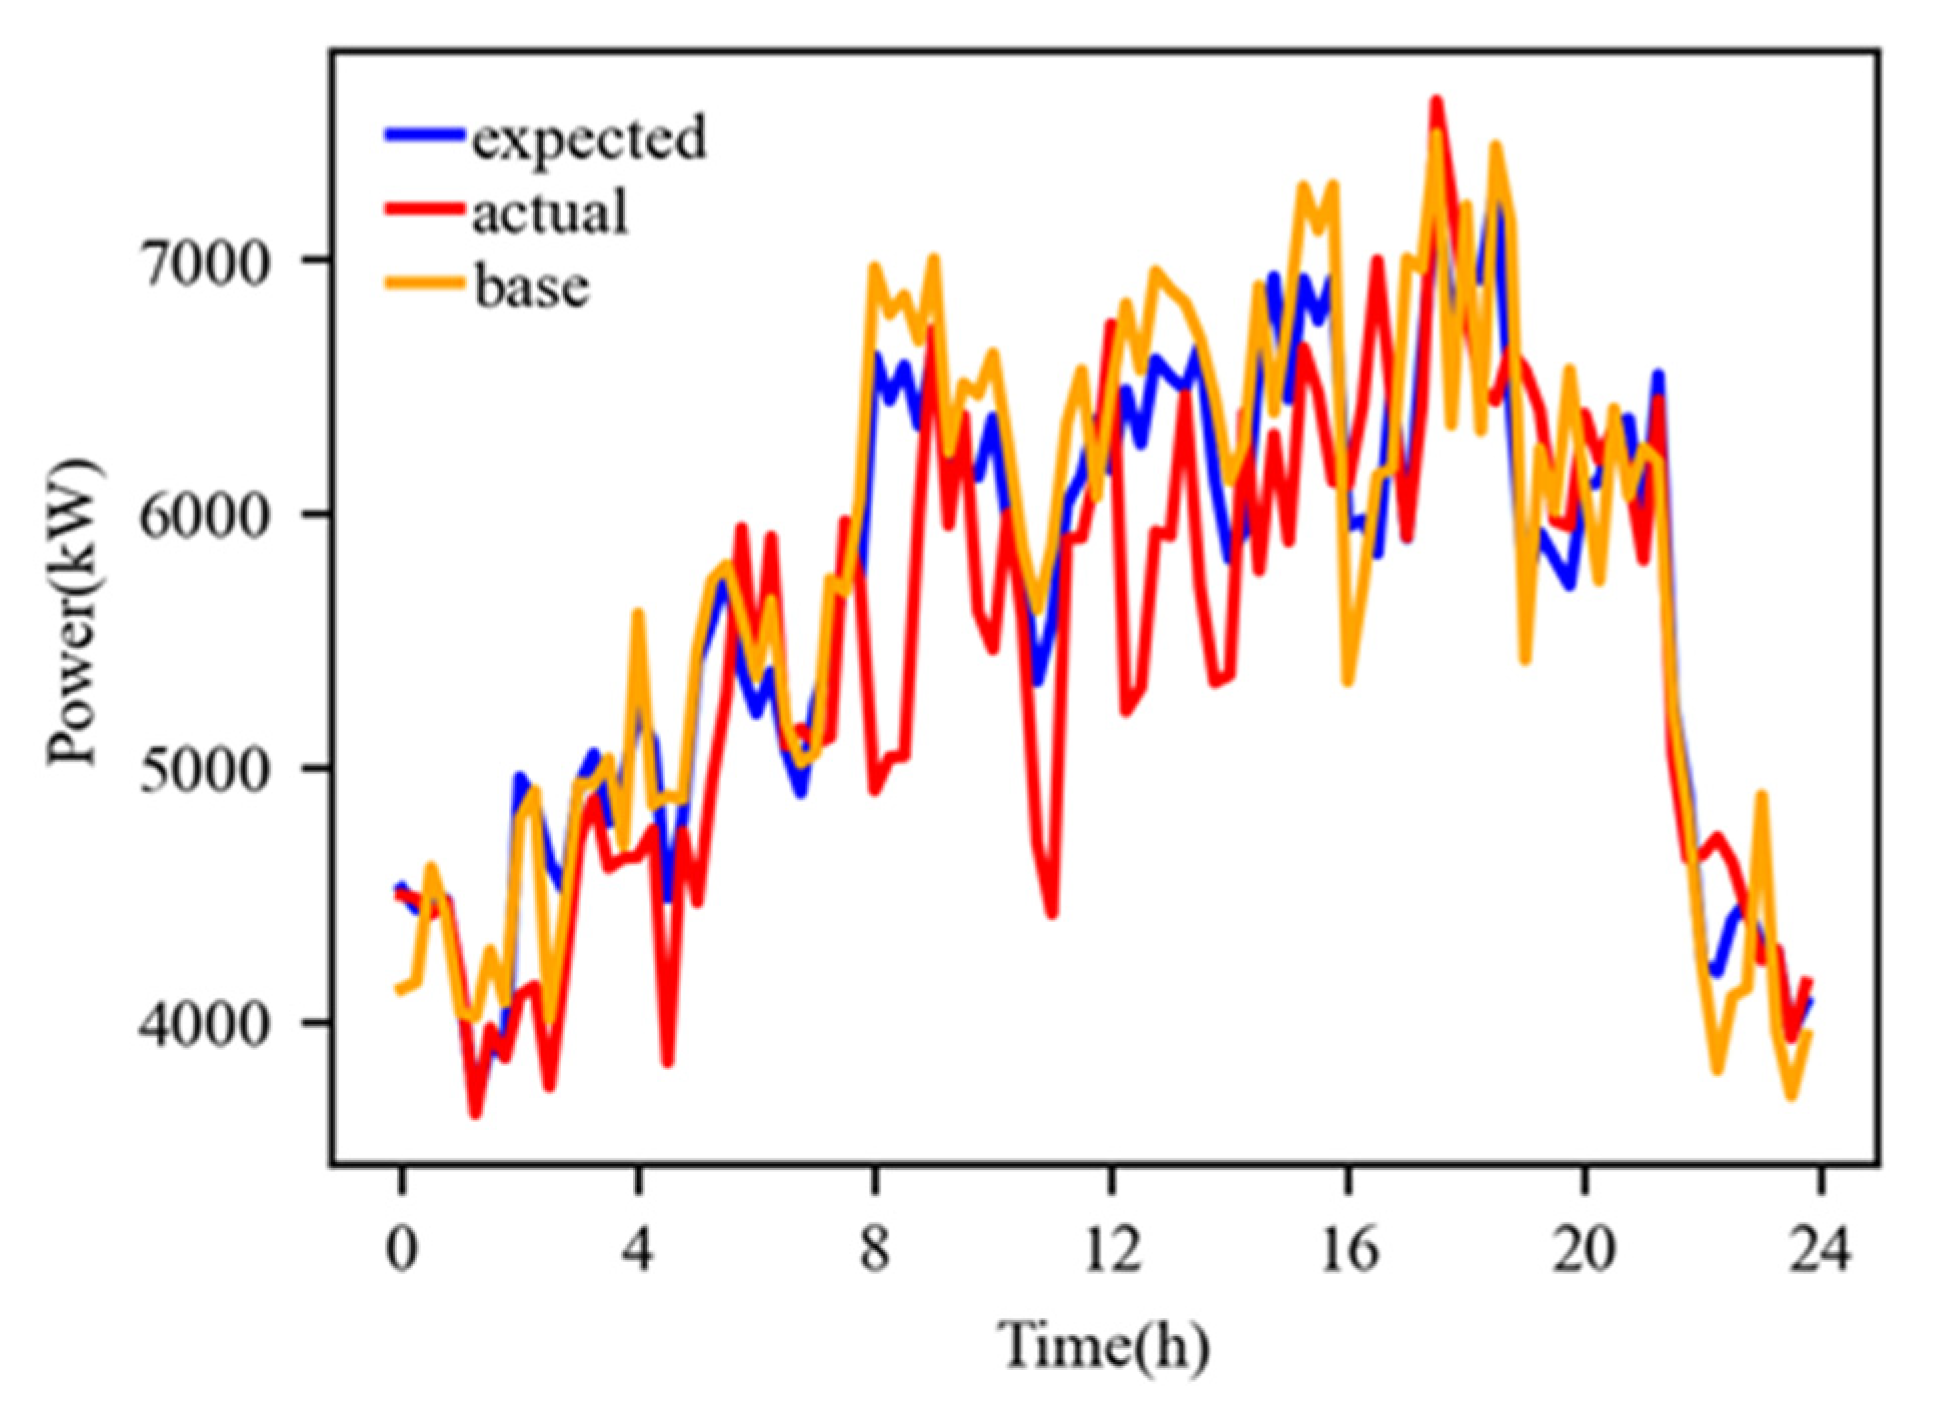
Taking into account the ultra-short-term prediction error of photovoltaic and rigid loads, as well as the response execution deviation of the controllable loads, the expected intra-day power curve and the actual power curve of the industrial park interconnecting line are shown in Figure 11.
Due to the actual power output curve of the controllable loads being unable to follow the intra-day dispatch plan very well, there exists a significant execution error between the expected power and actual power of the interconnecting line, leading to relatively high evaluation costs.
After using a neural network model for real-time control of the controllable loads, the expected intra-day cost for the industrial park remains consistent with Scenario 2. The actual intra-day cost is S31 = CYN 386,169.39, and the evaluation cost is S32 = CYN 87,097.48, resulting in a total cost of S3 = CYN 473,266.87.

4.2.4. Analysis of Scenario Four

Based on Scenario Two, real-time predictive control of controllable loads is performed considering their response characteristics in accordance with the intra-day adjustable load dispatch instructions. The adjustable load dispatch instructions and the actual executed power curve for the industrial park are shown in Figure 12.
By using a real-time predictive control model, the actual power curve of the controllable load can only deviate from the intra-day dispatch plan in a few time periods, while in most time periods, the actual power curve can accurately follow the intra-day dispatch plan.
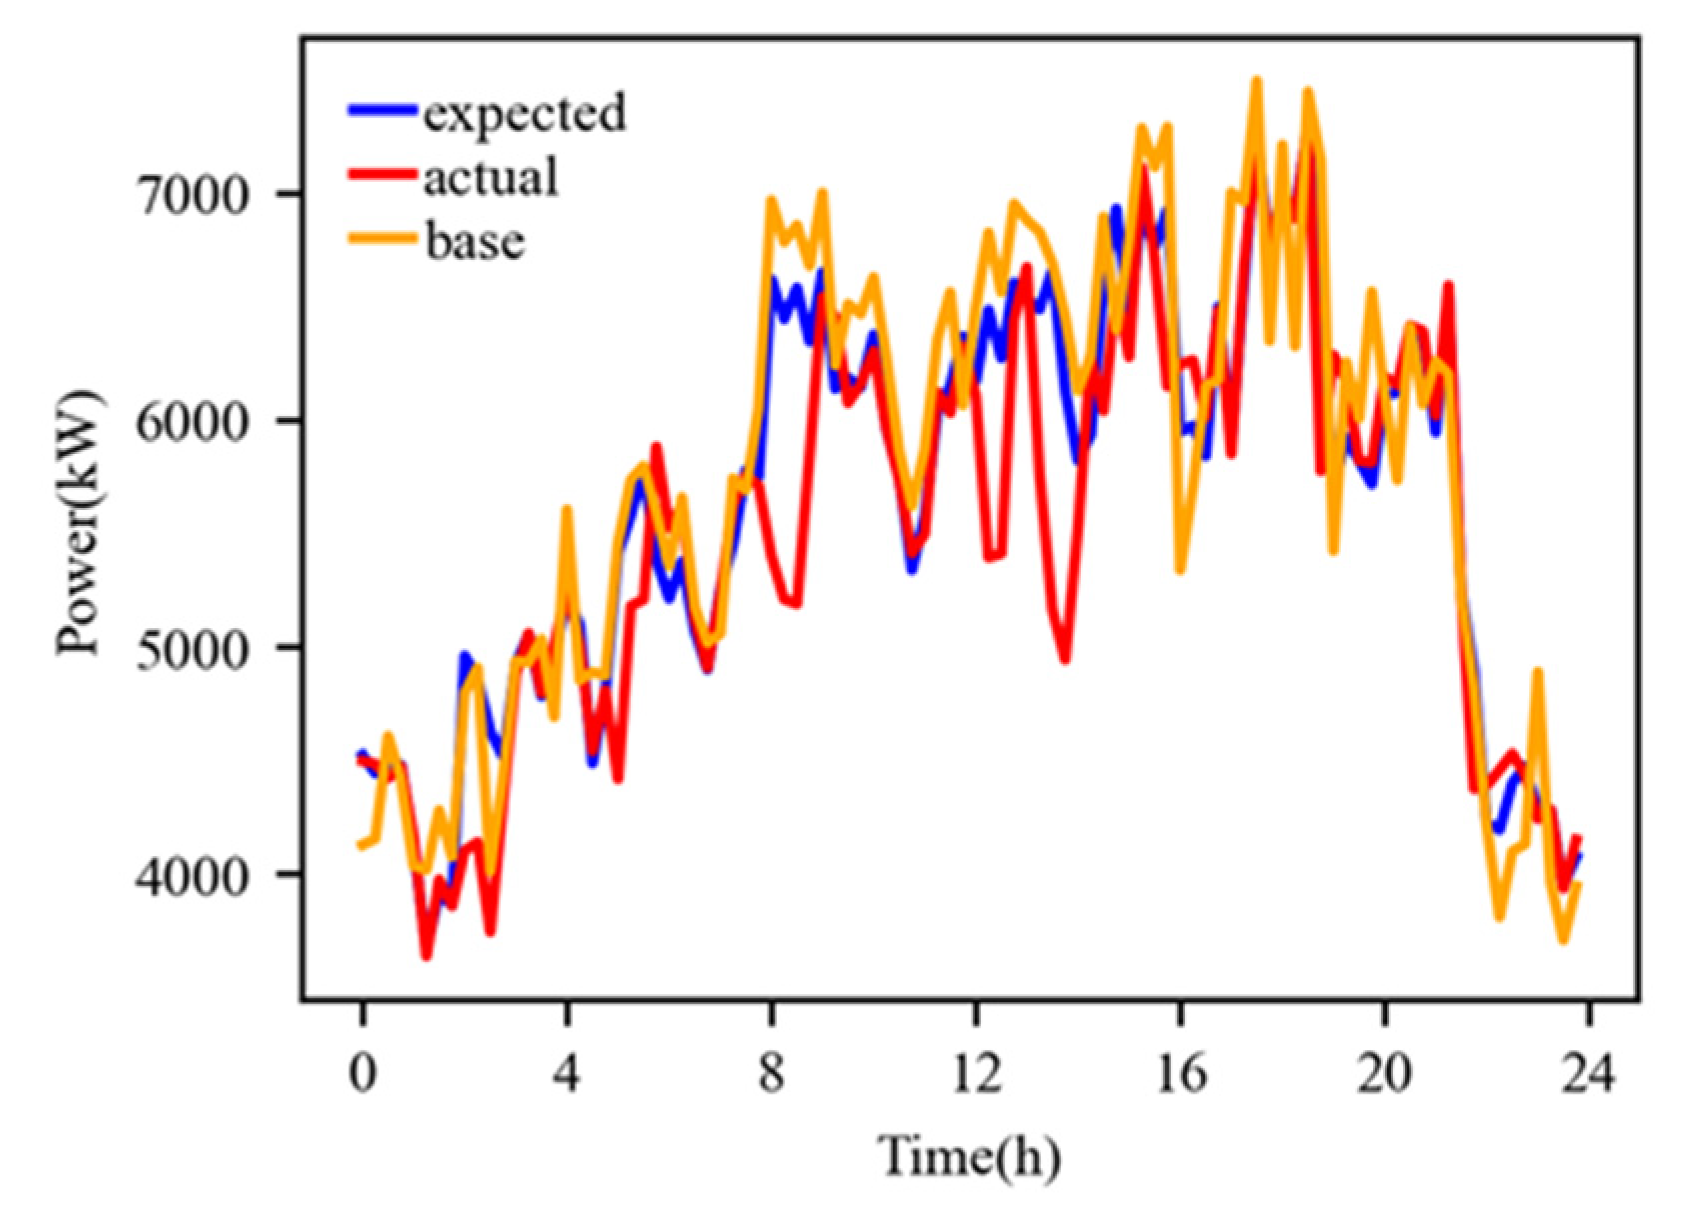
Taking into account the ultra-short-term forecast error of photovoltaics and rigid loads, as well as the response execution deviation of controllable loads, the expected operation curve and the actual curve of the industrial park’s interconnection line are shown in Figure 13.
By using a real-time predictive control model, the actual power curve of the controllable load can better follow the intra-day dispatch plan, which minimizes the error between the expected power and actual power of the interconnection line, and results in lower assessment costs.
After the real-time predictive control of controllable loads, the expected operating cost of the industrial park is consistent with Scenario Two. The actual cost of purchasing electricity during the day is S41 = CYN 390,995.81, and the assessment cost is S42 = CYN 62,826.08. The total cost is S4 = CYN 453,821.90.
In summary, a comparative analysis of operating costs for an industrial park in Guangdong Province under three scenarios is shown in Table 3.
From the simulation comparison of the three scenarios, it can be seen that:
  • Based on the ultra-short-term power forecast results of photovoltaics and rigid loads, rolling optimization can be performed during the day to make the interconnection line power of the industrial park more accurately follow the optimized dispatch plan, reducing the execution deviation assessment and lowering the overall operating cost of the park.
  • The real-time control model using neural networks cannot effectively reduce the execution deviation of controllable load units, industrial parks still need to bear significant assessment costs, and they cannot significantly reduce the overall operation costs of industrial parks.
  • Considering the response characteristics (delay, response speed, etc.) of controllable loads and using minimum variance as the control objective, real-time predictive control of controllable loads can reduce the execution deviation of the controllable load unit and make the interconnection line power of the industrial park more accurately follow the rolling optimization dispatch plan during the day, further reducing the overall operating cost of the industrial park.
Controllable loads in industrial parks exhibit complex operational characteristics due to the influence of production processes and operating conditions. The model of controllable load proposed in this paper is a non-parametric model, in which the response characteristic curve is obtained through fitting with measured data. There may be differences between a single fixed-response characteristic curve and the actual response characteristics of the controllable load. Therefore, controllable loads may not be able to accurately track the target power curve without errors. To address this limitation, the following countermeasures can be considered: (1) Using parameter models, such as state-space equations, to more accurately model controllable loads. (2) In the feedback correction stage, dynamically modifying the predictive model of controllable load based on real-time control error. (3) Allocate a small-capacity energy storage system for deviation control.

5. Conclusions

Traditional dispatch methods cannot achieve precise control of the massive and diverse loads in industrial parks due to the significant differences in their control characteristics. Therefore, a unified modeling method for the control characteristics of diverse loads in industrial parks is proposed to quantitatively characterize their delay, start–stop characteristics, and control response speed. Based on this, an aggregated control model and its aggregation control strategy for diverse loads in industrial parks are established, and a predictive control rate for individual load considering delay and segmented response characteristics is provided to achieve precise unified aggregation control of diverse loads in industrial parks. The simulation results verify that the aggregated control model and its aggregation control strategy have achieved precise control of the diverse loads in industrial parks, providing low-cost flexible adjustment resources for power systems with high proportions of renewable energy.

Author Contributions

Conceptualization, Q.Z. and P.Y.; methodology, Q.Z.; software, Y.W. and Q.Z.; validation, Z.X. and Q.Z.; data curation, Y.W.; writing—original draft preparation, Q.Z. and P.Z.; project administration, Q.Z. All authors have read and agreed to the published version of the manuscript.

Funding

This research was funded by the National Natural Science Foundation of China (No. 51937005).

Institutional Review Board Statement

Not applicable.

Informed Consent Statement

Not applicable.

Data Availability Statement

The data used to support the findings of this study are available from the corresponding author upon request.

Conflicts of Interest

The authors declare no conflict of interest.

Nomenclature

T Sampling period
k , t Time instant, k , t = 1,2 ,
p k Output of the controllable load at time k
u k Control action at time k
a k , b k , c k Unit step response sequence of the controllable load in startup stage, operation stage, and shutdown stage
θ T , τ T , δ T Response delay of the controllable load in startup stage, operation stage, and shutdown stage
N T , V T , L T    The time required from receiving control command to entering a steady state in the startup stage, operation stage, and shutdown stage
k s The time of issuing startup control command
k r , t r The starting time of entering the operation stage
k c , t c The starting time of entering the shutdown stage
P G r i t , t Power of the interconnection line at time t
P N L , t Power of the inflexible load at time t
P R E , t Power of the renewable energy generation at time t
P A L , i , t Power of the i t h controllable load at t
N L Number of controllable loads in the industrial park
C D h Total operation cost for day ahead
C G r i t , t Cost of purchasing and selling electricity at time t
C d r , t Assessment cost for deviation at time t
T d a y Total number of dispatch periods for day-ahead
R t Electricity price at time t
P b a s e , t Day-ahead pre-dispatch plan for the interconnection line at time t
R d r , t u Positive deviation assessment price at time t
R d r , t l Negative deviation assessment price at time t
P G r i d , t , m a x Maximum exchange power of interconnection line at time t
P A L , i , t m a x Maximum power limits during operation stage at time t
P A L , i , t m i n Minimum power limits during operation stage at time t
s i , t R 1 indicates operation stage, 0 indicates non-operation stage
s i . m i n R Minimum daily operation time
s i . m a x R Maximum daily operation time
s i . s t R Maximum continuous operating time per start-up
s i . t S 1 indicates start-up stage, 0 indicates non- start-up stage
N i s Duration of start-up stage
s i , m a x S Maximum times of start-ups per day
t s t a r t , t e n d Allowable time interval for daily operation
C D i n , t 0 The overall operating cost of the next 4 h starting from t 0
t 0 The start time of each intra-day rolling optimization
P Prediction horizon
M Control horizon
h i Feedback correction coefficient
Λ Error weight matrix
Γ Control weight matrix
R ( k | k ) Ideal reference value vector obtained from the daily rolling optimization

References

  1. Liu, L.; Liu, T. A Control Strategy of Air-Conditioning Load Groups and Optimization Scheduling as Demand-side Resources Participating in Grid. Adv. Eng. Sci. 2017, 49, 175–182. (In Chinese) [Google Scholar] [CrossRef]
  2. Chen, S.; Chen, Q.; Xu, Y. Strategic Bidding and Compensation Mechanism for a Load Aggregator with Direct Thermostat Control Capabilities. IEEE Trans. Smart Grid 2018, 9, 2327–2336. [Google Scholar] [CrossRef]
  3. Liu, B. Scheduling Strategies of Smart Community with Load Aggregator-based Demand Response. In Proceedings of the 2018 2nd IEEE Conference on Energy Internet and Energy System Integration (EI2), Beijing, China, 20–22 October 2018; pp. 2–5. [Google Scholar] [CrossRef]
  4. Espinosa LA, D.; Almassalkhi, M. A Packetized Energy Management Macromodel with Quality of Service Guarantees for Demand-Side Resources. IEEE Trans. Power Syst. 2020, 35, 3660–3670. [Google Scholar] [CrossRef]
  5. Bian, D.; Shi, D.; Pipattanasomporn, M.; Kuzlu, M.; Rahman, S. Mitigating the Impact of Renewable Variability with Demand-Side Resources Considering Communication and Cyber Security Limitations. IEEE Access 2019, 7, 1379–1389. [Google Scholar] [CrossRef]
  6. Tostado-Véliz, M.; Hasanien, H.M.; Jordehi, A.R.; Turky, R.A.; Jurado, F. Risk-averse optimal participation of a DR-intensive microgrid in competitive clusters considering response fatigue. Appl. Energy 2023, 339, 120960. [Google Scholar] [CrossRef]
  7. Fu, X.; Zhou, Y. Collaborative Optimization of PV Greenhouses and Clean Energy Systems in Rural Areas. IEEE Trans. Sustain. Energy 2023, 14, 642–656. [Google Scholar] [CrossRef]
  8. Fu, X.; Zhou, Y.; Wei, Z.; Wang, Y. Optimal operation strategy for a rural microgrid considering greenhouse load control. CSEE J. Power Energy Syst. 2022, 1–11. [Google Scholar] [CrossRef]
  9. Tu, J.; Zhou, M.; Cui, H.; Li, F. An Equivalent Aggregated Model of Large-Scale Flexible Loads for Load Scheduling. IEEE Access 2019, 7, 143431–143444. [Google Scholar] [CrossRef]
  10. Wang, J.; Zhang, F.; Liu, H.; Ding, J.; Gao, C. Interruptible load scheduling model based on an improved chicken swarm optimization algorithm. CSEE J. Power Energy Syst. 2021, 7, 232–240. [Google Scholar] [CrossRef]
  11. Gao, C.; Li, Q.; Li, H.; Zhai, H.; Zhang, L. Methodology and Operation Mechanism of Demand Response Resources Integration Based on Load Aggregator. Autom. Electr. Power Syst. 2013, 37, 78–86. (In Chinese) [Google Scholar] [CrossRef]
  12. Sun, W.; Liu, X.; Xiang, W.; Li, H. Master-Slave Game Based Optimal Pricing Strategy for Load Aggregator in Day-ahead Electricity Market. Autom. Electr. Power Syst. 2021, 45, 159–167. (In Chinese) [Google Scholar] [CrossRef]
  13. Xu, H.; Chang, Y.; Zhao, Y.; Wang, F. A new multi-timescale optimal scheduling model considering wind power uncertainty and demand response. Int. J. Electr. Power Energy Syst. 2023, 147, 108832. [Google Scholar] [CrossRef]
  14. Do Prado, J.C.; Qiao, W. A stochastic decision-making model for an electricity retailer with intermittent renewable energy and short-term demand response. IEEE Trans. Smart Grid 2019, 10, 2581–2592. [Google Scholar] [CrossRef]
  15. Saavedra, A.; Negrete-Pincetic, M.; Rodríguez, R.; Salgado, M.; Lorca, Á. Flexible load management using flexibility bands. Appl. Energy 2022, 317, 119077. [Google Scholar] [CrossRef]
  16. Ryu, J.; Kim, J. Virtual Power Plant Operation Strategy under Uncertainty with Demand Response Resources in Electricity Markets. IEEE Access 2022, 10, 62763–62771. [Google Scholar] [CrossRef]
  17. Wang, S.; Bi, S.; Zhang, Y.J.A. Demand response management for profit maximizing energy loads in real-time electricity market. IEEE Trans. Power Syst. 2018, 33, 6387–6396. [Google Scholar] [CrossRef]
  18. Zhang, C.; Wang, Q.; Wang, J.; Pinson, P.; Morales, J.M.; Østergaard, J. Real-time procurement strategies of a proactive distribution company with aggregator-based demand response. IEEE Trans. Smart Grid 2018, 9, 766–776. [Google Scholar] [CrossRef] [Green Version]
  19. Zare Oskouei, M.; Zeinal-Kheiri, S.; Mohammadi-Ivatloo, B.; Abapour, M.; Mehrjerdi, H. Optimal Scheduling of Demand Response Aggregators in Industrial Parks Based on Load Disaggregation Algorithm. IEEE Syst. J. 2022, 16, 945–953. [Google Scholar] [CrossRef]
  20. Zhu, W. Research on Contract Decision Model for Load Aggregators Considering Uncertainty of User; North China Electric Power University: Beijing, China, 2016. (In Chinese) [Google Scholar]
  21. Wang, F.; Ge, X.; Li, K.; Mi, Z. Day-Ahead Market Optimal Bidding Strategy and Quantitative Compensation Mechanism Design for Load Aggregator Engaging Demand Response. IEEE Trans. Ind. Appl. 2019, 55, 5564–5573. [Google Scholar] [CrossRef]
  22. Cui, J.; Gao, M.; Zhou, X.; Li, Y.; Liu, W.; Tian, J.; Zhang, X. Demand Response Method Considering Multiple Types of Flexible Loads in Industrial Parks. SSRN Electron. J. 2022, 122, 106060. [Google Scholar] [CrossRef]
  23. Xu, G.; Liu, L.; Lu, Y.; Zhao, Y.; Zhang, L.; Song, S. Perception and decision-making for demand response based on dynamic classification of consumers. Int. J. Electr. Power Energy Syst. 2023, 148, 108954. [Google Scholar] [CrossRef]
  24. Zheng, S.; Sun, Y.; Qi, B.; Li, B. Incentive-Based Integrated Demand Response Considering S&C Effect in Demand Side with Incomplete Information. IEEE Trans. Smart Grid 2022, 13, 4465–4482. [Google Scholar] [CrossRef]
  25. Han, R.; Hu, Q.; Cui, H.; Chen, T.; Quan, X.; Wu, Z. An optimal bidding and scheduling method for load service entities considering demand response uncertainty. Appl. Energy 2022, 328, 120167. [Google Scholar] [CrossRef]
  26. Zhao, Z.; Guo, J.; Luo, X.; Lai, C.S.; Yang, P.; Lai, L.L.; Li, P.; Guerrero, J.M. Distributed Robust Model Predictive Control-Based Energy Management Strategy for Islanded Multi-Microgrids Considering Uncertainty. IEEE Trans. Smart Grid 2022, 13, 2107–2120. [Google Scholar] [CrossRef]
  27. An, S.; Wang, H.; Yuan, X. Real-time optimal operation control of micro energy grid coupling with electricity–thermal–gas considering prosumer characteristics. IEEE Access 2020, 8, 216566–216579. [Google Scholar] [CrossRef]
Figure 1. Typical operational characteristics curves of controllable loads in industrial parks.
Applsci 13 09205 g001
Figure 2. Aggregated control framework for multi-type loads in industrial parks.
Applsci 13 09205 g002
Figure 3. Control block diagram of the real-time predictive control.
Applsci 13 09205 g003
Figure 4. Day-ahead and intra-day power forecasting curves and actual power generation curves of photovoltaic.
Applsci 13 09205 g004
Figure 5. Day-ahead and intra-day power forecasting curves and actual power curves of rigid loads.
Applsci 13 09205 g005
Figure 6. Day-ahead dispatch plan and the actual power curve of the controllable load in industrial park.
Applsci 13 09205 g006
Figure 7. The day-ahead pre-dispatch plan curve(base), the optimized dispatch curve(expected), and the actual operating curve(actual) for the interconnection line of Scenario One.
Applsci 13 09205 g007
Figure 8. Intra-day dispatch plan and the actual power curve of controllable load in industrial park.
Applsci 13 09205 g008
Figure 9. The day-ahead pre-dispatch plan curve(base), the optimized dispatch curve(expected), and the actual operating curve(actual) for the interconnection line of Scenario Two.
Applsci 13 09205 g009
Figure 10. Dispatch plan and the actual power output curve of the controllable load in industrial park based on neural network model.
Applsci 13 09205 g010
Figure 11. The day-ahead pre-dispatch plan curve(base), the optimized dispatch curve(expected), and the actual operating curve(actual) for the interconnection line of Scenario Three.
Applsci 13 09205 g011
Figure 12. Dispatch plan and the actual power curve of the controllable load in industrial park with considering the control-response characteristics.
Applsci 13 09205 g012
Figure 13. The day-ahead pre-dispatch plan curve(base), the optimized dispatch curve(expected), and the actual operating curve(actual) for the interconnection line of Scenario Four.
Applsci 13 09205 g013
Table 1. Peak–valley–flat electricity price of a certain industrial park in Guangdong Province.
TypeTime PeriodElectricity Price
(CYN/kWh)
Peak10:00–12:00, 14:00–19:001.1767
Flat08:00–10:00, 12:00–14:00, 19:00–24:000.7036
Valley00:00–08:000.2845
Table 2. Characteristic parameters of controllable loads.
Controllable load object AL0:
a i 0 ,   0.444 ,   0.889 ,   1
b i 0 ,   0.583 ,   1
c i 1 ,   0.556 ,   0.111 ,   0
Range of operating power 500 ,   900
Single continuous operating time4
Daily operating time constraint 4 ,   10
Daily start–stop frequency limit1
Daily operating time interval constraint 14 : 00 ,   24 : 00
Controllable load object AL1:
a i 0 ,   0.5 ,   0.875 ,   1
b i 0 ,   0.5625 ,   1
c i 1 ,   0.5 ,   0.125 ,   0
Range of operating power 600 ,   1200
Single continuous operating time2
Daily operating time constraint 8 ,   18
Daily start–stop frequency limit2
Daily operating time interval constraint 00 : 00 ,   18 : 00
Controllable load object AL2:
a i 0 ,   0 ,   0.64 ,   1
b i 0 ,   0 ,   0.62 ,   1
c i 1 ,   1 ,   0.36 ,   0
Range of operating power 200 ,   500
Single continuous operating time10
Daily operating time constraint 10 ,   24
Daily start–stop frequency limit2
Daily operating time interval constraint 00 : 00 ,   24 : 00
Controllable load object AL3:
a i 0 ,   0 ,   0.562 ,   0.938 ,   1
b i 0 ,   0 ,   0.545 ,   1
c i 1 ,   1 ,   0.438 ,   0.062 ,   0
Range of operating power 600 ,   1200
Single continuous operating time2.5
Daily operating time constraint 2.5 ,   8
Daily start–stop frequency limit1
Daily operating time interval constraint 12 : 00 ,   20 : 00
Controllable load object AL4:
a i 0 ,   0 ,   0 ,   0.667 ,   0.889 ,   0.963 ,   1
b i 0 ,   0 ,   0 ,   0.667 ,   0.833 ,   1
c i 1 ,   1 ,   1 ,   0.333 ,   0.111 ,   0.037 ,   0
Range of operating power 300 ,   600
Single continuous operating time3.5
Daily operating time constraint 3.5 ,   12
Daily start–stop frequency limit1
Daily operating time interval constraint 00 : 00 ,   12 : 00
Controllable load object AL5:
a i 0 ,   0 ,   0 ,   0.556 ,   0.875 ,   1
b i 0 ,   0 ,   0 ,   0.64 ,   1
c i 1 ,   1 ,   1 ,   0.444 ,   0.125 ,   0
Range of operating power 400 ,   800
Single continuous operating time5.5
Daily operating time constraint 5.5 ,   16
Daily start–stop frequency limit1
Daily operating time interval constraint 4 : 00 ,   20 : 00
Table 3. A comparative analysis of operating costs for an industrial park in Guangdong Province under four scenarios.
Scenario One
(CYN)
Scenario Two
(CYN)
Scenario Three
(CYN)
Scenario Four
(CYN)
Expected cost of purchasing electricity398,618.06399,991.38399,991.38399,991.38
Actual cost of purchasing electricity403,184.11402,262.37386,169.39390,995.81
Expected assessment cost15,628.3615,063.1015,063.1015,063.10
Actual assessment cost75,260.4872,245.1087,097.4862,826.08
Expected total cost414,246.42415,054.48415,054.48415,054.48
Actual total cost478,444.60474,507.47473,266.87453,821.90
Disclaimer/Publisher’s Note: The statements, opinions and data contained in all publications are solely those of the individual author(s) and contributor(s) and not of MDPI and/or the editor(s). MDPI and/or the editor(s) disclaim responsibility for any injury to people or property resulting from any ideas, methods, instructions or products referred to in the content.