1. Introduction
Cracks are ubiquitous in concrete structures, including bridges, pavements, and highways, and are the number one issue to be addressed in road and bridge pavement maintenance [
1]. Most pavement defects initially manifest as pavement cracking under repeated pressure, the physical or chemical environment. Some cracks will extend and expand, eventually exposing the internal reinforcement and other structures, and damage their protective layers, which may affect the driving of vehicles or lead to the collapse of roads and bridges, causing hazards to humans or even irreversible hazards [
2,
3]. To assess the safety and durability of concrete structures, crack detection plays an important role in the maintenance of concrete structures [
1].
Traditional crack detection relies on the experience of the inspector, as well as the technical level of judgment, or the help of electromagnetic detection [
4], radioactivity detection [
5], ultrasonic detection [
6], and infrared [
7], which have been continuously improved. Although they can achieve the expected detection of cracks, the above methods not only increase the detection cost, but also produce a strong subjective factor, and the long-term use of X-rays and gamma rays for detection will produce a large number of hazards to the human body.
Based on the above, road operation and maintenance companies urgently need some way to achieve the automatic detection of cracks. This is the main objective of many working researchers. For example, the threshold-based approach proposed by Mahler [
8] is suitable for well-defined large cracks. An entropic dynamic thresholding technique combined with morphological filtering was proposed by Oliveira [
9] to remove false positives. Huang [
10] proposed a crack clustering method to classify and detect transverse cracks and longitudinal cracks.
With the booming artificial intelligence and computer hardware, deep learning-based bridge crack detection technology has achieved great results. However, these crack detection methods require abundant data, and they will take a long time to collect a large amount of road data and then upload them to the computing environment. Cloud-computing has high latency, low bandwidth, and large data storage capacity, which will not produce a positive response to road accidents. Edge-computing has low latency, a fast response, and good protection of data privacy. Considering the drawbacks of traditional crack detection and the advantages offered by edge computing, this paper aims to propose a lightweight crack detection model that can be easily deployed on edge devices to achieve a fast response to cracks. Below, we list several contributions made by this research:
We presented an automatic crack detection algorithm that is deployable to edge devices, i.e., BT–YOLO, which is an improved algorithm based on the combination of Transformer and YOLO. It can achieve high-precision crack detection;
We performed ablation experiments, as well as comparative experiments. The effectiveness of each module was verified;
We deployed the model for an edge device and tested it to verify its excellent detection capability.
2. Related Work
The automatic recognition of bridge cracks based on machine vision is very important for the construction of a bridge crack detection system, and the feature extraction of bridge images and the determination of the presence of cracks in the images are the two basic steps of crack detection. According to whether manual extraction is required in the crack feature extraction stage, the target detection algorithms can be classified into two categories: traditional methods and deep learning-based detection algorithms. Deep convolutional networks with a large number of parameters have unique advantages in image processing. Deep learning-based target-detection algorithms are good solutions to the problem of difficult manual extraction of features by traditional detection algorithms.
2.1. Crack Detection Using Deep Learning
Deep learning has excelled in different kinds of tasks; it not only performs well in classification tasks, but more and more researchers are also applying it to the segmentation and detection of concrete cracks with better progress. N. Otsu [
11] proposed the Otsu optimal thresholding method, which is intended for the unsupervised selection of optimal thresholds. The method is fast and simple, but it is easily distracted by background noise. Huang [
12] proposed an algorithm that uses histogram equalization to improve image contrast; however, this method increases the contrast of noise and reduces the computation speed. S. Pize [
13] proposed a histogram equalization improvement method to increase the computation speed. The conventional method cannot accurately detect cracks due to complex background conditions such as noise and contrast inhomogeneity. Zalama [
14] used a Gabor filter-based method to detect transverse and longitudinal cracks, and finally used the AdaBoost algorithm to select and combine classifiers to improve the results provided by individual classifiers. In order to classify and detect multi-class skin cracks, Wang [
15] used a method combining support vector machines (SVM) and data fusion technology. Shi [
16] put forward a method for automatic road crack detection; this was a method based on random structure forests, namely CrackForest, but its detection of complex cracks had the limitation of low accuracy. Chen [
17] proposed a crack detection method based on the local binary pattern (LBP) and SVM. They took videos from a road and first extracted LBP features from the videos. Next, they reduced the dimensionality of these feature spaces via principal component analysis (PCA), and finally used SVM to train on simplified samples to determine the crack type. Chen [
18] used mean filtering to remove image noise, and to strengthen the contrast of pavement, the histogram equalization method was used. Then, they combined pre-processing before threshold segmentation to remove shadows and image noise. The Niblack method was used for cracks extraction, and finally, SVM was used for crack classification. In order to segregate cracks from the background, Yang [
19] set a proper threshold in the network. But this method had drawbacks of not detecting the whole crack structure on the whole image.
Song [
20] captured the contextual information of cracks by building a multi-scale dilation module. In order to refine the features, they introduced an attention mechanism. In addition, they used different levels of rich features fused in the upsampling module to get better results. Prasanna [
21] put forward an automatic detection algorithm, STRUM classifier, that eliminated the demand to manually adjust the threshold parameters using steady curve-matching for the spatial orientation of the possible crack area. To eliminate the noise present in the crack detection images, Fujita et al. [
22] proposed an image preprocessing method of subtractive preprocessing of smoothed images to remove minor variations such as irregular illumination from the training image, and then used a Hessian matrix filter to emphasize crack features. In order to detect cracks in videos, Chen [
23] et al. proposed a deep learning framework that was built using convolutional neural networks and a Naïve Bayes data fusion strategy. In the crack image, the proportion of cracks was very small. In order to solve the problem of unbalanced crack pixels, Fan et al. [
24] put forward a method to modify positive and negative samples. To segment the crack from the image, Dung [
25] put forward a segmentation method based on a fully convolutional neural network. They evaluated the performance of several different pre-trained CNNs in the classification task. Pre-training was first performed on a public dataset, and finally, VGG16 was selected as the encoder of the network from VGG16, Inception, and ResNet. Liu et al. [
26] used the U-Net for the first time to detect concrete cracks, the focal loss function was chosen for their evaluation function, and the Adam algorithm was used for optimization. In their experiments, the proposed method effectively identified various cracks and had a better performance compared with the traditional FCN network. Liu et al. [
27] put forward a segmentation method. They used the improved U-NET algorithm to detect and segment pavement cracks. This method used a pre-trained ResNet-34 to replace the encoder of the original network, and the SCSE module was added to the upsampling part.
Feng et al. [
28] summed the weighted values of pixels in the corresponding regions of different layers of the feature map as the output of the feature map and also used this structure in the residual network to learn the road crack features. Kemal [
29] used a pre-trained Faster R-CNN to detect concrete road cracks under different shooting conditions, weather, and lighting levels.
2.2. Status of Research on Edge-Computing
In order to ensure the accuracy of fabric defect detection, Zhang [
30] proposed an improved MoileNetV2-SSDLite fabric defect detection algorithm and deployed it on the edge device to realize the real-time detection of fabric defects. Yang [
31] proposed a crack segmentation network that can be deployed on the edge device of the UAV. In order to improve the detection accuracy of cracks of different sizes, they fused the feature information of different layers into lower-level features, and then used atrous convolutions to increase the receptive field information of low-resolution crack feature maps. Tang [
32] proposed an automatic detection system for linear defects in large-scale photovoltaic power plants. This system was based on the cloud edge-computing framework, and this system can distribute tasks among edge devices, edge servers, and cloud servers. Wu [
33] proposed an end-to-end framework. The framework was driven using edge computing, and this framework has two parts: cloud computing enhancement and edge detection, which can perform image enhancement and object detection tasks under low-light intensity conditions. In order to detect blood glucose in real-time, Zhu [
34] et al. proposed a deep learning model that used an attention mechanism and a recurrent neural network; the model can be embedded in wearable devices. The devices embedded with the model were connected using Bluetooth. They also developed a mobile app to back up the data and tweak the model.
In summary, the current proposed target detection model for cracks has some shortcomings, and the edge computing-based crack detection algorithm still has much room for improvement.
3. Method
3.1. Experimental Platform
Deep learning model training requires a mass of data as support. For the sake of reducing the time consumed in the course of training, we trained the models on a server and a personal computer. The detailed configuration parameters of the server and the personal computer are shown in
Table 1 and
Table 2.
3.2. Experimental Data
A total of 3433 images containing various cracks were used for training and testing in this paper, with data from Zhang [
35]. In this paper, a portion of the data was selected for training, of which 3033 images were used for model training and the remaining 400 pictures were applied to verify the model effect. For better and more convenient model training and testing, all images were labeled with the LabelImg v1.8.6 [
36] software for crack labeling, which is a visual image labeling tool that can directly label the text format required by You Only Look Once (YOLO). In
Figure 1, we showed some examples of annotations.
3.3. Network Structure
YOLOv5 is currently the mainstream target detection algorithm. The network has many versions: YOLOv5x, YOLOv5l, YOLOv5m, and YOLOv5s. It uses mosaic for data strengthening, self-adapting picture scaling, and adaptive anchor box computation on the input. Mosaic data augmentation uses four images that are randomly scaled and cropped to create a new image. The images are extracted in the backbone section and passed into the feature pyramid networks (FPN) and path aggregation network (PAN) [
37] in the neck, feature fusion is performed on the extracted features, and the feature information at different scales is combined and passed into the head to generate a prediction frame.
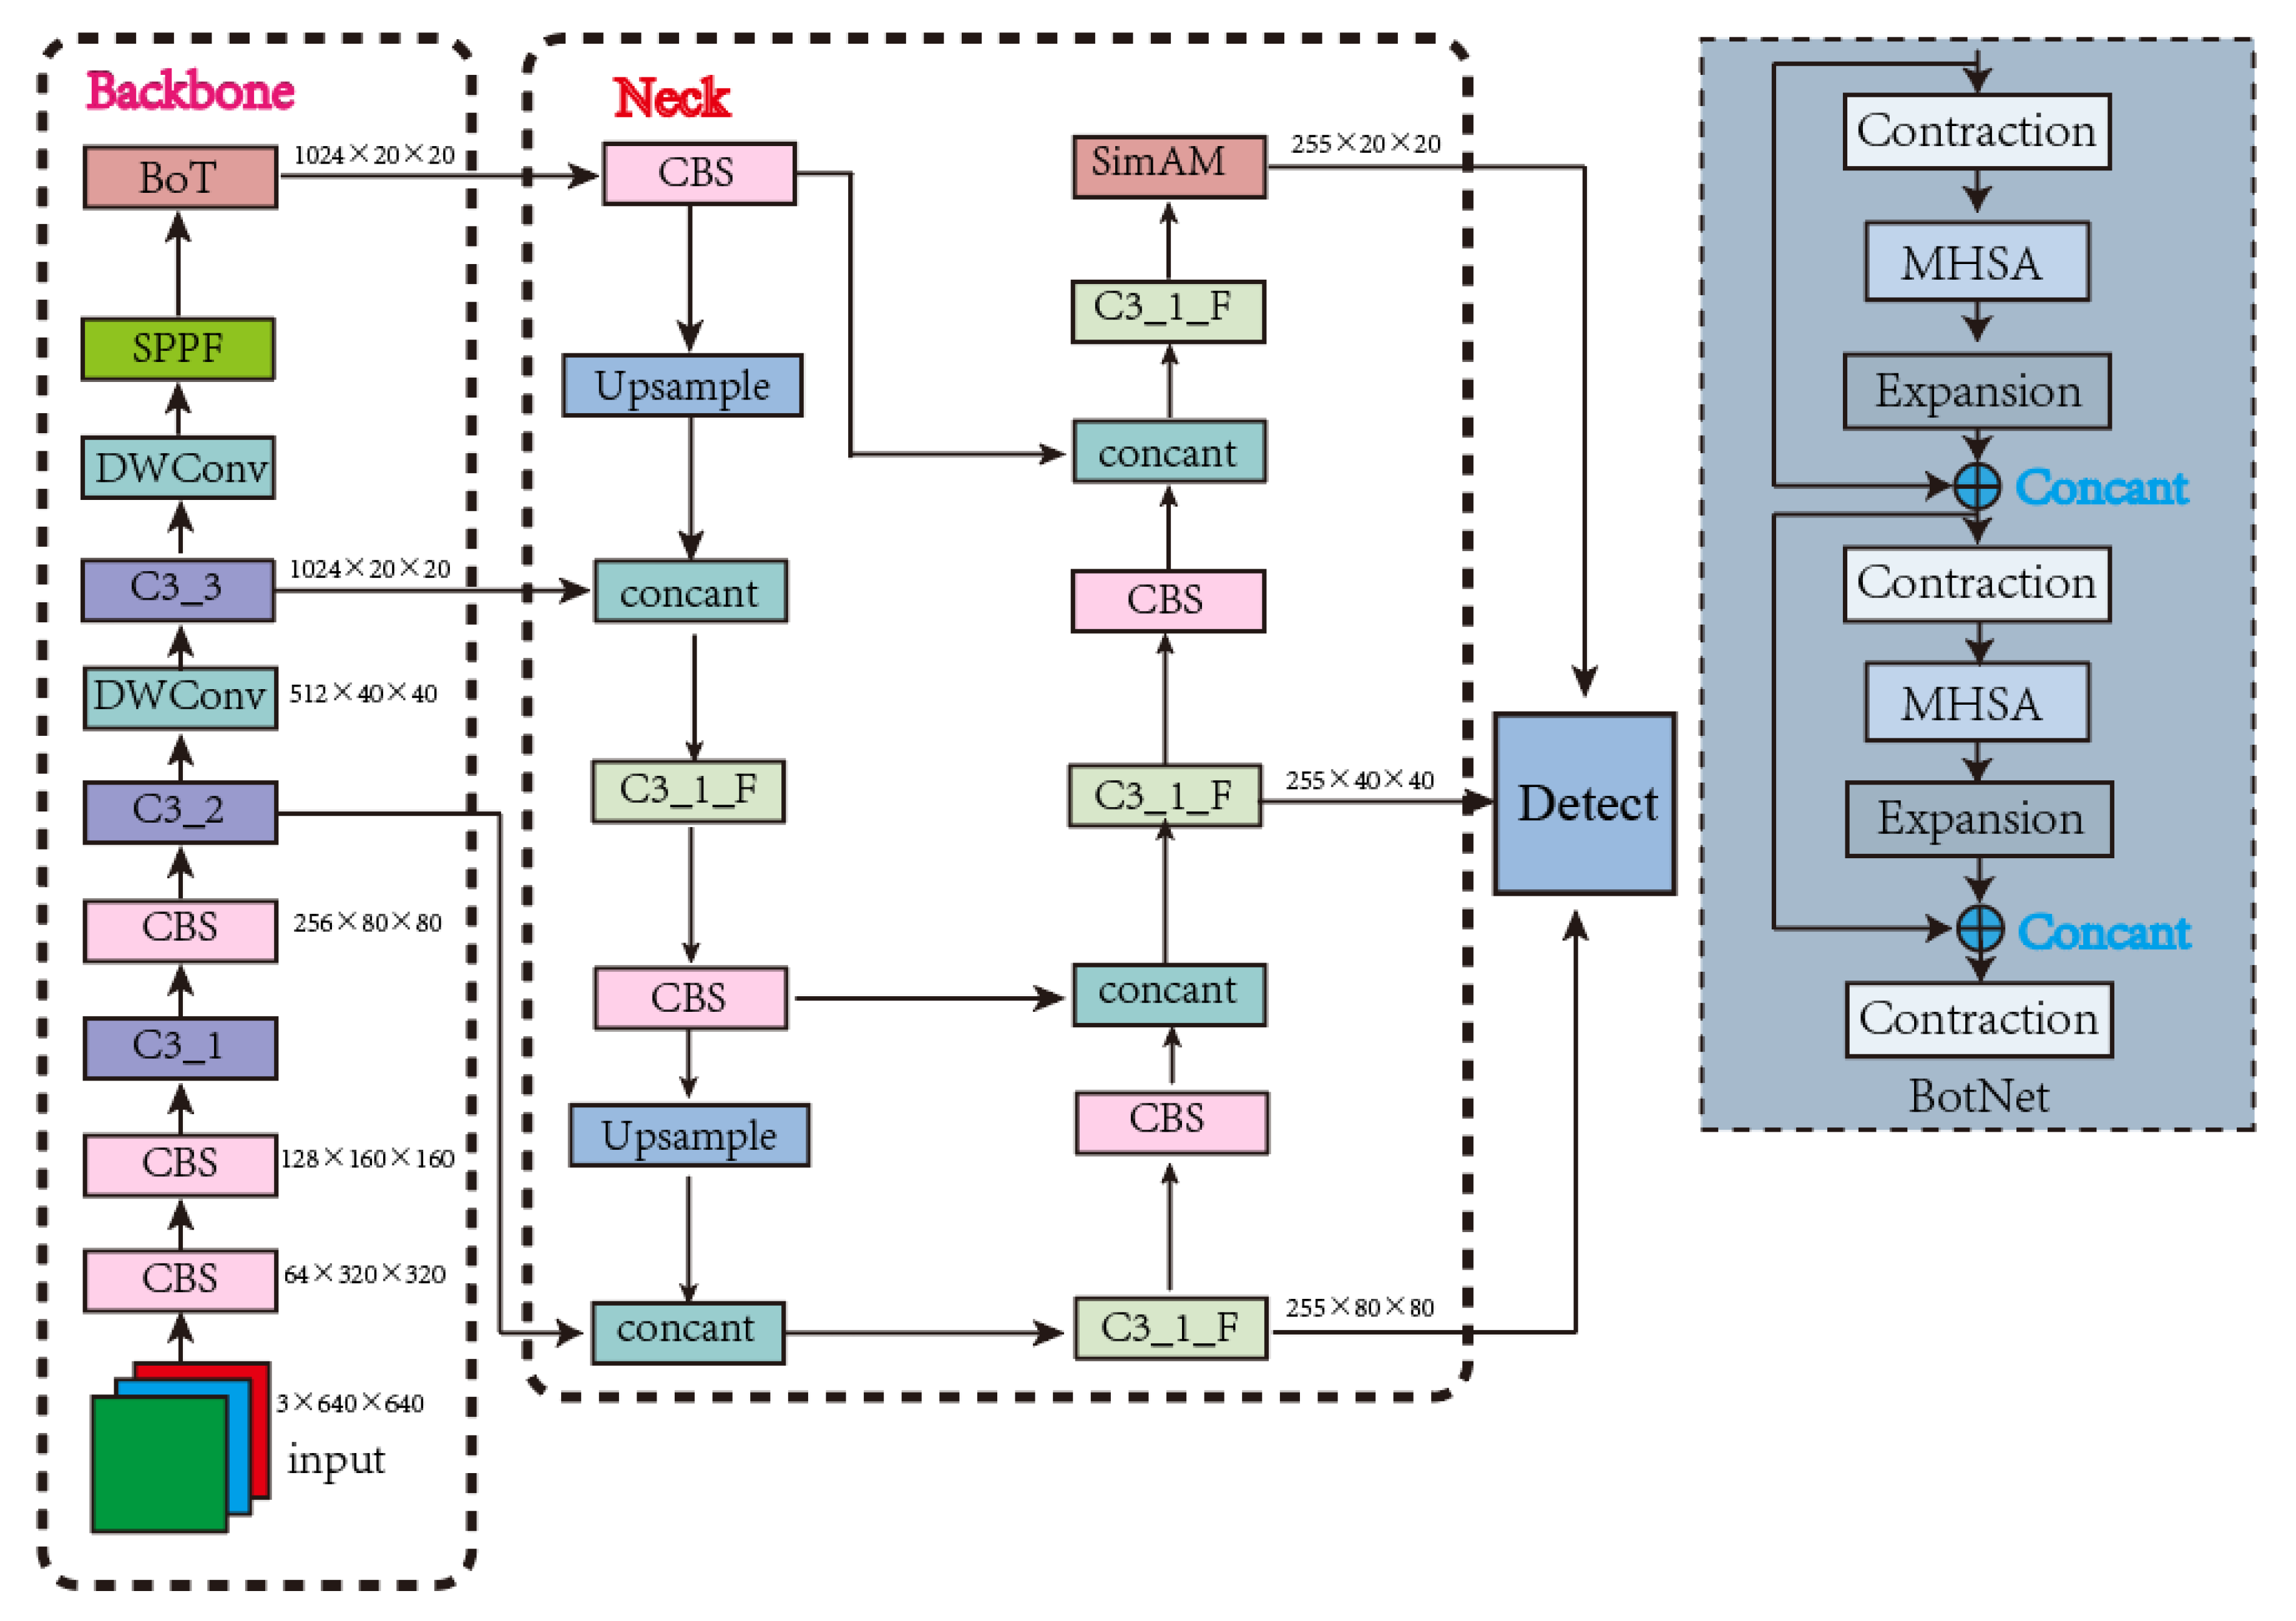
In this study, we chose the YOLOv5s model as our base model by trying to train and combine the dataset size and crack characteristics. Considering that the convolution operation is the more computationally intensive part of the model, we first improved the traditional convolution module in the original backbone by using depth-wise convolution (DWConv) [
38]. This saved a large number of parameters and multiple cumulative operations, while holding great precision and results in smaller latency. Next, we introduced the self-attention BoTNet (Bottleneck Transformer) [
39] structure into YOLOv5s. BoTNet is a powerful backbone network with a simple basic concept, which combines the self-attention of image classification, image segmentation and object detection in the crack detection task, not only improving the baseline, but also reducing the parameters. We injected the SimAM [
40] attention mechanism module into the model to highlight important features and suppress unimportant ones. In crack detection, the SimAM module can focus on highlighting crack features to improve the subsequent feature fusion. Considering the mismatch between the prediction box and the expected prediction box, we finally improved the original loss function, replaced CIoU (Complete-IOU) with SIoU (Scylla-IOU) [
41], and redefined the penalty metric. The training results indicate that SIoU effectually increased the crack detection precision. In
Figure 2, we showed the improved network architecture.
CBS means Conv+BN+Silu, and C3_X_F means replace Bottlneck*X with Bottlneck_F*X based on C3_F. In
Figure 3, we showed the specific structure of C3_X.
3.3.1. DWConv
Although YOLOv5s is the lightest network among the YOLOv5 models, the conventional convolution in the primordial model is switched to the depth-wise convolution (DWConv), considering the low storage characteristics of the edge devices and the vast parameters brought by the conventional convolution which may lead to insufficient memory, and the slowing down of the model inference making the response to cracks too slow.
In deep convolution, a single filter is applied to the apiece input channel, which means that spatial convolution is performed independently on each channel of the input feature map (ifmap) [
42]. The underlying assumption behind DWConv is that spatial and channel correlation is capable when fully decoupled and solely implemented. In comparison with standard convolution, depth-wise convolution (DWConv) saves a mass of parameters and multiple accumulation operations, while maintaining high precision. Depth-wise convolution (DWConv) will lead to fewer operations and less postponement in mobile accelerators [
38].
3.3.2. Transformer Layer
BoTNet is a conceptually simple, but powerful backbone architecture. By using Multi-Head Self-Attention (MHSA) to replace the spatial convolutional layers in the last three blocks of ResNet, BoTNet makes it possible to significantly improve the baseline, while also reducing parameters and decreasing latency.
When the number of convolutional layers is increased, the local receptive field at a specific location on the feature map will expand. Some of the cracks occupy a small size in the image and the exorbitant local receptive field go against the small-sized target detection. Therefore, in this study, we removed the last C3 layer in the backbone feature extraction network and combined BoTNet as the crack characteristic extraction network. In this way, the amount of calculation was reduced, and this global attention mechanism enabled the model to better combine the contextual information and solve the problem of small target density.
3.3.3. Attention Module
As a data processing method, the attention mechanism has been widely applied in machine learning missions. It is a special construction embedded in a machine learning model to help the model select effective and appropriately sized features and discard features that are not effective for the model training, thus allowing the model to perform the task efficiently.
SimAM is a non-parameter module that can be plugged in a model to deduce 3D weights for feature maps in layers. Its design is inspired by neuroscientific theories of the mammalian brain and its concept is simple but very effective [
40]. We first proved the validity of this module in the model that we proposed through ablation experiments, then verified it through our comparison experiments and found that introducing this attention module into the neck network was more effective. Finally, we appended this attention mechanism module to the neck feature fusion network.
In
Figure 4 below, we showed the specific structure of SimAM. Unlike other attention mechanisms, SimAM directly estimates 3D weights. The same color in the plot indicates the use of a single scalar for each channel, spatial location, or point on a feature.
3.3.4. Loss Function
The loss function determines the performance of the model to a certain extent because the model prediction is often different from the real value, and the magnitude of this difference is measured by the loss function. In BT–YOLO, the loss was divided into three types: classification loss, localization loss, and confidence loss. Adding these three losses together gave us the loss of the entire model. Considering the mismatch between the prediction box and the desired prediction box, we redefined the penalty metric, where the localization loss was calculated using SIoU, which contained the angle loss, distance loss, shape loss, and IoU loss. In Equation (1), we defined the way of computation as follows:
where
denoted the distance loss after taking into account the angular loss, which was calculated as:
In
Figure 5 below, we showed some notation in the calculation formula. Angle cost
can be calculated using Equation (4).
It is clear from Equation (5) that the closer is to , the larger the contribution of distance loss.
Equation (8) denotes the shape loss, which is calculated as:
3.4. Model Training
In this study, we combined the inference speed of the models and the data characteristics, and all models involved in this study were uniformly chosen to have 300 iterations with a batch size of 8. All parameters were set to be the same, using stochastic gradient descent (SGD) [
43] optimization method. Additionally, we applied pre-training weights in constructing the backbone network, which made the convergence speed of the network faster, and used a cosine annealing learning rate decay strategy to accelerate the training given the small initial learning rate, until the network parameters were stable, and reduced the update of the learning rate to reach the optimal solution when it was close to the optimal solution. As the iteration continued, the loss decreased until the change was small and the model converged. Finally, the localization loss and confidence loss were close to 0.044 and 0.072, respectively. In
Figure 6, we showed the curve of the loss value as the training process changes.
In our research, we first proved the validity of each module improved in the model by conducting ablation experiments. Next, a mass of comparison tests was conducted to compare the improved model with the current mainstream one-stage detection algorithm model to verify that our proposed algorithm model has certain advantages in crack detection.
4. Analyzing Experimental Results
4.1. Assessment Indicators
We installed a threshold in the model to determine whether a prediction box is correct or not, which can be called the intersection over union (IoU). If the IoU between the predicted box and the actual box was bigger than the value we set, then the predicted box was true and valid. In
Figure 7, the red box in the upper left corner represented the true box and the blue box in the bottom right corner represented the model prediction box. Through Equation (10), we showed how the IoU was calculated.
We also introduced standard evaluation criteria in deep learning to assess the models, mainly using
(precision),
(recall), and mean average precision (mAP). The precision rate indicates the ratio of all results where the model predicts a positive sample and the model predicts it correctly, which is expressed as the ratio of all examples predicted to be ‘crack’ that are truly labeled as ‘crack’ in this study. The accuracy rate is defined in Equation (11) as follows:
In the equation, two kinds of samples need to be defined: and . denotes the count of examples that were ‘crack’ and predicted by the model to be ‘crack’. denotes the quantity of examples that were ‘background’ but predicted by the model to be ‘crack’.
The recall represented the magnitude of the positive examples predicted by the model, accounting for the total number of positive examples. In Equation (12), we defined how to calculate the recall.
In the equation, denotes the count of examples that were ‘crack’ but were predicted by the model to be the background.
4.2. Ablation Experiment
In our research, we modified the model to prove that our modifications helped in the training of the model and the prediction of cracks, as well as the deployment of the model. We performed a series of ablation experiments for validation. We not only conducted experiments for each module with individual modifications, but also combined multiple experimental scenarios. After each experiment was completed, we recorded the experimental results of each model, including its main contrast parameters. The five main comparison values are shown in
Table 3. After training, the accuracy, recall, number of parameters, and mAP scores of our proposed crack detection model were 0.896, 0.914, 5,267,826, and 0.947, respectively.
Although the accuracy and recall were reduced after replacing the conventional convolution, the combination of Transformer and DWConv still achieves the detection requirements with a significant reduction in the number of parameters and the addition of the SimAM parametric-free attention mechanism also made a small improvement in the model effect. Compared to YOLOV5s, our proposed BT–YOLO crack detection model improved by 4.5% in accuracy, 8.3% in recall, and 8% in mAP, and produced 24.9% parameter reduction in the primary model. The detection veracity requirement was achieved, while satisfying the edge deployment.
4.3. Comparison Experiments
For the sake of highlighting the advantages of our proposed model, we had selected some current mainstream target detection methods for comparison experiments, including YOLOv3, YOLOv4-Tiny, and YOLOv7-Tiny. In
Figure 8, we compared the four evaluation metrics of these several models.
In this study, to make our proposed model more convincing, the comparison experimental environments we performed in were consistent and had the same parameter configurations. From
Figure 8, we can conclude that our proposed algorithm model outperformed the existent popular one-stage detection algorithms mentioned in this paper. In respect to crack detection accuracy P, R, and mAP, it also had the least number of parameters.
4.4. Edge Device Deployment
In
Figure 9, we show the specific process of edge deployment.
For practical applications, we need to deploy the model within some edge devices to facilitate real-time detection, and in some engineering projects, the detection of video sources. Therefore, we deployed the model to edge devices and performed image detection, as well as video detection to measure the detection results of the model. The NVIDIA Jetson AGX Xavier edge device was used by us for the edge deployment of the model. We used a mobile device to take some pavement crack images in a jpg format for testing the model effect in the edge device. We also took a 12 s video of the pavement crack, which was used to emulate the engineering practical application scenario. The test results showed that the crack detection algorithm that we proposed can be deployed on the edge device and achieve the effect of real-time crack detection. In
Figure 10, we showed some crack detection effects in the edge device.
When deployed within edge devices for detection, the inference time can reach 5.1 ms per image, and when tested on images, it can detect cracks in the images very well.
We showed the crack detection under cloudy and rainy weather conditions in
Figure 11, where
Figure 11a is the result tested by the unmodified model, and
Figure 11b is the result detected by our proposed model in this environment. From the displayed results is the image, it can be seen that our proposed model also had a good detection effect in this environment, and the missed detection situation was greatly improved.
We showed the effect of crack video detection in
Figure 12. We achieved a frame rate of 89 FPS when using the edge device for video detection, which met the demand for real-time detection in the project.
5. Discussion
Cracks had their unique characteristics and overfitting often occurred when training the target detection model. During model training, error in the training set gradually decreased following the number of training iterations increasing. Under normal circumstances, the error on the validation set also showed this trend. When we saw that the error in the validation set was increasing, it was considered whether the overfitting phenomenon occurred. Setting an appropriate number of training iterations was necessary, and data augmentation was also an effective initiative to reduce overfitting.
In the process of building the network model, we found that it was easy to miss the detection of fine cracks in images with background interferences. The attention mechanism in deep learning networks stands out for highlighting the features of the target object while effectively suppressing less important background features. Considering the low storage performance of edge devices, we decided to enhance crack detection by integrating an attention mechanism into the network. Specifically, we chose the parameter-free SimAM attention mechanism. When we inserted the attention mechanism and replaced the loss function in the model, the missed detection situation was significantly improved.
When we tested the model after deployment of edge devices, we found that lighting had a large impact on crack detection, such as in video detection under low-light conditions. At dusk, crack leakage easily occurred, but after restored lighting, leakage almost no longer occurred.
6. Conclusions
In this study, we combined Transformer and YOLOv5 to complete the construction of the crack feature extraction network. Considering that too large a perceptual field was not conducive to a small target detection, Transformer’s global self-attention mechanism can better link contextual information and focus on crack features. Additionally, considering the low storage and low computational efficiency of edge devices, we improved the traditional convolution. DWConv can combine high detection accuracy, while reducing parameter computation, and had a lower latency in mobile devices. Next, we introduced a parametric-free attention mechanism in the feature fusion stage, which improved the model effectiveness without bringing in computational parameters. Finally, we improved the loss function and redefined the penalty metric. The experimental results showed that the improvements we performed were useful in crack feature extraction, as well as crack detection.
We have conducted extensive ablation experiments, as well as comparison experiments. Through the ablation experiments, we verified that Transformer combined with YOLO was effective as a crack feature extraction network, and verified that each improved module responds positively in crack detection. Comparative experiments verified that our proposed detection model had some advantages over the current one-stage detection algorithms.
Finally, we deployed the built crack detection algorithm on an edge computing device for testing. The test results showed that our proposed automatic crack detection model prevailed over other baselines in the aspect of detection performance and worked well on edge devices, satisfying the need for real-time crack detection.
Author Contributions
In this study, X.Z. built the object detection network model, completed the experiments and wrote the article. S.W. recorded the experimental data. Y.H. completed the search of the dataset. S.Z. finished revising the grammar of the article. S.Q. provided various guidance. All authors have read and agreed to the published version of the manuscript.
Funding
We gratefully acknowledge the financial support from the Guizhou optoelectronic information and intelligent application International Joint Research Center (qiankehe platform talents no. 5802[2019]).
Institutional Review Board Statement
Not applicable.
Informed Consent Statement
Not applicable.
Data Availability Statement
In this study, we used existing datasets, so no new experimental data were proposed.
Acknowledgments
We thank the Supercomputing Center of the State Key Laboratory of Public Big Data of Guizhou University for providing the experimental platform for this research, along with Jian Zhang for providing data support for this experiment.
Conflicts of Interest
The authors declare no conflict of interest.
References
- Mohan, A.; Poobal, S. Crack detection using image processing: A critical review and analysis. Alex. Eng. J. 2018, 57, 787–798. [Google Scholar] [CrossRef]
- Zaloshnja, E.; Miller, T.R. Cost of crashes related to road conditions, United States, 2006. In Proceedings of the Annals of Advances in Automotive Medicine/Annual Scientific Conference, Baltimore, Maryland, 5–7 October 2009; Association for the Advancement of Automotive Medicine: Chicago, IL, USA, 2009. [Google Scholar]
- Zhu, Z.; German, S.; Brilakis, I. Visual retrieval of concrete crack properties for automated post-earthquake structural safety evaluation. Autom. Constr. 2011, 20, 874–883. [Google Scholar] [CrossRef]
- Gkantou, M.; Muradov, M.; Kamaris, G.S.; Hashim, K.; Atherton, W.; Kot, P. Novel Electromagnetic Sensors Embedded in Reinforced Concrete Beams for Crack Detection. Sensors 2019, 19, 5175. [Google Scholar] [CrossRef] [Green Version]
- Koshti, A.M. X-ray ray tracing simulation and flaw parameters for crack detection. In Health Monitoring of Structural and Biological Systems XII; SPIE: Denver, CO, USA, 2018. [Google Scholar]
- Hosseini, Z.; Momayez, M.; Hassani, F.; Lévesque, D. Detection of inclined cracks inside concrete structures by ultrasonic SAFT. In AIP Conference Proceedings; American Institute of Physics: College Park, MD, USA, 2008. [Google Scholar]
- Rodríguez-Martin, M.; Lagüela, S.; González-Aguilera, D.; Arias, P. Cooling analysis of welded materials for crack detection using infrared thermography. Infra-Red Phys. Technol. 2014, 67, 547–554. [Google Scholar] [CrossRef]
- Mahler, D.S.; Kharoufa, Z.B.; Wong, E.K.; Shaw, L.G. Pavement distress analysis using image processing techniques. Comput. Aided Civ. Infrastruct. Eng. 1991, 6, 1–14. [Google Scholar] [CrossRef]
- Oliveira, H.; Correia, P.L. Automatic road crack segmentation using entropy and image dynamic thresholding. In Proceedings of the 17th European Signal Processing Conference, Scotland, UK, 24–28 August 2009. [Google Scholar]
- Huang, Y.; Xu, B. Automatic inspection of pavement cracking distress. J. Electron. Imaging 2006, 15, 013017. [Google Scholar] [CrossRef]
- Otsu, N. A Threshold Selection Method from Gray-Level Histograms. IEEE Trans. Syst. Man Cybern. 1979, 9, 62–66. [Google Scholar] [CrossRef] [Green Version]
- Huang, T.; Yang, G.; Tang, G. A fast two-dimensional median filtering algorithm. IEEE Trans. Acoust. Speech Signal Process. 1979, 27, 13–18. [Google Scholar] [CrossRef] [Green Version]
- Pizer, S.M.; Amburn, E.P.; Austin, J.D.; Cromartie, R.; Geselowitz, A.; Greer, T.; Romeny, B.T.H.; Zimmerman, J.B.; Zuiderveld, K. Adaptive histogram equalization and its variations. Comput. Vis. Graph. Image Process. 1987, 39, 355–368. [Google Scholar] [CrossRef]
- Zalama, E.; Gómez-García-Bermejo, J.; Medina, R.; Llamas, J. Road crack detection using visual features extracted by Gabor filters. Comput. Aided Civ. Infra-Struct. Eng. 2014, 29, 342–358. [Google Scholar] [CrossRef]
- Wang, C.; Wang, X.; Zhou, X.; Li, Z. The Aircraft Skin Crack Inspection Based on Different-Source Sensors and Support Vector Machines. J. Nondestruct. Eval. 2016, 35, 46. [Google Scholar] [CrossRef]
- Shi, Y.; Cui, L.; Qi, Z.; Meng, F.; Chen, Z. Automatic Road Crack Detection Using Random Structured Forests. IEEE Trans. Intell. Transp. Syst. 2016, 17, 3434–3445. [Google Scholar] [CrossRef]
- Chen, C.; Seo, H.; Jun, C.H.; Zhao, Y. Pavement crack detection and classification based on fusion feature of LBP and PCA with SVM. Int. J. Pavement Eng. 2022, 23, 3274–3283. [Google Scholar] [CrossRef]
- Chen, C.; Seo, H.S.; Zhao, Y.; Chen, B.; Kim, J.W.; Choi, Y.; Bang, M. Automatic pavement crack detection based on image recognition. In Proceedings of the International Conference on Smart Infrastructure and Construction 2019 (ICSIC) Driving Data-Informed Decision Making, Cambridge, UK, 8–10 July 2019. [Google Scholar]
- Yang, X.; Li, H.; Yu, Y.; Luo, X.; Huang, T.; Yang, X. Automatic pixel-level crack detection and measurement using the fully convolutional network. Comput. Aided Civ. Infrastruct. Eng. 2018, 33, 1090–1109. [Google Scholar] [CrossRef]
- Song, W.; Jia, G.; Jia, D.; Zhu, H. Automatic pavement crack detection and classification using multiscale feature attention network. IEEE Access 2019, 7, 171001–171012. [Google Scholar] [CrossRef]
- Prasanna, P.; Dana, K.J.; Gucunski, N.; Basily, B.B.; La, H.M.; Lim, R.S.; Parvardeh, H. Automated Crack Detection on Concrete Bridges. IEEE Trans. Autom. Sci. Eng. 2016, 13, 591–599. [Google Scholar] [CrossRef]
- Fujita, Y.; Mitani, Y.; Hamamoto, Y. A method for crack detection on a concrete structure. In Proceedings of the 18th International Conference on Pattern Recognition (ICPR’06), Hong Kong, China, 20–24 August 2006. [Google Scholar]
- Chen, C.; Zeng, Y.; Li, H.; Liu, Y.; Wan, S. A multi-hop task offloading decision model in MEC-enabled internet of vehicles. IEEE Internet Things J. 2022, 10, 3215–3230. [Google Scholar] [CrossRef]
- Fan, Z.; Wu, Y.; Lu, J.; Li, W. Automatic Pavement Crack Detection Based on Structured Prediction with the Convolutional Neural Network. arXiv 2018, arXiv:1802.02208. [Google Scholar]
- Dung, C.V.; Anh, L.D. Autonomous concrete crack detection using deep fully convolutional neural network. Autom. Constr. 2019, 99, 52–58. [Google Scholar] [CrossRef]
- Liu, Z.; Cao, Y.; Wang, Y.; Wang, W. Computer vision-based concrete crack detection using U-net fully convolutional networks. Autom. Constr. 2019, 104, 129–139. [Google Scholar] [CrossRef]
- Liu, J.; Yang, X.; Lau, S.; Wang, X.; Luo, S.; Lee, V.C.S.; Ding, L. Automated pavement crack detection and segmentation based on two-step convolutional neural network. Comput. Aided Civ. Infrastruct. Eng. 2020, 35, 1291–1305. [Google Scholar] [CrossRef]
- Feng, H.; Xu, G.; Guo, Y. Multi-scale classification network for road crack detection. IET Intell. Transp. Syst. 2019, 13, 398–405. [Google Scholar] [CrossRef]
- Hacıefendioğlu, K.; Başağa, H.B. Concrete road crack detection using deep learning-based faster R-CNN method. Iran. J. Sci. Technol. Trans. Civ. Eng. 2022, 46, 1621–1633. [Google Scholar] [CrossRef]
- Zhang, J.; Jing, J.; Lu, P.; Song, S. Improved MobileNetV2-SSDLite for automatic fabric defect detection system based on cloud-edge computing. Measurement 2022, 201, 111665. [Google Scholar] [CrossRef]
- Zhang, J.; Jing, J.; Lu, P.; Song, S. Concrete crack segmentation based on UAV-enabled edge computing. Neurocomputing 2022, 485, 233–241. [Google Scholar]
- Tang, W.; Yang, Q.; Hu, X.; Yan, W. Deep learning-based linear defects detection system for large-scale photovoltaic plants based on an edge-cloud computing infrastructure. Sol. Energy 2022, 231, 527–535. [Google Scholar] [CrossRef]
- Wu, Y.; Guo, H.; Chakraborty, C.; Khosravi, M.; Berretti, S.; Wan, S. Edge Computing Driven Low-Light Image Dynamic Enhancement for Object Detection. IEEE Trans. Netw. Sci. Eng. 2022. [Google Scholar] [CrossRef]
- Zhu, T.; Kuang, L.; Daniels, J.; Herrero, P.; Li, K.; Georgiou, P. IoMT-Enabled Real-time Blood Glucose Prediction with Deep Learning and Edge Computing. IEEE Internet Things J. 2022, 10, 3706–3719. [Google Scholar] [CrossRef]
- Zhang, J.; Qian, S.; Tan, C. Automated bridge surface crack detection and segmentation using computer vision-based deep learning model. Eng. Appl. Artif. Intell. 2022, 115, 105225. [Google Scholar] [CrossRef]
- Tzutalin, D. LabelImg. GitHub Repository. June 2015. Available online: https://pypi.org/project/labelImg/ (accessed on 4 July 2023).
- Trinh, H.-C.; Le, D.-H.; Kwon, Y.-K. PANET: A GPU-based tool for fast parallel analysis of robustness dynamics and feed-forward/feedback loop structures in large-scale biological networks. PLoS ONE 2014, 9, e103010. [Google Scholar] [CrossRef] [Green Version]
- Xu, R.; Ma, S.; Wang, Y.; Guo, Y. Heterogeneous Systolic Array Architecture for Compact CNNs Hardware Accelerators. IEEE Trans. Parallel Distrib. Syst. 2022, 33, 2860–2871. [Google Scholar]
- Srinivas, A.; Lin, T.Y.; Parmar, N.; Shlens, J.; Abbeel, P.; Vaswani, A. Bottleneck transformers for visual recognition. In Proceedings of the IEEE/CVF Conference on Computer Vision and Pattern Recognition, Nashville, TN, USA, 20–25 June 2021. [Google Scholar]
- Yang, L.; Zhang, R.Y.; Li, L.; Xie, X. Simam: A simple, parameter-free attention module for convolutional neural networks. In Proceedings of the International Conference on Machine Learning, Virtual Event, 18–24 July 2021. [Google Scholar]
- Gevorgyan, Z. SIoU loss: More powerful learning for bounding box regression. arXiv 2022, arXiv:2205.12740. [Google Scholar]
- Deng, L.; Li, G.; Han, S.; Shi, L.; Xie, Y. Model compression and hardware acceleration for neural networks: A comprehensive survey. Proc. IEEE 2020, 108, 485–532. [Google Scholar] [CrossRef]
- Bottou, L. Stochastic gradient descent tricks. In Neural Networks: Tricks of the Trade, 2nd ed.; Springer: Berlin/Heidelberg, Germany, 2012; pp. 421–436. [Google Scholar]
| Disclaimer/Publisher’s Note: The statements, opinions and data contained in all publications are solely those of the individual author(s) and contributor(s) and not of MDPI and/or the editor(s). MDPI and/or the editor(s) disclaim responsibility for any injury to people or property resulting from any ideas, methods, instructions or products referred to in the content. |
© 2023 by the authors. Licensee MDPI, Basel, Switzerland. This article is an open access article distributed under the terms and conditions of the Creative Commons Attribution (CC BY) license (https://creativecommons.org/licenses/by/4.0/).


