

A Computational (DFT) Study on the Anti-Malarial Drug: Lumefantrine
Mustafakemalpasa Vocational College, Bursa Uludag University, Mustafakemalpasa, 16500 Bursa, Turkey
Appl. Sci. 2023, 13(16), 9219; https://doi.org/10.3390/app13169219
Submission received: 9 June 2023
/
Revised: 21 July 2023
/
Accepted: 10 August 2023
/
Published: 14 August 2023
(This article belongs to the Section Chemical and Molecular Sciences)
Abstract
:This study aims to investigate the spectroscopic and structural properties of the compound Lumefantrine, which is important in pharmacology because of its anti-malarial effect. The structural and spectroscopic properties of this molecule, such as bond lengths, bond angles, FT-IR and NMR spectra were handled computationally using a computational chemistry suite: Spar-tan’14. Both HF and DFT methods were used with different basis sets for the calculations. The results calculated by the software were compared to experimental results from the literature. Both computational and experimental results were exhibited as tables. Some calculated results, such as HOMO-LUMO boundary orbitals and electrostatic potential map, were also given as graphics and pictures.

1. Introduction
Malaria is a parasitic disease in humans that causes thousands of deaths every year [1]. According to World Malaria Report 2020 by WHO, 409,000 people die because of this disease every year. As a promising development from the same report, the malaria deaths reduced from 736,000 to 409,000 between the years 2000 and 2019. The report also underlines that globally an estimated 1.5 billion malaria cases and 7.6 million malarian deaths have been prevented in the same period [2].
Lumefantrine is an amino alcohol developed by Chinese scientists at around the same time as mefloquine. It has been the mainstay of the most widely used combination therapy with artemether. So far a significant resistance has not been seen because Lu-mefantrine has never been used as monotherapy [3]. Lumefantrine has been used with artemether since 1994. Bombarded by two different drugs with different destructive mechanisms, the parasite cannot develop a resistance against both [4].
Artemether, a potent anti-malarial drug derived from the sweet wormwood plant (Artemisia annua), has become a pivotal tool in combating malaria, particularly infections caused by drug-resistant Plasmodium falciparum parasites. With over 200 million malaria cases reported annually, the disease continues to pose a significant global health threat, particularly in sub-Saharan Africa.
As a member of the artemisinin class of drugs, artemether’s rapid action and ability to target both the blood-stage and drug-resistant forms of the malaria parasite make it highly effective. Its combination with other anti-malarial drugs in artemisinin-based combination therapies (ACTs) has revolutionized malaria treatment, reducing mortality and morbidity. The emergence of artemisinin resistance in certain regions demands continuous monitoring and research to preserve its efficacy and ensure effective malaria control strategies worldwide. This article aims to provide a comprehensive review of artemether’s pharmacology, efficacy, safety and its role in malaria control efforts, shedding light on the current state of this critical anti-malarial agent [5,6].
4-Aminoquinoline is a quinoline derivative with an amino group at the 4-position of the quinoline ring. It is a key building block in medicinal chemistry and has been extensively studied for its diverse pharmacological properties. Notably, it has been vital in anti-malarial research, with derivatives like chloroquine used to treat malaria by disrupting the heme detoxification process in the malaria parasite. Beyond anti-malarial effects, 4-aminoquinoline shows promise as an antimicrobial agent against various pathogens and has been explored for potential use in anti-cancer and anti-inflammatory treatments. Its versatility makes it a valuable template for designing novel pharmaceutical agents, making it a subject of great interest in contemporary drug development [7,8,9].
The physicochemical properties of the three most well-known anti-malarial compounds are briefly presented in Table 1 [10,11,12,13,14].
This study has been inspired by a former study by Friedrich Research group. In their study, which has been published in an elite scientific journal, they investigated the structural and spectral properties of Lumefantrine [1].
Computational chemistry has become an invaluable tool for predicting the structural and spectral properties of small molecules, transforming various scientific fields. Its applications in chemistry, biochemistry, drug discovery and materials science have been particularly noteworthy. While experimental techniques remain essential, computational methods offer cost-effective and efficient means to gain critical insights into molecular behavior [7].
Through accurate predictions of molecular structures and spectroscopic properties, computational chemistry plays a pivotal role in understanding the conformation and interactions of small molecules. High-throughput screening capabilities aid in identifying potential candidates for drug development and materials design. Furthermore, the synergy between computational predictions and experimental data enhances scientific understanding and fosters interdisciplinary research, contributing to a more comprehensive exploration of the molecular world. This manuscript provides an extensive review of computational chemistry’s significance and recent advancements in the prediction of small molecules’ properties, shaping the future of scientific inquiry and innovation [8,9].
SPARTAN’XX is a package of computational chemistry that was published by Wavefunction INC. [10,13]. Some researchers have used this software for investigating different kinds of organic molecules, such as pyrazoles [14], boronic acid derivatives [15], semicarbazides [16], dimethoxycoumarin [17], triphenylphosphorusanilideneacetaldehyde [18] and ethoxycoumarin [19]. The package has improved itself on predicting structural and spectral properties very near experimental results.
2. Materials and Methods
Computational Details
For computational analysis of the molecule, two main methods were used with two basis sets for each, in the SPARTAN-14 quantum chemistry suit. HF method was used with 3-21G and 6-31G* basis sets while DFT was used with EDF2 and B3LYP in 6-31G* [20,21], and the obtained results have been tabulated and discussed under corresponding divisions.
The 6-31G* basis set is a commonly used basis set in computational chemistry that provides a balance between accuracy and computational efficiency. While the superiority of a basis set can vary depending on the specific application, here are some general advantages of the 6-31G* basis set compared to other basis sets:
- Efficiency: The 6-31G* basis set is relatively compact compared to larger basis sets such as 6-311++G** or aug-cc-pVTZ. This compactness makes calculations using the 6-31G* basis set computationally more efficient, requiring less memory and shorter computation times. It is often a good choice for preliminary calculations or screening large systems.
- Cost-effectiveness: The computational cost of calculations with the 6-31G* basis set is typically lower compared to higher-level basis sets. This makes it a cost-effective choice for routine calculations or when dealing with large-scale simulations where computational resources may be limited.
- Accuracy for organic molecules: The 6-31G* basis set has been specifically optimized for accurate calculations of organic molecules. It includes polarization functions, which allow for a better description of electron correlation effects and improved accuracy for properties, such as molecular geometries, bond lengths and vibrational frequencies.
- Transferability: The 6-31G* basis set has been extensively tested and widely used for a variety of organic systems. Its parameters have been carefully optimized to reproduce experimental data for a broad range of molecules. As a result, it can be considered a reasonably transferable basis set that provides reliable results for many chemical systems.
- Compatibility: The 6-31G* basis set is available in many popular quantum chemistry software packages, making it easily accessible for researchers. Its widespread use ensures compatibility with a range of computational tools and facilitates comparison and reproduction of results across different studies.
The inclusion of HF 3-21G, HF 6-31G*, DFT/EDF2 6-31G* and DFT/B3LYP 6-31G* basis sets in the same study was a deliberate choice to conduct a comparative investigation. This approach enables a comprehensive analysis of the system by exploring the trade-offs between computational efficiency and accuracy and by evaluating the performance of different methods. The use of multiple basis sets facilitates a more robust and nuanced understanding of the system’s properties, thereby enhancing the scientific rigor of the study [22].
Calculated spectral graphics and MO surfaces have been depicted in corresponding figures. For vibrational analysis, the calculated results that were produced by the software have been corrected by a scaling factor of 0.962. The scaling factor, also known as the frequency scaling or wavenumber scaling factor, is applied to adjust the calculated wavenumbers/frequencies obtained from the FT-IR calculations using a specific basis set and method. This scaling factor is commonly used to bring the calculated values into closer agreement with experimental results.
In this study, a scaling factor of 0.962 was employed to correct the calculated FT-IR wavenumbers. The use of a scaling factor is necessary due to various factors that can affect the accuracy of calculated vibrational frequencies. These factors include approximations made in the chosen computational method, the treatment of electron correlation and limitations in the employed basis set. By applying a scaling factor, the calculated wavenumbers are adjusted to align more closely with experimental values, improving the overall agreement between theory and experiment.
It is important to note that the specific choice of the scaling factor, such as 0.962 in this case, is not universally standardized but rather selected based on empirical observations and comparisons with experimental data. Different scaling factors may be used in different studies or for different basis sets and methods, depending on the specific system under investigation and the desired level of accuracy [23,24].
In summary, the application of a scaling factor, such as the value of 0.962 used in this study, is a common practice in FT-IR calculations. It allows for the adjustment of calculated wavenumbers to better match experimental results, thereby improving the agreement between theory and experiment. The specific value chosen for the scaling factor is determined based on empirical considerations and may vary depending on the basis set, method and system being studied [25,26].
In the last decade, the DFT method has been given increasing importance among computational chemists. Many researchers investigating especially d-block metal complexes prefer to use this method with or instead of HF. Some small molecules, such as boronic acid derivatives or benzoic acid derivatives, have been investigated using both DFT and HF. The results of the DFT method were found to be more consistent with the experimental results compared to the HF method in most of the studies [27]. The DFT method has also been used in some studies to investigate other types of small molecules, such as pyrazole derivatives, and promising results have been obtained [28].
3. Results and Discussion
3.1. Structure of the Compound
The structure of any compound is determined by its bond lengths, bond angles and dihedral angles. For this reason, in this study, the structural properties were calculated and tabulated in the following pages. In addition, the potential energy, which shows the stability of the molecule, has been calculated and tabulated for the molecule.
While there is no experimental data on the molecular structure, how can we trust these computational values? We can apply the spectroscopic data for the correlation between the experimental and calculated data. This correlation can be used for the prediction of the molecular structures, too. Since the number of atoms of the molecule is very large, the bonds and angles are also numerous. The tables showing the bond lengths and angles are also quite large. For this reason, to keep the study short, these tables were included in the Figure 1.
3.2. Electronic and Spectral Properties
Electronic transitions and spectral properties were calculated in each method. HOMO and LUMO molecular orbital surfaces were calculated and depicted. Their energy values were also tabulated and compared to each other. An ESPMap (Electrostatic potential Map) is calculated and presented as figures (Figure 2).
An ESPMAP (Electrostatic Potential Map) is a visualization tool used to represent the electrostatic potential of a molecule. It provides valuable information about the distribution of positive and negative charges within the molecule, which can be helpful in understanding various aspects of its chemical properties. Here are some reasons why an ESPMAP is important:
- Molecular reactivity: The electrostatic potential is closely related to the reactivity of a molecule. It can provide insights into regions of high electron density (negative potential) that are likely to be involved in nucleophilic reactions, as well as regions of low electron density (positive potential) that are susceptible to electrophilic attacks. By examining the ESPMAP, chemists can predict sites of potential chemical reactions and understand the reactivity patterns of the molecule.
- Intermolecular interactions: The electrostatic potential plays a crucial role in intermolecular interactions, such as hydrogen bonding, van der Waals forces and solvation effects. An ESPMAP can help identify regions of positive or negative potential that are involved in these interactions. For example, the negative potential regions can indicate favorable sites for hydrogen bonding while positive potential regions can attract negatively charged species or induce dipole-dipole interactions.
- Molecular recognition: An ESPMAP is particularly useful in studying molecular recognition, such as ligand-protein interactions in drug design. By comparing the electrostatic potentials of a ligand and its target protein, researchers can identify complementary regions of positive and negative potentials that facilitate binding. Understanding the electrostatic complementarity between molecules aids in rational drug design and the development of more potent and selective compounds.
- Solvent effects: Solvent molecules can influence the electrostatic potential of a molecule, leading to changes in its properties and reactivity. An ESPMAP can help visualize how solvent molecules affect the distribution of charges and identify regions where solvation effects are significant. This knowledge is crucial in understanding the behavior of molecules in solution and predicting their behavior under different solvent conditions.
- Molecular properties: The electrostatic potential is closely related to various molecular properties, including molecular electrostatic potential (MEP), molecular dipole moment and polarizability. An ESPMAP can provide insights into these properties, allowing researchers to analyze and compare different molecular features.
Overall, an ESPMAP is an important tool for understanding the electronic structure, reactivity and interactions of molecules. It helps chemists and researchers gain a visual understanding of the charge distribution within a molecule, enabling them to make informed predictions and design experiments or simulations for a wide range of chemical applications [29].
Lumefantrine has 30 C atoms, 32 H atoms, 3 Cl, 1 O and 1 N atoms, 67 atoms in total. So it is better to handle the molecule in two graphics for Mulliken charge distribution. The first graphic shows the charge distribution of H atoms, and the second one depicts C and heteroatoms.
Like every molecule, atoms of Lumefantrine have different electronegativities, so the electron distribution on the molecule is heterogeneous. More electronegative atoms attract and gather up more electrons than the electropositive ones. So electronic density around these atoms rises, and these parts of the molecule gain a partially negative charge. This heterogeneity causes atoms to have different partial charges on the molecule. The more electron-rich a particular part of a molecule is, the more susceptible it is to electrophilic attacks, and of course, the reverse is also true. The more electron-poor it is, the more susceptible it will be to nucleophilic attacks. For this reason, the Mulliken charge distribution is important data for predicting the possible reaction mechanisms in which the molecule participates [30] The ESPMap surface determines the distance at which a given positive charge can interact with the molecule enough that it can produce an attraction or repulsion so that they can have a bonding probability. Molecular ESP (Vr) is calculated by Equation (1) [31].
The Mulliken charges of Lumefantrine are exhibited in Figure 3 and Table 1. These results are also given in Figure 2 as a color graphic. At a glance, the most important points are briefly:
1—All H atoms have positive charges. At first sight, H12 has a dramatically huge charge almost two times bigger than most of the others. H12 also draws attention to the fact that while the HF321 method calculates the highest value for all H atoms, it takes the highest value from the HF 631G* method.
2—C atoms of the molecule are generally negatively charged, except for C21, which carries the only –OH group of the molecule, and C9, which is neighbor to the olefinic bridge.
3—For most carbon atoms all methods agree with slightly different positive charges, but for C1, C5, C6, C7, C8 and C11 the first two methods predict small negative charges.
4—The O atom of the –OH group has the highest negative charge as expected because of its electronegativity.
5—The only N atom of the molecule has the second highest negative charge depending on its electronegativity. In addition, this part represents one of the most vulnerable parts of the molecule to electrophilic attacks and forms a basic site on the molecule.
3.3. Molecular Orbitals Surfaces (HOMO-LUMO) Analysis and UV-Vis Spectra
Highest Occupied Molecular Orbital (HOMO) represents the highest energy level in which at least one electron exists around the molecule. Lowest Unoccupied Molecular Orbital (LUMO) gives the lowest energy level around the molecule in which there is no electron. The gap between these two values is very significant in the biological and chemical reactivities of the molecules. The molecules with small energy gaps are accepted as soft molecules and expected to involve in chemical reactions easily. These energy levels also determine the acidity and basicity of the molecules.
In Lumefantrine, the energy gap between HOMO-LUMO was calculated to be 9.9 eV, 9.6 eV, 3.5 eV and 3.7 eV, according to the methods, respectively. As can be seen easily, DFT methods give dramatically smaller values than the HF calculations (Table 2 and Table 3). According to these values, Lumefantrine can be supposed to be a semi-rigid molecule (Figure 4). The larger HOMO-LUMO gap gives the molecule greater kinetic stability and lower chemical reactivity. The molecule’s hardness can be predicted via Equation (2), and softness (S) can be derived from hardness via Equation (3).
η = (εLUMO − εHOMO)
S = 1/η
As can be easily guessed, molecules with large energy gaps, defined as hard mole-cules, do not change their electron density very easily. On the other hand, molecules with small energy gaps, called soft molecules, change their electron densities relatively easily [31,32]. The calculated λmax can be calculated from the differences between MO energies as seen in Table 4. Calculated UV-Vis spectra can be seen in Figure 5.
3.4. FT-IR Vibrational Analysis
The molecule of Lumefantrine has 67 atoms and that means 195 vibrational modes. These 195 modes can be handled in three parts. The groups in which the aromatic rings are located are the calm parts that make slow movements and oscillations without disturbing their planarity as can be expected. And again, as can be easily predicted, the most mobile and agile part of the molecule is the aliphatic part, which consists of two branches. This second part, which consists of C21 and beyond, with O and N atoms, exhibits every kind of mechanical motion, such as swinging, rocking, etc.
As a brief analysis, the frequencies have been tabulated in Table 5 and depicted in Figure 6. In the table, the calculated values according to four methods were involved comparatively. Although there are no experimental data for FTIR, the computational values available can be considered significant due to the compatibility between the experimental and computational NMR data, which will be seen in the following sections. Even so, some important points should be underlined [33,34].
1—The peak, which refers –O–H group’s stretching, appears in 3629 cm−1, 3884 cm−1, 3393 cm−1 and 3124 cm−1 (mode 195), according to method, respectively [35].
2—The peak in mode 171 (3088 cm−1, 3083 cm−1, 2929 cm−1 and 2926 cm−1) refers to the C-H stretching motions, which belong to the aliphatic branches.
3—Two kinds of aromatic groups of which stretchings are seen as mode 150 (1607 cm−1, 1582 cm−1, 1470 cm−1 and 1474 cm−1) for the single ring and mode 138 (1494 cm−1, 1507 cm−1, 1396 cm−1 and 1392 cm−1).
4—The stretching of the olefinic group (C9=C10) appears as the peak mode 163 (1801 cm−1, 1806 cm−1, 1631 cm−1 and 1622 cm−1).
3.5. NMR Analysis
The experimental values from the literature [1] and the calculated ones in this study are in great agreement. This harmony between the data also increases our confidence in the data presented in the previous sections, which have no empirical counterparts. The calculated and experimental data are tabulated in Table 6. The same spectra have been depicted in Figure 7 and Figure 8. Also, COSY, HSQC and HMBC spectra have been presented in Figure 9. The experimental spectra can be seen in the article by Friedrich’s research group [1].
1—H21, H22, H23 and H30, H31, H32, the terminal H atoms, appeared 0.96 ppm in experimental studies. Their calculated values have been found between 0.93 and 1.19. The EDF2 method gave the nearest calculated value to the experimental results.
2—H12 has been found to give a peak near 3 to 4.16 ppm. But its peak is not seen in the experimental spectra, which is typical for O-H groups.
3—H11 which is on the same C21 with the O atom has given a peak of 5.35 ppm in experimental spectra. Its calculated values are predicted 4.85 ppm to 5.24 ppm.
4—C3, C14 and C18 which bear Cl1, Cl2 and Cl3, respectively, were found to give peaks at 136.72 ppm, 137.0 ppm and 134.3 ppm experimentally. Their calculated values were found 124 ppm to 136.72 ppm. As with most C atoms, the nearest calculated results came from DFT methods, especially EDF2.
Figure 10 shows the correlation between average NMR values and the experimental results. As seen The values are in a close agreement.
4. Conclusions
The molecular structure and HOMO-LUMO analysis of Lumefantrine were investigated using the SPARTAN-14 computational package. The calculations were performed at the EDF2 and B3LYP levels employing various basis sets, with comparisons made between the HF and DFT methods. Furthermore, FT-IR spectra was computed and compared against the results obtained from different computational methods. Lumefantrine, a compound of significant pharmacological interest, has been the subject of extensive research by various scientific groups. This study focused on a computational approach to explore the capabilities of the SPARTAN software in comparison to experimental NMR studies.
The calculated values obtained in this study were compared with the experimental data reported in the literature, revealing a remarkable agreement without significant deviations. The results from all the conducted analyses consistently demonstrated that the calculated values closely matched the experimental results. This high degree of agreement and consistency further validates the accuracy and reliability of the computational methods employed in this study.
The successful prediction of molecular properties and spectroscopic features using computational approaches holds immense significance in drug design, material science and various other scientific domains. The close correlation between the calculated and experimental results indicates the effectiveness of the employed computational methods and reinforces their applicability for future investigations.
It is worth noting that computational studies provide invaluable insights into the molecular properties and behavior of compounds, enabling a deeper understanding of their characteristics and facilitating the design of novel materials with tailored properties. The agreement between computational and experimental results in this study underscores the potential of computational methods as reliable tools for characterizing and predicting the behavior of Lumefantrine and other related compounds.
In summary, the present computational study utilizing the SPARTAN-14 package, along with comparisons to experimental data, has demonstrated the ability of the employed computational methods to accurately predict the molecular properties and spectroscopic features of Lumefantrine. The obtained results contribute to the growing body of knowledge regarding the compound’s behavior and provide a foundation for future investigations and applications in the field of pharmaceutical research.
Funding
The software SPARTAN-14 used in this study was bought with the financial support of Pamukkale University Scientific Research Support Unit (Project no: HZL-2014/5).
Institutional Review Board Statement
Not applicable.
Informed Consent Statement
Not applicable.
Data Availability Statement
The data can be requested from the author by e-mail ([email protected]).
Acknowledgments
The software SPARTAN-14 used in this study was bought with the financial support of Pamukkale University Scientific Research Support Unit (Project no: HZL-2014/5).
Conflicts of Interest
The author declares no conflict of interest.
References
- Pansuriya, P.B.; Maguire, G.E.M.; Friedrich, H.B. Structural Characterization and Thermal Properties of the Anti-malarial Drug: Lumefantrine. S. Afr. J. Chem 2019, 72, 253–262. [Google Scholar] [CrossRef] [Green Version]
- World Health Organization (WHO). World Malaria Report; WHO: Geneva, Switzerland, 2020. [Google Scholar]
- Gaur, D.; Chitnis, C.; Chauhan, V. Advances in Malaria Research. In The Wiley-IUBMB Series on Biochemistry and Molecular Biology, 1st ed.; Wiley-Blackwell: Hoboken, NJ, USA, 2016. [Google Scholar] [CrossRef]
- Shah, S. The Fever, How Malaria Has Ruled Humankind for 500,000 Years-Penguin Books; Penguin Random House India: Delhi, India, 2018. [Google Scholar] [CrossRef]
- White, N.J.; van Vugt, M.; Ezzet, F. Clinical pharmacokinetics and pharmacodynamics and pharmacodynamics of artemether-lumefantrine. Clin. Pharmacokinet. 1999, 37, 105–125. [Google Scholar] [CrossRef]
- Available online: https://medlineplus.gov/druginfo/meds/a609024.html (accessed on 8 June 2023).
- Bosaka, A.; Opsenicab, D.M.; Šinkoa, G.; Zlatarb, M.; Kovarika, Z. Structural aspects of 4-aminoquinolines as reversible inhibitors of human acetylcholinesterase and butyrylcholinesterase. Chem. Biol. Interact. 2019, 308, 101–109. [Google Scholar] [CrossRef]
- Al-Ahmary, K.M.; Alenezi, M.S.; Habeeb, M.M. Synthesis, spectroscopic and DFT theoretical studies on the hydrogen bonded charge transfer complex of 4-aminoquinoline with chloranilic acid. J. Mol. Liq. 2016, 220, 166–182. [Google Scholar] [CrossRef]
- Kaschula, C.H.; Egan, T.J.; Hunter, R.; Basilico, N.; Parapini, S.; Taramelli, D.; Pasini, E.; Monti, D. Structure-activity relationships in 4-aminoquinoline antiplasmodials. The role of the group at the 7-position. J. Med. Chem. 2002, 45, 3531–3539. [Google Scholar] [CrossRef]
- Available online: https://pubchem.ncbi.nlm.nih.gov/compound/4-Aminoquinoline (accessed on 8 June 2023).
- Available online: https://pubchem.ncbi.nlm.nih.gov/compound/Artemether (accessed on 8 June 2023).
- Available online: https://pubchem.ncbi.nlm.nih.gov/compound/lumefantrine (accessed on 8 June 2023).
- Lawrenson, A.S.; Cooper, D.L.; O’Neill, P.M.; Berry, N.G. Study of the antimalarial activity of 4-aminoquinoline compounds against chloroquine-sensitive and chloroquine-resistant parasite strains. J. Mol. Model. 2018, 24, 237. [Google Scholar] [CrossRef] [PubMed] [Green Version]
- Kunduracioglu, A. A Novel Pyrazolium Salt with Phthalimide Functional Groups Synthesis Spectroscopic (NMR&FT-IR) and Computational Analysis. Fresenius Environ. Bull. 2021, 30, 7551–7560. [Google Scholar]
- Gerbst, A.G.; Nikolaev, A.V.; Yashunsky, D.V.; Shashkov, A.S.; Dmitrenok, A.S.; Nifantiev, N.E. Theoretical and NMR-based Conformational Analysis of Phos-phodiester-linked Disaccharides. Sci. Rep. 2017, 7, 8934. [Google Scholar] [CrossRef] [PubMed]
- Kumar, G.; Goel, R.; Paul, K.; Luxami, V. Investigation of rotameric conformations of substituted imidazo-[1,2-a]pyrazine: Experimental and theoretical approaches†. RSC Adv. 2018, 8, 9707. [Google Scholar] [CrossRef]
- Zweckstetter, M. NMR: Prediction of molecular alignment from structure using the PALES software. Nat. Protoc. 2008, 3, 679–690. [Google Scholar] [CrossRef] [PubMed]
- Hehre, W.J. SPARTAN’14; Wavefunction, Inc.: Irvine, CA, USA, 2014. [Google Scholar]
- Hehre, W.J. SPARTAN’14: Tutorial and User’s Guide; Wavefunction, Inc.: Irvine, CA, USA, 2014. [Google Scholar]
- Kunduracioglu, A. (4-carbamoylphenyl)boronic Acid: A Dft Study On The Structural and Spectral Properties. Cauc. J. Sci. 2021, 8, 209–223. [Google Scholar] [CrossRef]
- Kunduracioglu, A. 2-thienylboronic Acid: A DFT Study For the Spectral, Structural and Molecular Orbital Analysis. El-Cezerî J. Sci. Eng. 2021, 8, 397–409. [Google Scholar] [CrossRef]
- Dhandapani, A.; Manivarman, S.; Subashchandrabose, S.; Saleem, H. Molecular structure and vibrational analysis on (E)-1-(3-methyl-2,6-diphenyl piperidine-4-ylidene) semicarbazide. J. Mol. Struct. 2014, 1058, 41–50. [Google Scholar] [CrossRef]
- Available online: https://cccbdb.nist.gov/vibscalejust.asp (accessed on 8 June 2023).
- Available online: https://cccbdb.nist.gov/vibnotes.asp (accessed on 8 June 2023).
- Karakaş-Sarıkaya, E.; Dereli, Ö. Study on Molecular Structure and Vibrational Spectra of 5,7-Dimethoxycoumarin Using DFT: A Combined Experimental and Quantum Chemical Approach. Opt. Spectrosc. 2014, 117, 240–249. [Google Scholar] [CrossRef]
- Dereli, Ö.; Erdoğdu, Y.; Güllüoğlu, M.T. Study on molecular structure and vibrational spectra of (triphenylphosphoranylidene) acetaldehyde using DFT: A combined experimental and quantum chemical approach. J. Mol. Struct. 2012, 1012, 105–112. [Google Scholar] [CrossRef]
- Sarıkaya, E.K.; Dereli, Ö.; Erdoğdu, Y.; Güllüoğlu, M.T. Molecular structure and vibrational spectra of 7-Ethoxycoumarin by density functional method. J. Mol. Struct. 2013, 1049, 220–226. [Google Scholar] [CrossRef]
- Becke, A.D. Density-functional thermochemistry. III. The role of exact exchange. J. Chem. Phys. 1993, 98, 5648–5652. [Google Scholar] [CrossRef] [Green Version]
- Lee, C.; Yang, W.; Parr, R.G. Development of the Colle-Salvetti correlation-energy formula into a functional of the electron density. Phys. Rev. B Condens. Matter. 1998, 37, 785–799. [Google Scholar] [CrossRef] [Green Version]
- Tormena, C.F. Conformational analysis of small molecules: NMR and quantum mechanics calculations. Prog. Nucl. Magn. Reson. Spectrosc. 2016, 96, 73–88. [Google Scholar] [CrossRef] [PubMed]
- Mittal, R.; Kumar, A.; Kumar Awasthi, S. Practical scale up synthesis of carboxylic acids and their bioisosteres 5-substituted-1H-tetrazoles catalyzed by a graphene oxide-based solid acid carbocatalyst. RSC Adv. 2021, 11, 11166–11176. [Google Scholar] [CrossRef] [PubMed]
- Kemer-Kotan, G.; Yuksek, H. Experimental (FT-IR, NMR) and Theoretical (B3PW91, B3LYP, HF) Analyses of 2-(3-Ethyl-4,5-Dihydro-1H-1,2,4-Triazole-5-on-4-yl)-azomethine)-Benzoic Acid. Cauc. J. Sci. 2019, 6, 64–75. [Google Scholar]
- Turhan-Irak, Z.; Beytur, M. 4-Benzilidenamino-4,5-dihidro-1H-1,2,4-triazol-5-on Türevlerinin Antioksidan Aktivitelerinin Teorik Olarak İncelenmesi [Theoretical Study on The Investigation of Antioxidant Properties of Some 4-Benzylidenamino-4,5-dihydro-1H-1,2,4-triazol-5-one Derivatives]. Iğdır Üniversitesi Fen Bilim. Enstitüsü Derg. 2019, 9, 512–521. [Google Scholar]
- Kunduracioglu, A. Tautomeric Forms of 2–Amino–5–Bromobenzoic Acid: A DFT Study for Structural and Molecular Orbital Analysis. Open J. Nano (OJN) 2021, 5, 1–17. [Google Scholar]
- Jensen, F. Introduction to Computational Chemistry; Wiley: Chichester, UK, 2016. [Google Scholar]
- Silverstein, R.M.; Webster, F.X.; Kiemle, D.J. Spectrometric Identification of Organic Compounds, 7th ed.; John Wiley Sons Inc.: Hoboken, NJ, USA, 2005. [Google Scholar] [CrossRef]
- Ramachandran, K.I.; Deepa, G.; Namboori, K. Computational Chemistry and Molecular Modeling: Principles and Applications; Springer: Berlin/Heidelberg, Germany, 2008. [Google Scholar] [CrossRef]
Figure 1.
(a) Basic molecular structure and atom numbering of Lumefantrine, (b) molecular formula of artemether and (c) 4-aminoquinoline.
Figure 1.
(a) Basic molecular structure and atom numbering of Lumefantrine, (b) molecular formula of artemether and (c) 4-aminoquinoline.
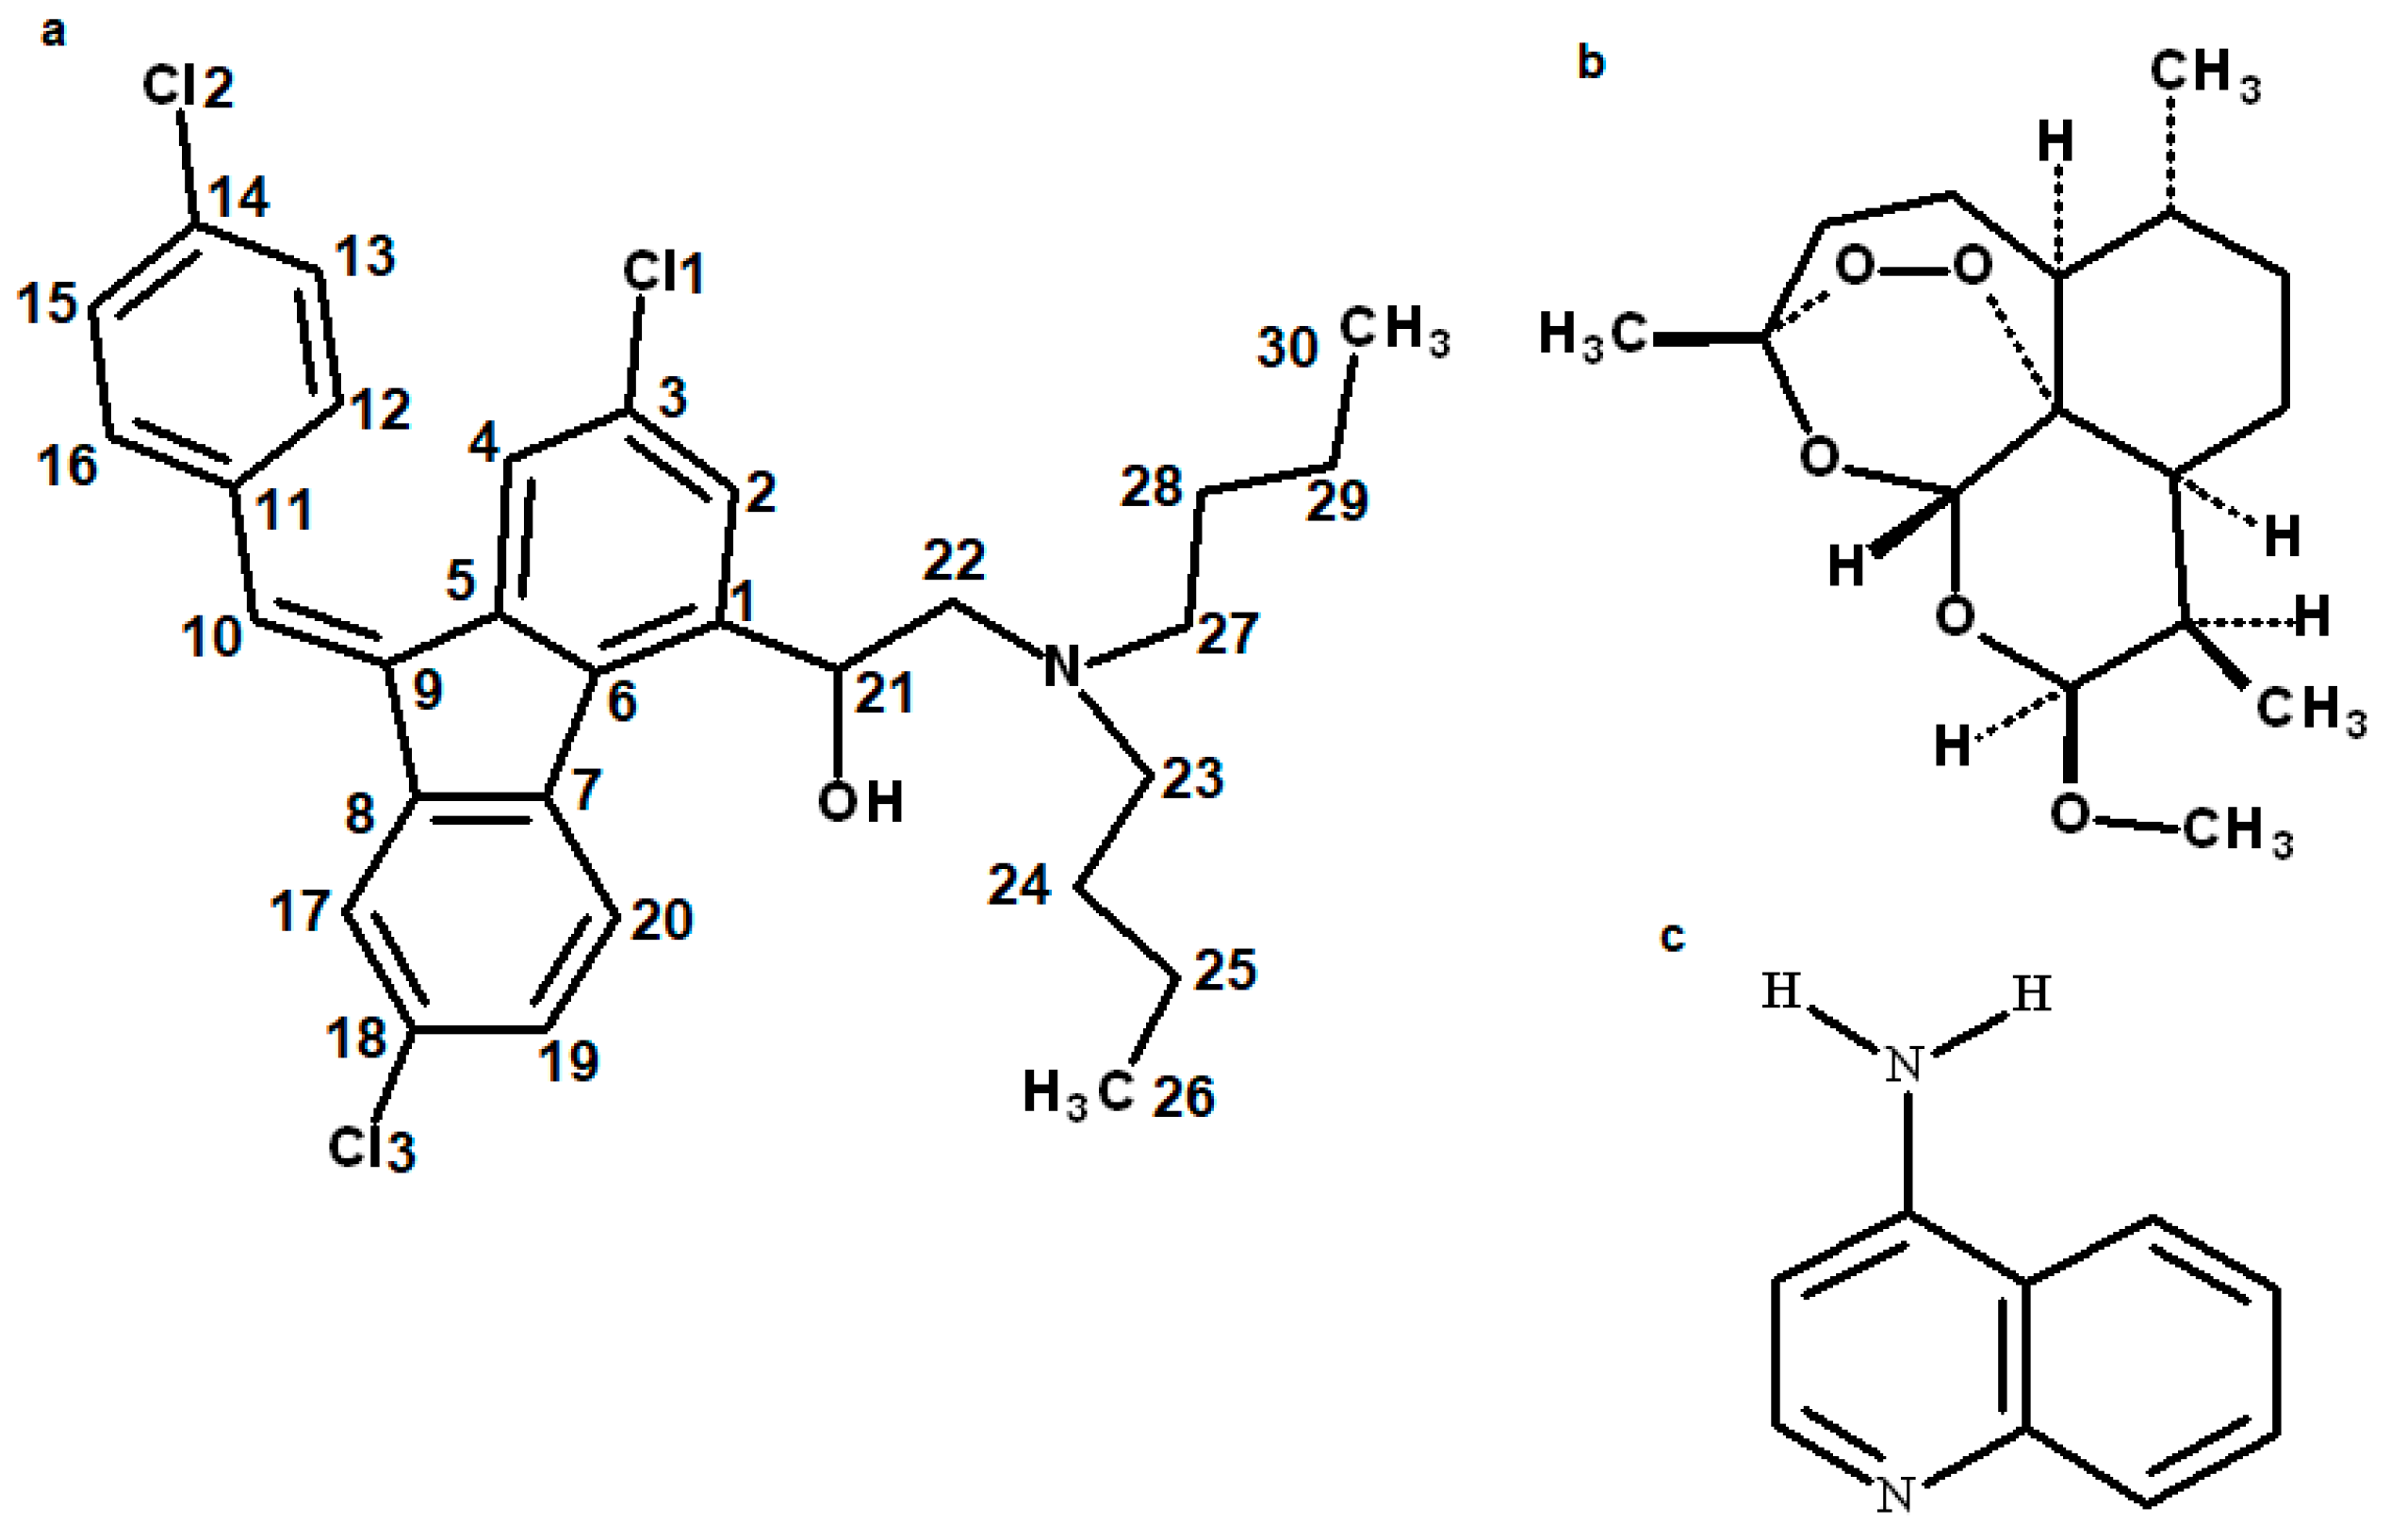
Figure 2.
Calculated ESPMaps for Lumefantrine.
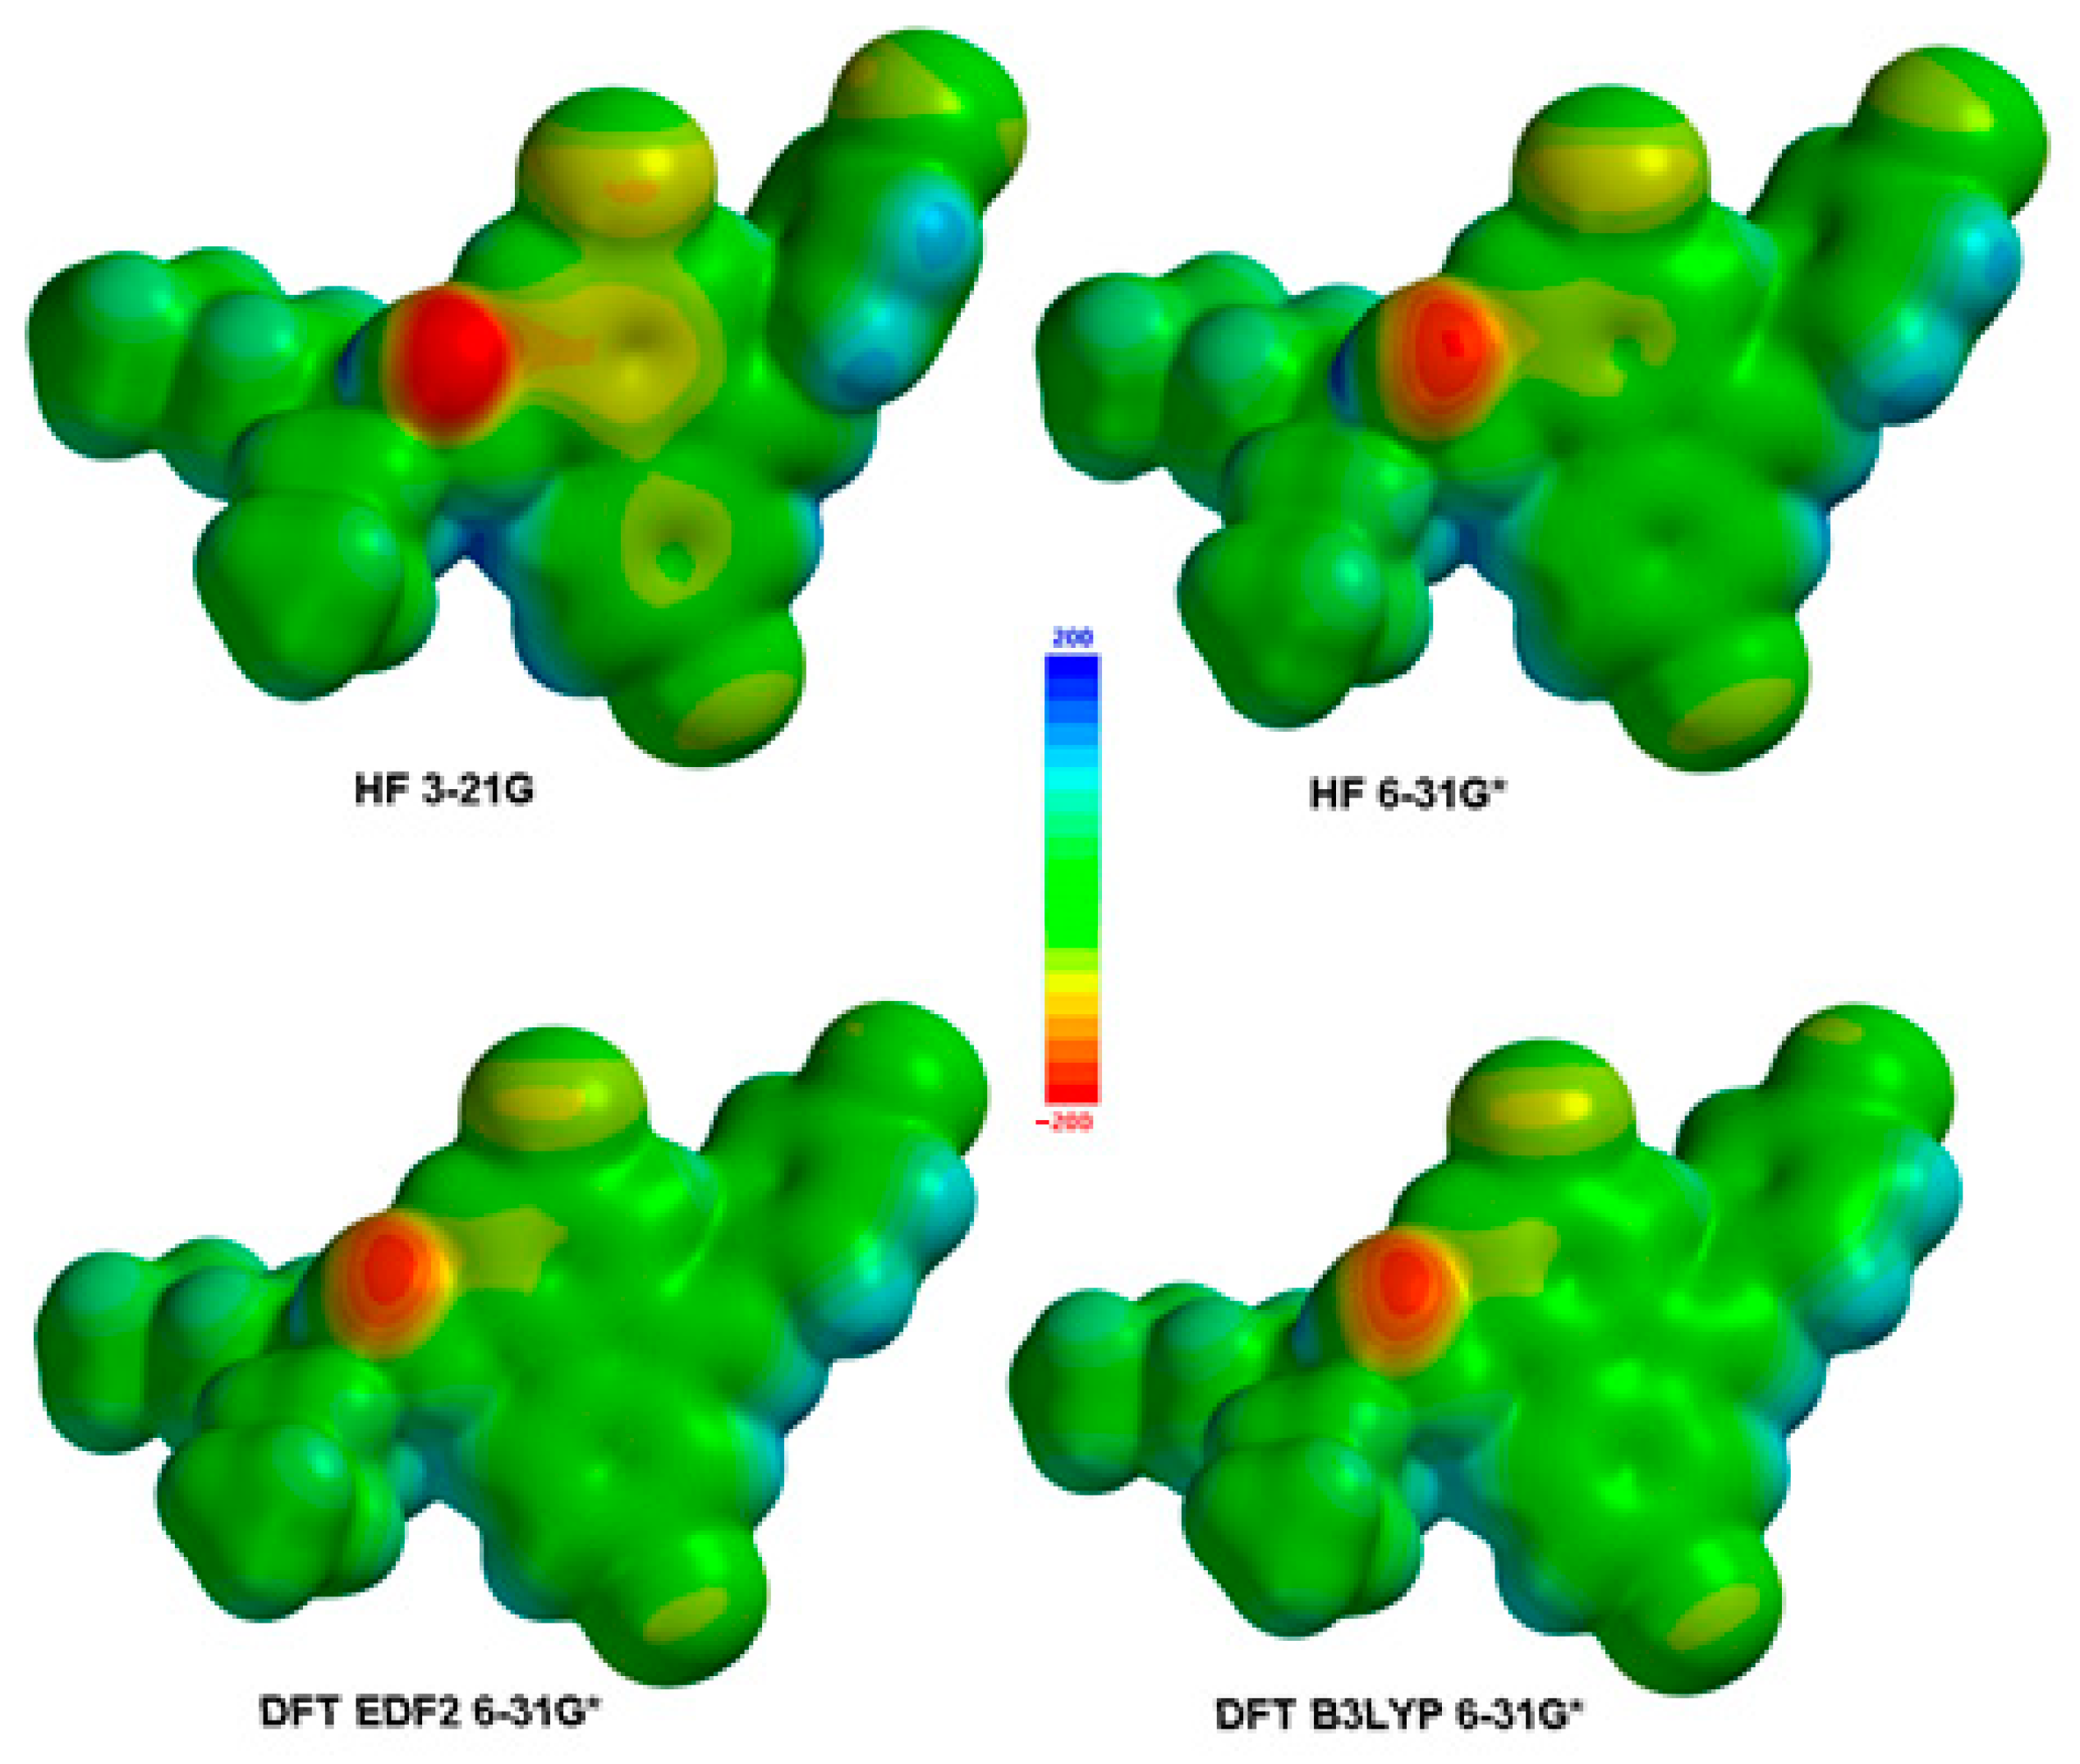
Figure 3.
Mulliken charges of the atoms in the Lumefantrine molecule (a) H atoms, (b) C&heteroatoms.
Figure 3.
Mulliken charges of the atoms in the Lumefantrine molecule (a) H atoms, (b) C&heteroatoms.

Figure 4.
Electron transitions and corresponding E and ΔE values for Lumefantrine.

Figure 5.
Calculated UV-Vis spectra for Lumefantrine.
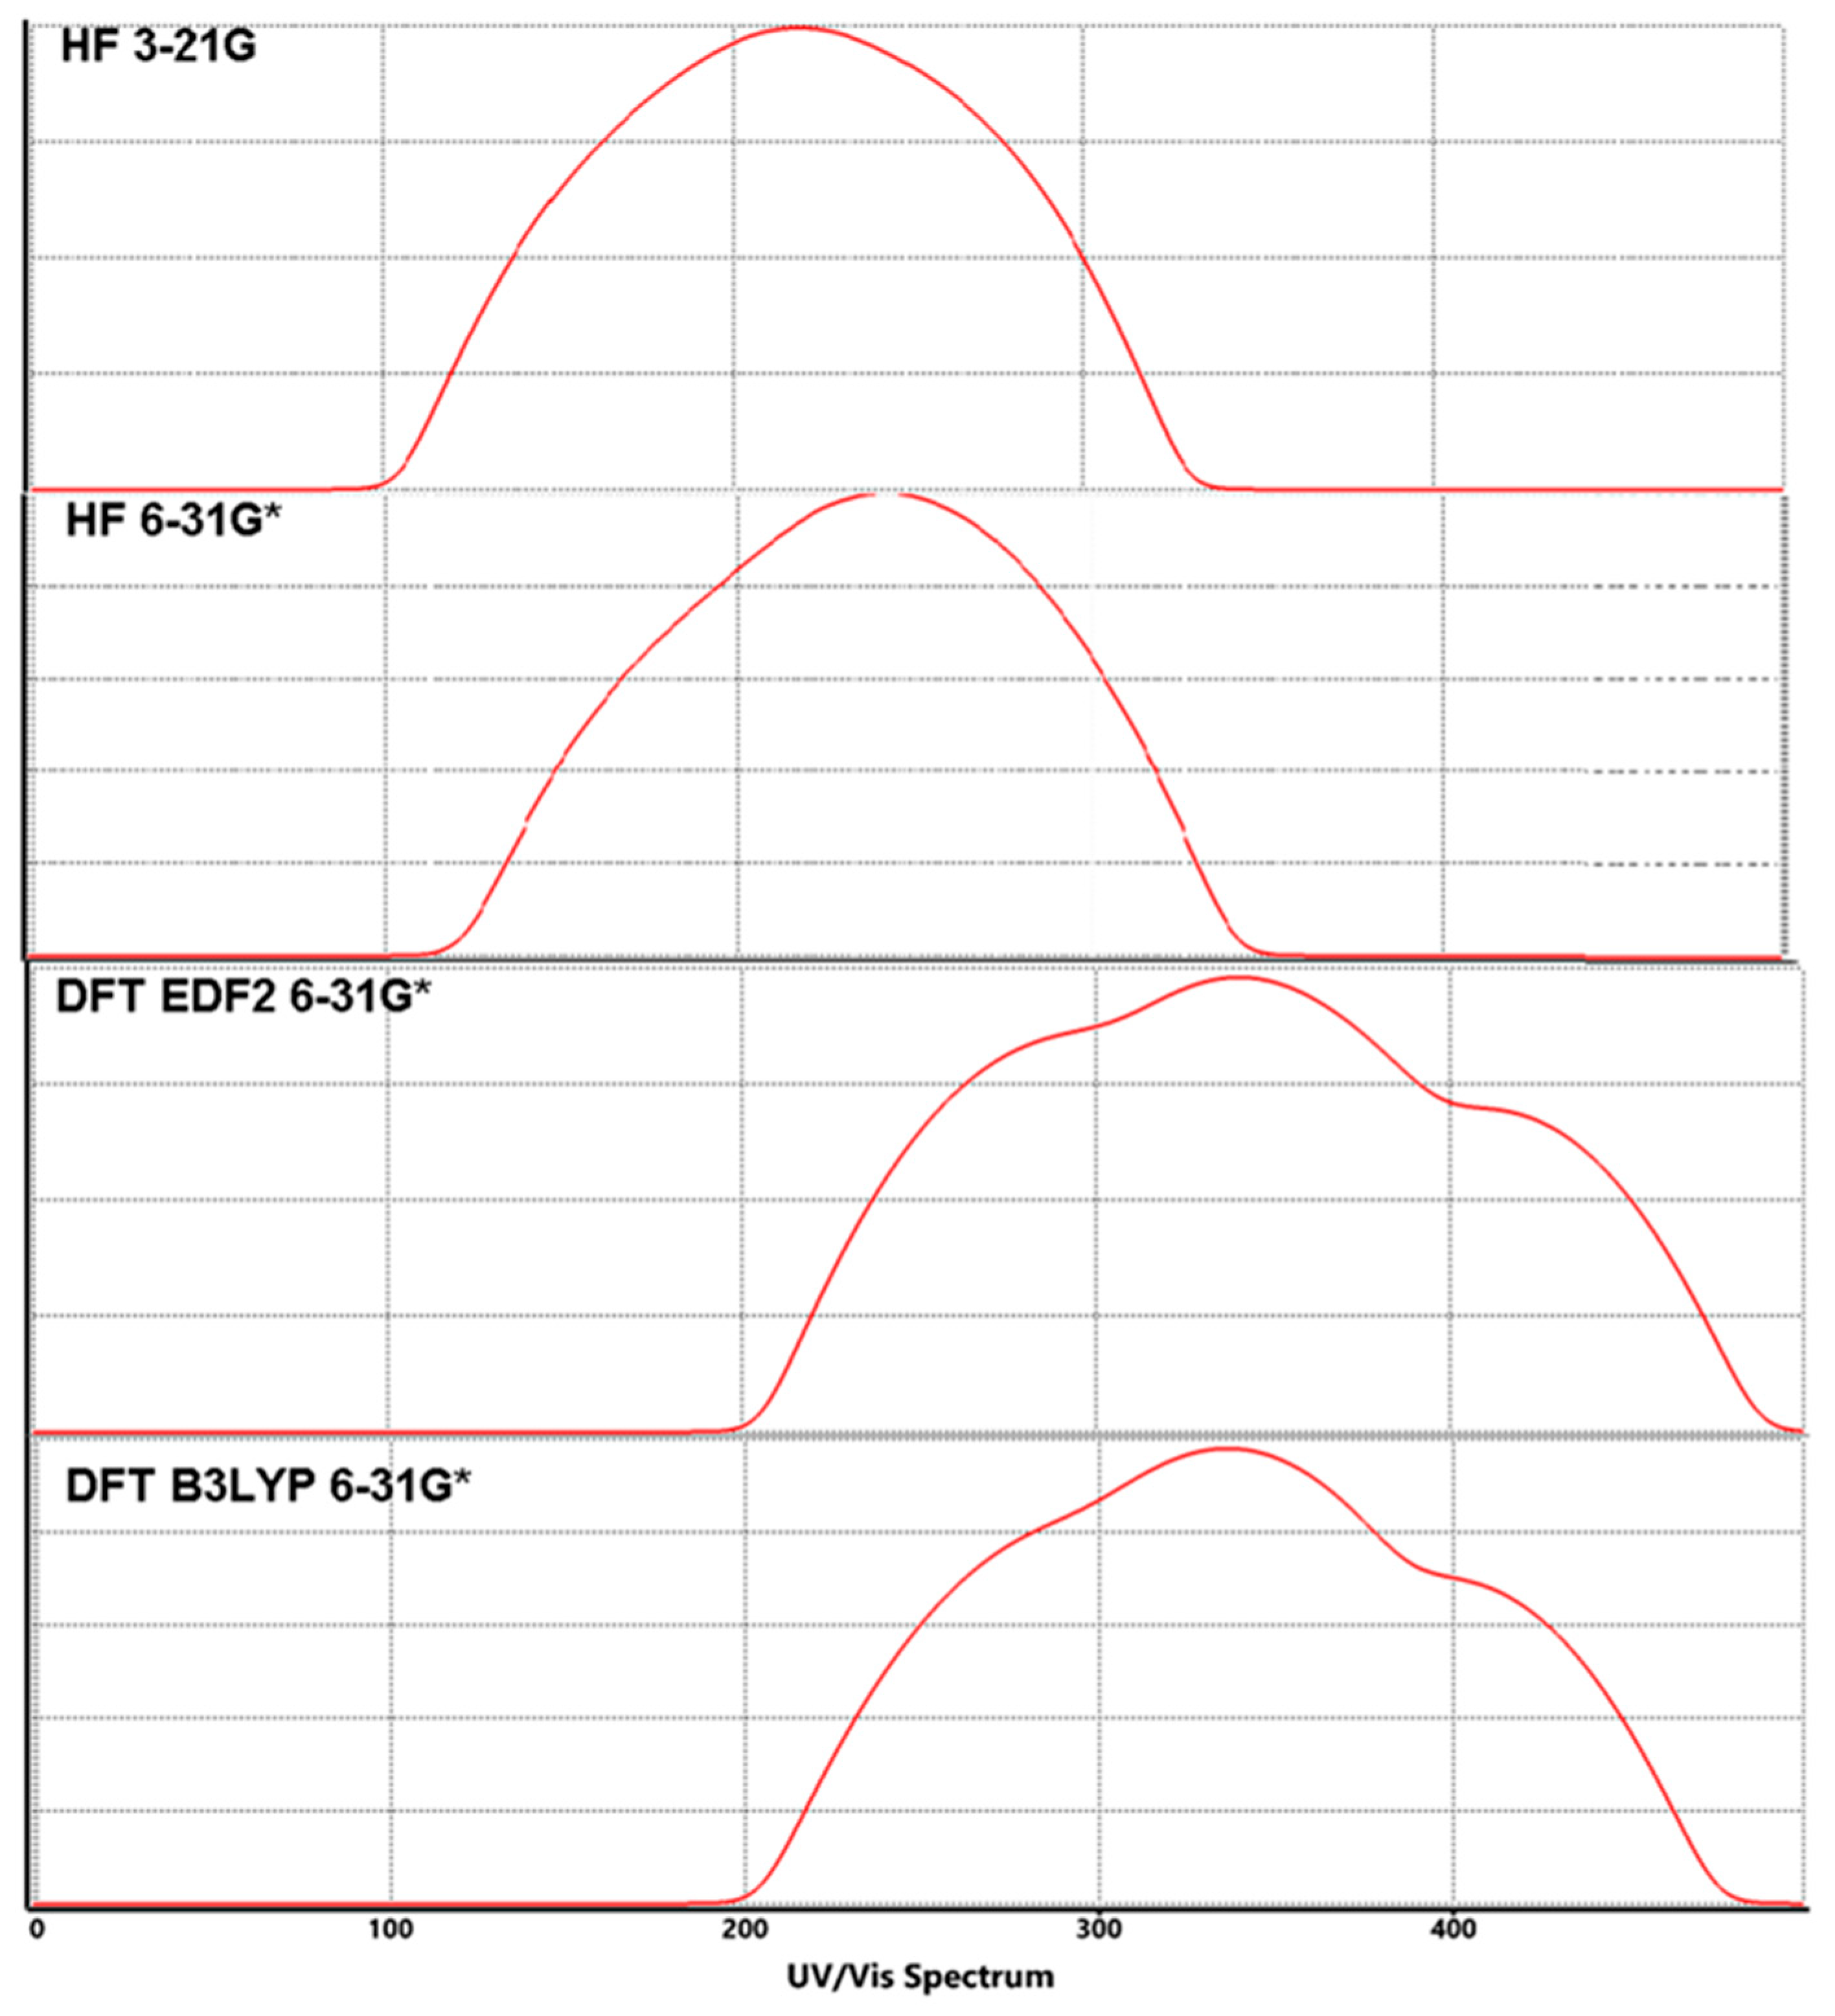
Figure 6.
Calculated FT-IR spectra for Lumefantrine.
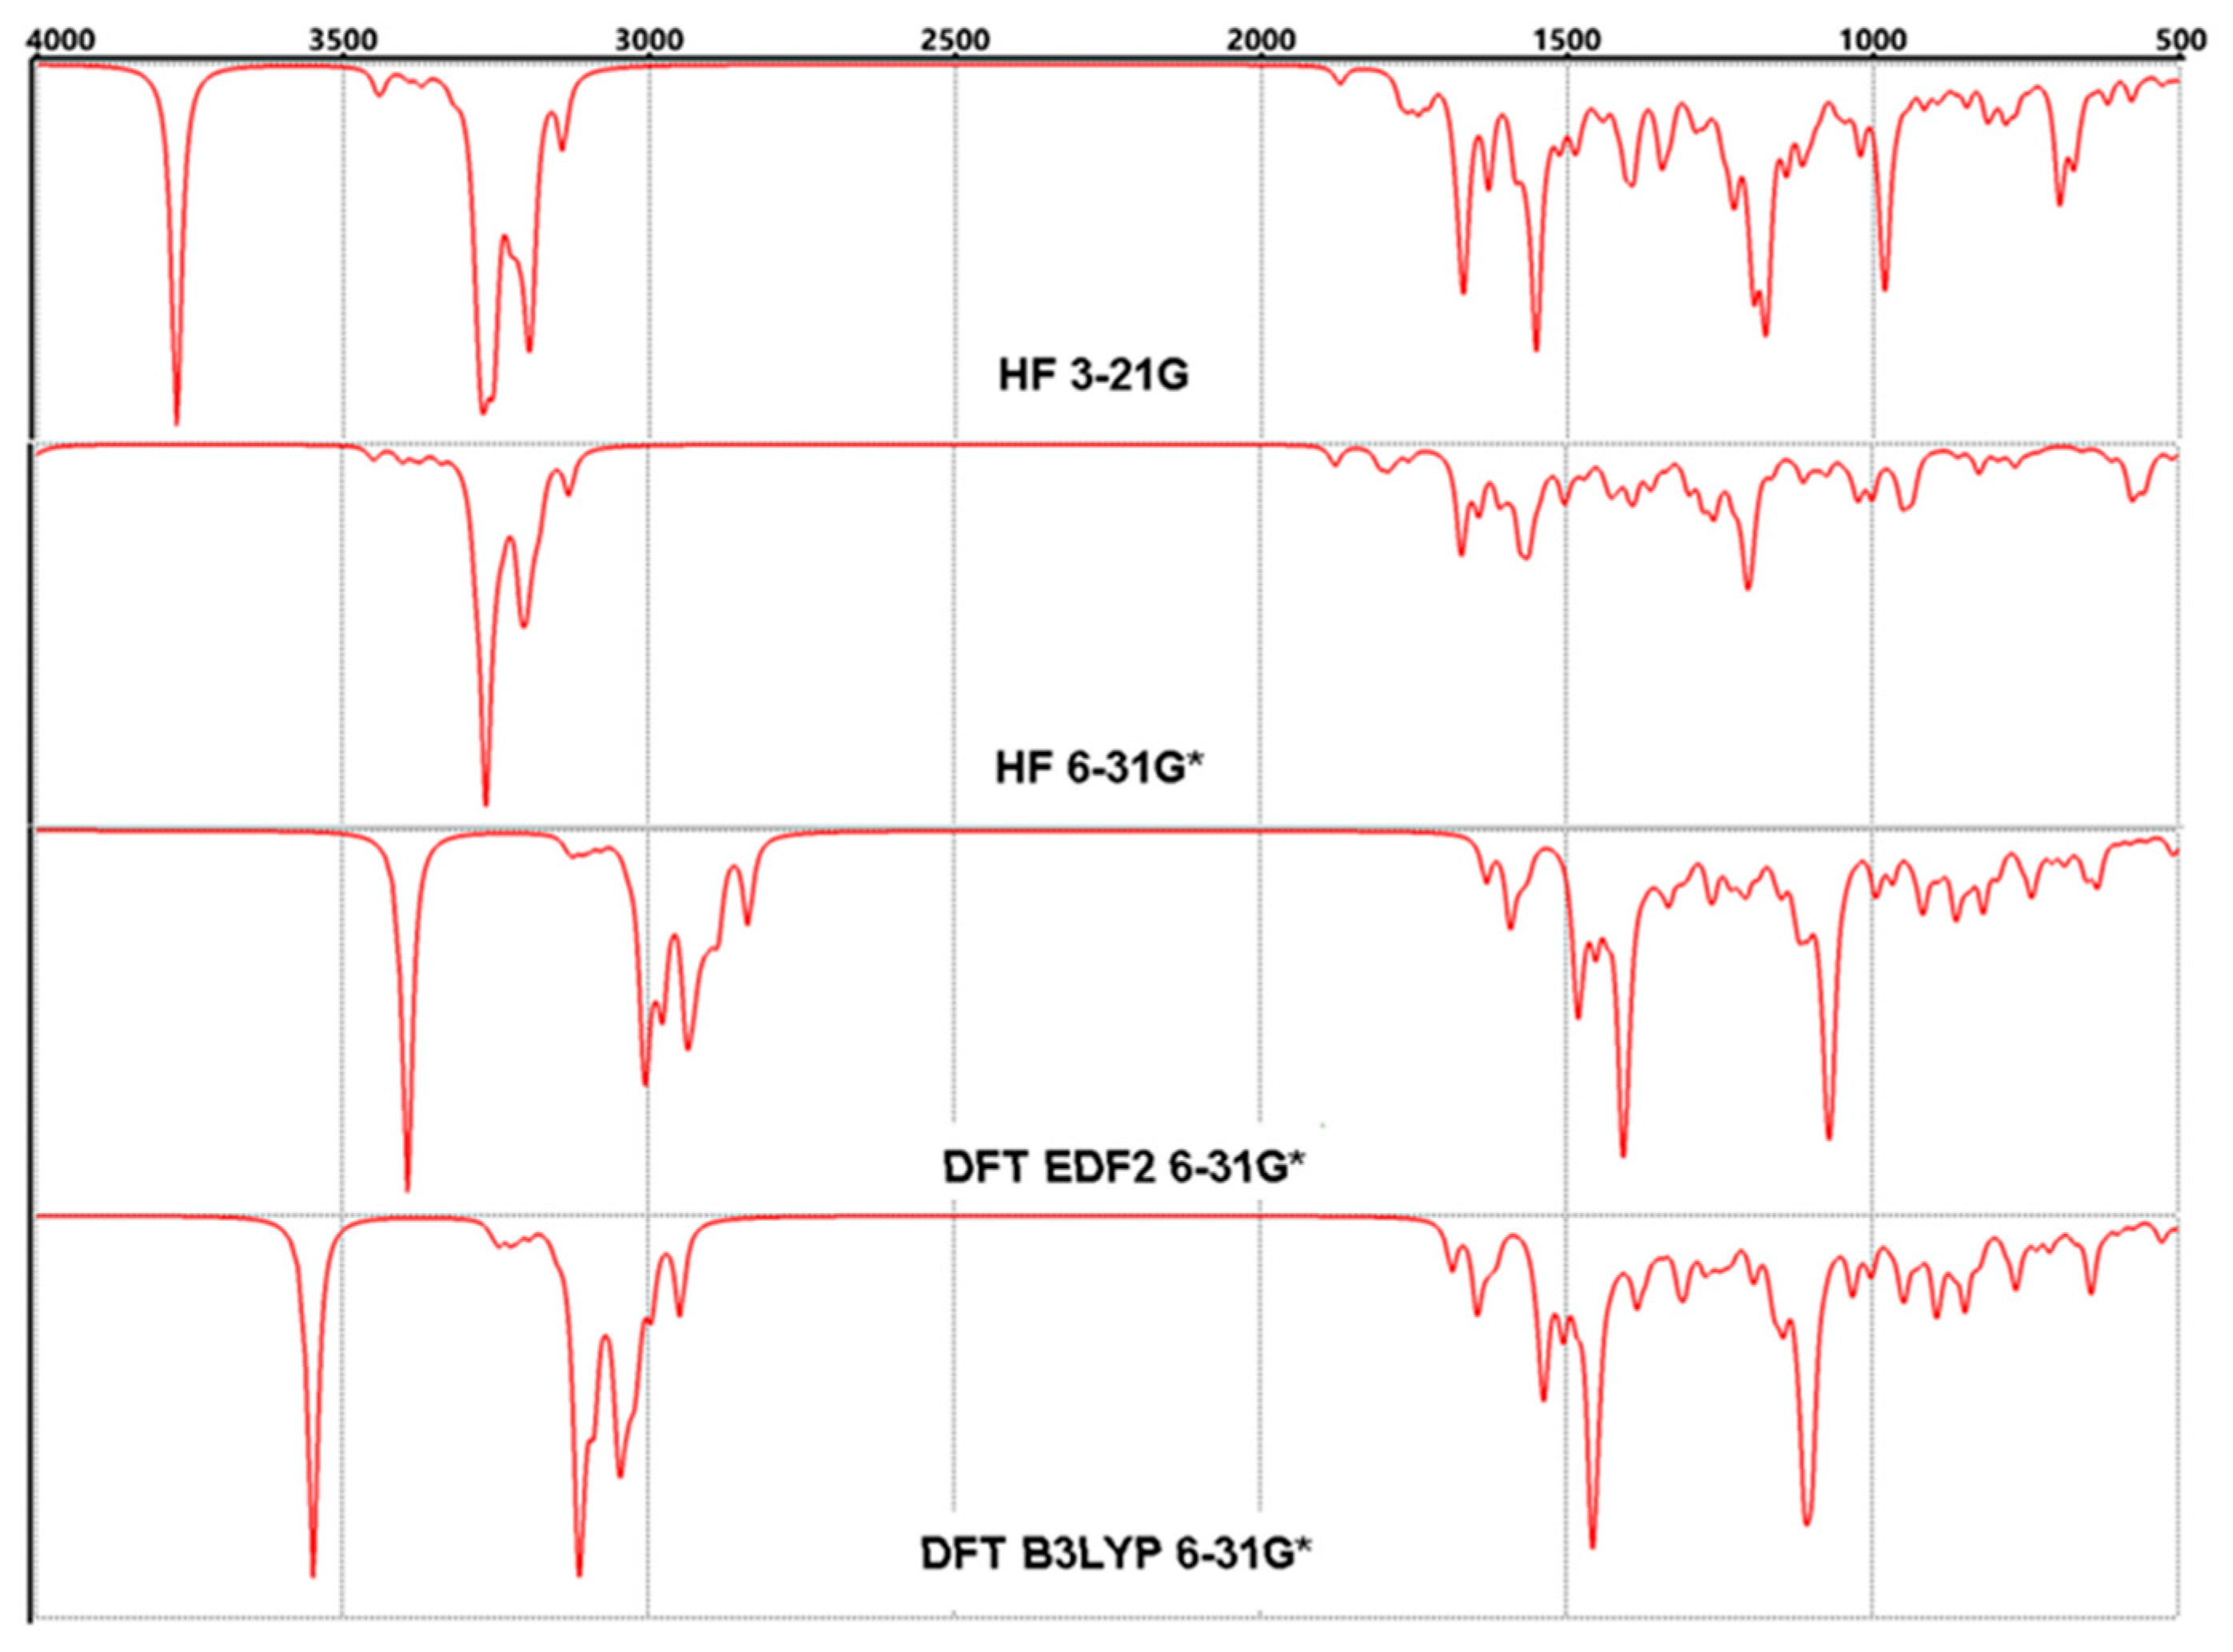
Figure 7.
Calculated 1H NMR spectra for Lumefantrine.
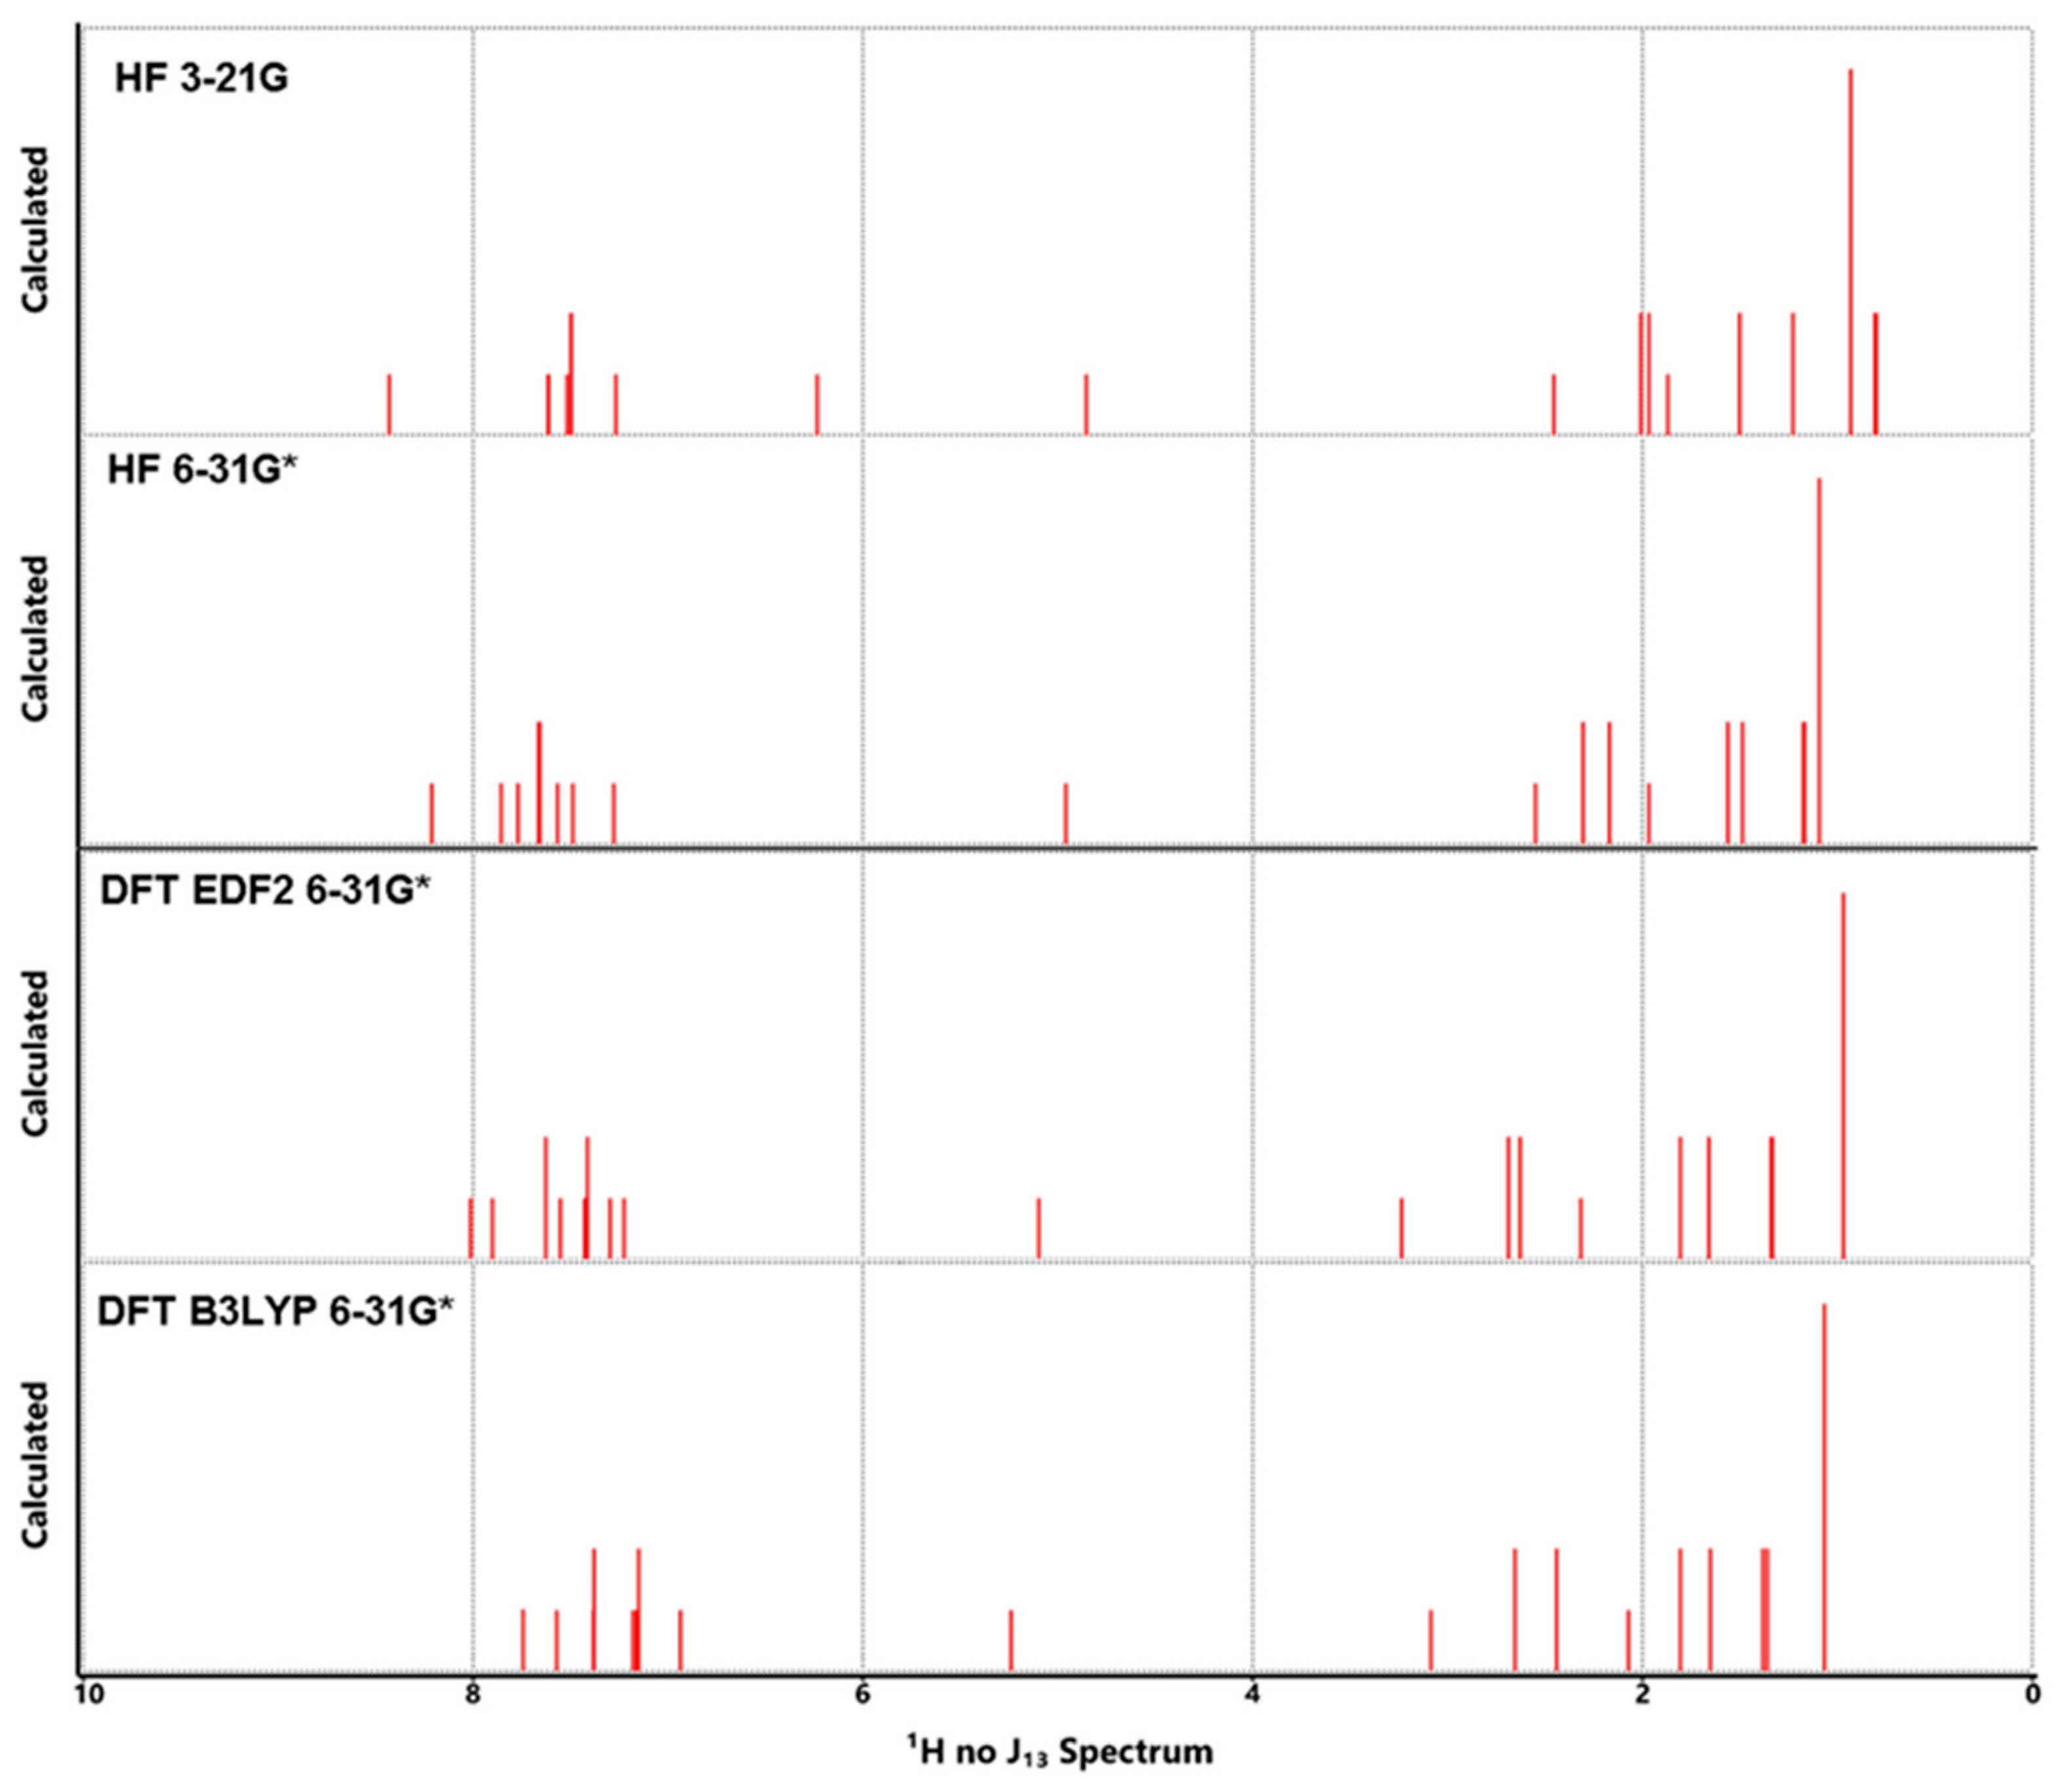
Figure 8.
Calculated 13C NMR spectra for Lumefantrine.
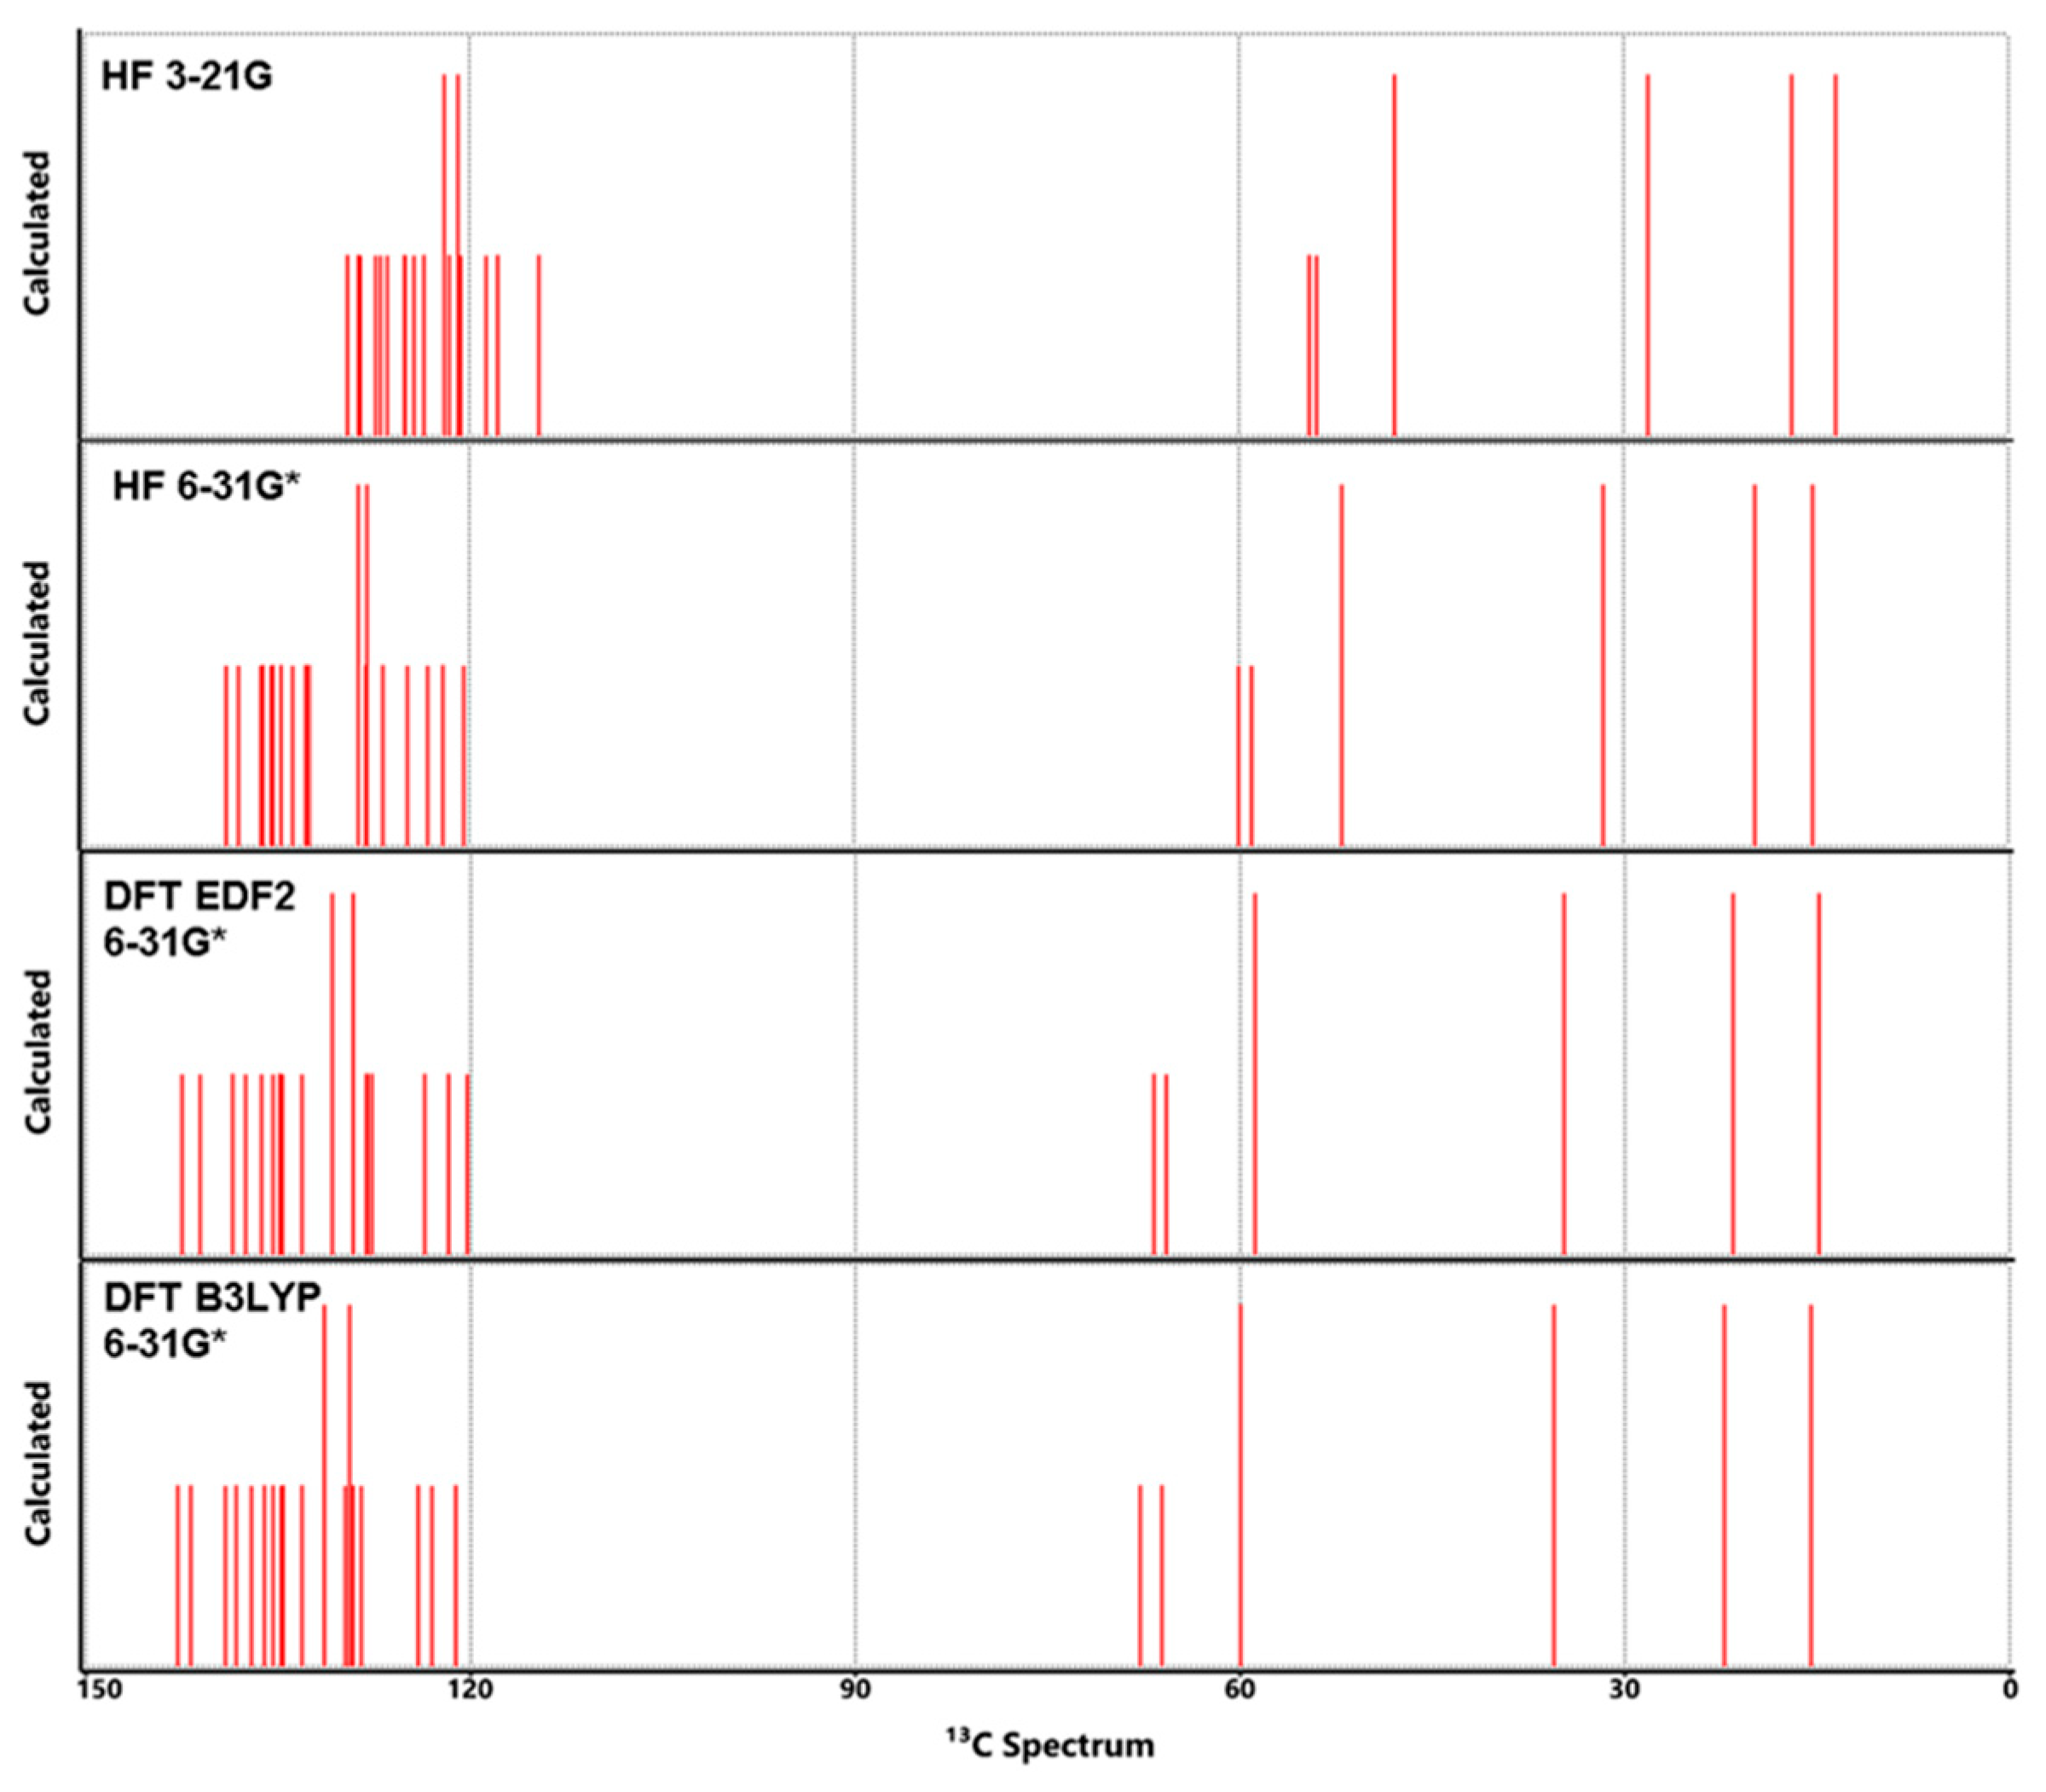
Figure 9.
Calculated COSY, HSQC and HMBC spectra for Lumefantrine.
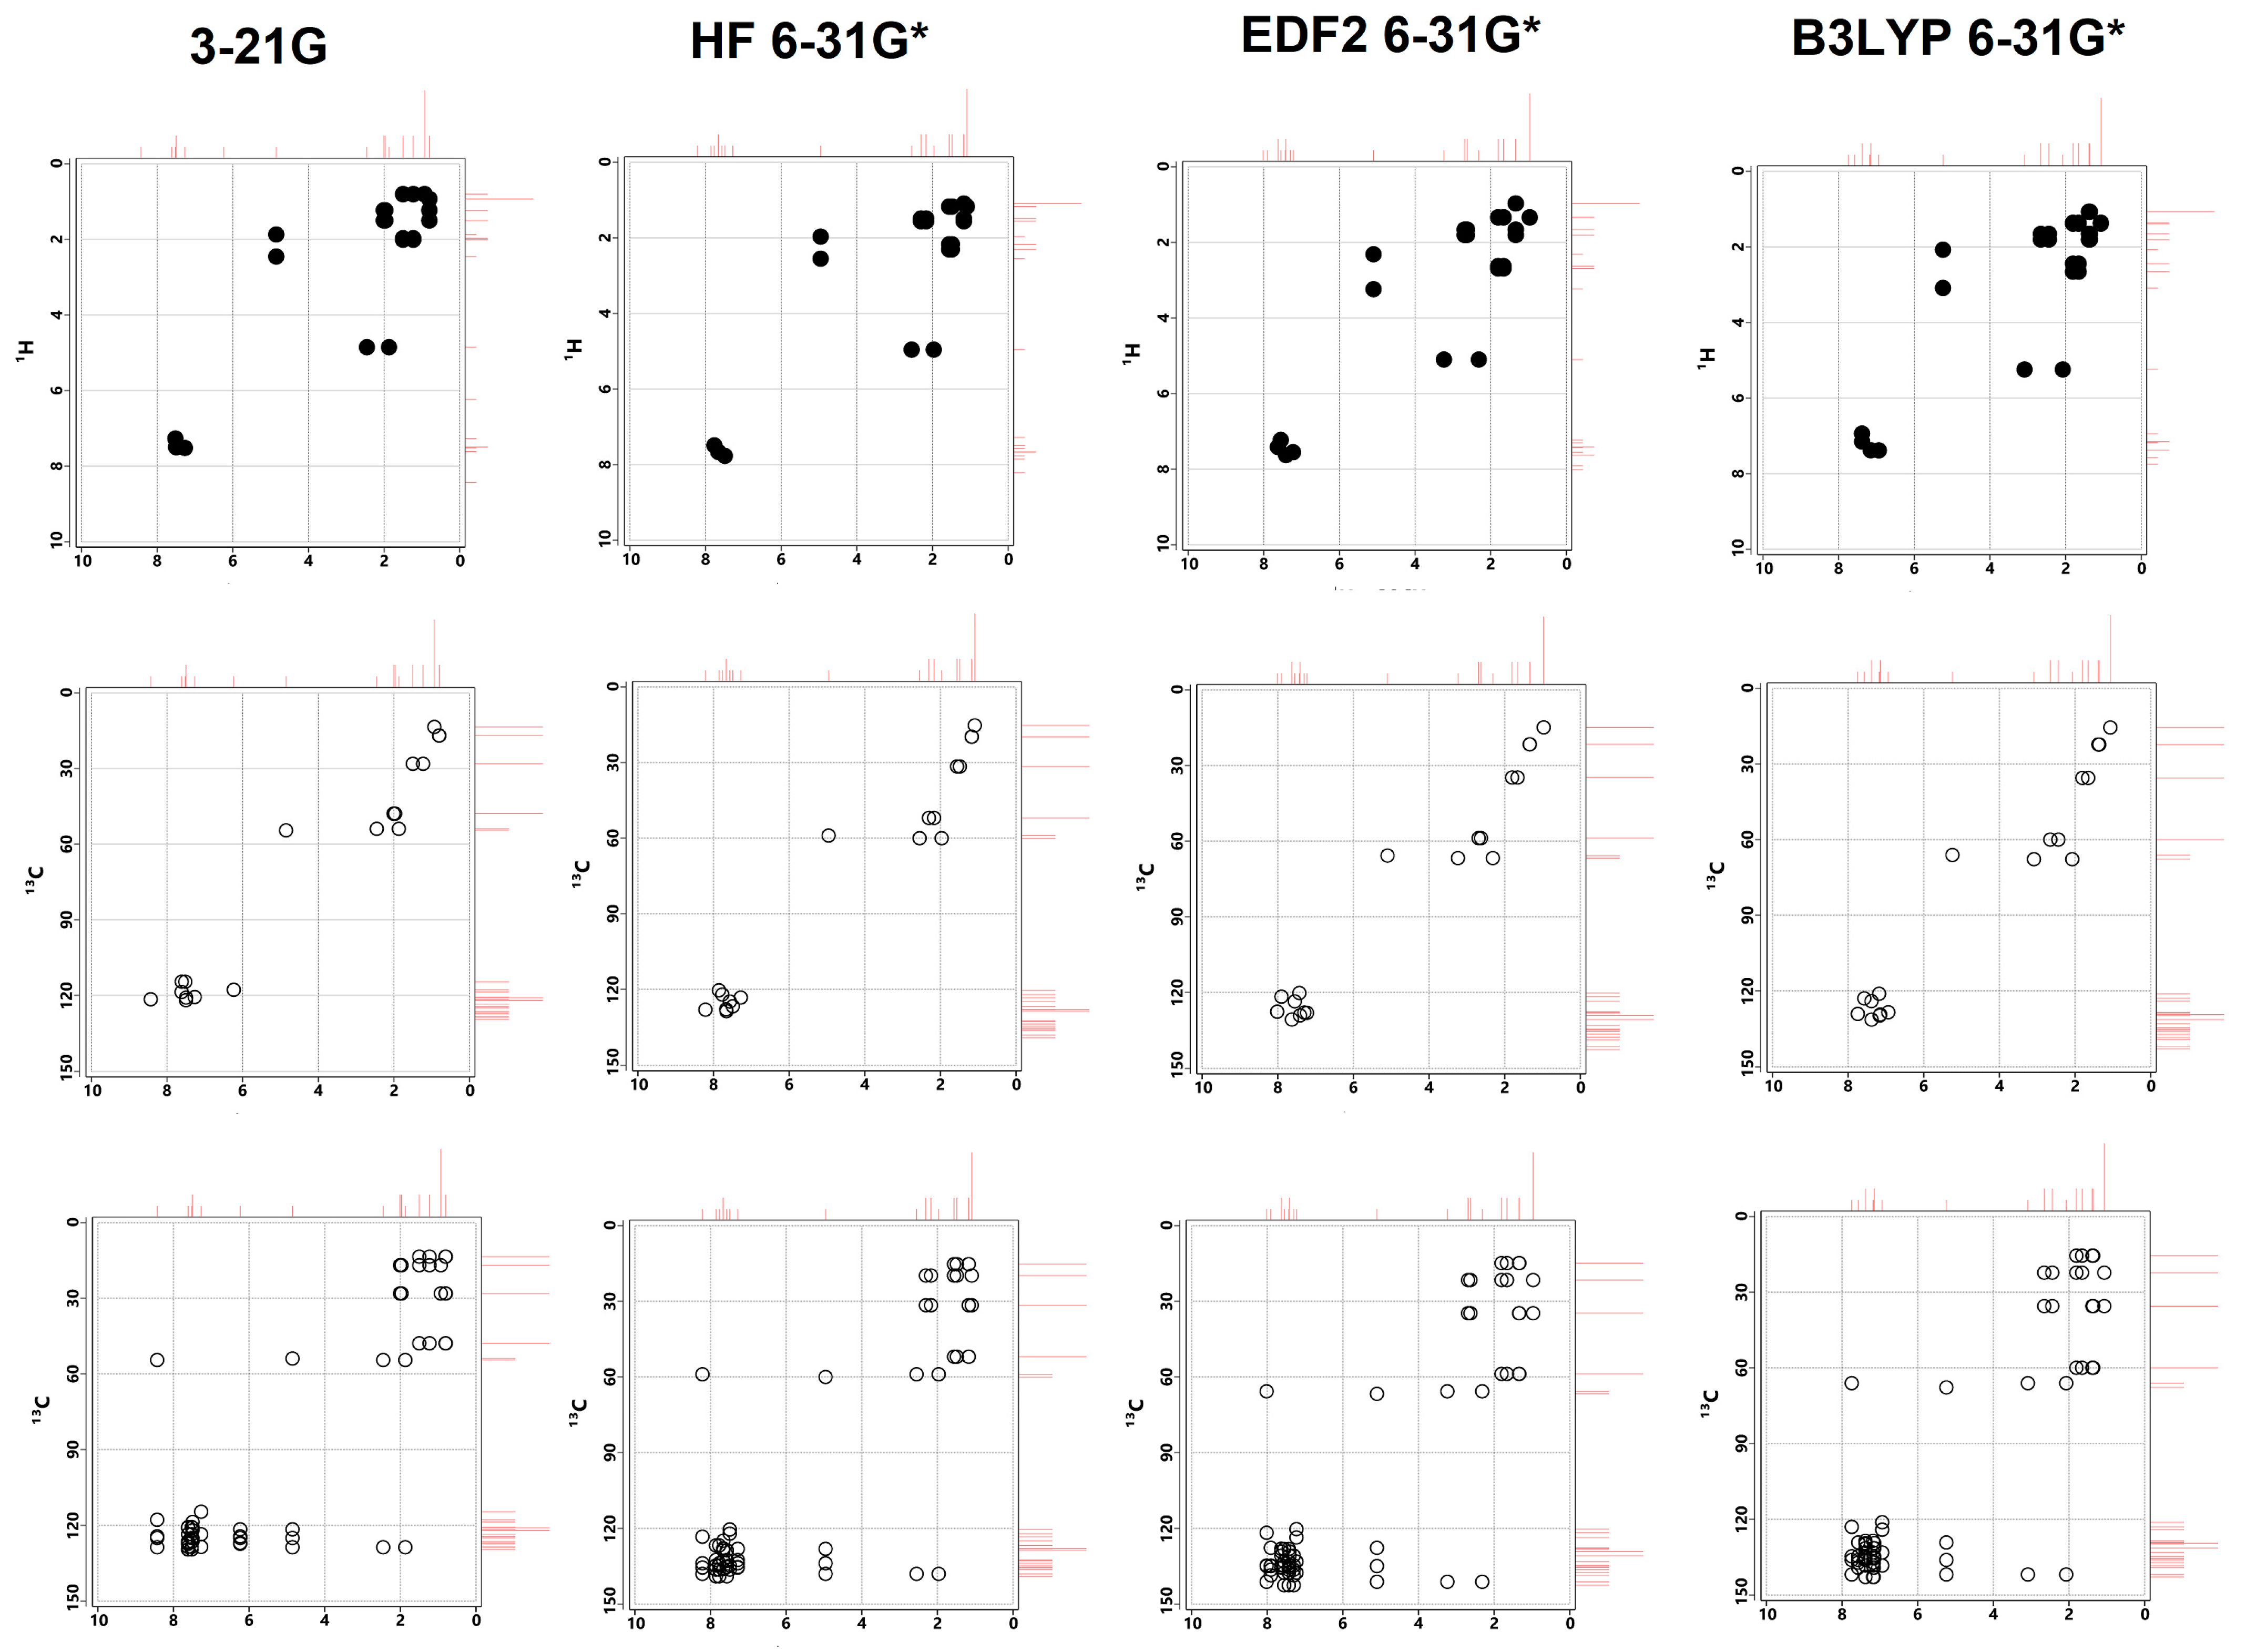
Figure 10.
Average calculated vs. experimental NMR spectra for Lumefantrine.


Table 1.
Physicochemical properties of anti-malarial compounds.
| Properties | Lumefantrine | Artemeter | 4-Aminoquinoline |
|---|---|---|---|
| Molecular Formulae | C30H32Cl3NO | C16H26O5 | C9H8N2 |
| Molecular weight (amu) | 528.9 | 298.37 | 144.17 |
| Physical State/Color | Yellow Solid Powder | White to pale yellow crystals or powder | Powder to crystalline, White/Yellow/Orange |
| Density (g/cm3) | 1.252 | 1.0733 | 1.1148 |
| Topological Polar Surface Area | 23.5 Å2 | 46.2 Å2 | 38.9 Å2 |
| Melting Point (°C) | 128 °C–131 °C | 86–90 °C | 151.0–155.0 °C |
| Boiling Point (°C) | 642.5 °C | 359.79 °C | 312.78 °C |
| Refractive Index | 1.633 | 1.518 | 1.708 |
| Solubility | DMF, Chloroform Ethyl Acetate | 12 mg/L (in water) | Slightly soluble in water |
| Lipophilicity (logP) | 9.19 | 3.48 | 2.0–2.5 |
Table 2.
Mulliken Charge distribution of the atoms of Lumefantrine.
| Atom | HF | DFT EDF2 | DFT B3LYP | Atom | HF | DFT EDF2 | DFT B3LYP | ||
|---|---|---|---|---|---|---|---|---|---|
| 3-21G | 6-31G* | 6-31G* | 6-31G* | 3-21G | 6-31G* | 6-31G* | 6-31G* | ||
| C1 | −0.087 | −0.019 | 0.093 | 0.083 | H1 | 0.310 | 0.265 | 0.181 | 0.177 |
| C2 | −0.178 | −0.195 | −0.199 | −0.190 | H2 | 0.310 | 0.261 | 0.176 | 0.172 |
| C3 | −0.194 | −0.142 | −0.075 | −0.071 | H3 | 0.255 | 0.217 | 0.154 | 0.151 |
| C4 | −0.209 | −0.190 | −0.208 | −0.202 | H4 | 0.263 | 0.229 | 0.167 | 0.160 |
| C5 | −0.047 | −0.029 | 0.054 | 0.051 | H5 | 0.276 | 0.236 | 0.169 | 0.164 |
| C6 | −0.012 | −0.044 | −0.001 | 0.001 | H6 | 0.277 | 0.235 | 0.166 | 0.161 |
| C7 | −0.030 | 0.006 | 0.075 | 0.072 | H7 | 0.264 | 0.221 | 0.150 | 0.145 |
| C8 | −0.031 | −0.031 | 0.051 | 0.051 | H8 | 0.273 | 0.238 | 0.160 | 0.156 |
| C9 | 0.067 | 0.121 | 0.126 | 0.124 | H9 | 0.273 | 0.231 | 0.157 | 0.152 |
| C10 | −0.226 | −0.266 | −0.319 | −0.307 | H10 | 0.268 | 0.230 | 0.149 | 0.147 |
| C11 | −0.142 | −0.014 | 0.166 | 0.154 | H11 | 0.223 | 0.165 | 0.137 | 0.132 |
| C12 | −0.206 | −0.208 | −0.192 | −0.182 | H12 | 0.418 | 0.474 | 0.410 | 0.408 |
| C13 | −0.203 | −0.177 | −0.136 | −0.130 | H13 | 0.242 | 0.186 | 0.159 | 0.152 |
| C14 | −0.207 | −0.135 | −0.066 | −0.064 | H14 | 0.208 | 0.162 | 0.145 | 0.138 |
| C15 | −0.203 | −0.179 | −0.138 | −0.131 | H15 | 0.200 | 0.156 | 0.146 | 0.140 |
| C16 | −0.207 | −0.202 | −0.180 | −0.172 | H16 | 0.211 | 0.167 | 0.148 | 0.141 |
| C17 | −0.197 | −0.184 | −0.201 | −0.194 | H17 | 0.230 | 0.168 | 0.161 | 0.153 |
| C18 | −0.199 | −0.145 | −0.072 | −0.070 | H18 | 0.215 | 0.165 | 0.145 | 0.139 |
| C19 | −0.206 | −0.196 | −0.158 | −0.149 | H19 | 0.203 | 0.155 | 0.138 | 0.131 |
| C20 | −0.245 | −0.203 | −0.195 | −0.193 | H20 | 0.201 | 0.151 | 0.137 | 0.130 |
| C21 | 0.092 | 0.200 | 0.068 | 0.085 | H21 | 0.202 | 0.165 | 0.152 | 0.145 |
| C22 | −0.194 | −0.140 | −0.180 | −0.161 | H22 | 0.205 | 0.162 | 0.156 | 0.148 |
| C23 | −0.173 | −0.124 | −0.166 | −0.148 | H23 | 0.200 | 0.159 | 0.151 | 0.144 |
| C24 | −0.423 | −0.307 | −0.273 | −0.260 | H24 | 0.216 | 0.168 | 0.149 | 0.142 |
| C25 | −0.436 | −0.316 | −0.268 | −0.255 | H25 | 0.188 | 0.142 | 0.127 | 0.121 |
| C26 | −0.580 | −0.479 | −0.463 | −0.442 | H26 | 0.210 | 0.158 | 0.142 | 0.136 |
| C27 | −0.148 | −0.096 | −0.140 | −0.123 | H27 | 0.215 | 0.164 | 0.146 | 0.139 |
| C28 | −0.416 | −0.311 | −0.270 | −0.256 | H28 | 0.208 | 0.158 | 0.143 | 0.135 |
| C29 | −0.434 | −0.314 | −0.267 | −0.254 | H29 | 0.206 | 0.157 | 0.141 | 0.134 |
| C30 | −0.581 | −0.479 | −0.464 | −0.442 | H30 | 0.204 | 0.166 | 0.154 | 0.146 |
| Cl1 | 0.038 | −0.002 | −0.021 | −0.026 | H31 | 0.199 | 0.158 | 0.150 | 0.143 |
| Cl2 | 0.044 | 0.003 | −0.008 | −0.013 | H32 | 0.202 | 0.160 | 0.153 | 0.146 |
| Cl3 | 0.042 | 0.000 | −0.020 | −0.025 | |||||
| O1 | −0.708 | −0.783 | −0.656 | −0.659 | |||||
| N1 | −0.737 | −0.650 | −0.417 | −0.430 | |||||
Table 3.
MO energies for Lumefantrine molecule.
| MOs | HF | DFT | Average | ||
|---|---|---|---|---|---|
| 321G | 6-31G* | EDF2 6-31G* | B3LYP 6-31G* | ||
| LUMO{+1} | 2.5 | 2.4 | −1.2 | −1.1 | 0.7 |
| LUMO | 1.6 | 1.5 | −2.3 | −2.2 | −0.4 |
| HOMO | −8.3 | −8.1 | −5.8 | −5.9 | −7.0 |
| HOMO{−1} | −8.7 | −8.3 | −5.9 | −6.0 | −7.2 |
| HOMO{−2} | −9.4 | −9.4 | −6.1 | −6.3 | −7.8 |
| HOMO{−3} | −9.6 | −9.5 | −6.9 | −7.0 | −8.3 |
| HOMO{−4} | −9.9 | −9.7 | −7.2 | −7.3 | −8.5 |
| HOMO{−5} | −10.0 | −10.0 | −7.2 | −7.4 | −8.7 |
| HOMO{−6} | −10.4 | −10.2 | −7.3 | −7.4 | −8.8 |
| HOMO{−7} | −11.6 | −11.6 | −7.3 | −7.5 | −9.5 |
| HOMO{−8} | −12.1 | −12.1 | −8.2 | −8.4 | −10.2 |
| HOMO{−9} | −12.2 | −12.2 | −8.4 | −8.5 | −10.3 |
Table 4.
Energy equivalencies for the transitions according to different methods.
| Method & Basis Set | HOMO-1 | HOMO | LUMO | LUMO+1 | Energy Diff. (ΔE) | λmax | |||||
|---|---|---|---|---|---|---|---|---|---|---|---|
| ΔE1 | ΔE2 | ΔE3 | Calculated (Vac.) | ||||||||
| HF | 3-21G | −8.7 | −8.3 | 1.6 | 2.5 | 10.3 | 9.9 | 10.8 | 120.47 | 125.34 | 114.89 |
| 6-31G* | −8.3 | −8.1 | 1.5 | 2.4 | 9.8 | 9.6 | 10.5 | 126.61 | 129.25 | 118.17 | |
| DFT | EDF2 6-31G* | −5.9 | −5.8 | −2.3 | −1.2 | 3.6 | 3.5 | 4.6 | 344.67 | 354.52 | 269.74 |
| B3LYP 6-31G* | −6.0 | −5.9 | −2.2 | −1.1 | 3.8 | 3.7 | 4.8 | 326.53 | 335.36 | 258.50 | |
Table 5.
Calculated Vibrational spectra (FT-IR) for Lumefantrine.
| 321G | 6-31G* | EDF2 631G* | B3LYP 631G* | 321G | 6-31G* | EDF2 631G* | B3LYP 631G* | ||
|---|---|---|---|---|---|---|---|---|---|
| 1 | 493 | 490 | 456 | 456 | 11 | 1434 | 1439 | 1333 | 1331 |
| 2 | 616 | 588 | 560 | 558 | 12 | 1494 | 1507 | 1396 | 1392 |
| 3 | 663 | 630 | 596 | 595 | 13 | 1607 | 1582 | 1470 | 1474 |
| 4 | 700 | 670 | 607 | 621 | 14 | 1678 | 1710 | 1570 | 1561 |
| 5 | 783 | 767 | 731 | 732 | 15 | 1801 | 1806 | 1631 | 1622 |
| 6 | 983 | 974 | 886 | 882 | 16 | 3023 | 3010 | 2837 | 2836 |
| 7 | 1296 | 1304 | 1230 | 1226 | 17 | 3088 | 3083 | 2929 | 2926 |
| 8 | 1179 | 1180 | 1100 | 1098 | 18 | 3142 | 3141 | 3003 | 2994 |
| 9 | 1296 | 1304 | 1230 | 1226 | 19 | 3313 | 3316 | 3131 | 3130 |
| 10 | 1352 | 1344 | 1259 | 1261 | 20 | 3629 | 3884 | 3393 | 3124 |
Table 6.
Calculated and experimental NMR spectra for Lumefantrine.
| Atom | HF | DFT | DFT | Exp ** | Atom | HF | DFT | DFT | Exp ** | ||
|---|---|---|---|---|---|---|---|---|---|---|---|
| 3-21G | 6-31G* | EDF2 6-31G* | B3LYP 6-31G* | 3-21G | 6-31G* | EDF2 6-31G* | B3LYP 6-31G* | ||||
| C1 | 128.66 | 137.99 | 141.12 | 135.18 | 141.7 | H1 | 8.43 | 8.21 | 8.02 | 7.74 | 7.58 |
| C2 | 121.57 | 128.09 | 127.69 | 122.43 | 124.1 | H2 | 6.24 | 7.28 | 7.90 | 7.57 | 7.58 |
| C3 | 124.34 | 135.48 | 134.71 | 136.72 | 133.3 | H3 | 7.62 | 7.57 | 7.30 | 7.16 | 7.31 |
| C4 | 117.79 | 123.27 | 121.72 | 116.39 | 127.8 | H4 | 7.49 | 7.66 | 7.63 | 7.67 | 7.44 |
| C5 | 126.93 | 135.30 | 138.57 | 132.56 | 140.0 | H5 | 7.50 | 7.67 | 7.41 | 7.12 | 7.44 |
| C6 | 125.01 | 133.79 | 134.90 | 129.57 | 133.0 | H6 | 7.50 | 7.67 | 7.41 | 7.18 | 7.44 |
| C7 | 128.51 | 136.27 | 137.52 | 131.71 | 136.6 | H7 | 7.49 | 7.60 | 7.63 | 7.09 | 7.44 |
| C8 | 129.51 | 138.94 | 142.48 | 136.16 | 138.4 | H8 | 7.61 | 7.86 | 7.43 | 7.18 | 7.67 |
| C9 | 127.29 | 132.49 | 136.33 | 131.10 | 135.1 | H9 | 7.27 | 7.49 | 7.23 | 6.94 | 7.44 |
| C10 | 118.67 | 124.84 | 128.04 | 123.58 | 128.5 | H10 | 7.52 | 7.77 | 7.55 | 7.38 | 7.71 |
| C11 | 126.38 | 132.76 | 134.66 | 128.27 | 135.1 | H11 | 4.85 | 4.96 | 5.10 | 5.24 | 5.35 |
| C12 | 120.90 | 128.68 | 130.80 | 124.41 | 130.7 | H12 | 3.83 | 3.06 | 4.16 | 3.95 | - |
| C13 | 121.93 | 127.96 | 129.17 | 122.37 | 129.2 | H13 | 1.87 | 1.97 | 2.31 | 2.07 | 2.44 |
| C14 | 125.05 | 136.10 | 135.43 | 137.50 | 134.8 | H14 | 2.45 | 2.55 | 3.24 | 3.09 | 2.87 |
| C15 | 121.93 | 127.96 | 129.17 | 122.99 | 129.2 | H15 | 1.97 | 2.30 | 2.69 | 2.58 | 2.59 |
| C16 | 120.90 | 128.68 | 130.80 | 124.88 | 130.7 | H16 | 2.01 | 2.17 | 2.63 | 2.57 | 2.59 |
| C17 | 114.58 | 120.41 | 120.28 | 114.59 | 126.5 | H17 | 1.50 | 1.56 | 1.80 | 2.00 | 1.49 |
| C18 | 123.53 | 134.68 | 133.14 | 135.27 | 134.3 | H18 | 1.23 | 1.49 | 1.66 | 1.64 | 1.49 |
| C19 | 120.67 | 126.74 | 128.14 | 121.79 | 130.7 | H19 | 0.81 | 1.17 | 1.33 | 1.38 | 1.36 |
| C20 | 114.60 | 122.07 | 123.59 | 117.46 | 120.8 | H20 | 0.80 | 1.18 | 1.34 | 1.42 | 1.36 |
| C21 | 54.52 | 58.98 | 65.74 | 65.49 | 65.6 | H21 | 0.93 | 1.09 | 0.97 | 1.19 | 0.96 |
| C22 | 53.92 | 60.05 | 66.73 | 65.96 | 60.1 | H22 | 0.93 | 1.09 | 0.97 | 1.06 | 0.96 |
| C23 | 47.89 | 52.00 | 58.82 | 56.47 | 53.5 | H23 | 0.93 | 1.09 | 0.97 | 0.98 | 0.96 |
| C24 | 28.11 | 31.58 | 34.76 | 36.97 | 29.2 | H24 | 2.01 | 2.17 | 2.63 | 2.31 | 2.59 |
| C25 | 16.90 | 19.79 | 21.57 | 23.31 | 20.7 | H25 | 1.97 | 2.30 | 2.69 | 2.73 | 2.59 |
| C26 | 13.48 | 15.27 | 14.86 | 15.78 | 14.2 | H26 | 1.50 | 1.56 | 1.80 | 1.61 | 1.49 |
| C27 | 47.89 | 52.00 | 58.82 | 60.59 | 53.5 | H27 | 1.23 | 1.49 | 1.66 | 1.66 | 1.49 |
| C28 | 28.11 | 31.58 | 34.76 | 34.67 | 29.2 | H28 | 0.81 | 1.17 | 1.33 | 1.34 | 1.36 |
| C29 | 16.90 | 19.79 | 21.57 | 23.05 | 20.7 | H29 | 0.80 | 1.18 | 1.34 | 1.34 | 1.36 |
| C30 | 13.48 | 15.27 | 14.86 | 15.89 | 14.2 | H30 | 0.93 | 1.09 | 0.97 | 1.17 | 0.96 |
| H31 | 0.93 | 1.09 | 0.97 | 0.97 | 0.96 | ||||||
| H32 | 0.93 | 1.09 | 0.97 | 1.03 | 0.96 | ||||||
** Borrowed from Reference [1].
Disclaimer/Publisher’s Note: The statements, opinions and data contained in all publications are solely those of the individual author(s) and contributor(s) and not of MDPI and/or the editor(s). MDPI and/or the editor(s) disclaim responsibility for any injury to people or property resulting from any ideas, methods, instructions or products referred to in the content. |
© 2023 by the author. Licensee MDPI, Basel, Switzerland. This article is an open access article distributed under the terms and conditions of the Creative Commons Attribution (CC BY) license (https://creativecommons.org/licenses/by/4.0/).
Share and Cite
MDPI and ACS Style
Kunduracioglu, A. A Computational (DFT) Study on the Anti-Malarial Drug: Lumefantrine. Appl. Sci. 2023, 13, 9219. https://doi.org/10.3390/app13169219
AMA Style
Kunduracioglu A. A Computational (DFT) Study on the Anti-Malarial Drug: Lumefantrine. Applied Sciences. 2023; 13(16):9219. https://doi.org/10.3390/app13169219
Chicago/Turabian StyleKunduracioglu, Ahmet. 2023. "A Computational (DFT) Study on the Anti-Malarial Drug: Lumefantrine" Applied Sciences 13, no. 16: 9219. https://doi.org/10.3390/app13169219
Note that from the first issue of 2016, this journal uses article numbers instead of page numbers. See further details here.