Abstract
In recent years, deep learning methods have been used with increasing frequency to solve architectural design problems. This paper aims to study the spatial functional layout of deep learning-assisted generation subway stations. Using the PointNet++ model, the subway station point cloud data are trained and then collected and processed by the author. After training and verification, the following conclusions are obtained: (1) the feasibility of spatial deep learning for construction based on PointNet++ in the form of point cloud data is verified; (2) the effectiveness of PointNet++ for the semantic segmentation and prediction of metro station point cloud information is verified; and (3) the results show that the overall 9:1 training prediction data have 60% + MIOU and 75% + accuracy for 9:1 training prediction data in the space of 20 × 20 × 20 and a block_size of 10.0. This paper combines the deep learning of 3D point cloud data with architectural design, breaking through the original status quo of two-dimensional images as research objects. From the dataset level, the limitation that research objects such as 2D images cannot accurately describe 3D space is avoided, and more intuitive and diverse design aids are provided for architects.
1. Introduction
1.1. Overview
With the continuous development of the architecture discipline, many problems in this profession need to be urgently solved using interdisciplinary research between architecture and other disciplines. At the same time, with the improvement in computer science technology and the rapid growth of computing power, “deep learning” and the “artificial neural network” have emerged as epoch-making, cutting-edge computer technology. Looking back at the digitalization process of architectural design, from modular systems to computer-aided architectural design and parametric design, it has already faced a bottleneck and urgently needs new breakthroughs. At the same time, rail transit in a city undertakes the important task of relieving traffic pressure and passenger flow transportation. The design of subway stations is becoming more and more important, and subway stations have strong “modularity” and “orderliness”, with obvious potential. This feature suggests that the rules of the spatial layout of the subway station can be understood using deep learning. Therefore, this paper uses a subway station as the research object. The technical level is based on current computer-aided architectural design and parametric design. The deep learning technology in artificial intelligence technology proposes to cross-integrate artificial intelligence design and architectural design of subway stations to realize “artificial intelligence-assisted architectural design” in the true sense.
1.2. Literature Review
AI can assist in architectural design and visualization by considering the patterns in previous design data to generate new designs. Deep learning algorithms have been used extensively in the architectural design and visualization domain with applications such as 2D and 3D generative architectural design, classification of architectural styles and building types, architectural drawings, and space recognition and indoor scene synthesis.
There are relatively few studies on machine learning or deep learning applied to architectural design, and most of the main research objects are architectural design images. For example, Zheng et al. [] built a GAN-based neural network to learn the house plan of a building, which generated the house plan layout within a specified boundary again. The authors trained two models with two types of household plan datasets from China and Japan, respectively. After comparing the results, the Chinese house plans were easier to understand, which also indicated that the Chinese house plans were somehow more systematic and templated. Viktor et al. [] proposed an adaptive method to support the retrofitting of room configurations in frames during the early conceptual design phase. Their study proposed a method for the computer-aided generation of different floor plans during the early stages of conceptual design in architecture. The classification accuracy of the method reached about 93%. Nauata et al. [] proposed the House-GAN algorithm to generate layouts of houses using an innovative graph-constrained GAN. The initial input to this algorithm is a bubble diagram specifying constraints such as the connectivity of rooms, number of rooms, and type of room. Radford et al. [] improved the conventional GAN and proposed a deep convolutional GAN (DCGAN) by including a set of constraints on the architecture of GAN and generating new bedroom designs. The use of DCGANs improved the stability of the generator training across a wide range of datasets and facilitated training with deeper networks and images with higher resolutions. This pix2pix has a wide range of applications including generating photos provided by a sketch, generating color images from the input black and white pictures, and synthesizing photos from architectural labels. Isola et al. [] developed ‘pix2pix’ software using a conditional generative adversarial network (cGAN), which was used to generate building facades using a given layout of the facade. Wang et al. [] proposed ‘pix2pixHD’ software to extend conditional image generation to high-resolution images. A new objective function, a novel generator, and a new discriminator were proposed in pix2pixHD, and the resolution of the generated images was enhanced to 2048 × 1024 compared with the 256 × 256 resolution in the original pix2pix software. JIN SUNG KIM et al. [] proposed an automatic extraction method for image design features based on deep learning. The ultimate goal was to develop an automatic extraction for these features and apply them to interior design, such as interior design case studies or interior element databases and recommendation systems. Cho et al. [] used the floor plan of a building as input data and the semantic segmentation results of various labeled elements as the output to obtain a GAN that could identify and label the elements in a building floor plan. Further studies, such as Zheng et al. [], used vectorized coordinate values instead of pixel maps for the deep learning of a floor plan layout. The design elements in the house plan were vectorized into coordinate values to study a bedroom layout problem in the floor plan, and a neural network was used to generate a bedroom layout map. The vectorized data described the nature of CAD data more clearly and had stronger compatibility compared with pixelated images.
In the realm of deep generative models, variational autoencoders are another type of algorithm that is widely used. VAEs are used both in 2D and 3D generative architectural designs. Wu et al. [] proposed an algorithm based on an encoder–decoder network to generate residential floor plans using the perimeter of the house as an input.
‘Graph2Plan’ is another algorithm proposed for floor plan layout generation based on GCNs and CNNs considering the user input layout []. Using this algorithm, a more detailed introduction of layout constraints including room adjacencies is possible. Generating vectorized architectural floor plans from rasterized images using deep learning is another widely investigated area. Many researchers [,] have used deep learning algorithms such as GANs, ResNET, CNN, and fully convolutional networks (FCNs) to generate vectorized floor plans with high accuracy using rasterized images with varying complexities.
There are also some classification studies on the deep learning of architectural design images. For example, Can et al. [] developed a training algorithm using a dataset of architectural drawings (floor plans and profiles) based on tagged pixels. After some iterations, the algorithm was able to classify the pixel-based floor plans and sections better. There are also some studies that use AI to identify stylistic features of architects. For example, Yuji et al. [] used the latest techniques in deep learning and computer vision to measure the visual similarity between the architectural designs of different architects. Capable of identifying architectural styles and architect styles well, the algorithm enabled the authors to identify individual architects with 73% validity, and the clustering analysis mostly agreed with traditional descriptions by architectural historians and theorists. This study shows that predictions for interior scenes are more accurate than for exterior scenes.
There are also some studies on deep learning related to architectural design regarding users’ perceptions of buildings. For example, Peng et al. [] proposed a method for local spatial component recognition using 3D isometric methods and convolutional neural networks (CNNs) to investigate how to quantitatively and effectively describe the spatial experience of observers. Wang et al. [] investigated the use of deep convolutional neural networks to quantify the legibility of interior spaces and achieved a top-1 accuracy of 98% on a test set. This technique can be further applied to indoor localization with its low cost and fast deployment speed. Han et al. [] used machine learning to learn photos inside brand flagship stores to obtain a system that includes interior design styles. Xia et al. [] innovatively used a user’s point of view and perspective, and proposed that the semantic segmentation model can be used to identify and segment a streetscape map to obtain indicators such as sky closure and greening rate. This method was inevitably more consistent with the underlying logic of urban feature extraction, as well as being more rigorous and reliable.
As can be seen from the above literature review, there are a few existing studies on deep learning and architectural design, mainly focusing on identifying and generating architectural design images, analyzing spatial features, simulating users’ feelings toward a building, etc., and predicting the results using AI, as well as optimizing and improving the resultant scenarios. However, there are fewer studies that apply deep learning to architectural functional spaces while focusing on the ability of architectural functional spaces to enhance the quality of life of users, reduce the consumption of energy and resources, and understand how buildings can support specific activities and needs. The construction of rail transit is closely related to people’s lives. The internal space of metro stations is complex, and the functional division is relatively uniform, so it has the characteristics of “modularity”; therefore, optimizing its spatial layout is of great practical significance. In addition, in terms of the selection of research perspectives, most of the existing research is based on two-dimensional architectural plans, which are unable to capture the three-dimensional sense of architectural design space and proportionality. Based on this, this study uses underground stations as a research object and a 3D point cloud as the entry point and investigates how deep learning realizes the automatic division of architectural functional space in underground stations. This study also explores the feasibility and validity of using a point cloud in the division of 3D spatial function of architectural design and expects to realize artificial intelligence-assisted architectural design.
2. Methods
2.1. Construction of the Pytorch Framework
Pytorch is composed of Py and torch; Py stands for Python, and torch is a widely used tensor library, which can perform operations on multidimensional matrices. Pytorch comes from Facebook’s neural network framework, which is a deep neural network programming platform based on GPU acceleration.
There are several reasons for choosing to use the Pytorch framework in this article:
(1) The tensor modules, Tensor and Numpy, that come with Pytorch are very similar and can be transferred seamlessly, reducing learning costs.
(2) Pytorch has been used in a large group of studies in the academic literature, indicating that Pytorch is more suitable for most academic research.
(3) In many evaluations, Pytorch is faster than other frameworks such as TensorFlow.
(4) The official API documentation is extremely clear, and the distribution of each module is reasonable, making it easy to find what you want.
The operation of Pytorch’s deep learning framework requires the support of various software programs, including CUDA, cudnn, Python, Numpy, and, most importantly, Pytorch. The download addresses of the software used in this article are listed in Table 1.

Table 1.
Mainly used software with corresponding download addresses.
The basic steps to build the Pytorch framework are as follows:
(1) Ideas for deep learning model training: prepare data, build models, and train models.
(2) A deep learning framework needs to be organized. According to the idea of model training, the functions that each module of the framework needs to implement can be summarized as follows: data pre-processing and loading, model construction, training model (Train), visualization of the training process, and testing.
(3) The organization of the deep learning framework also needs to meet the following conditions. First, the model is highly configurable, which is convenient for modifying parameters, modifying the model, and repeated experiments. Second, the organizational structure of the code is clear, allowing people to see how the code should be organized. Finally, the code should be well-documented and easy to read.
2.2. Architecture and Implementation of the PointNet++ Model
2.2.1. PointNet++ Model Architecture
PointNet [] is a neural network developed by Charles R. Qi, Hao Su, Kaichun Mo, Leonidas J. Guibas, and others at Stanford University. It mainly uses the deep learning of point sets in three-dimensional classification and segmentation. But PointNet cannot obtain local features, so it is difficult to use when analyzing complex scenes. PointNet++ [] is also a neural network developed by Charles R. Qi, Li Yi, Hao Su, Leonidas J. Guibas, and others at Stanford University, which is used to measure the deep-level feature learning of point sets in space. PointNet++ applies PointNet in a local region to generate a point set and then continues to apply PointNet to obtain a point set, non-stop recursively. As a result, multi-level features can be understood, and because PointNet is applied internally, it inherits transformation invariance and rearrangement invariance. PointNet++ is an extension of PointNet, which is mainly improved and enhanced in the following two aspects. First, using metric space distances, PointNet is used to iteratively extract features from the local range of the point cloud so that it can learn the local features. The scale is growing. Second, because point clouds are often uneven, PointNet++ proposes an adaptive density feature extraction method (Figure 1), namely, multi-scale grouping (MSG) and multi-resolution grouping (MRG), for the input. When the sampling density is changed, it learns to combine features from regions at different scales. In this way, the prediction inaccuracy caused by the uneven point cloud is solved. This not only extracts features more efficiently but also improves robustness to a certain extent.
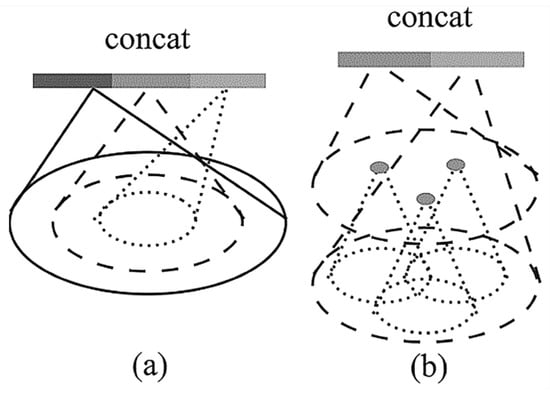
Figure 1.
(a) Multi-scale grouping (MSG) and (b) multi-resolution grouping (MRG) [].
An important contribution of PointNet++ is that PointNet++ makes use of multi-scale neighborhoods for robustness and detail capture. The network learns adaptively weighted features detected using different scales with the help of random input loss during training and combines multi-scale features based on input data. Experiments show that PointNet++ is able to process point sets efficiently and robustly. In particular, significantly better results than the state-of-the-art (SOTA) were obtained during a challenging 3D point cloud benchmark test [].
As shown in Figure 1, the abstraction layer in each collection includes three parts, the sampling layer, grouping layer, and PointNet++ layer. The input for each extraction layer is (N, (d + C)), where N is the number of input points, d is the coordinate dimension, and C is the feature dimension. The output is (N’, (d + C’)), where N’ is the number of output points, d is the coordinate constant dimension, and C’ is the new feature dimension. Therefore, to segment a building point cloud segmentation model using the PointNet++ network, the input is the txt file data for the model point cloud and the format is XYZRGBc, where XYZ is the point cloud coordinate value, RGB is the point cloud color, and c is the segmentation label. The output is an obj model file and a txt predicted classification point cloud file. The final result is the obj model file, which is a more general format and can be visualized using software platforms such as MeshLab (Version No. 1.3.4.0) or Rhinoceros.
2.2.2. PointNet++ Model Implementation
PointNet [] learns the corresponding spatial encoding for each point in the input point cloud and then uses the features of all points to obtain a global point cloud feature. In this process, the extraction and processing of local features are missing. For example, the features of adjacent points in the point cloud space are similar, which is the same as the pixel values of the same object in the bitmap being similar. The density of the point cloud in the real scene is often different, and PointNet is trained based on a uniformly sampled point cloud, which makes the accuracy of the point cloud drop. Since PointNet cannot solve the local frame problem caused by spatial metrics, it limits the network’s ability to recognize fine scenes and generalize complex scenes. Thus, PointNet++ [] was proposed to solve two problems. The first is how to locally divide the point cloud; the second is how to extract local features from the point cloud. PointNet++ is an advanced version of PointNet, which systematically supplements and improves the PointNet model.
The model implementation mainly consists of the following important modules:
- (1)
- Layer module: The feature extraction of point sets consists of three parts, namely, the sampling layer, grouping layer, and PointNet layer.
- (a)
- Sampling layer:The sampling layer defines the center of the local region by selecting a series of points in the input point cloud. The sampling algorithm uses the iterative furthest point sampling (FPS) method.
- (b)
- Grouping layer:The goal is to construct local regions and extract features, and the idea is to utilize neighboring points. This article uses the neighborhood ball instead of KNN because it can guarantee a fixed area scale, and the main indicator is still the distance.
- Robust feature learning when the point cloud density is uneven:Here, the problem of the uneven density of spatial point clouds in feature learning is solved, and two grouping methods are proposed. That is, local patterns of different sizes are extracted and combined according to the density of local points, which are called density adaptive layers.
- Multi-scale grouping:This is a simple and effective method that directly combines point cloud features of different densities (extracted using PointNet++) and obtains point clouds of different densities by performing dropout on the input point cloud with different probabilities, but the problem is that it requires many calculations.
- Multi-resolution grouping:This is divided into two parts: one part is the feature extracted directly from the original point using PointNet++, and the other part is the feature set obtained by abstracting the set on the sub-region. The first part is equivalent to the global area, and the second part is equivalent to the local area. The density of the local area can be controlled using two parts. When the density of the local area is relatively small, the local features are not as reliable as the global features, so the global weight can be increased, and vice versa, and weights can be understood from density changes.
- (c)
- PointNet++ layer:Regarding the issue of how to extract local features from the point cloud, the original PointNet can be used to extract the features of the point cloud very well. Therefore, in PointNet++, the original PointNet network is used as a sub-network of the PointNet++ network. In addition, the PointNet++ layer also includes common MLP, Conv_Layer, Pooling_layer, and other categories.
- (2)
- Network module:
- (a)
- Feature section: Feature extraction uses sample, grouping, and PointNet++ in the above-mentioned layers.
- (b)
- Segmentation part: The input in the network is continuously sampled, and the label in the segmentation is targeted at the original point, which is equivalent to an upsampling action. The authors concatenate the features in the set abstraction before using the interpolation method.
- (c)
- Classification part: the fully connected layer is used to classify the overall point cloud features, and the classification results are obtained.
- (3)
- Training strategy module (Solver): Solver mainly includes strategies for training neural networks, including batch size, learning rate, optimizer strategy, etc., using the Config file for configuration. The overall network strategy can be modified by modifying this file. The structure table in the PointNet++ msg network is shown in Table 2.
Table 2. PointNet++ msg network model structure table.
2.3. Construction of the Subway Station Space Model Point Cloud Database
2.3.1. Selection and Collection of Data Formats
This article is mainly aimed at the spatial function partition design of deep learning-assisted subway stations. In order to make deep learning fit the three-dimensional characteristics of architectural space from the data source, a three-dimensional model is selected as the research object in the dataset, and a data-driven approach is used to understand and process three-dimensional data, that is, 3D deep learning. Three-dimensional data are more difficult to use in deep learning than two-dimensional data. For example, two-dimensional graphics can be easily converted into matrix data, while three-dimensional data become difficult to process. Therefore, it is necessary to consider how to choose the expression form of 3D data.
As shown in Figure 2, the 3D data forms include:
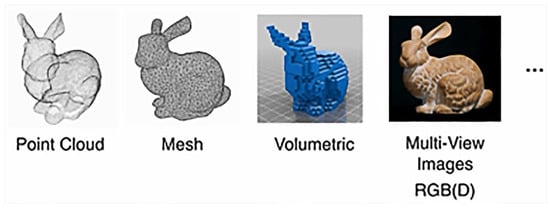
Figure 2.
Four commonly used 3D data forms.
(1) Point cloud: Generally, it is the depth data scanned with the depth sensor or a point cloud with other information.
(2) Mesh: A grid composed of vertices. Many models and renders use mesh to calculate, and the amount of calculation is small.
(3) Volumetric: Divide the space into a three-dimensional grid, the smallest unit is called a voxel, which is similar to a pixel in an image.
(4) Multi-view images: Use pictures from multiple angles to represent objects with a depth channel and describe the space using the depth channel.
Among the four 3D data forms, the externalized form of a point cloud is relatively simple, consisting of multiple sets of points, and mesh data contain the coordinates and normal information on vertices. The volumetric 3D grid needs to set a grid size and resolution. The RGB (D) image of the multi-view image needs to select multiple angles, and the error is large.
Taken together, a point cloud, as a data-description carrier for 3D scenes, can realize end-to-end deep learning and discover the internal logic in the original data. Based on this initial information data collection, a deep learning bridge is built by connecting ports to analyze the inherent characteristics of data.
This paper aims to convert the existing data into a 3D model and then into point cloud data. It is more standardized and uniform than the above-mentioned point cloud, and the label is marked through the layer.
Therefore, this paper chooses a point cloud as a research object for the neural network, that is, the point cloud file for the functional partition model of the subway station. This point cloud file contains XYZRGBc, that is, coordinate information, color information, and label c. Deep learning technology requires a large amount of data to train models, and the collection and subsequent processing of datasets has become a difficult task. Due to the limitations of the actual studied situation, the subway station data in this article come from official websites of subway stations in major cities. It mainly collects the floor plans of a total of 618 subway stations in Beijing, Shanghai, Chengdu, and Xi’an. Part of the information is shown in Table 3 and Figure 3. The number of papers collected to obtain metro station floor plans was 143 for Beijing, 430 for Shanghai, 29 for Chengdu, and 16 for Xi’an. Considering the impact of data volume on research accuracy, this paper uses the data-enhancement code provide.py to enrich and enhance the dataset. Later in our research process, it was found that, although it was not possible to collect more subway station model data due to the constraints of the actual studied situation, the existing dataset combined with the data-enhancement code still achieved good results.
Table 3.
List of some metro station data sources.
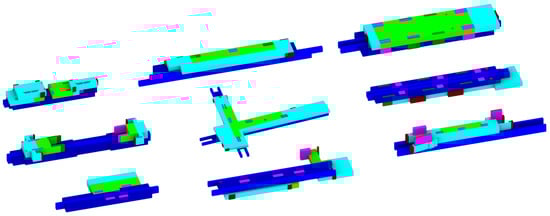
Figure 3.
Parallel projection view of the box model of the volume for some subway stations.
2.3.2. Pre-Processing of Datasets
The 3D point cloud data required for this study and its labeling work mainly relies on the re-modeling of the existing functional zoned floor plans and the export and labeling of the point cloud data based on the point cloud segmentation of the color labels. The pre-processing of the dataset used the platforms Rhinoceros and Grasshopper. First, the volume box model for each metro station is established using Rhinoceros modeling software according to the functional division of the floor plan, as shown in Figure 4a,b. The layers are segmented according to the functional division, with each color representing a function The color labels of the box model are the same as the color labels of the subsequent point cloud (Figure 4), which are the non-payment area, payment area, entrance/exit, platform floor, track, accessible lift, escalator, and staircase eight spatial partitions. The box surface is then subdivided into dot matrices with intervals of about 1 m × 1 m using the Grasshopper plug-in, as shown in Figure 4c. These point layers are consistent with the original box layers. The point cloud is then exported. The exported point cloud is in the format XYZRGBc, where XYZ are the coordinates of the point cloud, RGB is the color of the point cloud, and c is the label. These point clouds with color labels are then exported to a txt file, the encoding format is UTF-8, and the exported txt point cloud file is used as the point cloud dataset for subsequent neural network training. The functional zoning is divided into eight categories, which cover the main functional areas of the metro station and are simplified to a certain extent. For example, the space of entrances and exits is simplified to serve only as the spatial identification of entrances and exits, and no more entrance and exit corridors are added. This is because the regularity of these corridors themselves is too difficult to generalize.
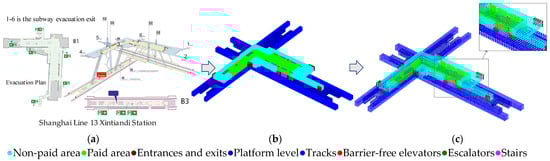
Figure 4.
Schematic diagram showing the pre-processing process for obtaining cloud data on subway stations. (a) Functional zoning plan of a subway station. (b) Box volume model. (c) Subdivided point cloud of the volume surface.
In this paper, the point cloud is exported based on a single subway station. Each subway station model has a corresponding txt file. The entire data-processing process is shown in Figure 4. Overall, 618 txt files are obtained as training datasets.
2.3.3. Enhanced Processing of Datasets
For deep learning operations, the training accuracy may not meet expectations due to the small amount of data. Therefore, pre-processing the dataset is particularly important. This article uses provider.py for data augmentation. Dataset enhancement is a typical means of pre-processing data in the process of learning and computing. Its principle is to expand the amount of data using manual data editing. The advantage of this processing method is to improve the efficiency of recognition and reduce the cost of data acquisition. In addition to dataset enhancement, data skew is also commonly used. Data skew means that when the difference between samples is large, the skewness of low-sample data is increased. For point cloud data processing, commonly used data enhancement methods include rotation, adding noise, downsampling, and different degrees of occlusion.
2.4. Training the Neural Network
Brief Description of the Training Steps for the Dataset
The PointNet++ model is a semantic segmentation of panoramic point clouds, and each point cloud data needs to be segmented. The specific use process and strategy are as follows:
(1) Place the original data in the data/old_data folder and run data_process.py, and the data that can be used for training and testing will be automatically generated under data/data/.
(2) Run data_utils/S3DISDataLoader.py to observe the dataset loading strategy and whether it is normal.
(3) Run train_semseg.py for training, and the obtained model is stored in the logs/sem_seg/logs/folder.
(4) Run test_semseg.py to make predictions, and the obtained prediction results are stored in the logs/sem_seg/logs/folder. That is, Ground Truth and Predict.
3. Results
3.1. Dataset Training
A brief description of the PointNet++ network training strategy is that the dataset is loaded and scaled to a 20 × 20 × 20 area, the block_size is set to 10 according to experience, and the sample_rate is 1. This means that all point cloud data in the 20 × 20 × 20 area will have a size of 10 × 10 and be randomly sampled, and the point cloud data from the area with num_points = 4096 points is obtained and then sent for network training with a batch_size of 8. Here, the sampling strategy can be changed. For example, if the block_size is changed to be more precise and if the num_points is changed to a larger number, there will be a higher number of points. These two modifications can express features more comprehensively, and at the same time, they can improve the accuracy of the model. The specific values need to be tested and modified.
The parameters at the beginning of training are set to batch_size = 8, decay_rate = 0.0001, epoch = 200, learning_rate = 0.001, lr_decay = 0.7, model = ‘Pointnet++ 2_sem_seg’, npoint = 4096, optimizer = ‘Adam’, and step_size = 15. During training, two parameters, training mean loss and training accuracy, are detected. The initially formed parameter, epoch = 200, uses a complete dataset as a sample, and the round-trip calculation of the sample using the neural network means that an epoch is formed. In other words, these data samples form two forward and reverse propagations in the global neural network. During the actual training, the best MIoU is reached in the 165th round, and then the calculation is stopped. Changes in the training mean loss and training accuracy data during the complete calculation process are shown in Figure 5.
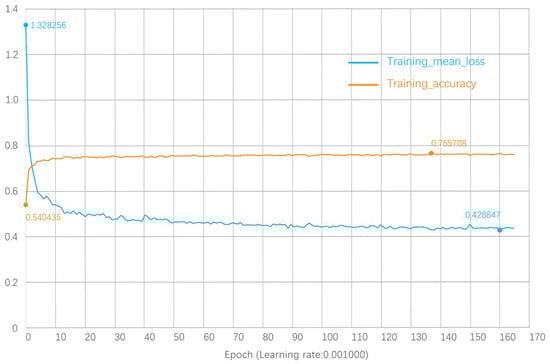
Figure 5.
Variation curves for training mean loss and training accuracy.
It can be seen from Figure 5 that the training mean loss reached a relatively stable value during the 50th round of training and reached a minimum value of 0.428847 during the 160th round of training. The training accuracy reached a relatively stable value during the 30th round of training and reached a maximum value of 0.765708 during the 137th round of training. That is, the optimal value of training accuracy was 76.57%, which also shows that the training process is better and that the value for the training accuracy reached a higher level.
3.2. Comparison and Analysis of Forecast Results
3.2.1. Prediction
The strategy of PointNet++ network prediction is different from the training strategy. The test needs to load all the data for prediction instead of random sampling. It also needs to be scaled to 20 × 20 × 20, and the block_size needs to be set to 10.0. Furthermore, stride = block_size/2 = 5, and stride is usually set to half of the block_size. The strategy is to finely sample all the data in the dataset. The points in each area are covered. The final generated point cloud is sent to the network for prediction, and the prediction results are established in five rounds. The round with the highest prediction probability is the real point cloud classification category, so the way of voting can increase the accuracy.
3.2.2. Analysis of Prediction Results
The final training results are output as two obj model files and one txt prediction classification point cloud file. The two obj point clouds are Ground Truth and Predict, which are the true and predicted values, respectively. Visualization can be performed using software platforms such as MeshLab or Rhinoceros. Given that MeshLab can complete the visualization of points and surfaces more continuously, MeshLab software was chosen in this paper for post-prediction visualization. In total, 61 pieces of data were selected for testing in 618 datasets with 9:1 for prediction, and those with certain complexity and representativeness were selected for visualization, as shown in Figure 6.
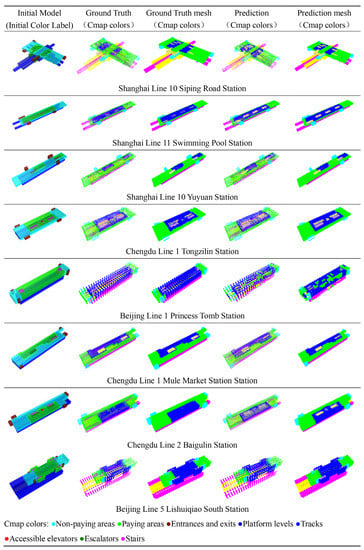
Figure 6.
Comparison of Ground Truth and Predict results.
From Figure 6, we can intuitively see that Ground Truth and Predict are highly compatible, which means that the model was trained successfully. On the other hand, it also shows that the subway station building type has some stable design logic and spatial characteristics that can be searched using the model.
From the visualization comparison between Ground Truth and Predict, we can see that the trained model, with certain intelligence, not only presents the volume of each partition in Predict, which is basically the same as in Ground Truth, but also automatically strengthens certain features, such as Shanghai Line 11 Swimming Pool Station, Chengdu Line 1 Tongzilin Station, and Chengdu Line 2 Baigoulin Station. Predict amplifies the volume of the traffic core, while the actual situation in Ground Truth is that the traffic core is not obvious, which is an interesting phenomenon, indicating that PointNet++ thinks the traffic core needs to be reinforced. This is entirely the result of the model self-learning after a large amount of data training. However, in the case of Beijing Line 1 Princess Tomb Station, Predict shows poor results, with interlocking paid and non-paid zones, confusion at the platform level and tracks, and confusion in the traffic core, but this is still in place. Secondly, the reason for the unsatisfactory prediction results of Beijing Line 1 Princess Mound Station may be related to the special characteristics of Beijing Metro Line 1, where there are only two large steps as traffic spaces and non-paying areas on both sides. However, the vast majority of metro stations have two or three traffic spaces in the center, so the analysis is due to the fact that there are too few of these metro stations in the dataset, resulting in the neural network not learning these characteristics.
Another point to note is that theoretically, model training does not vary depending on whether the metro station is complex or not or whether it is a side platform, island, side hybrid station, platform-island platform, or a more complex interchange station. All types can be learned by the model. For example, Shanghai Line 10 Siping Road Station is an interchange station, but Predict still shows high prediction quality. This shows that the training process for this model is relatively complete and comprehensive.
4. Discussion
4.1. Fitting
Fit can also be understood as a generalization ability. Usually, the dataset is divided into three parts: training dataset, validation dataset, and test dataset. The loss of the training dataset and the loss of the validation dataset are used as the basis for the diagnostic model, and the parameters are trained to obtain an optimized model, which means a better performance in the test set, i.e., a stronger generalization ability.
The loss function is calculated to obtain the difference between the predicted and true values of the model. First, a benchmark is needed to facilitate optimizing the parameters of the training mechanism, and then the parameters with the highest accuracy in the full domain network are sought on such a basis. In other words, the loss function is used to limit the steps of the model in a convergent manner during the computation and training process. Currently, the means of computational implementation of the loss function include the algorithm of mean squared difference and the cross-entropy algorithm, and their computational results show a negative correlation with the accuracy of the model.
Classified by the externalization performance of the model, model fit is divided into the following three categories in total: underfitting, overfitting, and perfect fitting. During the training process of the model, it is theoretically necessary to obtain a perfect-fit model; however, in the actual operation process, under-fit models and over-fit models are generated. In this case, the curve change in the loss function is used as the basis of judgment to determine which of the above three categories of models best represents the current model.
First, there is the change law of the loss function curve in the underfitting state. The underfitting state means that a model is at a relatively poor level of learning for the training set, as shown in Figure 7a, which is a typical example of underfitting. The model is not yet learning based on the training set. Figure 7b also represents the underfitting state, which is characterized by the training loss continuing to fall at the end of training, indicating that there is still room for learning and that the model ends before it has time to learn.
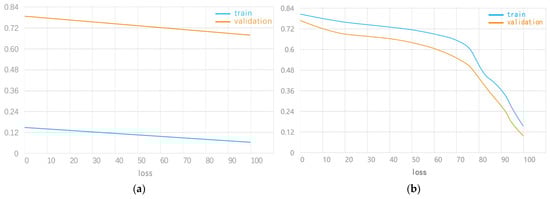
Figure 7.
(a) Underfitting state curve 1 and (b) underfitting state curve 2.
The second is the law of change in the loss function curve in the overfitting state. The overfitting state means that a model is learning using the training set at a level beyond the standard state, and the noise and random fluctuations are also integrated during the learning process, which is more common. The overfitting state is sometimes associated with the model being trained for too long. Take Figure 8a as an example, according to the current training loss function, it is obvious that the training loss value is in a state of continuous decrease. The validation loss value decreases to a certain node and enters a state of increase, which means that the training of the model should be cut off at this node.
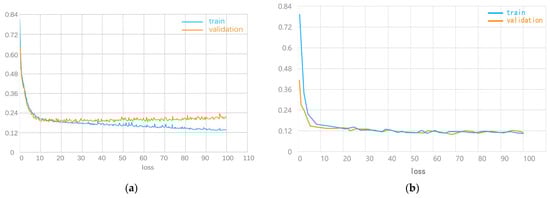
Figure 8.
(a) Overfitting state graph and (b) perfect fit state graph.
Finally, perfect fit means that the model learns to a perfect level using the training set, which is the development goal of the model, and the difference between the two measurement values in the loss curve is extremely fine. Taking Figure 8b as an example, according to the current training loss function, it is obvious that after 20 integrations, the curves of the two measurement values gradually converge, and the gap becomes smaller and smaller. In most cases, the value of training loss will be lower, and the difference between the two will be generated. This is called the generalization gap.
Therefore, when training the model, both the training mean loss curve and eval mean loss curve need to be displayed on a graph (as shown in Figure 9), so that it is easy to observe whether the network training situation is overfitting, underfitting, or perfectly fitting.
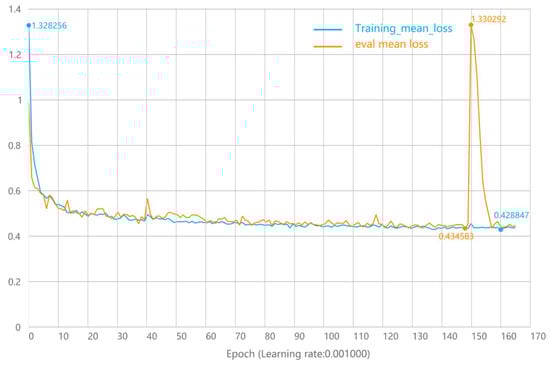
Figure 9.
Variation curves of training mean loss and eval mean loss.
As seen in Figure 9, the training mean loss curve and the eval mean loss curve have the same trend and are both decreasing evenly, indicating that the network is still learning. The training mean loss is relatively lower than the eval mean loss, and both tend to be smooth, which indicates that the network is well-trained and highly robust. During the 150th round of training, the eval mean loss fluctuates significantly, which is obviously due to the problem of data in the test set, such as the space of individual subway stations being too complex or the form being too novel, and there is no similar data in the training set. Overall, the model reached a good fit standard, and the model training achieved a perfect fit.
4.2. Analysis of the Best MIoU, Eval Point Avg Class IoU, and IoU Results for Each Class
The overlap degree IoU is called the intersection-to-merge ratio, and as the name suggests, IoU calculates the ratio of the intersection and the merge of the “predicted range A” and the “true range B”. It has been used in semantic segmentation as a standard measure of average accuracy. The intersection-to-merge ratio is not only used in semantic segmentation but is also one of the commonly used metrics in the direction of target detection, etc. The calculation formula can be expressed as:
The mean intersection and ratio mIoU (mean IoU) are obtained by accumulating the IoU for each class that is calculated based on class and then averaging it, which is the global-based evaluation. The calculation formula can be expressed as follows:
where pij denotes the number of true values for i that are predicted to be j. K + 1 is the number of categories (including the empty category). pii is the true number. pij and pji denote the false positive and false negative, respectively.
From the analysis in Figure 10, we can see that the best mIoU showed a steady and slow increase after the 10th round and reached 0.6+. The IoU for the eight classes fluctuated, but the overall trend was still gradually increasing, indicating that the learning process was still going on normally.
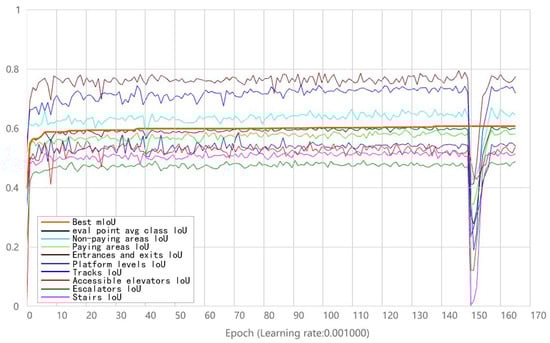
Figure 10.
Best mIoU, eval_point_avg_class_IoU, and IOU for each class.
According to the label color of each class, it can be seen that the IoU of entrance/exit and track space in the subway station is higher. The morphology and spatial location of the entrance/exit and track space are relatively stable and relatively independent. Thus, the entrance/exit is not affected by other functional partitions, and the track partition is not affected by traffic space, which is less interspersed and easy for the model to learn the features. The IoU values of the pay area, non-pay area, and platform level are in the middle; the reason for this is that their spatial location is relatively stable. While the spatial morphology changes more, more data training is needed to improve the IoU, and the platform level space also belongs to the pay area space. The three classes with the lowest IoU values are vertical traffic space, accessible elevators, and escalators and stairs. One important reason for the low IoU values is that they span high floors and have more complex spatial characteristics and also because the location of vertical traffic spaces is not stable and not easily understood by the program. These differences are attributed to the different morphological and spatial location characteristics of each class, e.g., the IoU of the entrance/exit and track spaces is close to 0.8.
The analysis shows that the IoU for each functional space is closely related to its own characteristics, and the IoU from high to low are the entrance, track, non-paying area, paying area, platform level, barrier-free elevator, and stairs and escalator. The ones interspersed with other partitions are in the middle, such as the paid area, non-paid area, and platform level, and the three non-paid areas have the lowest possibility of being spatially crossed, so the IoU is also the highest among these three. The last one is the traffic space, which is almost bound to be crossed with other spaces, so its value is lower. Since the internal process of the neural network cannot be accurately grasped, the authors believe that the lower IoU for the three traffic cores may also be caused by the fact that their spatial extent is more specific to the z-axis.
4.3. Analysis of Best MIoU, Eval Point Avg Class IoU, and IoU Results for Each Class
Accuracy in deep learning refers to the accuracy rate, i.e., the ratio of the number of correctly predicted samples to the total number of predicted samples. It does not consider whether the predicted samples are positive or negative cases. The calculation formula is expressed as:
TP (true positive): predicted positive case; the actual case is positive.
FP (false positive): predicted positive case; the actual case is negative.
TN (true negative): predicted negative case; the actual case is negative.
FN (false negative): predicted negative case; the actual case is positive.
From Figure 11, we can see that the eval point avg class acc and eval accuracy tend to grow smoothly after the 15th training round, indicating that the program is still learning slowly. The former is higher than the latter in general, which is also consistent with the characteristics of the point cloud class. It is worth noting that the eval point avg class acc achieves 82.09% accuracy, and the eval accuracy also achieves 76.52% accuracy. The model was thus trained to have a high accuracy.
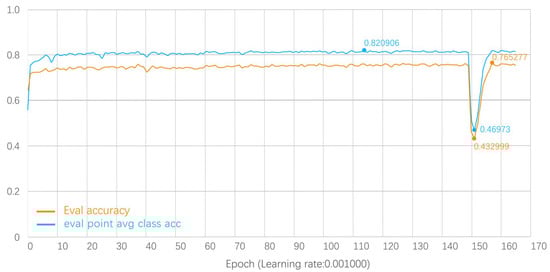
Figure 11.
Eval point avg class acc and eval accuracy curve.
5. Limitations
The first limitation of this study is related to the research object, which is a 3D point cloud of the subway station model. The point cloud comes from a subway station 3D model, which is not easy to obtain because a subway station 3D model is often a confidential file. Therefore, it is difficult to determine how to obtain a large number of 3D models of subway stations. The 618 models used in this paper come from secondary modeling of metro station plans. Because these are not the source files for the 3D model of the project, the realism of the secondary modeling cannot be fully guaranteed, and in addition, a large number of metro stations need to be modeled twice, which will produce a huge workload. If the source file models of metro stations can be analyzed and studied, or if the BIM models of metro station design can be added to this process, then both the quantity and quality will be improved qualitatively. The second limitation relates to the division and labeling of the functional space in the metro station which, in this paper, only involve eight kinds of space including non-paying areas, paying areas, entrances and exits, platform levels, tracks, accessible elevators, and escalators and stairs, which cover the main functional partitions of the metro station. Some auxiliary rooms, toilets, etc., are not added; the reason for this is that they are not universal. There are also smaller partition modules such as ticket offices and gates that are not added. If they can be further refined in subsequent studies, the modeling process will surely be more effective. In addition, this paper only deals with the study of functional partitioning of building space in subway stations. The research object is the point cloud of such general data, and the same method can be expanded to plumbing, heating and electricity, and other related professions. If other parts can also be added to expand the dataset in future studies, then artificial intelligence can be achieved for the entire professional design assistance of the subway station.
Regarding the overfitting problem mentioned in this paper, the main reasons could be the long training time and the result of high model complexity, insufficient data, and lack of regularization, which was discussed to some extent in this study.
In this paper, MIOU and accuracy are used as indicators of success, but there is no discussion of the impact of data diversity or potential bias in the data on the results of the study. Good performance on these metrics does not necessarily guarantee good model generalization, and further work is needed to find other metrics that are more suitable for point cloud data evaluation.
Finally, the visualization of the prediction-generated model involved in this paper mainly uses MeshLab for the transformation of point clouds to mesh. Relative to the architectural model, the details are insufficient, and if the point cloud can be transformed into a fine metro station model, then this deep learning framework will be more genuine and down-to-earth for architect assistance.
6. Conclusions
The aim of this study is to investigate the automatic division of the functional zoning of metro station building space using deep learning technology in order to realize the design assistance that deep learning can bring to the pre-design work of metro stations. Although, there is still a lot of room for improvement and optimization of this assistance effect. Combining the training and prediction results, the following conclusions can be drawn.
The first step is to verify the feasibility of spatial deep learning for buildings in the form of point clouds as data. This paper uses a 3D point cloud to express 3D spatial features, abandoning the previous 2D data form. This ensures the authenticity of the training set and the visibility of the prediction results from the data form level, greatly increasing the meaning and value of deep learning research at the architectural space level. The segmentation and prediction based on PointNet++ still result in the point cloud form, which shows that the point cloud data form not only has better fidelity and generality but also is fully compatible with deep learning PointNet++, with good fidelity to maintain the complete transmission and representation of the data stream. Thus, the design thinking at each stage can be maintained and transmitted, even though they are all “built in” to the parameters of the neural network. Generality ensures end-to-end coherence, starting with point cloud data and ending with point cloud data as the final output, with fewer data format transformations to preserve as much information as possible.
The next step is to verify the effectiveness of PointNet++ for semantic segmentation and prediction of point cloud information on subway stations. After experimental validation, the results show that overall, in the condition of 20 × 20 × 20 size space with a block_size of 10.0, the training prediction data of 9:1 have 60% + MIOU (mean intersection ratio of mean IoU) and 75% + accuracy in the limited 618 subway stations. The neural network operations of the model data already have more excellent values. The datasets used in this paper are all produced by the authors, and the data augmentation code is also used to expand the data in order to meet the huge data volume of deep learning. Under such experimental conditions, better MIOU and accuracy are achieved.
Finally, with the support of a large number of training sets and algorithmic training, the computer directly generates 3D metro station spatial layout design models based on some basic point cloud ranges for architects and various participants to refer to in the pre-design stage. This study discusses AI and architectural design at the 3D data level. However, based on the complexity of architectural design, more dimensional testing, validation, and customization to specific contexts are needed to achieve more extensive and solid practical applications.
Author Contributions
Conceptualization: J.A. and J.Z.; methodology: J.A. and M.M.; formal analysis: J.A. and J.Z.; investigation: J.A.; resources: M.M.; writing—original draft: J.A.; writing—review and editing: J.A. and J.Z. All authors have read and agreed to the published version of the manuscript.
Funding
This research received no external funding.
Institutional Review Board Statement
This study was conducted in accordance with the Declaration of Helsinki and approved by the Ethics Committee of the School of Architecture, Northeastern University.
Data Availability Statement
The data that support the findings of this study are available from the corresponding author, upon reasonable request.
Acknowledgments
We are very grateful to the students and teachers who provided the means and ideas for collecting information on subway stations.
Conflicts of Interest
The authors declare no conflict of interest.
Abbreviation
| CNN | convolutional neural network |
| GAN | generative adversarial network |
| cGAN | conditional generative adversarial network |
| DCGAN | deep convolutional generative adversarial network |
| GCN | graph convolutional network |
| FCN | fully convolutional network |
| AI | artificial intelligence |
| CAD | computer aided design |
| VAEs | variational auto-encoders |
| ResNet | residual network |
| Py | Python |
| GPU | graphic processing unit |
| MSG | multi-scale grouping |
| MRG | multi-resolution grouping |
| IoU | intersection over union |
| Acc | accuracy |
| MIoU | mean intersection over union |
| KNN | k-nearest neighbor |
| BIM | building information modeling |
References
- Zheng, H.; An, K.; Wei, J.; Ren, Y. Apartment Floor Plans Generation via Generative Adversarial Networks. In Proceedings of the RE: Anthropocene, Design in the Age of Humans: Proceedings of the 25th International Conference on Computer-Aided Architectural Design Research in Asia (CAADRIA 2020), Chulalongkorn University, Bangkok, Thailand, 5–8 August 2020. [Google Scholar]
- Eisenstadt, V.; Langenhan, C.; Althoff, K.-D. Generation of Floor Plan Variations with Convolutional Neural Networks and Case-Based Reasoning—An Approach for Unsupervised Adaptation of Room Configurations within a Framework for Support of Early Conceptual Design. In Proceedings of the eCAADe and SIGraDi Conference, Porto, Portugal, 11–13 September 2019. [Google Scholar]
- Nauata, N.; Hosseini, S.; Chang, K.-H.; Chu, H.; Cheng, C.-Y.; Furukawa, Y. House-gan++: Generative adversarial layout refinement network towards intelligent computational agent for professional architects. In Proceedings of the IEEE/CVF Conference on Computer Vision and Pattern Recognition, Nashville, TN, USA, 20–25 June 2021. [Google Scholar]
- Radford, A.; Metz, L.; Chintala, S. Unsupervised representation learning with deep convolutional generative adversarial networks. arXiv 2015, arXiv:1511.06434. [Google Scholar]
- Isola, P.; Zhu, J.-Y.; Zhou, T.; Efros, A.A. Image-to-image translation with conditional adversarial networks. In Proceedings of the IEEE Conference on Computer Vision and Pattern Recognition, Honolulu, HI, USA, 21–26 July 2017. [Google Scholar]
- Wang, T.-C.; Liu, M.-Y.; Zhu, J.-Y.; Tao, A.; Kautz, J.; Catanzaro, B. High-resolution image synthesis and semantic manipulation with conditional gans. In Proceedings of the IEEE Conference on Computer Vision and Pattern Recognition, Salt Lake City, UT, USA, 18–23 June 2018. [Google Scholar]
- Kim, J.S.; Song, J.Y.; Lee, J.K. Approach to the extraction of design features of interior design elements using image recognition technique. In Proceedings of the 23rd International Conference on Computer-Aided Architectural Design Research in Asia: Learning, Prototyping and Adapting, CAADRIA 2018, Beijing, China, 17–19 May 2018. [Google Scholar]
- Cho, D.; Kim, J.; Shin, E.; Choi, J.; Lee, J.K. Recognizing architectural objects in floor-plan drawings using deep-learning style-transfer algorithms. In Proceedings of the 25th International Conference on Computer-Aided Architectural Design Research in Asia, CAADRIA 2020, Bangkok, Thailand, 5–8 August 2020. [Google Scholar]
- Zheng, H.; Ren, Y. Machine Learning Neural Networks Construction and Analysis in Vectorized Design Drawings. In Proceedings of the 25th International Conference on Computer-Aided Architectural Design Research in Asia, CAADRIA 2020, Bangkok, Thailand, 5–8 August 2020. [Google Scholar]
- Wu, W.; Fu, X.-M.; Tang, R.; Wang, Y.; Qi, Y.-H.; Liu, L. Data-driven interior plan generation for residential buildings. ACM Trans. Graph. 2019, 38, 1–12. [Google Scholar] [CrossRef]
- Hu, R.; Huang, Z.; Tang, Y.; Van Kaick, O.; Zhang, H.; Huang, H. Graph2plan: Learning floorplan generation from layout graphs. ACM Trans. Graph. 2020, 39, 111–114. [Google Scholar] [CrossRef]
- Kim, S.; Park, S.; Kim, H.; Yu, K. Deep Floor Plan Analysis for Complicated Drawings Based on Style Transfer. J. Comput. Civ. Eng. 2021, 35, 04020066. [Google Scholar] [CrossRef]
- Dodge, S.; Xu, J.; Stenger, B. Parsing floor plan images. In Proceedings of the 2017 Fifteenth IAPR International Conference on Machine Vision Applications (MVA), Nagoya, Japan, 8–12 May 2017. [Google Scholar]
- Uzun, C.; Olakolu, M.B. Architectural Drawing Recognition A case study for training the learning algorithm with architectural plan and section drawing images. In Proceedings of the 37th eCAADe and 23rd SIGraDi Conference, University of Porto, Porto, Portugal, 11–13 November 2019. [Google Scholar]
- Yoshimura, Y.; Cai, B.; Wang, Z.; Ratti, C. Deep learning architect: Classification for architectural design through the eye of artificial intelligence. arXiv 2019, arXiv:1812.01714. [Google Scholar]
- Peng, W.; Zhang, F.; Nagakura, T. Machines’ Perception of Space: Employing 3D Isovist Methods and a Convolutional Neural Network in Architectural Space Classification. In Proceedings of the 37th Annual Conference of the Association for Computer Aided Design in Architecture (ACADIA), Cambridge, UK, 2–4 November 2017. [Google Scholar]
- Wang, Z.; Liang, Q.; Duarte, F.; Zhang, F.; Charron, L.; Johnsen, L.; Cai, B.; Ratti, C. Quantifying Legibility of Indoor Spaces Using Deep Convolutional Neural Networks: Case Studies in Train Stations. Build. Environ. 2019, 160, 106099. [Google Scholar] [CrossRef]
- Han, Y.; Lee, H. A deep learning approach for brand store image and positioning. In Proceedings of the 25th International Conference of the Association for Computer-Aided, Architectural Design Research in Asia, Bangkok, Thailand, 5–8 August 2020. [Google Scholar]
- Xia, N. Development of a System for Assessing the Quality of Urban Street-Level Greenery Using Street View Images and Deep Learning. Urban For. Urban Green. 2021, 59, 126995. [Google Scholar] [CrossRef]
- Qi, C.R.; Su, H.; Mo, K.; Guibas, L.J. Pointnet: Deep learning on point sets for 3d classification and segmentation. In Proceedings of the IEEE Conference on Computer Vision and Pattern Recognition, Honolulu, HI, USA, 21–26 July 2017. [Google Scholar]
- Qi, C.R.; Yi, L.; Su, H.; Guibas, L.J. Pointnet++: Deep hierarchical feature learning on point sets in a metric space. Adv. Neural Inf. Process. Syst. 2017, 30, 5105–5114. [Google Scholar]
Disclaimer/Publisher’s Note: The statements, opinions and data contained in all publications are solely those of the individual author(s) and contributor(s) and not of MDPI and/or the editor(s). MDPI and/or the editor(s) disclaim responsibility for any injury to people or property resulting from any ideas, methods, instructions or products referred to in the content. |
© 2023 by the authors. Licensee MDPI, Basel, Switzerland. This article is an open access article distributed under the terms and conditions of the Creative Commons Attribution (CC BY) license (https://creativecommons.org/licenses/by/4.0/).