
Increase of Trichoderma harzianum Production Using Mixed-Level Fractional Factorial Design
 ,
,  , and
, and
Abstract
:1. Introduction
- Air. Occasional aeration allows good growth and sporulation of the fungus. Concentrations of carbon dioxide in the air higher than 10–15%, a product of cellular respiration, inhibit growth [21];
- Humidity. The amount of water that permeates the environment where the fungus develops is another key characteristic [22]. Trichoderma presents a low level of osmotic tolerance; an excess of humidity lowers the availability of oxygen, limiting the development of the fungus, and compacting the substrate, preventing their full colonization. On the other hand, low humidity inhibits the development of fungus by limiting the mobility of nutrients [23];
- Temperature. This magnitude, referring to the notion of heat, impacts the physiology of fungal growth and is evidenced by the inhibition in the elongation of the hypha, the decrease in the germination of the conidia, and the formation of the germinal tube. For this reason, this factor limits the development of microorganisms [22];
- pH. The measure of acidity or alkalinity is important for Trichoderma species; however, they are not demanding in relation to the pH of the substrate. They can grow in a wide pH range [24];
- Substrate. Any solid material other than soil in situ, natural, synthetic, residual, mineral, or organic, which, placed in a container, in pure form, or in a mixture, allows the anchorage of the root system [25].
1.1. Mixed-Level Fractional Factorial Designs
1.2. Characteristics Factor for the Production of Spores of the Trichoderma harzianum
1.3. Production Process of Trichoderma harzianum
2. Methodology
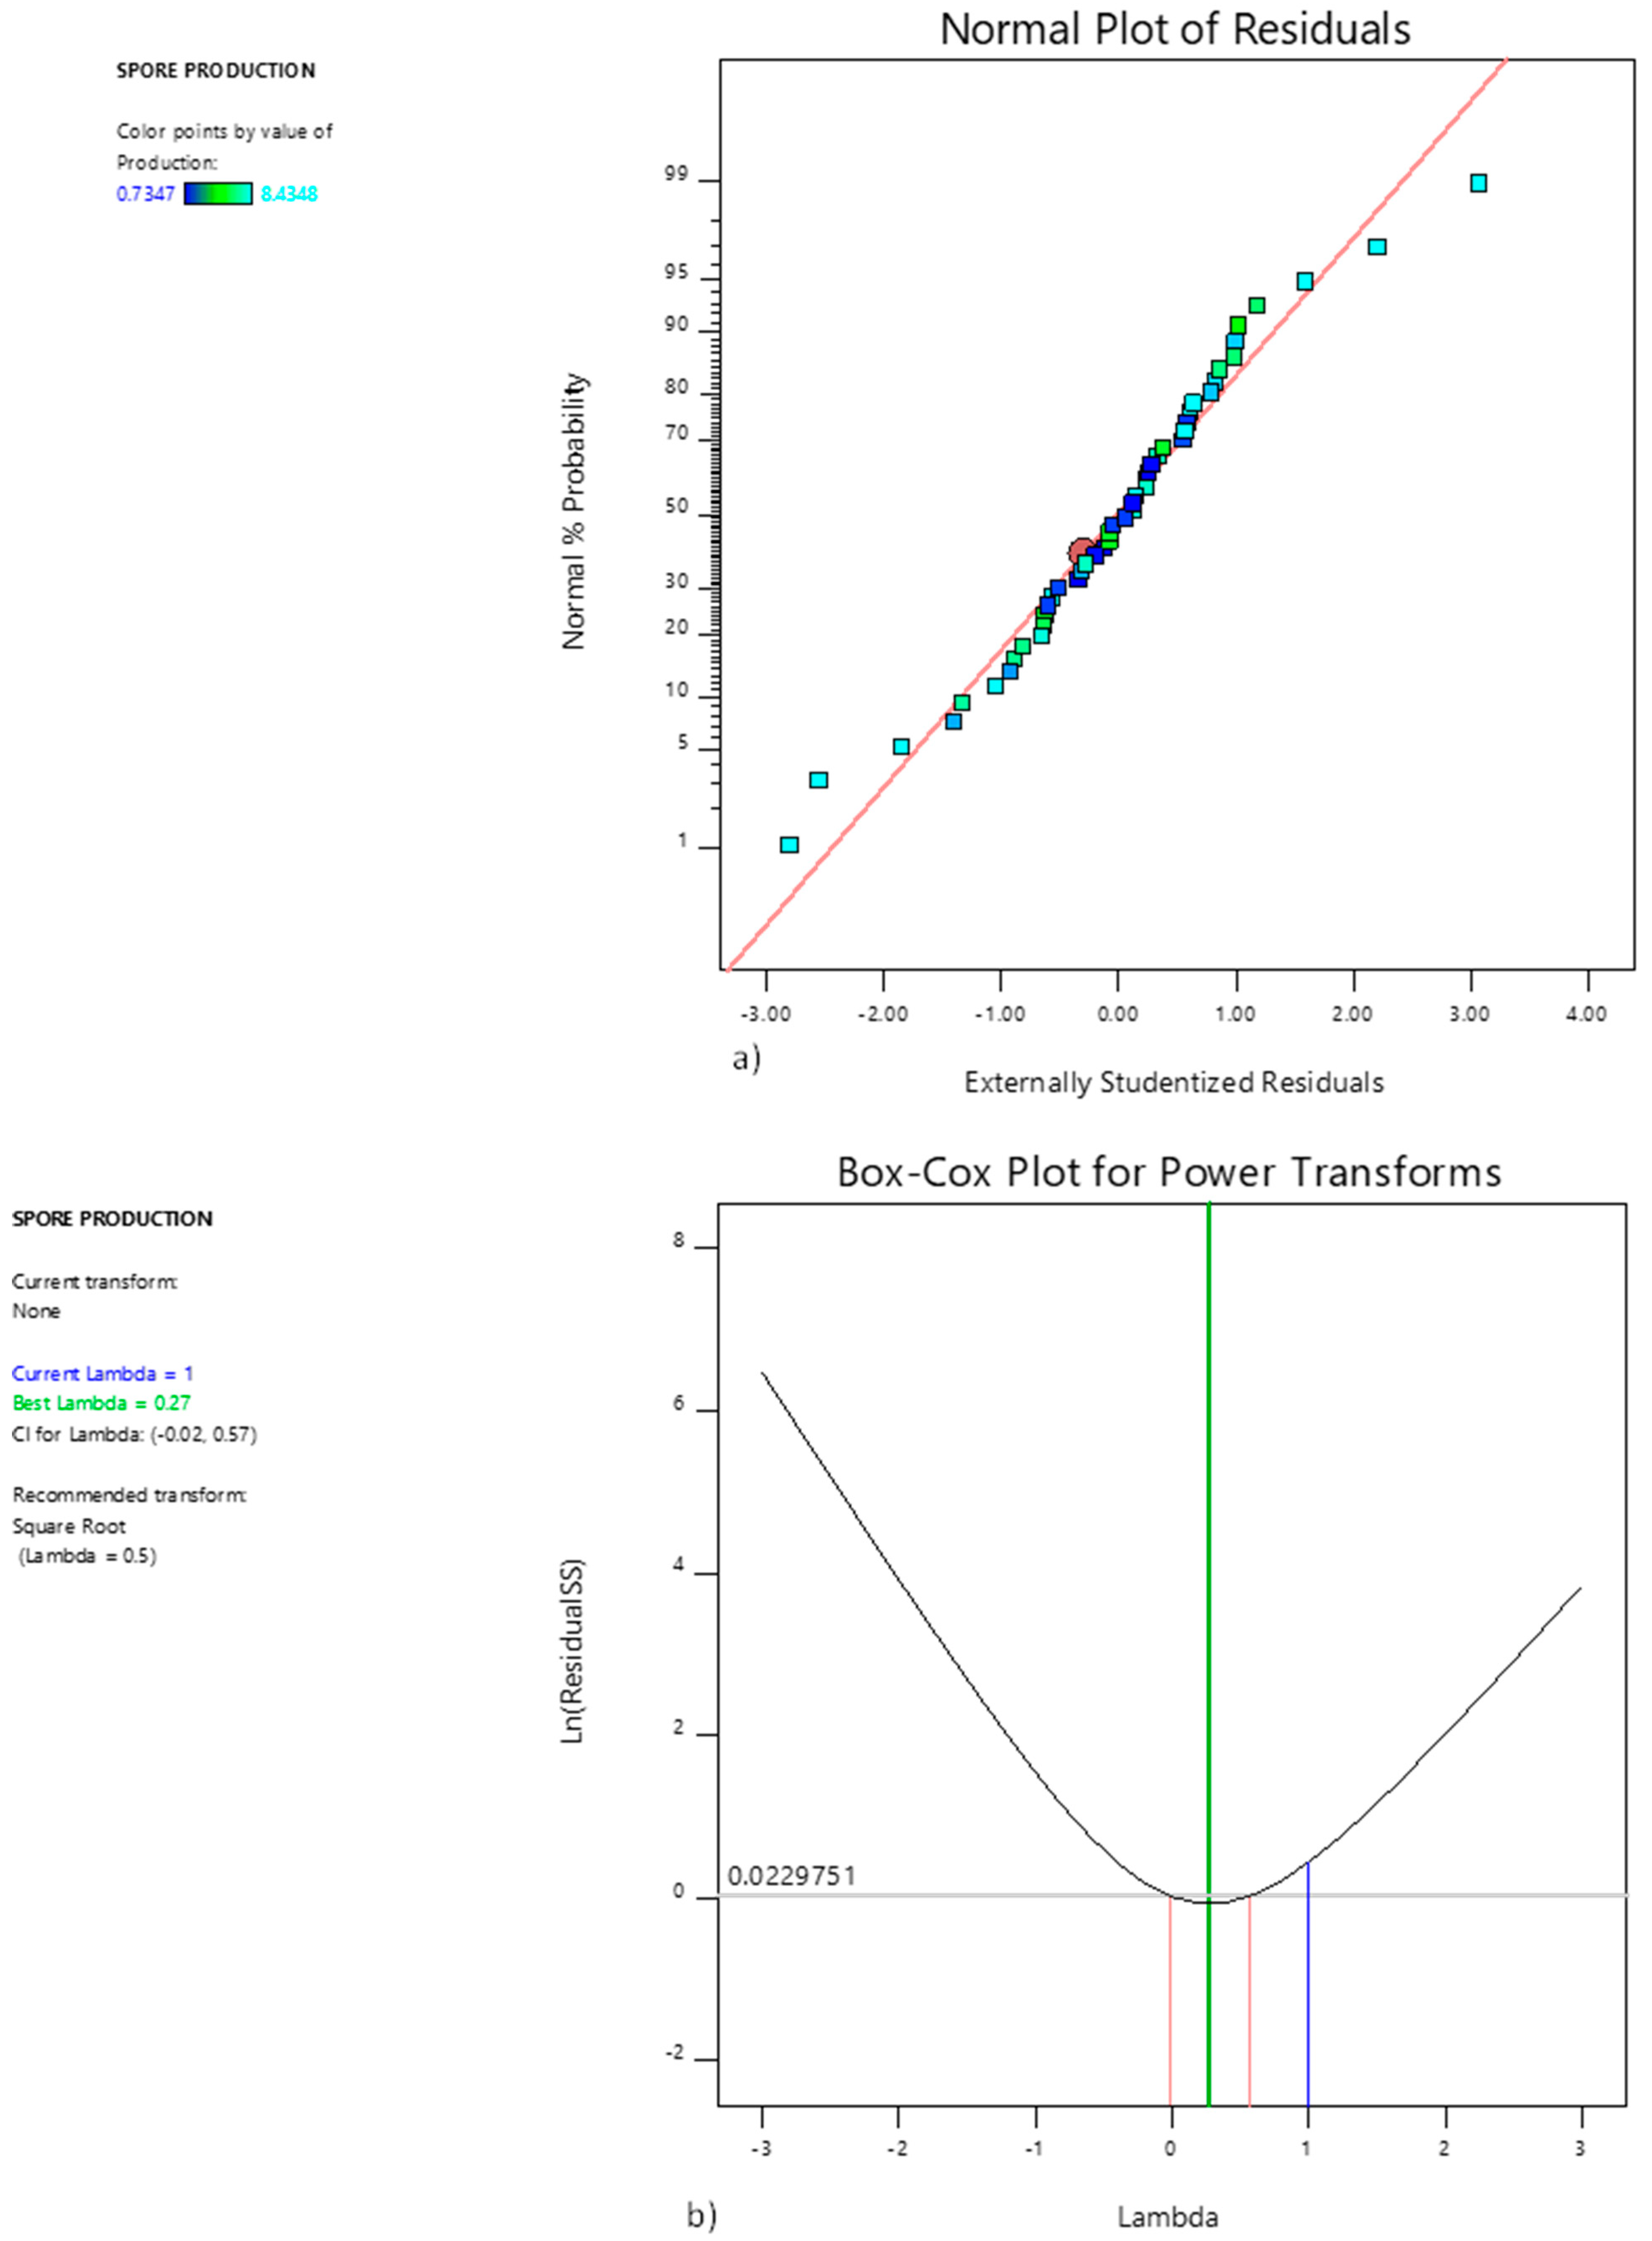
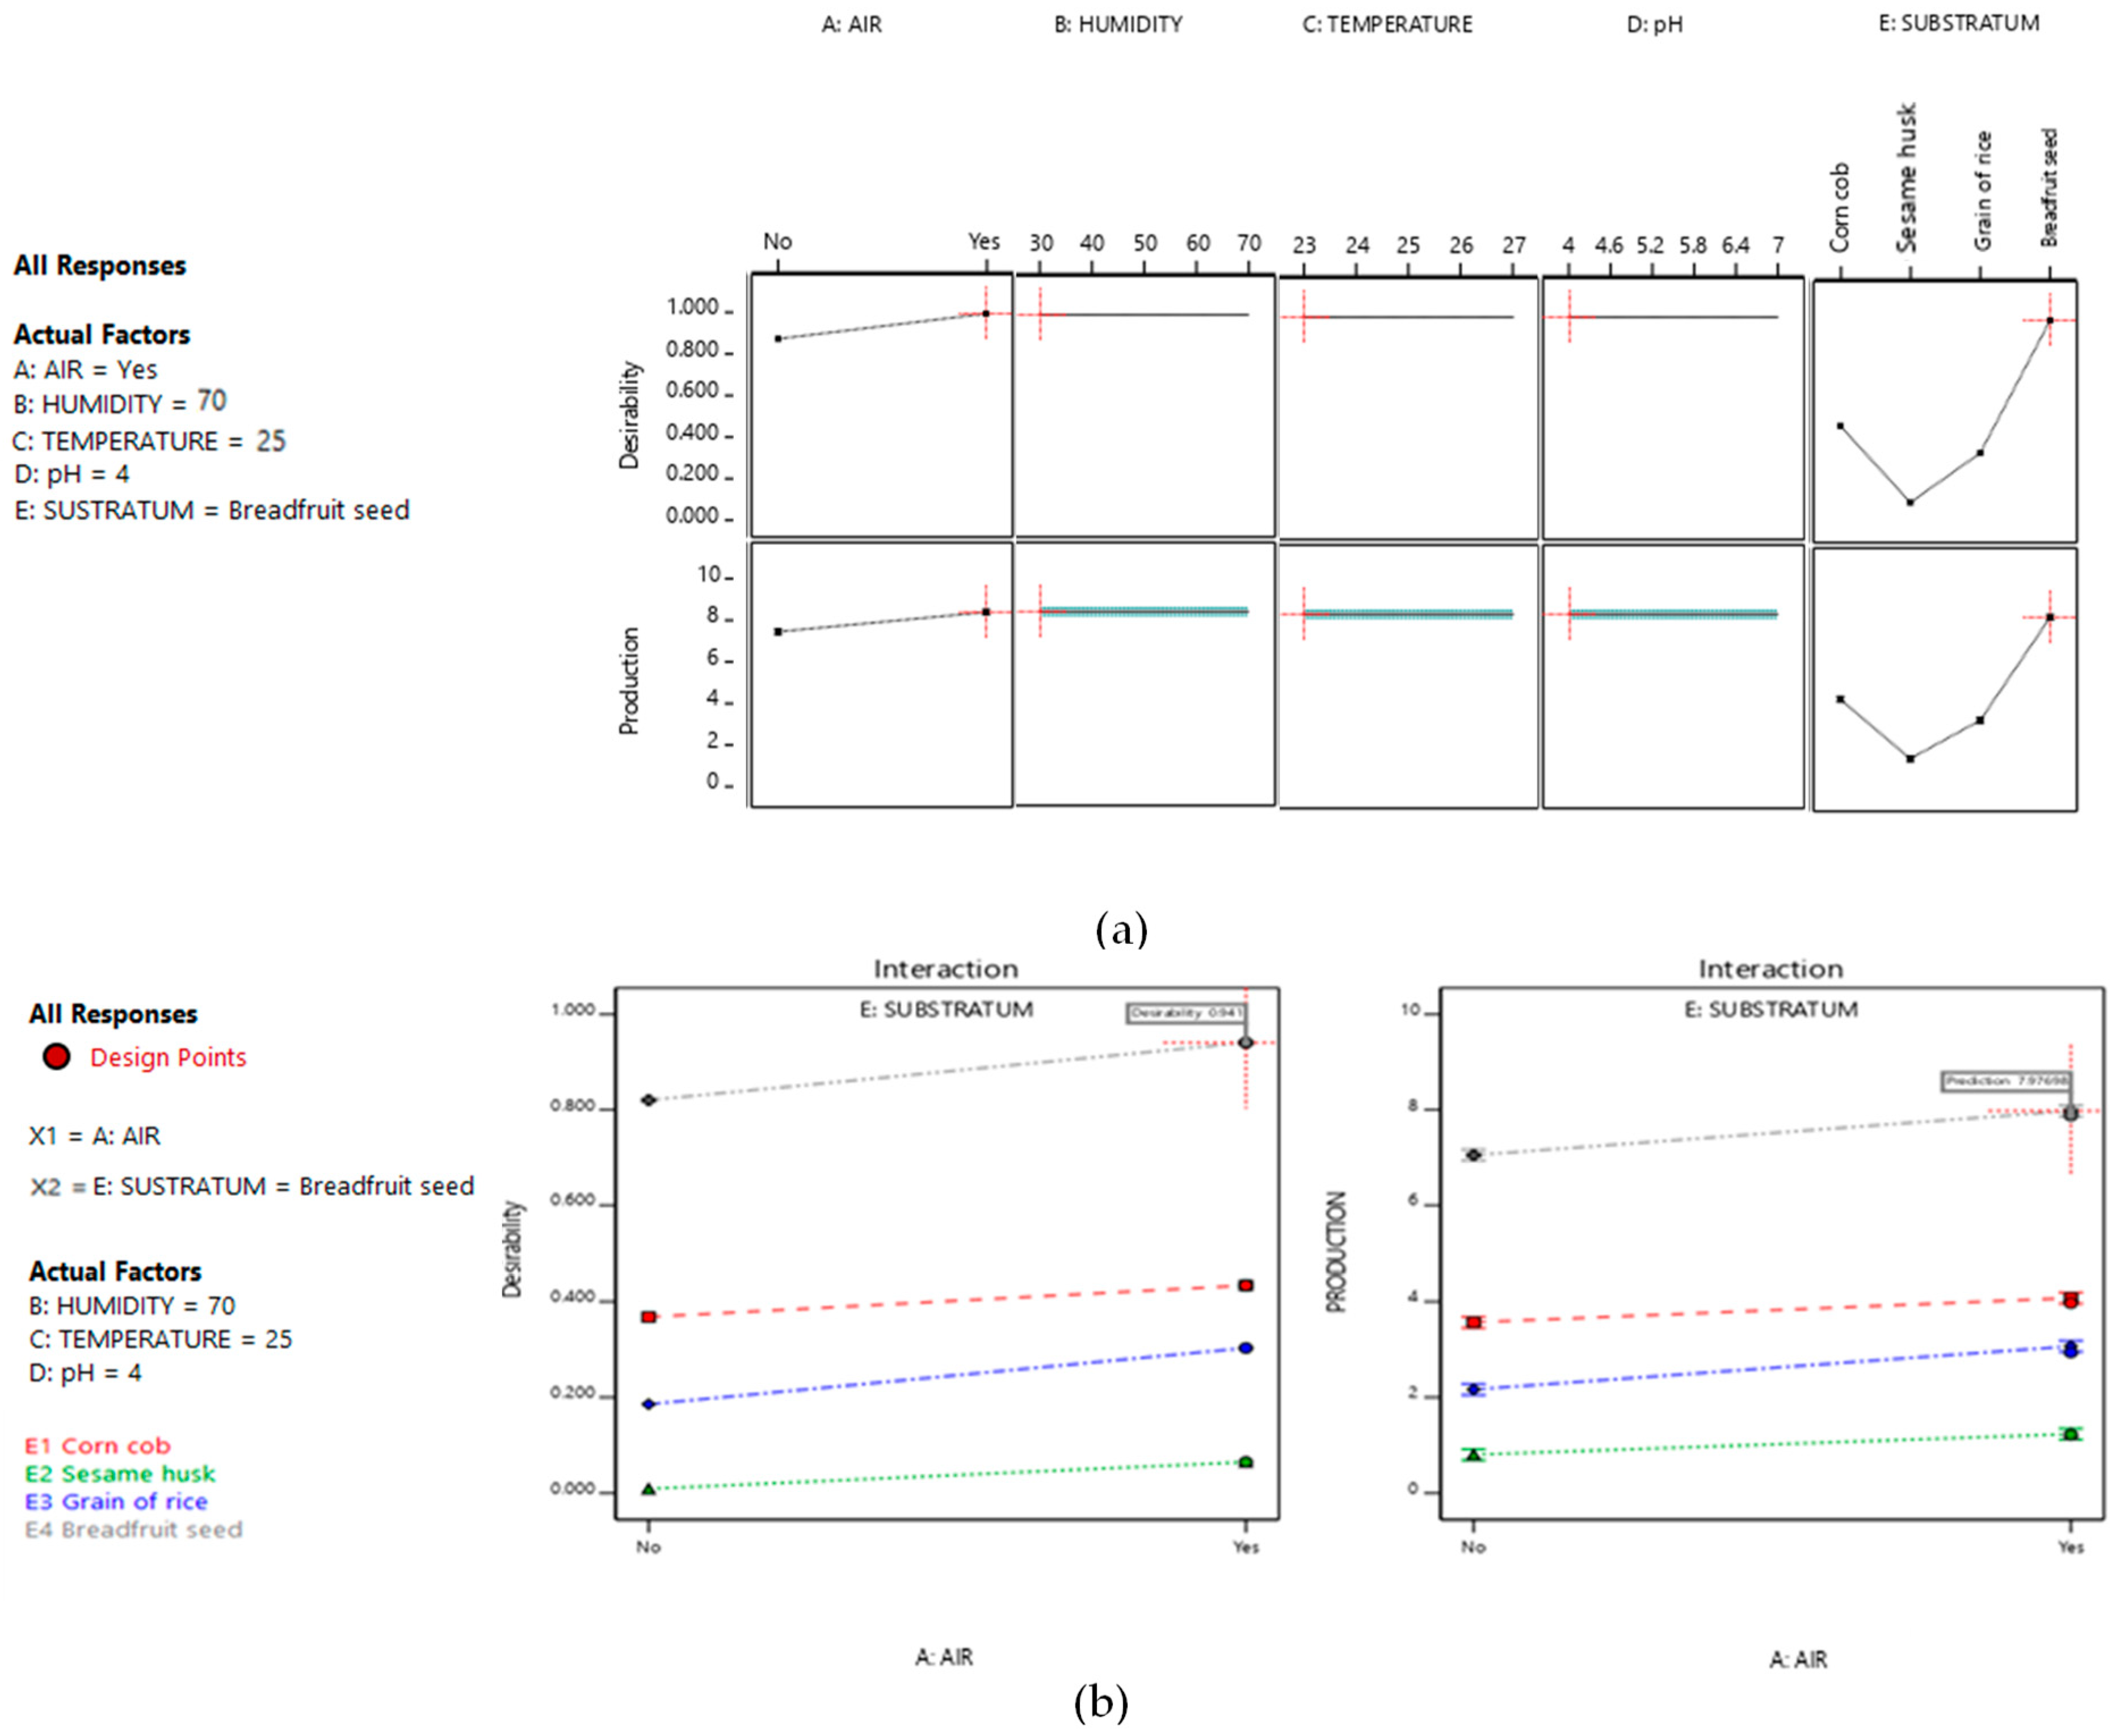
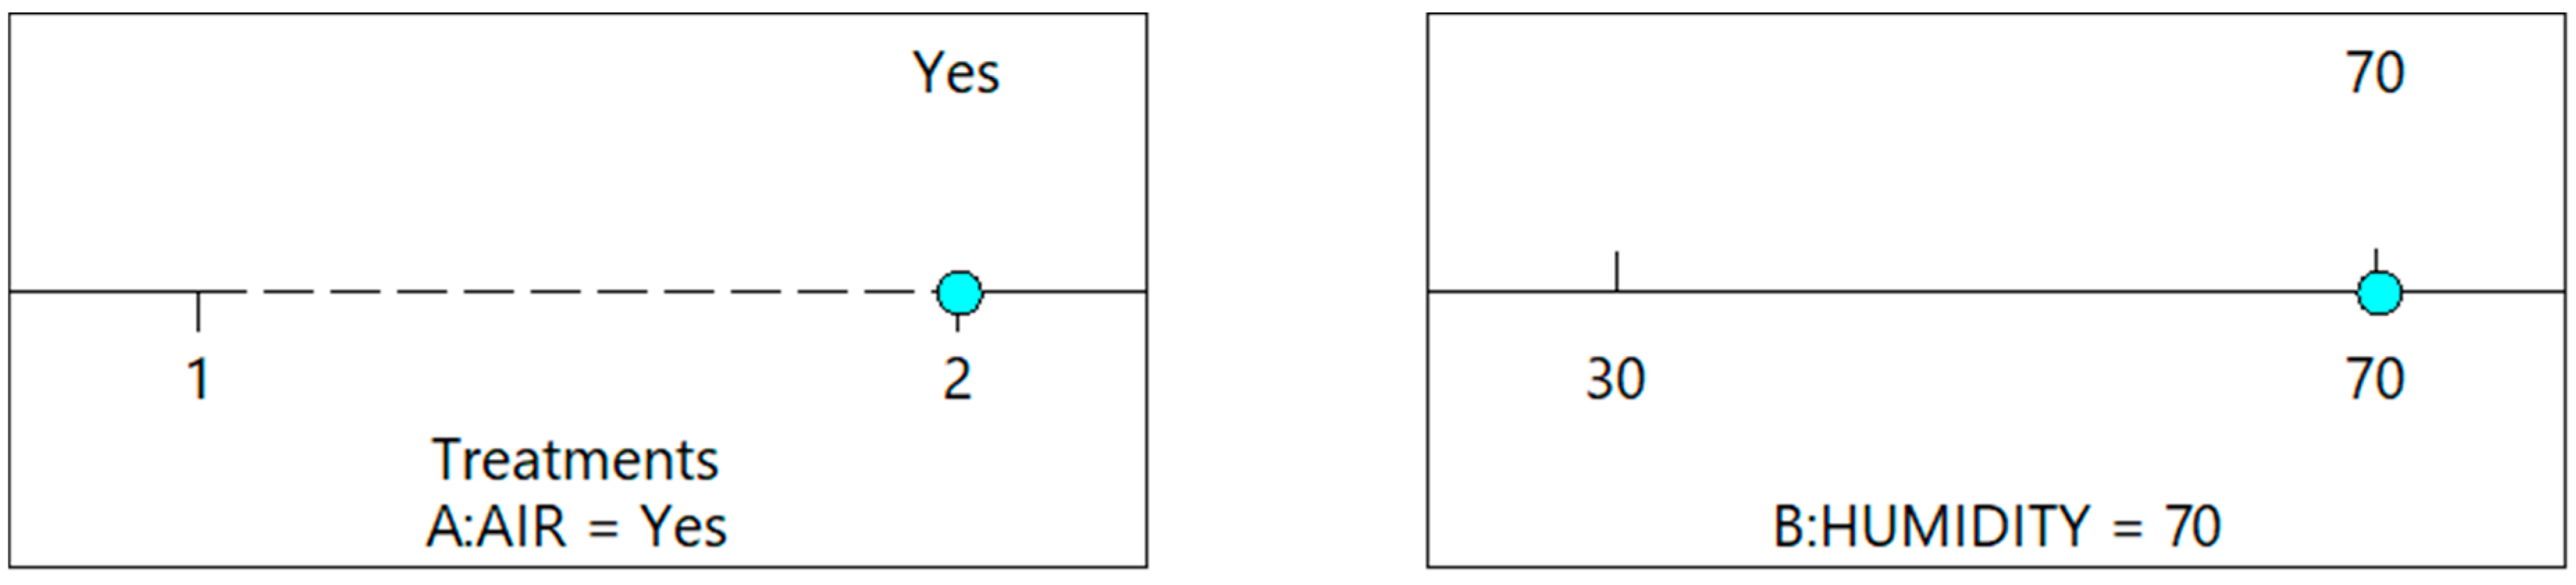
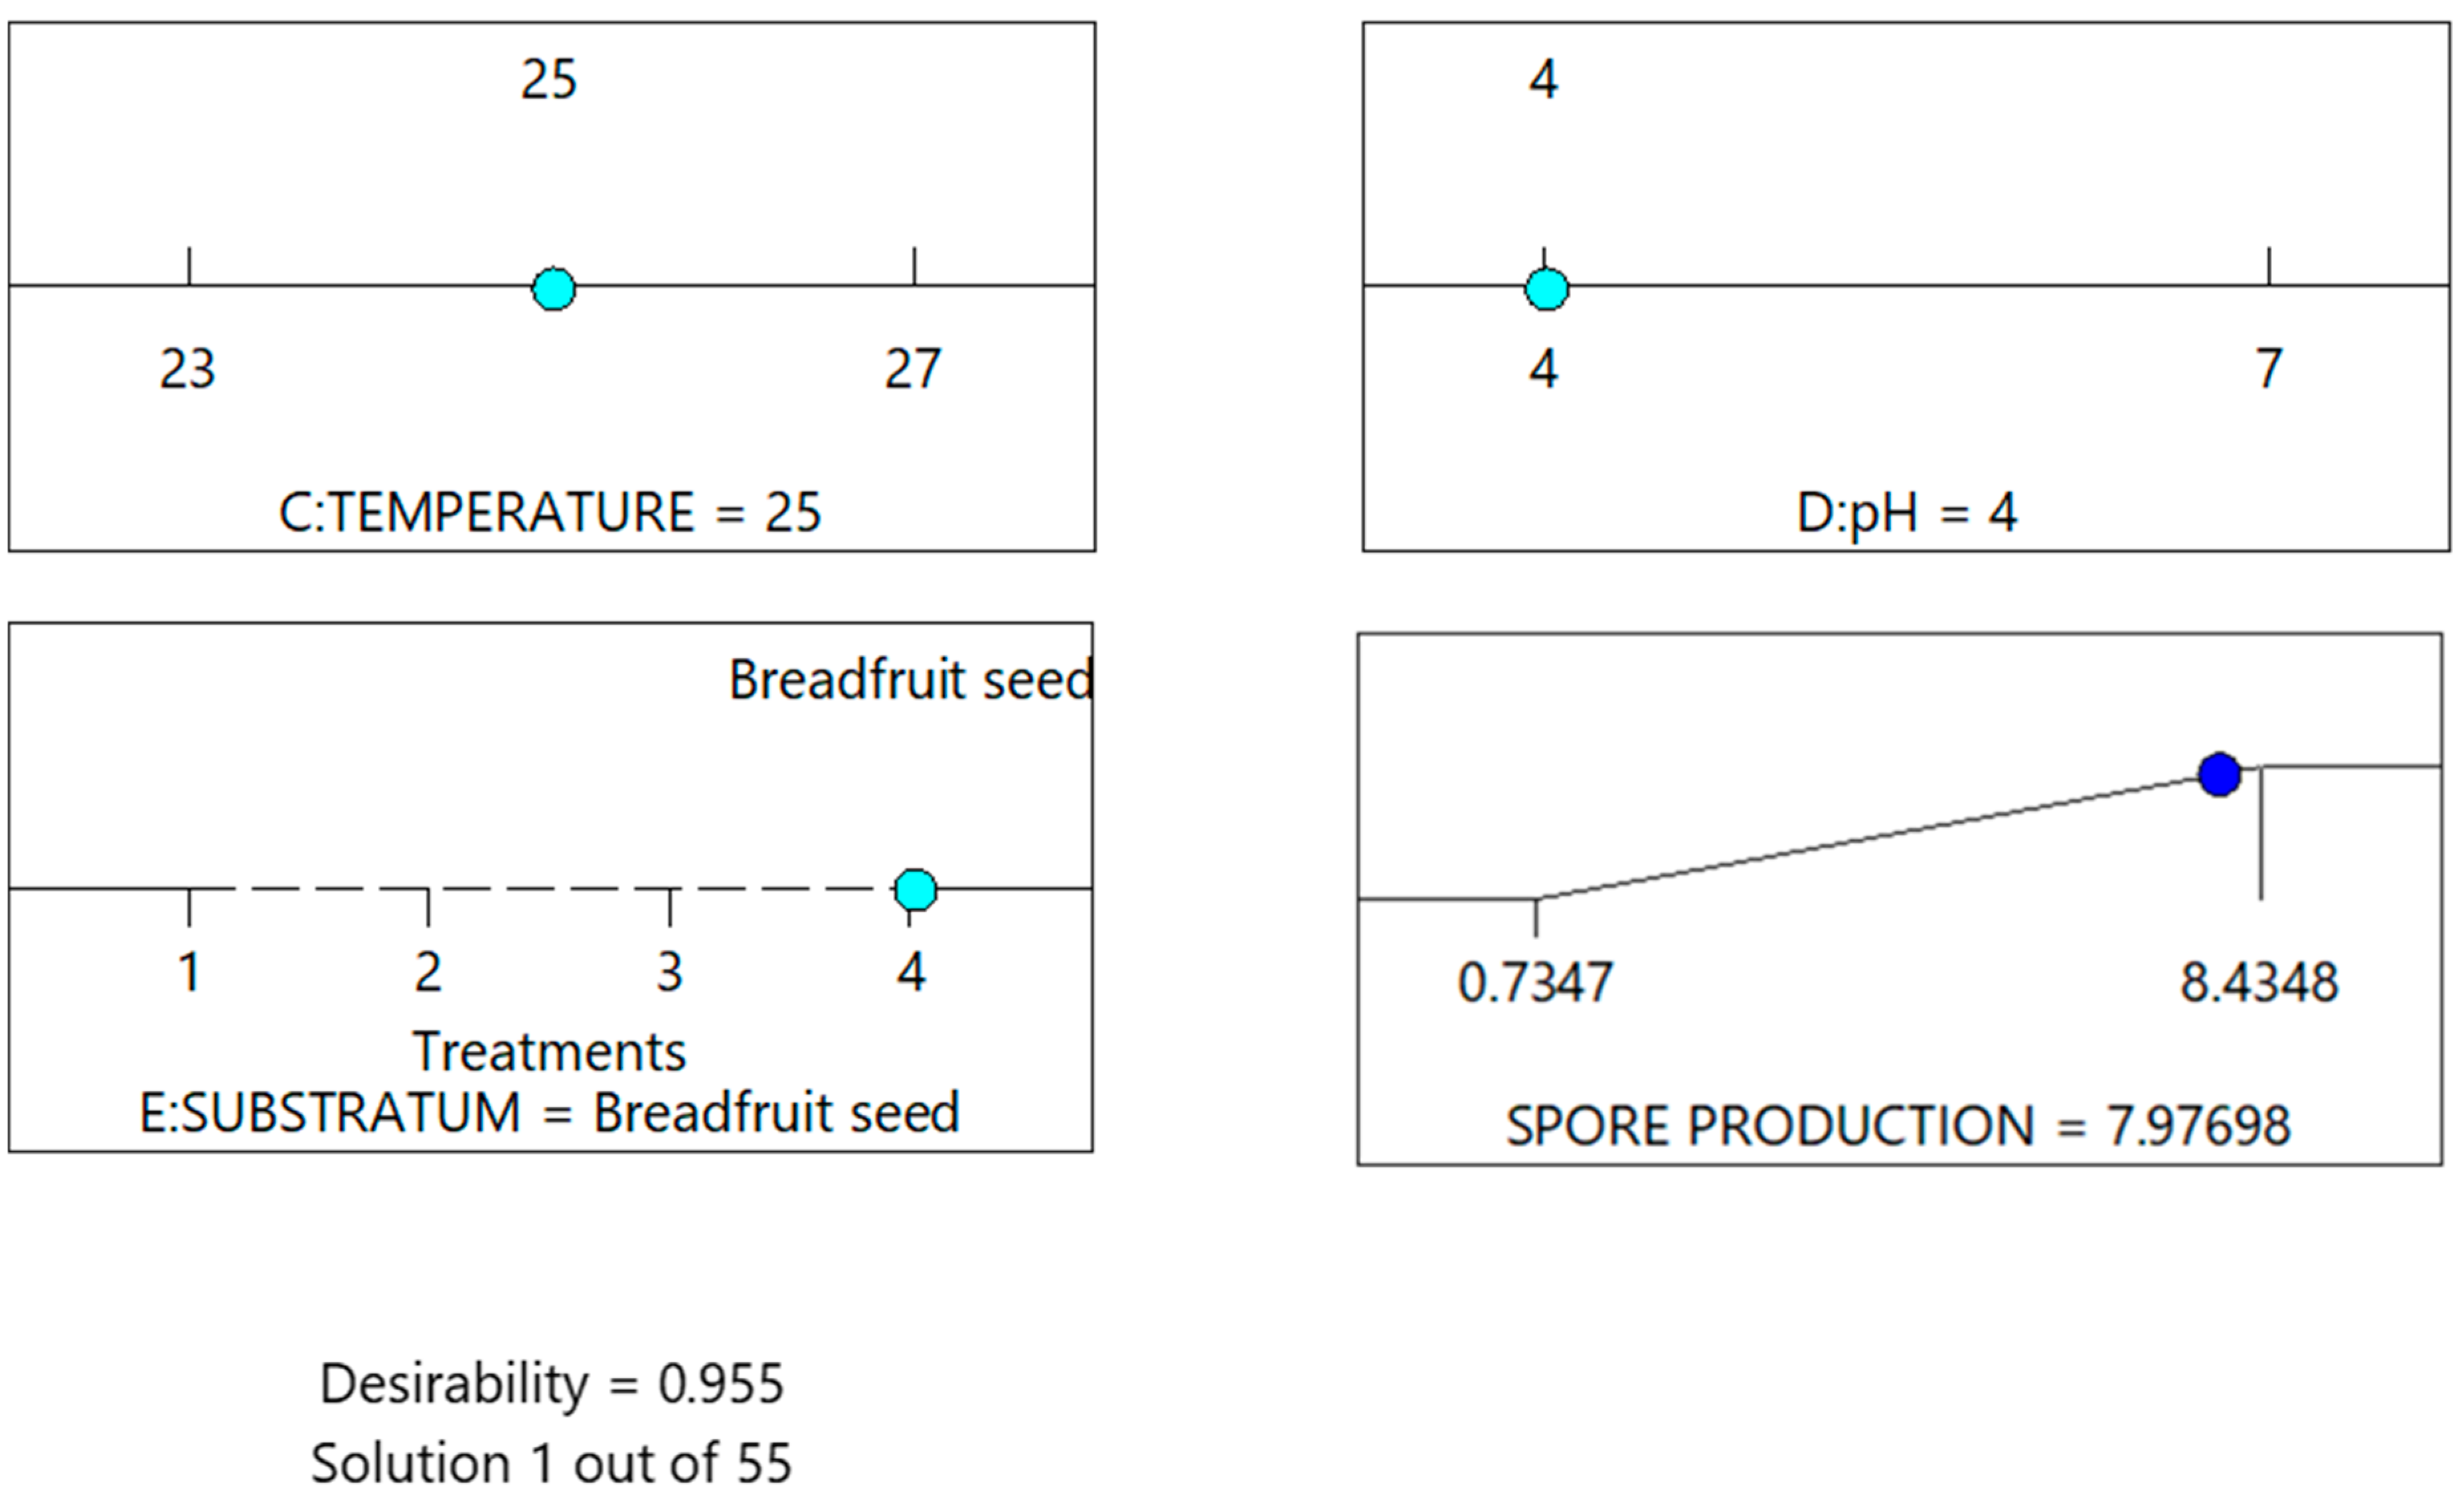
3. Results
4. Conclusions
5. Discussion
Author Contributions
Funding
Institutional Review Board Statement
Informed Consent Statement
Data Availability Statement
Acknowledgments
Conflicts of Interest
References
- Cervantes, T.M.; Sosa, G.R.; Rodríguez, H.G.; Robles, M.F. Industrial ecology, and sustainable development. Redalyc. Ingeniería 2008, 13, 63–70. Available online: https://www.redalyc.org/pdf/467/46713055007.pdf (accessed on 20 December 2022).
- Björkman, T.; Blanchard, L.; Harman, G. The Effect of Rhizosphere Competence on Colonization of Sweet Corn Roots by Biocontrol Fungi in Differing Soils. Am. Soc. Hortic. Sci. 1998, 33, 835–843. [Google Scholar] [CrossRef]
- Belanger, R.R.; Dufour, N. Chronological Events Associated with the Antagonistic Properties of Trichoderma harzianum against Botrytis cinerea: Indirect Evidence for Sequential Role of Antibiosis and Parasitism. Biocontrol Sci. Technol. 2010, 5, 41–54. [Google Scholar] [CrossRef]
- De la Cruz, R.; Roussos, S.; Hernandez, D.; Rodriguez, R.; López, L.; Castillo, F.; Aguilar, C. Solid-State Fermentation in a Bag Bioreactor: Effect of Corn Cob Mixed with Phytopathogen Biomass on Spore and Cellulase Production by Trichoderma asperellum. In Fermentation Processes; InTech Open: London, UK, 2017; pp. 43–56. [Google Scholar] [CrossRef] [Green Version]
- Sala, A.; Artola, A.; Sánchez, A.; Barrena, R. Rice husk as a source for fungal biopesticide production by solid-state fermentation using B. bassiana and T. harzianum. Bioresour. Technol. 2019, 296, 122322. [Google Scholar] [CrossRef]
- Mulatu, A.; Alemu, T.; Megersa, N.; Vetukuri, R.R. Optimization of Culture Conditions and Production of Bio-Fungicides from Trichoderma Species under Solid-State Fermentation Using Mathematical Modeling. Microorganisms 2021, 9, 1675. [Google Scholar] [CrossRef]
- Zhang, S.; Gan, Y.; Liu, J.; Zhou, J.; Xu, B. Trichoderma species, Heterodera avanae, Nematicidal activity, Fermentation media and conditions, Plackett-Burman design box-behenken design, Response Surface methodology. Front. Mic. 2020, 11, 574601. [Google Scholar] [CrossRef] [PubMed]
- Zhang, F.; Zhu, Z.; Wang, B.; Wang, P.; Yu, G.; Wu, M.; Chen, W.; Ran, W.; Shen, Q. Optimization of Trichoderma harzanium T-E5 biomass and determining the degradation sequence of biopolymers by FTIR in solid-state fermentation. Ind. Crops Prod. 2013, 49, 619–627. [Google Scholar] [CrossRef]
- Ming, S.; Rong, J.; Zhang, C.; Li, C.; Zhang, C.; Zhang, Y.; Zhou, R.; Li, G. The Solid Fermentation State’s Optimization of Trichoderma Harzianum M1. IOP Conf. Ser. Mater. Sci. Eng. 2019, 612, 022111. [Google Scholar] [CrossRef]
- Montgomery, D.C. Design and Analysis of Experiments; John Wiley & Sons: Hoboken, NJ, USA, 2017. [Google Scholar]
- Wang, J.C.; Wu, C.F. An approach to the construction of asymmetrical orthogonals designs. J. Am. Stat. Assoc. 1991, 86, 450–456. [Google Scholar] [CrossRef]
- DeCock, D.; Stufken, J. On finding mixed orthogonal designs of strength 2 with many 2-level factors. Stat. Probab. Lett. 2000, 50, 383–388. [Google Scholar] [CrossRef]
- Xu, H. An algorithm for constructing orthogonal and nearly orthogonal arrays with mixed levels and small runs. Technometrics 2002, 44, 356–368. [Google Scholar] [CrossRef] [Green Version]
- Guo, Y.; Simpson, J.R.; Pignatiello, J.J. Construction of efficient fractional factorial mixed-level fractional factorial designs. J. Qual. Technol. 2007, 39, 241–257. [Google Scholar] [CrossRef]
- Fontana, R. Algebraic generation of minimum size orthogonal arrays: A general approach based on integer linear programming. Comput. Stat. 2011, 28, 241–253. [Google Scholar] [CrossRef] [Green Version]
- Lee, K.; Lee, K.; Han, S. Use of an orthogonal array based on the Kriging model to maximize the fatigue life of a turbine blade. Int. J. Struct. Integr. 2011, 2, 303–312. [Google Scholar] [CrossRef]
- Fontana, R. Generalized minimum aberration mixed-level orthogonal arrays: A general approach based on sequential integer quadratically constrained quadratic programming. Commun. Stat. Theory Methods 2016, 46, 4275–4284. [Google Scholar] [CrossRef] [Green Version]
- Grömping, U.; Fontana, R. An algorithm for generating good mixed level factorial designs. Comput. Stat. Data Anal. 2019, 37, 101–114. [Google Scholar] [CrossRef]
- Pantoja, Y.V.; Ríos, A.J.; Tapia Esquivias, M. A method for construction of mixed-level fractional designs. Qual. Reliab. Eng. Int. 2019, 35, 1646–1665. [Google Scholar] [CrossRef]
- Pantoja, Y.V.; Ríos, A.J.; Vázquez, J.A.; Jiménez, J.A.; Asato-España, M.L.; Tapia-Esquivias, M. One Note for Fractionation and Increase for Mixed-Level Designs When the Levels Are Not Multiple. Mathematics 2021, 9, 1455. [Google Scholar] [CrossRef]
- Moore-Landecker, E. Fundamentals of Fungi; Prentice Hall: Hoboken, NJ, USA, 1996. [Google Scholar]
- Kedrics, L.; Szekeres, A.; Zsuzsanna, A.; Manczinger, L.; Kevei, F.; Nagy, E. Influence of Environmental Parameters on Trichoderma Strains with Biocontrol Potential. Food Technol. Biotechnol. 2003, 41, 37–42. Available online: https://hrcak.srce.hr/110938 (accessed on 30 January 2023).
- Elósegui, C.O. Métodos artesanales de producción de bioplaguicidas a partir de hongos entomopatógenos antagonistas. INISAV 2006, 14, 6–8. Available online: https://www.yumpu.com/es/document/read/50176287/metodos-artesanales-de-produc-569cion-de- (accessed on 30 December 2022).
- Besoain, X.; Pardo, G.; Raggi, C.; Opazo, M.; Araya, S.; Perez, L.; Montealegre, J. Características de cepas chilenas de Pyrenochaeta lycopersici y perspectivas de control biologico. Bol. Mic. 2003, 18, 57–65. Available online: https://pdfs.semanticscholar.org/4773/b060889e01f415de64337efedfabd8439a0a.pdf (accessed on 6 May 2023). [CrossRef] [Green Version]
- Abad, M.; Noguera, P.; Carrion, C. Los Sustratos en los Cultivos Sin Suelo; Mundi Prensa: Madrid, Spain, 2004. [Google Scholar]
- García, R. Producción de biomasa de Trichoderma harzianum por fermentación líquida. Fitosanidad 2006, 10, 295–298. Available online: http://www.redalyc.org/articulo.oa?id=209116183008 (accessed on 3 August 2023).
- Ahamed, A.; Vermette, P. Culture-based strategies to enhance cellulase enzyme production from Trichoderma reesei RUT-C30 in bioreactor culture conditions. Biochem. Eng. J. 2008, 40, 399–407. [Google Scholar] [CrossRef]
- Tewari, L.; Bhanu, C. Evaluation of agro-industrial wastes for conidia-based inoculum production of bio-control agent: Trichoderma harzianum. J. Sci. Ind. Res. 2004, 63, 807–812. Available online: https://nopr.niscpr.res.in/bitstream/123456789/5490/1/JSIR%2063%2810%29%20807-812.pdf (accessed on 3 August 2023).
- Holker, U.; Hofer, M.; Lenz, J. Biotechnological advantages of laboratory-scale solid-state fermentation with fungi. Appl. Microbiol. Biotechnol. 2004, 64, 175–186. [Google Scholar] [CrossRef]
- Cavalcante, R.S.; Lima, H.L.; Pinto, G.A.; Gava, C.A.; Rodrigues, S. Effect of moisture on Trichoderma conidia production on corn and wheat bran by solid state fermentation. Food Bioprocess Technol. 2008, 1, 100–104. [Google Scholar] [CrossRef]
- Design Expert, Stat-Ease. Available online: https://www.statease.com/software/design-expert/ (accessed on 1 May 2023).
- Gunst, R.F.; Mason, L. Fractional factorial design. WIREs Comp Stat. 2009, 1, 234–244. [Google Scholar] [CrossRef]
- Yates, F. The Principles of Orthogonality and Confounding in Replicated Experiments; Cambridge University Press: Cambridge, UK, 1933; pp. 108–145. [Google Scholar] [CrossRef]
- Sachdev, S.; Singh, A.; Singh, R.P. Optimization of culture conditions for mass production and bioformulation of Trichoderma using response Surface methodology. Biotech 2018, 3, 360. [Google Scholar] [CrossRef]
- Hajieghrari, B.; Torabi, G.M.; Mohammadi, M.R.; Davari, M. Biological potential of some Iranian Trichoderma isolates in the control of soil borne plant pathogenic fungi. Afr. J. Biotechnol. 2008, 7, 967–972. Available online: https://www.ajol.info/index.php/ajb/article/view/58586/46927 (accessed on 31 January 2023).
- Gaytán, R.; Salmones, D.; Pérez, R.; Mata, G. Manual Práctico de Cultivo de Setas: Aislamiento, Siembra y Producción, 1st ed.; Instituto de Ecología A.C.: Mexico City, Mexico, 2006; Available online: http://www1.inecol.edu.mx/cv/CV_pdf/libros/Manual_PleurotusGaitan.pdf (accessed on 18 December 2022).
- Gervais, P.; Molin, P. The role of water in solid-state fermentation. Biochem. Eng. J. 2003, 13, 85–101. [Google Scholar] [CrossRef]
- Prasad, R.D.; Rangeshwaran, R.; Anuroop, C.P.; Phanikumar, P.R. Bioefficacy and shelf life of conidial and chlamydospore formulations of Trichoderma harzianum Rifai. J. Biol. Control 2002, 16, 145–148. [Google Scholar]
- Ferrer, G.J.; Machado, J.L.; Brieva, J. Fermentación en estado sólido: Una alternativa biotecnológica para el aprovechamiento de desechos agroindustriales. Rev. Tecnológica URU 2014, 7, 11–22. Available online: http://uruojs.insiemp.com/ojs/index.php/tc/article/view/578 (accessed on 30 January 2023).
- Hernandez, D.J.; Ferrera, R.; Alarcon, A. Trichoderma: Importancia agrícola, biotecnológica, y sistemas de fermentación para producir biomasa y enzimas de interes industrial. Chil. J. Agric. Anim. Sci. 2019, 35, 98–112. [Google Scholar] [CrossRef]
- Danielson, R.M.; Davey, C.B. Carbon and nitrogen nutrition of Trichoderma. Soil Biol. Biochem. 1973, 5, 505–515. [Google Scholar] [CrossRef]
- Jackson, A.M.; Whipps, J.M.; Lynch, J.M. Microbial interactions, and biocontrol in the rizhosphere. J. Exp. Bot. 2001, 52, 487–511. [Google Scholar] [CrossRef] [Green Version]
- Thangavelu, R.; Palaniswami, A.; Velazhahan, R. Mass production of Trichoderma harzianum for managing fusarium wilt of banana. Agric Ecosyst. Environ. 2004, 103, 259–263. [Google Scholar] [CrossRef]
- Krishna, C. Soild-State Fermentation Systems—An overview. Crit. Rev. Biotechnol. 2005, 25, 1–30. [Google Scholar] [CrossRef]
- Pathak, P.; Bhardwaj, N.K.; Singh, A.K. Production of Crude Cellulase and Xylanase from Trichoderma harzianum PPDDN10 NFCCI-2925 and Its Application in Photocopier Wastepaper Recycling. Appl. Biochem. Biotechnol. 2013, 172, 3776–3797. [Google Scholar] [CrossRef]
- Hamrouni, R.; Molinet, J.; Miché, L.; Carboué, Q.; Dupuy, N.; Masmoudi, A.; Roussos, S. Production of Coconut Aroma in Solid-State Cultivation: Screening and Identification of Trichoderma Strains for 6-Pentyl-Alpha-Pyrone and Conidia Production. J. Chem. 2019, 2019, 8562384. [Google Scholar] [CrossRef] [Green Version]
- Elad, Y.; Zimand, G.; Zaqs, Y.; Zuriel, S.; Chet, I. Use of Trichoderma harzianum in combination or alternation with fungicides to control Cucumber grey mould (Botrytiscinerea) under commercial greenhouse conditions. Plant Pathol. 2007, 42, 324–332. [Google Scholar] [CrossRef]
- Eltem, R.; Sayit, S.; Sozer, S.; Sukan, F.V. Production of Trichoderma citrinoviride Micropropagules as a Biocontrol Agent by Means of an Economical Process. U.S. Patent No. 9,551,012, 24 January 2017. [Google Scholar]
- Hynes, R.K.; Boyetchko, S.M. Research initiatives in the art and science of biopesticide formulations. Soil Biol. Biochem. 2006, 38, 845–849. [Google Scholar] [CrossRef]
- Box, G.E.; Behnken, D.W. Some new three level designs for the study of quantitative variables. Technometrics 1960, 2, 455–475. Available online: https://www.stat.cmu.edu/technometrics/59-69/VOL-02-04/v0204455.pdf (accessed on 3 August 2023).
- Zhou, J.; Yu, X.; Ding, C.; Wang, Z.; Zhou, Q.; Pao, H. Optimization of phenol degradation by Candida tropicalis Z-04 using Plackett-Burman design and response surface methodology. J. Environ. Sci. 2011, 23, 22–30. [Google Scholar] [CrossRef]

| Real Name of the Factors (Uncoded Factors) | Coded Factors | Real Values of the Levels (Uncoded Levels) | Coded Levels | |||
|---|---|---|---|---|---|---|
| Air | A | Yes | No | --- | --- | 1, 2 |
| Humidity (%) | B | 30 | 50 | 70 | --- | 1, 2, 3 |
| Temperature (°C) | C | 23 | 25 | 27 | --- | 1, 2, 3 |
| pH | D | 4 | 5 | 6 | 7 | 1, 2, 3, 4 |
| Substrate | E | Corn cob | Grain of rice | Sesame husk | Breadfruit seed | 1, 2, 3, 4 |
| Factor | Operation Range | Optimal Value | References |
|---|---|---|---|
| Air | Yes-No | Yes | [5] |
| Yes–No | Yes | [32] | |
| Yes–No | Yes | [36] | |
| Humidity | 50%–80% | 50% | [6] |
| 30%–60% | 50% | [37] | |
| 50%-70% | 70% | [38] | |
| Temperature | 25 °C–35 °C | 25 °C | [6] |
| 25 °C–28 °C | 26 °C | [35] | |
| 24 °C–27 °C | 25 °C | [37] | |
| pH | 3.8–6.0 | 6.0 | [4] |
| 5.0–8.0 | 5.8 | [6] | |
| 2.0–6.0 | 4 | [39] | |
| Substrate | Rice husk, sugar cane, coffee husk, corn cob. | Rice husk | [5] |
| Rice grains, sorghum, birdseed, broken corn, rice straw. | Rice grains | [40] | |
| Rice grain, wheat grain, sorghum grain, sesame husk. | Sesame husk | [41] | |
| Incubation period | 5–7 days | 5 days | [4] |
| 14–18 days | 27.8 days | [6] | |
| 5–15 days | 31 days | [24] | |
| Inoculum concentration | 0.1%–10% | 12% | [6] |
| 10%-15% | 13.9% | [42] | |
| 5%–10% | 5% | [43] |
| Run | Divisor Factor C | Segment | Position |
|---|---|---|---|
| 1 | 1 | 1 | 1 |
| 2 | 1 | 2 | |
| 3 | 1 | 3 | |
| 4 | 1 | 4 | |
| 5 | 1 | 5 | |
| 6 | 1 | 6 | |
| 7 | 2 | 2 | 1 |
| 8 | 2 | 2 | |
| 9 | 2 | 3 | |
| 10 | 2 | 4 | |
| 11 | 2 | 5 | |
| 12 | 2 | 6 | |
| 13 | 3 | 3 | 1 |
| 14 | 3 | 2 | |
| 15 | 3 | 3 | |
| 16 | 3 | 4 | |
| 17 | 3 | 5 | |
| 18 | 3 | 6 | |
| . | . | . | |
| . | . | . | |
| . | . | . | |
| 271 | 1 | 4 | 1 |
| 272 | 1 | 2 | |
| 273 | 1 | 3 | |
| 274 | 1 | 4 | |
| 275 | 1 | 5 | |
| 276 | 1 | 6 | |
| 277 | 2 | 5 | 1 |
| 278 | 2 | 2 | |
| 279 | 2 | 3 | |
| 280 | 2 | 4 | |
| 281 | 2 | 5 | |
| 282 | 2 | 6 | |
| 283 | 3 | 6 | 1 |
| 284 | 3 | 2 | |
| 285 | 3 | 3 | |
| 286 | 3 | 4 | |
| 287 | 3 | 5 | |
| 288 | 3 | 6 |
| Permuted Vector 1 | Permuted Vector 2 | Permuted Vector 3 | Permuted Vector 4 | Permuted Vector 5 | Permuted Vector 6 | Permuted Vector 7 | Permuted Vector 8 |
|---|---|---|---|---|---|---|---|
| 6 | 6 | 6 | 6 | 6 | 6 | 6 | 6 |
| 5 | 5 | 5 | 5 | 5 | 5 | 5 | 5 |
| 4 | 4 | 4 | 4 | 4 | 4 | 3 | 3 |
| 3 | 3 | 2 | 2 | 1 | 1 | 4 | 4 |
| 2 | 1 | 3 | 1 | 2 | 3 | 2 | 1 |
| 1 | 2 | 1 | 3 | 3 | 2 | 1 | 2 |
| 2 | 3 | 3 | 4 | 4 | 2 | 3 | 3 | 4 | 4 | 2 | 3 | 3 | 4 | 4 | |||||||||
|---|---|---|---|---|---|---|---|---|---|---|---|---|---|---|---|---|---|---|---|---|---|---|---|
| Segment 1 | Run | A | B | C | D | E | Position | Segment 2 | Run | A | B | C | D | E | Position | Run | A | B | C | D | E | Position | |
| 1 | 1 | 1 | 1 | 1 | 1 | 1 | 7 | 1 | 1 | 2 | 1 | 1 | 1 | Segment 3 | 13 | 1 | 1 | 3 | 1 | 1 | 1 | ||
| 2 | 2 | 1 | 1 | 1 | 1 | 2 | 8 | 2 | 1 | 2 | 1 | 1 | 2 | 14 | 2 | 1 | 3 | 1 | 1 | 2 | |||
| 3 | 1 | 2 | 1 | 1 | 1 | 3 | 9 | 1 | 2 | 2 | 1 | 1 | 3 | 15 | 1 | 2 | 3 | 1 | 1 | 3 | |||
| 4 | 2 | 2 | 1 | 1 | 1 | 4 | 10 | 2 | 2 | 2 | 1 | 1 | 4 | 16 | 2 | 2 | 3 | 1 | 1 | 4 | |||
| 5 | 1 | 3 | 1 | 1 | 1 | 5 | 11 | 1 | 3 | 2 | 1 | 1 | 5 | 17 | 1 | 3 | 3 | 1 | 1 | 5 | |||
| 6 | 2 | 3 | 1 | 1 | 1 | 6 | 12 | 2 | 3 | 2 | 1 | 1 | 6 | 18 | 2 | 3 | 3 | 1 | 1 | 6 | |||
| 2 | 3 | 3 | 4 | 4 | 2 | 3 | 3 | 4 | 4 | 2 | 3 | 3 | 4 | 4 | |||||||||
| Segment 4 | Run | A | B | C | D | E | Position | Segment 5 | Run | A | B | C | D | E | Position | Run | A | B | C | D | E | Position | |
| 19 | 1 | 1 | 1 | 2 | 1 | 1 | 25 | 1 | 1 | 2 | 2 | 1 | 1 | Segment 6 | 31 | 1 | 1 | 3 | 2 | 1 | 1 | ||
| 20 | 2 | 1 | 1 | 2 | 1 | 2 | 26 | 2 | 1 | 2 | 2 | 1 | 2 | 32 | 2 | 1 | 3 | 2 | 1 | 2 | |||
| 21 | 1 | 2 | 1 | 2 | 1 | 3 | 27 | 1 | 2 | 2 | 2 | 1 | 3 | 33 | 1 | 2 | 3 | 2 | 1 | 3 | |||
| 22 | 2 | 2 | 1 | 2 | 1 | 4 | 28 | 2 | 2 | 2 | 2 | 1 | 4 | 34 | 2 | 2 | 3 | 2 | 1 | 4 | |||
| 23 | 1 | 3 | 1 | 2 | 1 | 5 | 29 | 1 | 3 | 2 | 2 | 1 | 5 | 35 | 1 | 3 | 3 | 2 | 1 | 5 | |||
| 24 | 2 | 3 | 1 | 2 | 1 | 6 | 30 | 2 | 3 | 2 | 2 | 1 | 6 | 36 | 2 | 3 | 3 | 2 | 1 | 6 | |||
| 2 | 3 | 3 | 4 | 4 | 2 | 3 | 3 | 4 | 4 | 2 | 3 | 3 | 4 | 4 | |||||||||
| Segment 7 | Run | A | B | C | D | E | Position | Segment 8 | Run | A | B | C | D | E | Position | Run | A | B | C | D | E | Position | |
| 37 | 1 | 1 | 1 | 3 | 1 | 1 | 43 | 1 | 1 | 2 | 3 | 1 | 1 | Segment 9 | 49 | 1 | 1 | 3 | 3 | 1 | 1 | ||
| 38 | 2 | 1 | 1 | 3 | 1 | 2 | 44 | 2 | 1 | 2 | 3 | 1 | 2 | 50 | 2 | 1 | 3 | 3 | 1 | 2 | |||
| 39 | 1 | 2 | 1 | 3 | 1 | 3 | 45 | 1 | 2 | 2 | 3 | 1 | 3 | 51 | 1 | 2 | 3 | 3 | 1 | 3 | |||
| 40 | 2 | 2 | 1 | 3 | 1 | 4 | 46 | 2 | 2 | 2 | 3 | 1 | 4 | 52 | 2 | 2 | 3 | 3 | 1 | 4 | |||
| 41 | 1 | 3 | 1 | 3 | 1 | 5 | 47 | 1 | 3 | 2 | 3 | 1 | 5 | 53 | 1 | 3 | 3 | 3 | 1 | 5 | |||
| 42 | 2 | 3 | 1 | 3 | 1 | 6 | 48 | 2 | 3 | 2 | 3 | 1 | 6 | 54 | 2 | 3 | 3 | 3 | 1 | 6 | |||
| … | …… | ……… | … | … | … | … | … | … | |||||||||||||||
| 2 | 3 | 3 | 4 | 4 | 2 | 3 | 3 | 4 | 4 | 2 | 3 | 3 | 4 | 4 | |||||||||
| Segment 40 | Run | A | B | C | D | E | Position | Segment 41 | Run | A | B | C | D | E | Position | Run | A | B | C | D | E | Position | |
| 1 | 1 | 1 | 1 | 2 | 4 | 1 | 7 | 1 | 1 | 1 | 2 | 4 | 1 | Segment 42 | 13 | 1 | 1 | 1 | 2 | 4 | 1 | ||
| 2 | 2 | 1 | 1 | 2 | 4 | 2 | 8 | 2 | 1 | 1 | 2 | 4 | 2 | 14 | 2 | 1 | 1 | 2 | 4 | 2 | |||
| 3 | 1 | 2 | 1 | 2 | 4 | 3 | 9 | 1 | 2 | 1 | 2 | 4 | 3 | 15 | 1 | 2 | 1 | 2 | 4 | 3 | |||
| 4 | 2 | 2 | 1 | 2 | 4 | 4 | 10 | 2 | 2 | 1 | 2 | 4 | 4 | 16 | 2 | 2 | 1 | 2 | 4 | 4 | |||
| 5 | 1 | 3 | 1 | 2 | 4 | 5 | 11 | 1 | 3 | 1 | 2 | 4 | 5 | 17 | 1 | 3 | 1 | 2 | 4 | 5 | |||
| 6 | 2 | 3 | 1 | 2 | 4 | 6 | 12 | 2 | 3 | 1 | 2 | 4 | 6 | 18 | 2 | 3 | 1 | 2 | 4 | 6 | |||
| 2 | 3 | 3 | 4 | 4 | 2 | 3 | 3 | 4 | 4 | 2 | 3 | 3 | 4 | 4 | |||||||||
| Segment 43 | Run | A | B | C | D | E | Position | Segment 44 | Run | A | B | C | D | E | Position | Run | A | B | C | D | E | Position | |
| 1 | 1 | 1 | 1 | 3 | 4 | 1 | 7 | 1 | 1 | 2 | 3 | 4 | 1 | Segment 45 | 13 | 1 | 1 | 3 | 3 | 4 | 1 | ||
| 2 | 2 | 1 | 1 | 3 | 4 | 2 | 8 | 2 | 1 | 2 | 3 | 4 | 2 | 14 | 2 | 1 | 3 | 3 | 4 | 2 | |||
| 3 | 1 | 2 | 1 | 3 | 4 | 3 | 9 | 1 | 2 | 2 | 3 | 4 | 3 | 15 | 1 | 2 | 3 | 3 | 4 | 3 | |||
| 4 | 2 | 2 | 1 | 3 | 4 | 4 | 10 | 2 | 2 | 2 | 3 | 4 | 4 | 16 | 2 | 2 | 3 | 3 | 4 | 4 | |||
| 5 | 1 | 3 | 1 | 3 | 4 | 5 | 11 | 1 | 3 | 2 | 3 | 4 | 5 | 17 | 1 | 3 | 3 | 3 | 4 | 5 | |||
| 6 | 2 | 3 | 1 | 3 | 4 | 6 | 12 | 2 | 3 | 2 | 3 | 4 | 6 | 18 | 2 | 3 | 3 | 3 | 4 | 6 | |||
| 2 | 3 | 3 | 4 | 4 | 2 | 3 | 3 | 4 | 4 | 2 | 3 | 3 | 4 | 4 | |||||||||
| Segment 46 | Run | A | B | C | D | E | Position | Segment 47 | Run | A | B | C | D | E | Position | Run | A | B | C | D | E | Position | |
| 1 | 1 | 1 | 1 | 4 | 4 | 1 | 7 | 1 | 1 | 2 | 4 | 4 | 1 | Segment 48 | 13 | 1 | 1 | 3 | 4 | 4 | 1 | ||
| 2 | 2 | 1 | 1 | 4 | 4 | 2 | 8 | 2 | 1 | 2 | 4 | 4 | 2 | 14 | 2 | 1 | 3 | 4 | 4 | 2 | |||
| 3 | 1 | 2 | 1 | 4 | 4 | 3 | 9 | 1 | 2 | 2 | 4 | 4 | 3 | 15 | 1 | 2 | 3 | 4 | 4 | 3 | |||
| 4 | 2 | 2 | 1 | 4 | 4 | 4 | 10 | 2 | 2 | 2 | 4 | 4 | 4 | 16 | 2 | 2 | 3 | 4 | 4 | 4 | |||
| 5 | 1 | 3 | 1 | 4 | 4 | 5 | 11 | 1 | 3 | 2 | 4 | 4 | 5 | 17 | 1 | 3 | 3 | 4 | 4 | 5 | |||
| 6 | 2 | 3 | 1 | 4 | 4 | 6 | 12 | 2 | 3 | 2 | 4 | 4 | 6 | 18 | 2 | 3 | 3 | 4 | 4 | 6 |
| Run | A | B | C | D | E |
|---|---|---|---|---|---|
| 1 | 2 | 3 | 1 | 1 | 1 |
| 2 | 1 | 3 | 2 | 1 | 1 |
| 3 | 2 | 2 | 3 | 1 | 1 |
| 4 | 1 | 2 | 1 | 2 | 1 |
| 5 | 2 | 1 | 2 | 2 | 1 |
| 6 | 1 | 1 | 3 | 2 | 1 |
| 7 | 2 | 3 | 1 | 3 | 1 |
| 8 | 1 | 3 | 2 | 3 | 1 |
| 9 | 2 | 2 | 3 | 3 | 1 |
| 10 | 1 | 2 | 1 | 4 | 1 |
| 11 | 1 | 1 | 2 | 4 | 1 |
| 12 | 2 | 1 | 3 | 4 | 1 |
| 13 | 2 | 3 | 1 | 1 | 2 |
| 14 | 1 | 3 | 2 | 1 | 2 |
| 15 | 2 | 2 | 3 | 1 | 2 |
| 16 | 2 | 1 | 1 | 2 | 2 |
| 17 | 1 | 2 | 2 | 2 | 2 |
| 18 | 1 | 1 | 3 | 2 | 2 |
| 19 | 2 | 3 | 1 | 3 | 2 |
| 20 | 1 | 3 | 2 | 3 | 2 |
| 21 | 2 | 2 | 3 | 3 | 2 |
| 22 | 2 | 1 | 1 | 4 | 2 |
| 23 | 1 | 1 | 2 | 4 | 2 |
| 24 | 1 | 2 | 3 | 4 | 2 |
| 25 | 2 | 3 | 1 | 1 | 3 |
| 26 | 1 | 3 | 2 | 1 | 3 |
| 27 | 2 | 2 | 3 | 1 | 3 |
| 28 | 1 | 1 | 1 | 2 | 3 |
| 29 | 2 | 1 | 2 | 2 | 3 |
| 30 | 1 | 2 | 3 | 2 | 3 |
| 31 | 2 | 3 | 1 | 3 | 3 |
| 32 | 1 | 3 | 2 | 3 | 3 |
| 33 | 2 | 2 | 3 | 3 | 3 |
| 34 | 1 | 1 | 1 | 4 | 3 |
| 35 | 1 | 2 | 2 | 4 | 3 |
| 36 | 2 | 1 | 3 | 4 | 3 |
| 37 | 2 | 3 | 1 | 1 | 4 |
| 38 | 1 | 3 | 2 | 1 | 4 |
| 39 | 1 | 2 | 3 | 1 | 4 |
| 40 | 2 | 2 | 1 | 2 | 4 |
| 41 | 2 | 1 | 2 | 2 | 4 |
| 42 | 1 | 1 | 3 | 3 | 4 |
| 43 | 2 | 3 | 1 | 3 | 4 |
| 44 | 1 | 3 | 2 | 3 | 4 |
| 45 | 1 | 2 | 3 | 3 | 4 |
| 46 | 2 | 2 | 1 | 4 | 4 |
| 47 | 2 | 1 | 2 | 4 | 4 |
| 48 | 2 | 1 | 3 | 4 | 4 |
| Run | Air | % Humidity | Temperature (°C) | pH | Substratum | % Viability | ||
|---|---|---|---|---|---|---|---|---|
| 1 | No | 70 | 23 | 4 | Corn Cob | 3.8 | 98 | 3.724 |
| 2 | Yes | 70 | 25 | 4 | Corn Cob | 4.05 | 98 | 3.969 |
| 3 | No | 50 | 27 | 4 | Corn Cob | 3.75 | 98 | 3.675 |
| 4 | Yes | 50 | 23 | 5 | Corn Cob | 4.15 | 98 | 4.067 |
| 5 | No | 30 | 25 | 5 | Corn Cob | 3.7 | 97 | 3.589 |
| 6 | Yes | 30 | 27 | 5 | Corn Cob | 4 | 97 | 3.880 |
| 7 | No | 70 | 23 | 6 | Corn Cob | 3.6 | 98 | 3.528 |
| 8 | Yes | 70 | 25 | 6 | Corn Cob | 4.45 | 98 | 4.361 |
| 9 | No | 50 | 27 | 6 | Corn Cob | 3.6 | 97 | 3.492 |
| 10 | Yes | 50 | 23 | 7 | Corn Cob | 4.2 | 98 | 4.120 |
| 11 | Yes | 30 | 25 | 7 | Corn Cob | 4.1 | 99 | 4.060 |
| 12 | No | 30 | 27 | 7 | Corn Cob | 3.5 | 97 | 3.400 |
| 13 | No | 70 | 23 | 4 | Grain of rice | 2.22 | 95 | 2.110 |
| 14 | Yes | 70 | 25 | 4 | Grain of rice | 3.03 | 97 | 2.940 |
| 15 | No | 50 | 27 | 4 | Grain of rice | 2.42 | 95 | 2.300 |
| 16 | No | 30 | 23 | 5 | Grain of rice | 2.01 | 94 | 1.890 |
| 17 | Yes | 50 | 25 | 5 | Grain of rice | 3.13 | 97 | 3.040 |
| 18 | Yes | 30 | 27 | 5 | Grain of rice | 3.09 | 97 | 3.000 |
| 19 | No | 70 | 23 | 6 | Grain of rice | 2.52 | 96 | 2.420 |
| 20 | Yes | 70 | 25 | 6 | Grain of rice | 3.22 | 97 | 3.123 |
| 21 | No | 50 | 27 | 6 | Grain of rice | 2.13 | 96 | 2.044 |
| 22 | No | 30 | 23 | 6 | Grain of rice | 2.32 | 96 | 2.230 |
| 23 | Yes | 30 | 25 | 7 | Grain of rice | 3.18 | 97 | 3.084 |
| 24 | Yes | 50 | 27 | 7 | Grain of rice | 3.33 | 97 | 3.230 |
| 25 | No | 70 | 23 | 4 | Sesame husk | 0.9 | 92 | 0.830 |
| 26 | Yes | 70 | 25 | 4 | Sesame husk | 1.3 | 94 | 1.222 |
| 27 | No | 50 | 27 | 4 | Sesame husk | 0.85 | 92 | 0.782 |
| 28 | Yes | 30 | 23 | 5 | Sesame husk | 1.25 | 93 | 1.162 |
| 29 | No | 30 | 25 | 5 | Sesame husk | 0.8 | 92 | 0.740 |
| 30 | Yes | 50 | 27 | 5 | Sesame husk | 1.41 | 94 | 1.330 |
| 31 | No | 70 | 23 | 6 | Sesame husk | 0.95 | 92 | 0.874 |
| 32 | Yes | 70 | 25 | 6 | Sesame husk | 1.35 | 94 | 1.270 |
| 33 | No | 50 | 27 | 6 | Sesame husk | 0.92 | 94 | 0.864 |
| 34 | Yes | 30 | 23 | 7 | Sesame husk | 1.28 | 94 | 1.203 |
| 35 | Yes | 50 | 25 | 7 | Sesame husk | 1.3 | 94 | 1.222 |
| 36 | No | 30 | 27 | 6 | Sesame husk | 0.79 | 93 | 0.734 |
| 37 | No | 70 | 23 | 4 | Breadfruit seed | 7.34 | 96 | 7.050 |
| 38 | Yes | 70 | 25 | 4 | Breadfruit seed | 8.12 | 97 | 7.880 |
| 39 | Yes | 50 | 27 | 4 | Breadfruit seed | 7.98 | 97 | 7.740 |
| 40 | No | 50 | 23 | 5 | Breadfruit seed | 7.23 | 98 | 7.090 |
| 41 | No | 30 | 25 | 5 | Breadfruit seed | 6.89 | 95 | 6.550 |
| 42 | Yes | 30 | 27 | 5 | Breadfruit seed | 8.23 | 97 | 7.983 |
| 43 | No | 70 | 23 | 6 | Breadfruit seed | 6.93 | 97 | 6.722 |
| 44 | Yes | 70 | 25 | 6 | Breadfruit seed | 8.52 | 99 | 8.434 |
| 45 | Yes | 50 | 27 | 6 | Breadfruit seed | 8.31 | 98 | 8.143 |
| 46 | No | 50 | 23 | 7 | Breadfruit seed | 7.52 | 98 | 7.370 |
| 47 | Yes | 30 | 25 | 7 | Breadfruit seed | 7.84 | 98 | 7.683 |
| 48 | No | 30 | 27 | 7 | Breadfruit seed | 7.76 | 97 | 7.530 |
| Source | Sum of Squares | Df | Mean Square | F-Value | p-Value | |
|---|---|---|---|---|---|---|
| Model | 281.59 | 10 | 40.19 | 823.7 | <0.0001 | Significant |
| Air (A) | 5.76 | 1 | 5.76 | 144.15 | <0.0001 | |
| Humidity (B) | 0.2140 | 1 | 0.2140 | 6.26 | 0.0769 | |
| Temperature (C) | 0.0305 | 1 | 0.0305 | 0.8912 | 0.3513 | |
| Ph (D) | 0.1792 | 1 | 0.1792 | 5.24 | 0.0678 | |
| Substratum (E) | 274.94 | 3 | 91.40 | 2673.55 | <0.0001 | |
| Air—Substratum (A–E) | 0.4758 | 3 | 0.1586 | 4.64 | 0.004 | |
| Residual | 1.26 | 37 | 0.0342 | |||
| Cor Total | 282.85 | 47 |
| Std. Dev | 0.1973 | R2 | 0.9945 |
|---|---|---|---|
| Mean | 3.7424 | R2 adj | 0.9935 |
| C.V.% | 5.27 | R2 pred | 0.9921 |
| Adeq Precision | 89.0719 |
| Run | Air | Humidity (%) | Temperature °C | pH | Substratum | % Viability | ||
|---|---|---|---|---|---|---|---|---|
| 1 | Yes | 30 | 25 | 4 | Breadfruit seed | 8.1329 | 98 | 7.9703 |
| 2 | Yes | 30 | 27 | 4 | Breadfruit seed | 8.1327 | 98 | 7.9701 |
| 3 | Yes | 30 | 23 | 5 | Breadfruit seed | 8.1328 | 98 | 7.9702 |
| 4 | Yes | 70 | 25 | 5 | Breadfruit seed | 8.1431 | 98 | 7.9803 |
| 5 | Yes | 70 | 27 | 5 | Breadfruit seed | 8.1331 | 98 | 7.9705 |
| 6 | Yes | 50 | 25 | 6 | Breadfruit seed | 8.1334 | 98 | 7.9708 |
| 7 | Yes | 50 | 27 | 6 | Breadfruit seed | 8.1435 | 98 | 7.9807 |
| 8 | Yes | 30 | 23 | 7 | Breadfruit seed | 8.1332 | 98 | 7.9706 |
| 9 | Yes | 50 | 25 | 7 | Breadfruit seed | 8.1328 | 98 | 7.9702 |
| 10 | Yes | 70 | 27 | 7 | Breadfruit seed | 8.1334 | 98 | 7.9708 |
| Operating Values in the Study Case | Factor | Spore Production CFU.g−1 | % Increase | ||||
|---|---|---|---|---|---|---|---|
| Air | Humidity | Temperature | pH | Substrate | |||
| Before being improved. | No | 40% | 24 °C | 5 | Grain of rice | 3.974 | --- |
| After being improved. | Yes | 70% | 27 °C | 7 | Breadfruit seed | 100.7% | |
Disclaimer/Publisher’s Note: The statements, opinions and data contained in all publications are solely those of the individual author(s) and contributor(s) and not of MDPI and/or the editor(s). MDPI and/or the editor(s) disclaim responsibility for any injury to people or property resulting from any ideas, methods, instructions or products referred to in the content. |
© 2023 by the authors. Licensee MDPI, Basel, Switzerland. This article is an open access article distributed under the terms and conditions of the Creative Commons Attribution (CC BY) license (https://creativecommons.org/licenses/by/4.0/).
Share and Cite
Yáñez-Hernández, O.; Ríos-Lira, A.; Pantoja-Pacheco, Y.V.; Jiménez-García, J.A.; Vázquez-López, J.A.; Hernández-González, S. Increase of Trichoderma harzianum Production Using Mixed-Level Fractional Factorial Design. Appl. Sci. 2023, 13, 9244. https://doi.org/10.3390/app13169244
Yáñez-Hernández O, Ríos-Lira A, Pantoja-Pacheco YV, Jiménez-García JA, Vázquez-López JA, Hernández-González S. Increase of Trichoderma harzianum Production Using Mixed-Level Fractional Factorial Design. Applied Sciences. 2023; 13(16):9244. https://doi.org/10.3390/app13169244
Chicago/Turabian StyleYáñez-Hernández, Oscar, Armando Ríos-Lira, Yaquelin Verenice Pantoja-Pacheco, José Alfredo Jiménez-García, José Antonio Vázquez-López, and Salvador Hernández-González. 2023. "Increase of Trichoderma harzianum Production Using Mixed-Level Fractional Factorial Design" Applied Sciences 13, no. 16: 9244. https://doi.org/10.3390/app13169244