Article

Effect of Performance by Excessive Advanced Fuel Injection Timing on Marine Diesel Engine

1
Department of Navigation and Ship Handling System, Republic of Korea Naval Academy, Jinhae-gu 51704, Republic of Korea
2
MECA-TEC, Busan 48475, Republic of Korea
3
Division of Marine System Engineering, Korea Maritime and Ocean University, Busan 49112, Republic of Korea
*
Authors to whom correspondence should be addressed.
Appl. Sci. 2023, 13(16), 9263; https://doi.org/10.3390/app13169263
Submission received: 8 July 2023 / Revised: 10 August 2023 / Accepted: 12 August 2023 / Published: 15 August 2023
(This article belongs to the Section Marine Science and Engineering)

Abstract

:
The injection timing of fuel in a diesel engine affects the combustion condition. Advanced fuel injection prolongs the ignition delay, positively impacting the increase in maximum combustion pressure and improving output. However, excessively advanced fuel injection can cause knocking. Moreover, premature ignition results in increased compression work when the maximum combustion pressure occurs before top dead center (TDC). This study aimed to diagnose and rectify starting failures, noise, and vibrations in a commercially operated ship engine by measuring the combustion pressure during low load operation. The target engine was a 4-stroke diesel, and the fuel injection system was mechanically controlled by a camshaft. The measured engine exhibited a 4.5 °CA error between the TDC, determined by the flywheel mark and the actual TDC. This discrepancy was influenced by excessively advanced fuel injection timing. It was confirmed that fuel injection and ignition were excessively advanced in all cylinders. After readjusting the engine by delaying the fuel injection timing by approximately 10 °CA, the combustion pressure was remeasured. The ignition was delayed by approximately 6.5 °CA at the same load, and the ignition intervals were uniformly adjusted. As the ignition timing was retarded, the compression work decreased and the expansion work increased in each cylinder, resulting in improved output across all cylinders. The amplitude of crankshaft angular velocity variation significantly decreased, improving uneven rotational force.

1. Introduction

The output of a ship diesel engine for propulsion can be measured using the pressure measured inside the cylinder, and if the pressure inside the cylinder cannot be measured, the shaft horsepower (SHP) or brake horsepower (BHP) can be calculated through the torsion meter of the propulsion shaft. Indicated horsepower (IHP) calculation by measuring the combustion pressure of fuel inside the cylinder requires a crank angle sensor and a cylinder pressure sensor. Research and devices have been developed and applied to measure accurate output performance and reduce combustion analysis errors by supplementing top dead center (TDC) errors [1,2,3,4,5,6,7].
The reason for the discrepancy between the calculated engine output through combustion analysis and the measured engine output is due to TDC error. The causes of TDC error can include errors in the encoder pulse waveform, errors in the flywheel TDC mark, loss-angle error due to heat loss caused by the compression process of the actual engine not being adiabatic, loss-angle error due to pressure loss caused by blow-by gas, torsion of the crankshaft, and errors in the connection between the encoder and the crankshaft [1,2,5,8]. When measuring engine output, a TDC error of approximately 10% in diesel engines and approximately 4% in gasoline engines can cause errors in the indicated mean effective pressure of about 1.0 °CA and in the rate of heat release (ROHR) of about 25% [1]. Therefore, it is necessary to ensure at least a 0.1 °CA accuracy range for the TDC position.
Fuel injection timing greatly affects the performance and emission characteristics of diesel engines. The timing of fuel injection varies with engine speed, and in the case of low-speed engines, the injection timing is slower than it is in high-speed engines. Various studies have reported the effects of different fuel injection timings on engine performance and combustion characteristics. Eder et al. investigated the influence of fuel injection timing on the ignition and combustion characteristics of dual-fuel engines with a large bore [9]. Kim et al. reported on the combustion and emission characteristics by varying the fuel-spray angle and fuel injection timing conditions in a high-speed diesel engine [10]. Saravanan et al. presented research results on the reduction of NOx emissions by retarding fuel injection timing in an engine using biofuel. However, this was accompanied by a slight decrease in brake thermal efficiency [11]. On the other hand, Kannan and Anand achieved simultaneous improvements in brake thermal efficiency and a reduction in NOx emissions by using higher fuel injection pressures and faster fuel injection timing in an engine using biofuel [12].
For optimal combustion in diesel engines, fuel injection occurs before TDC, resulting in a period of ignition delay until compression ignition occurs. The extent of ignition delay significantly affects the subsequent combustion state. On the other hand, excessively advanced fuel injection leads to a sharp increase in combustion pressure, causing diesel knocking and thermal stress, reducing the reliability and durability of the engine [13,14,15]. To improve combustion conditions at low loads, a variable injection timing (VIT) system is applied and used in ships, which advances the fuel injection timing compared to the normal setting [16]. Furthermore, excessively advanced fuel injection timing can generate a torque in the opposite direction of the crankshaft due to the peak pressure occurring at before top dead center (BTDC) during the piston’s upward motion. In multi-cylinder engines, if the injection timing varies between cylinders, it can unevenly affect the rotational force on the crankshaft [17]. To obtain the most efficient rotational power of the crankshaft, it is necessary for the fuel to be injected before TDC, allowing for a period of ignition delay. Afterward, the combustion should initiate at TDC, ensuring that the explosive pressure is fully utilized in the expansion stroke.
Numerous previous studies have presented models for diagnosing engine performance using condition-based maintenance (CBM). Celik developed a performance map using artificial neural networks (ANNs) to predict fuel consumption and output [18]. Nahim et al. developed models for predicting faults in the cooling system and the lubricating system of marine diesel engines [19]. A model for predicting fuel consumption, average effective pressure, and exhaust gas temperature for a methanol engine was proposed by Cay et al. [20]. Basurko and Uriondo introduced a diagnostic model based on an ANN for propulsion engines of operating vessels [21]. While various models have been developed and presented for diagnosing and predicting the condition of marine diesel engines, studies that connect diagnostic results to problem improvement are scarce.
In this study, the combustion state of the marine engine in operation was diagnosed using an angle-based sampling method utilizing angle sensors to collect combustion pressure data. The “i-MEP” equipment, which incorporates output measurement and combustion analysis techniques [22,23], was employed for this purpose. The target engine under measurement was experiencing issues such as engine start failures, excessive noise, and vibrations. The root cause of these problems was identified as the occurrence of reverse torque due to an excessively advanced fuel injection timing angle. Based on the diagnostic results obtained from the measured combustion pressure, the causes of engine start failures, noise, and vibrations, as well as the identified issues and outcomes for restoring the engine to normal operation, are reported.

2. Methods

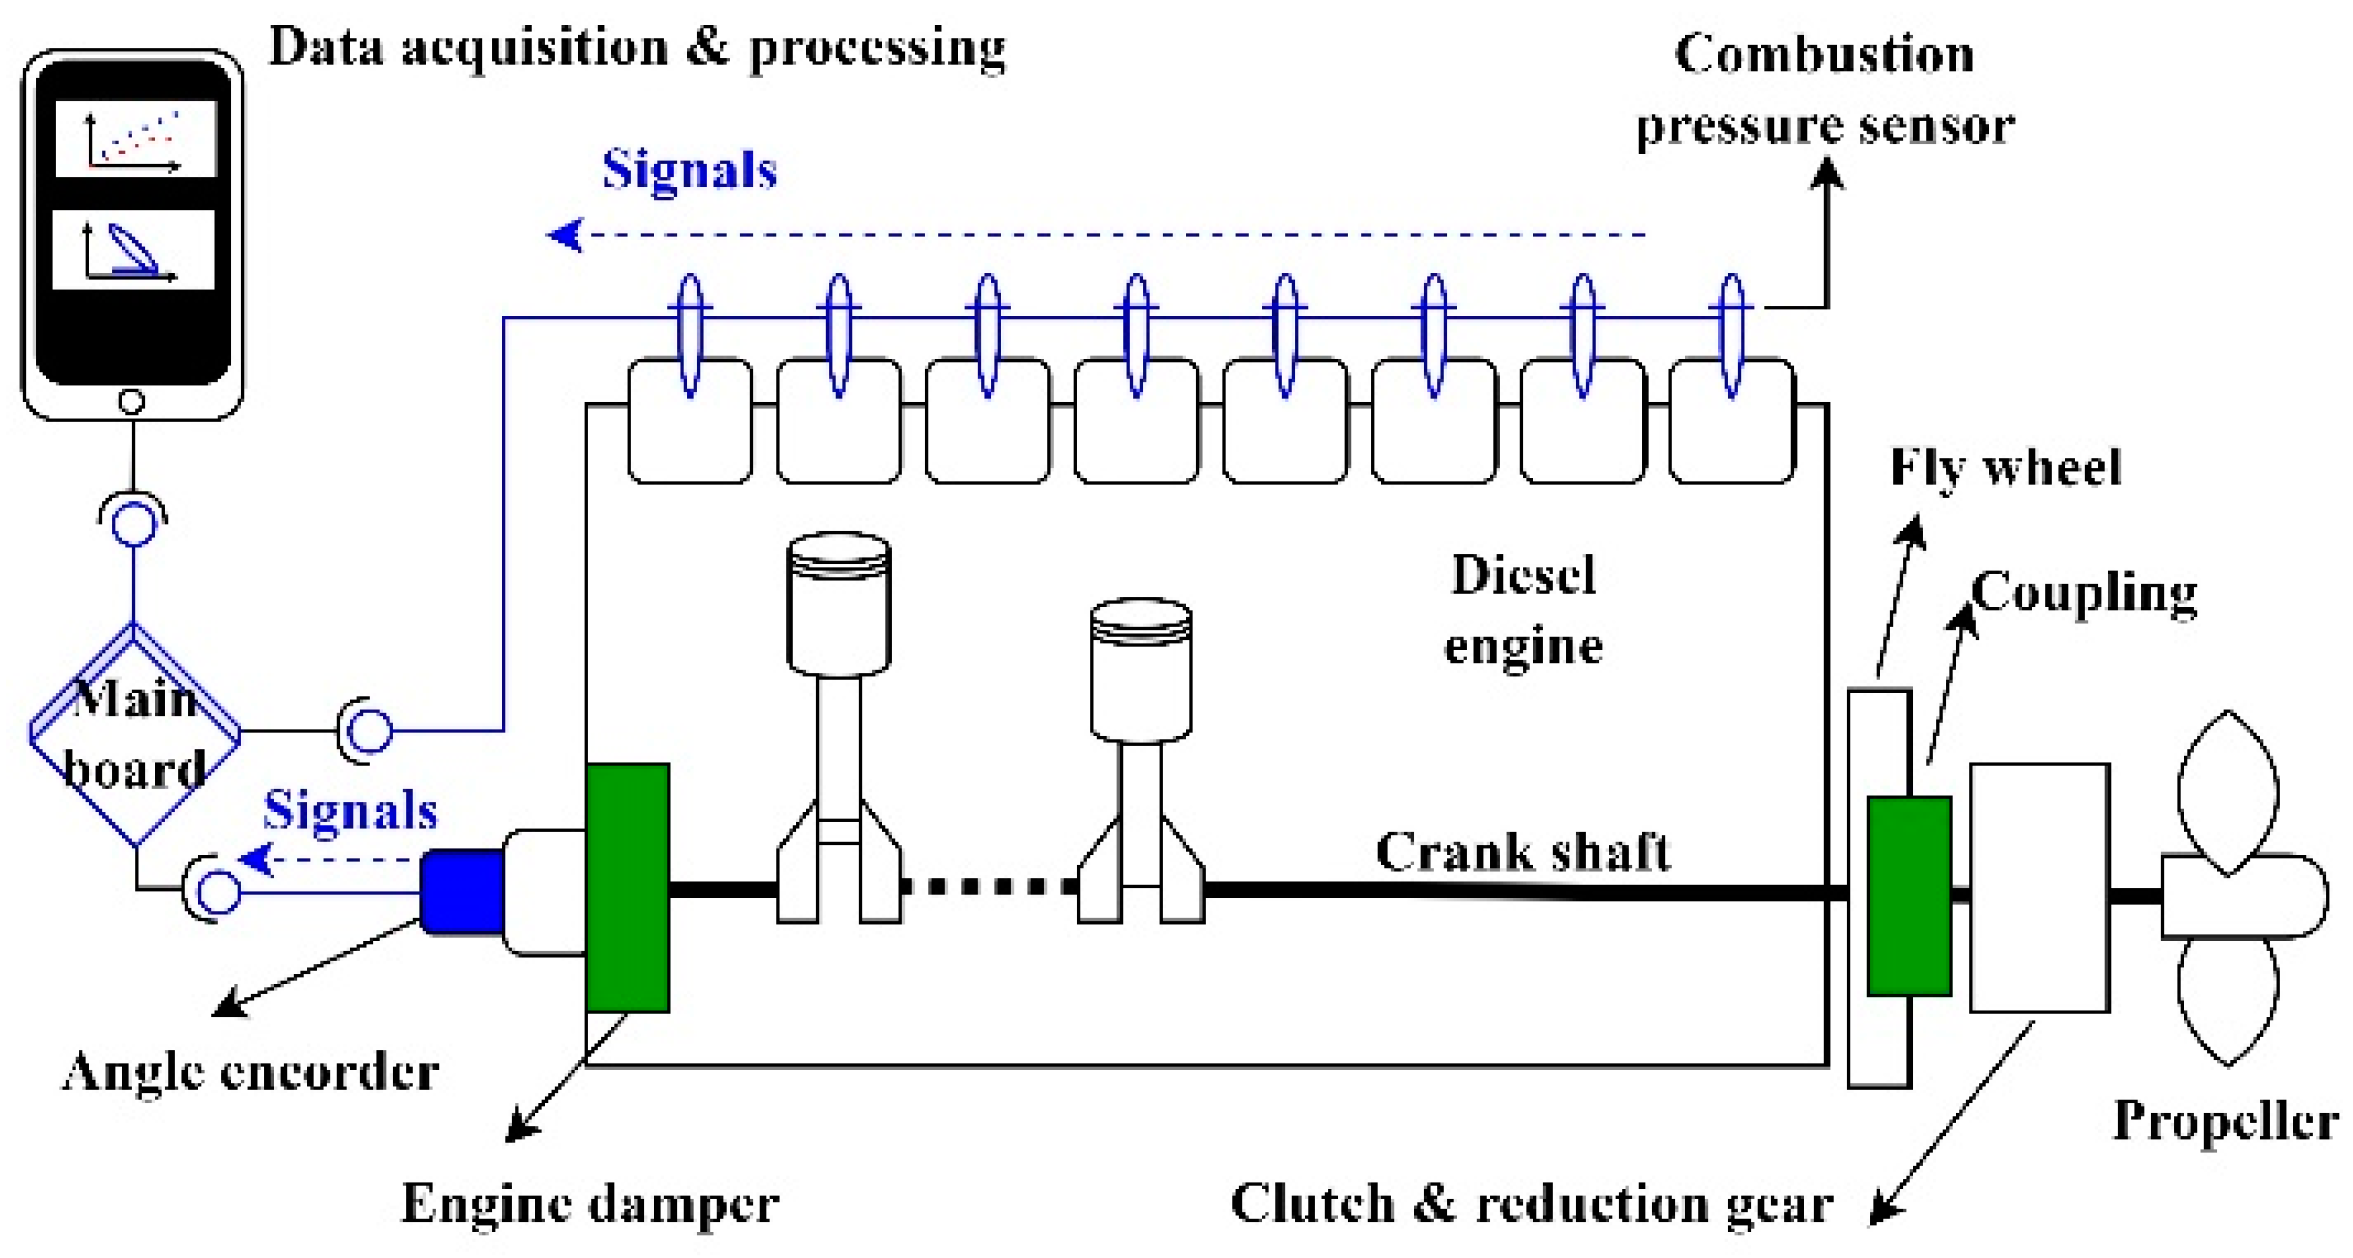
2.1. Experimental Methods

The target engine used in this study was an inline 8-cylinder medium-speed diesel engine commonly employed for propulsion, exhibiting abnormal noise and vibration phenomena during operation. The target engine had the following issues during starting and operation.
  • The flywheel’s TDC mark and the piston’s TDC did not align, and the fuel injection timing was adjusted based on the flywheel TDC mark of each cylinder.
  • While diesel engines with 6 or more cylinders could start at any crank angle, the target engine had a specific crank angle, where air running was not possible. Therefore, it was set to turn after the TDC mark by 10 °CA before attempting to start the engine.
  • Two to 3 failed start attempts occurred before the transition to fuel running. This phenomenon was more pronounced when the engine’s preheating was insufficient.
  • Compared to other engines, the target engine exhibited more vibration and noise, especially a dull noise, such as knocking during no-load (idling) operation.
Table 1 presents the detailed specifications of the target engine. According to the normal continuous rating (NCR), the engine operated at a speed of 620 rpm, and the maximum continuous rating (MCR) output was 3310 kW. The fuel injection pump was a spill port type with a mechanically controlled fuel injection method, in which the injection timing was determined by the camshaft.
Figure 1 illustrates the configuration of the experimental setup used for diagnosing the target engine. The crank angle sensor, an encoder, was installed at the front end of the engine to acquire pulse signals in the data acquisition system. Combustion pressure data from each cylinder were collected using combustion pressure sensors. A damper was installed at the front end of the engine, where the encoder was positioned to counterbalance torsional vibrations and axial vibrations.
Figure 2 shows the waveform of the angle encoder. The encoder used in the experiment was an incremental encoder with a reference pulse (Z pulse). The A and B pulses had a phase difference but the same resolution, while the Z pulse had a pulse width of 1/4 of the A and B pulse widths. With the engine in a stopped state, the reference pulse of the encoder, Z pulse (which occurs once per revolution), was aligned with the No. 1 cylinder TDC mark on the flywheel. By utilizing the A and B pulses, the TDC of the eight cylinders, following the firing order, could be obtained at intervals of 720 °CA (2 revolutions, 1 cycle) relative to the TDC of the No. 1 cylinder. The data sampling was triggered by the “A” pulse of the angle encoder, and the sampling was performed using a 720-pulse encoder per revolution, acquiring data at intervals of 0.5 °CA.

2.2. Calculation of Rate of Heat Release and Turning Force of the Crankshaft

The rate of heat release (ROHR) is calculated using the measured combustion pressure. The ROHR is computed as the total enthalpy change in the combustion chamber, and it is determined by the internal and external energy variations, as shown in Equation (1).
δ Q h d θ = 1 k 1 V d p d θ + k p d V d θ
The specific heat ratio [24] is calculated as a function of temperature, as shown in Equation (2).
k = 1.4373 1.318 × 10 4 · T θ + 3.12 × 10 8 · T θ 2 4.8 × 10 2 / λ
The calculation of temperature is determined using the gas state equation. The mass of the gas is based on the intake pressure and intake temperature of the incoming air into the cylinder. ( m : mass of gas, R : gas constant)
T θ = p · V m · R
The internal energy change is calculated as shown in Equations (4) and (5), and the external energy change is calculated using Equation (6) and the measured pressure, where d is the diameter of cylinder and γ is the ratio of the length of the connecting rod to the radius of the crankshaft.
d p d θ = 1 12 p ( i 2 ) + 8 ( p i + 1 p i 1 ) p ( i + 2 )
V θ = V c + π d 2 4 · r · 1 c o s θ + γ 1 1 s i n 2 θ γ 2
d V d θ = π d 2 4 · r · s i n θ · c o s θ γ 1 s i n 2 θ γ 2
The turning force ( T f ) of the crankshaft by the explosive pressure in the cylinder is calculated using Equation (7), where F is the vertically acting force on top of the piston.
T f = F s i n θ 1 + c o s θ γ 2 s i n 2 θ

3. Results

3.1. Diagnostics and Solutions with Engine Combustion Analysis
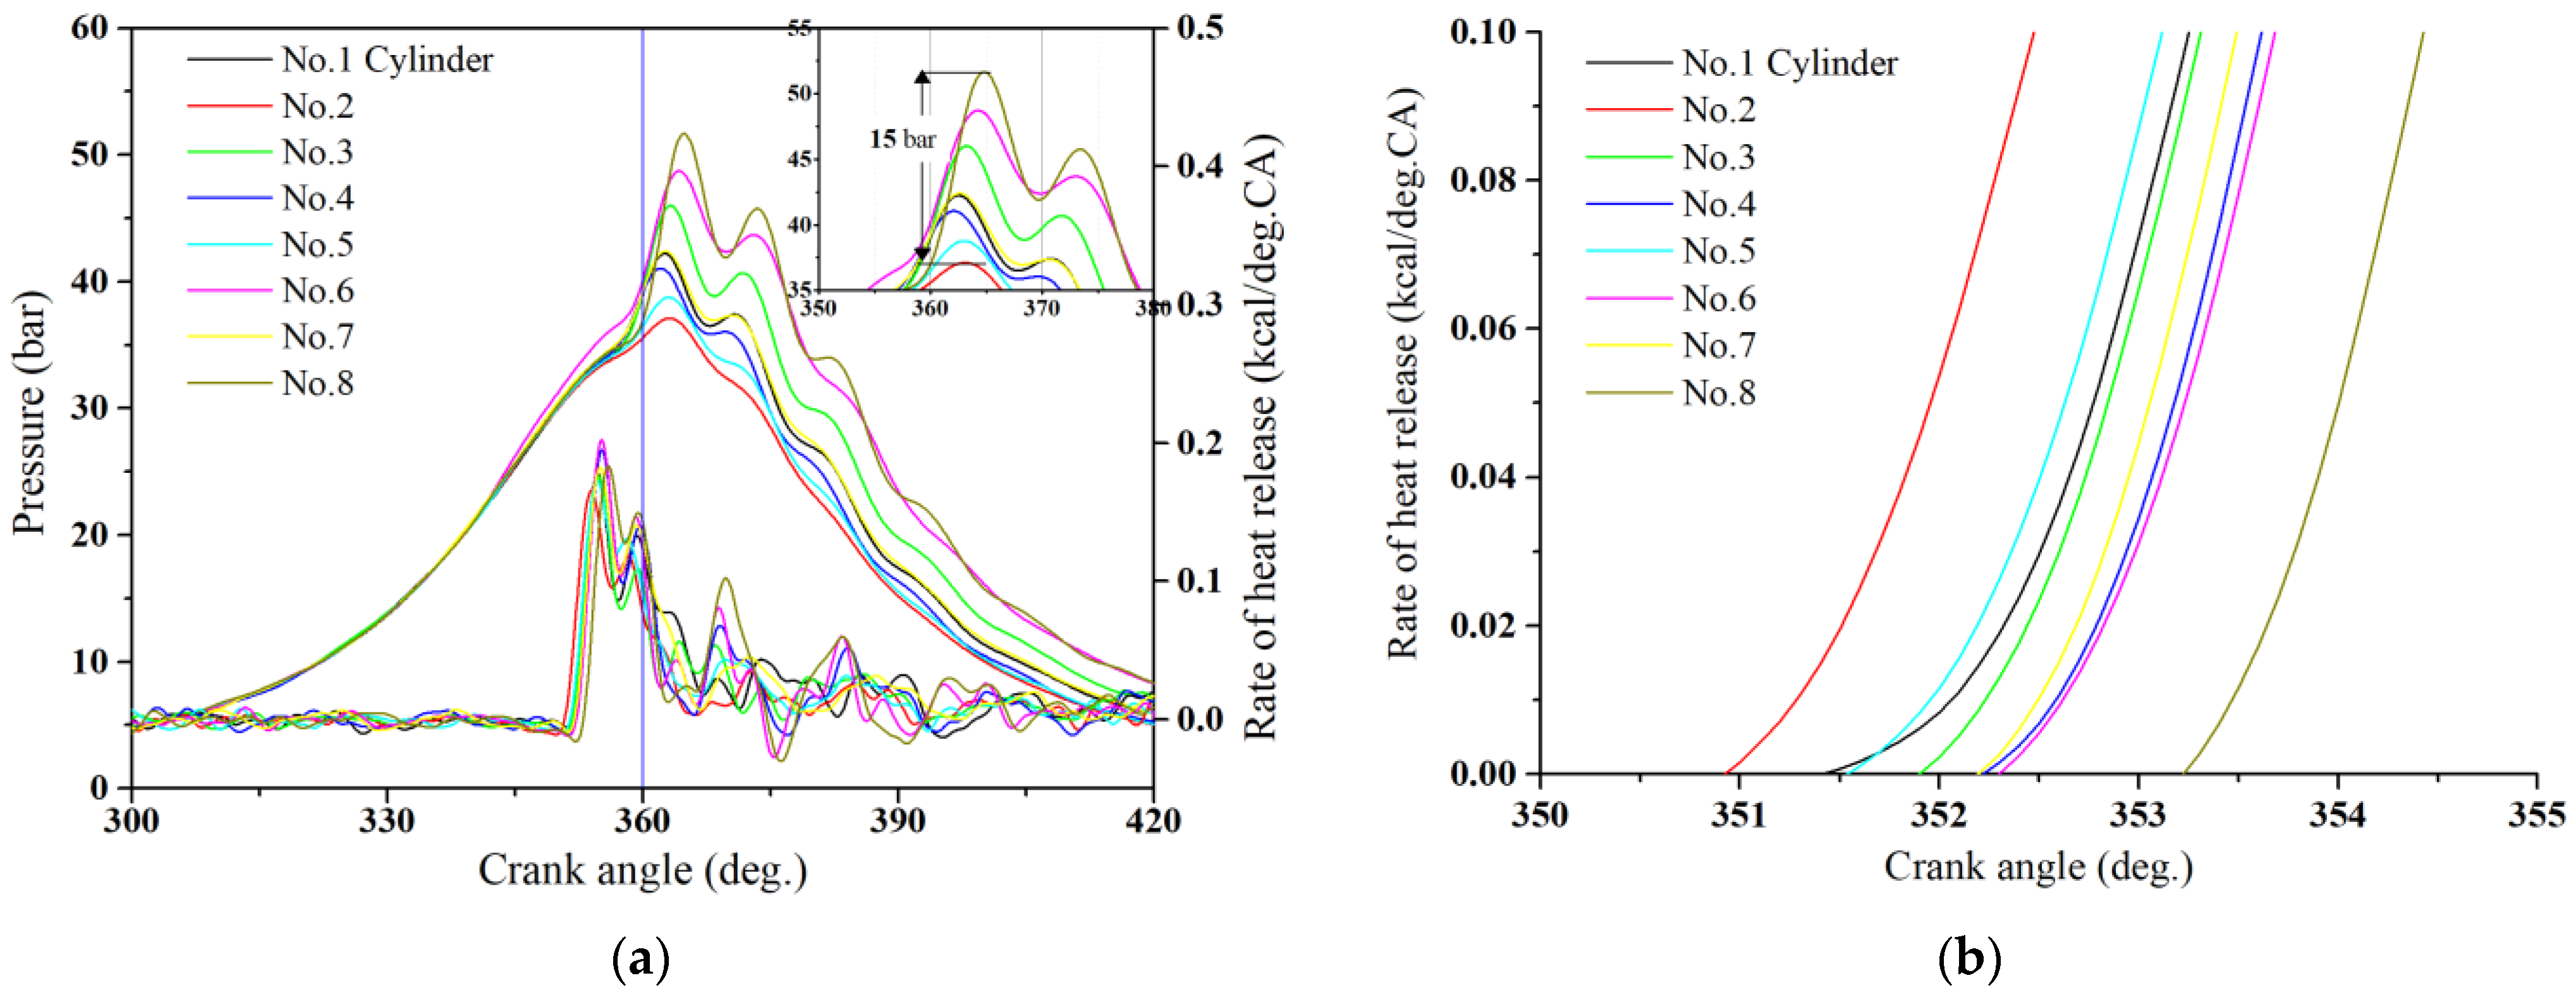
3.1.1. Diagnostics

Figure 3a represents a compression-pressure diagram obtained by operating the engine at minimum load with the clutch disengaged and the fuel cut off, solely compressing air, to determine the position of TDC. Figure 3b shows the derivative diagram of the compression-pressure diagram in Figure 3a. In this case, the damping effect of the engine damper was negligible, allowing us to determine the position of TDC through this derivative diagram. From the diagram in Figure 3a, where all eight cylinders are overlapped, we could confirm that the target engine was an engine in which combustion occurred at equal intervals between cylinders. Additionally, since the Pcomp values were almost identical, we could determine that the sealing condition of the cylinders was the same for all cylinders. In Figure 3b, by observing the derivative diagram, we could see that the Pcomp was positioned 4.5 °CA after the TDC mark on the flywheel. Since all cylinders exhibited the same TDC error, the loss of angle could be considered as a possible cause. However, loss of angle typically occurs within a range of 1.0 °CA [5]. Therefore, the TDC error shown in Figure 3b was determined to be primarily caused by errors in the flywheel’s TDC mark, rather than by loss-angle error.
Figure 4 represents the cylinder pressure and ROHR graphs during fuel running at minimum load in the idling state. In Figure 4a, the cylinder pressure and the ROHR graphs are shown together. In all cylinders, after the common region of premixed combustion, fuel combustion did not occur continuously, and post-combustion caused two instances of Pmax. It can be observed that incomplete combustion occurred due to insufficient air supply at low load conditions. There was a significant difference in Pmax among the cylinders, with a 10.4 bar difference between No. 2 cylinder and No. 8, with Pmax values of 42.5 bar and 52.9 bar, respectively. The cause of this difference could be identified from the magnified graph of the ignition timing in Figure 4b, which represents the ROHR graph. The variation in ignition timing among the cylinders resulted in differences in the ignition delay period, leading to variations in Pmax. Furthermore, all cylinders had different positions of Pmax, with a maximum difference of 1.5 °CA.
Figure 5 shows the combustion pressure and ROHR curves for each cylinder at 43% load. Figure 5a illustrates that the ignition occurred before TDC and the Pmax happened after TDC for all cylinders. There was a difference of 10 bar in Pmax between the No. 1 cylinder and the No. 3 cylinder. The Pmax of the No. 1 cylinder was 110 bar, which matched the Pmax at 90% load that was observed in the sea trial report. Figure 5b presents the ROHR curve, indicating the ignition delay period for each cylinder. Although the design profile of the fuel injection timing for the engine under this study was unknown, considering that typical medium-speed 4-stroke marine engines have an injection timing of approximately BTDC 15 °CA, the fuel injection timing for the engine in question appeared to be excessively advanced, reaching a maximum of BTDC 21 °CA. Generally, an advanced injection timing can increase Pmax by prolonging the ignition delay period and improve engine performance [3,7,8]. However, excessively advanced injection timing can lead to abnormal combustion such as knocking, emphasizing the need for appropriate injection timing and ignition delay [9]. As shown in Figure 5b, the ignition timing of the fuel was observed to occur at approximately BTDC 7–9 °CA, which was significantly earlier than engines where ignition generally occurs at TDC or after top dead center. This resulted in increased compression work and caused a decrease in turning force and vibration during the compression process.

3.1.2. Solutions

The interpretations of the engine’s condition based on Figure 3, Figure 4 and Figure 5 are as follows:
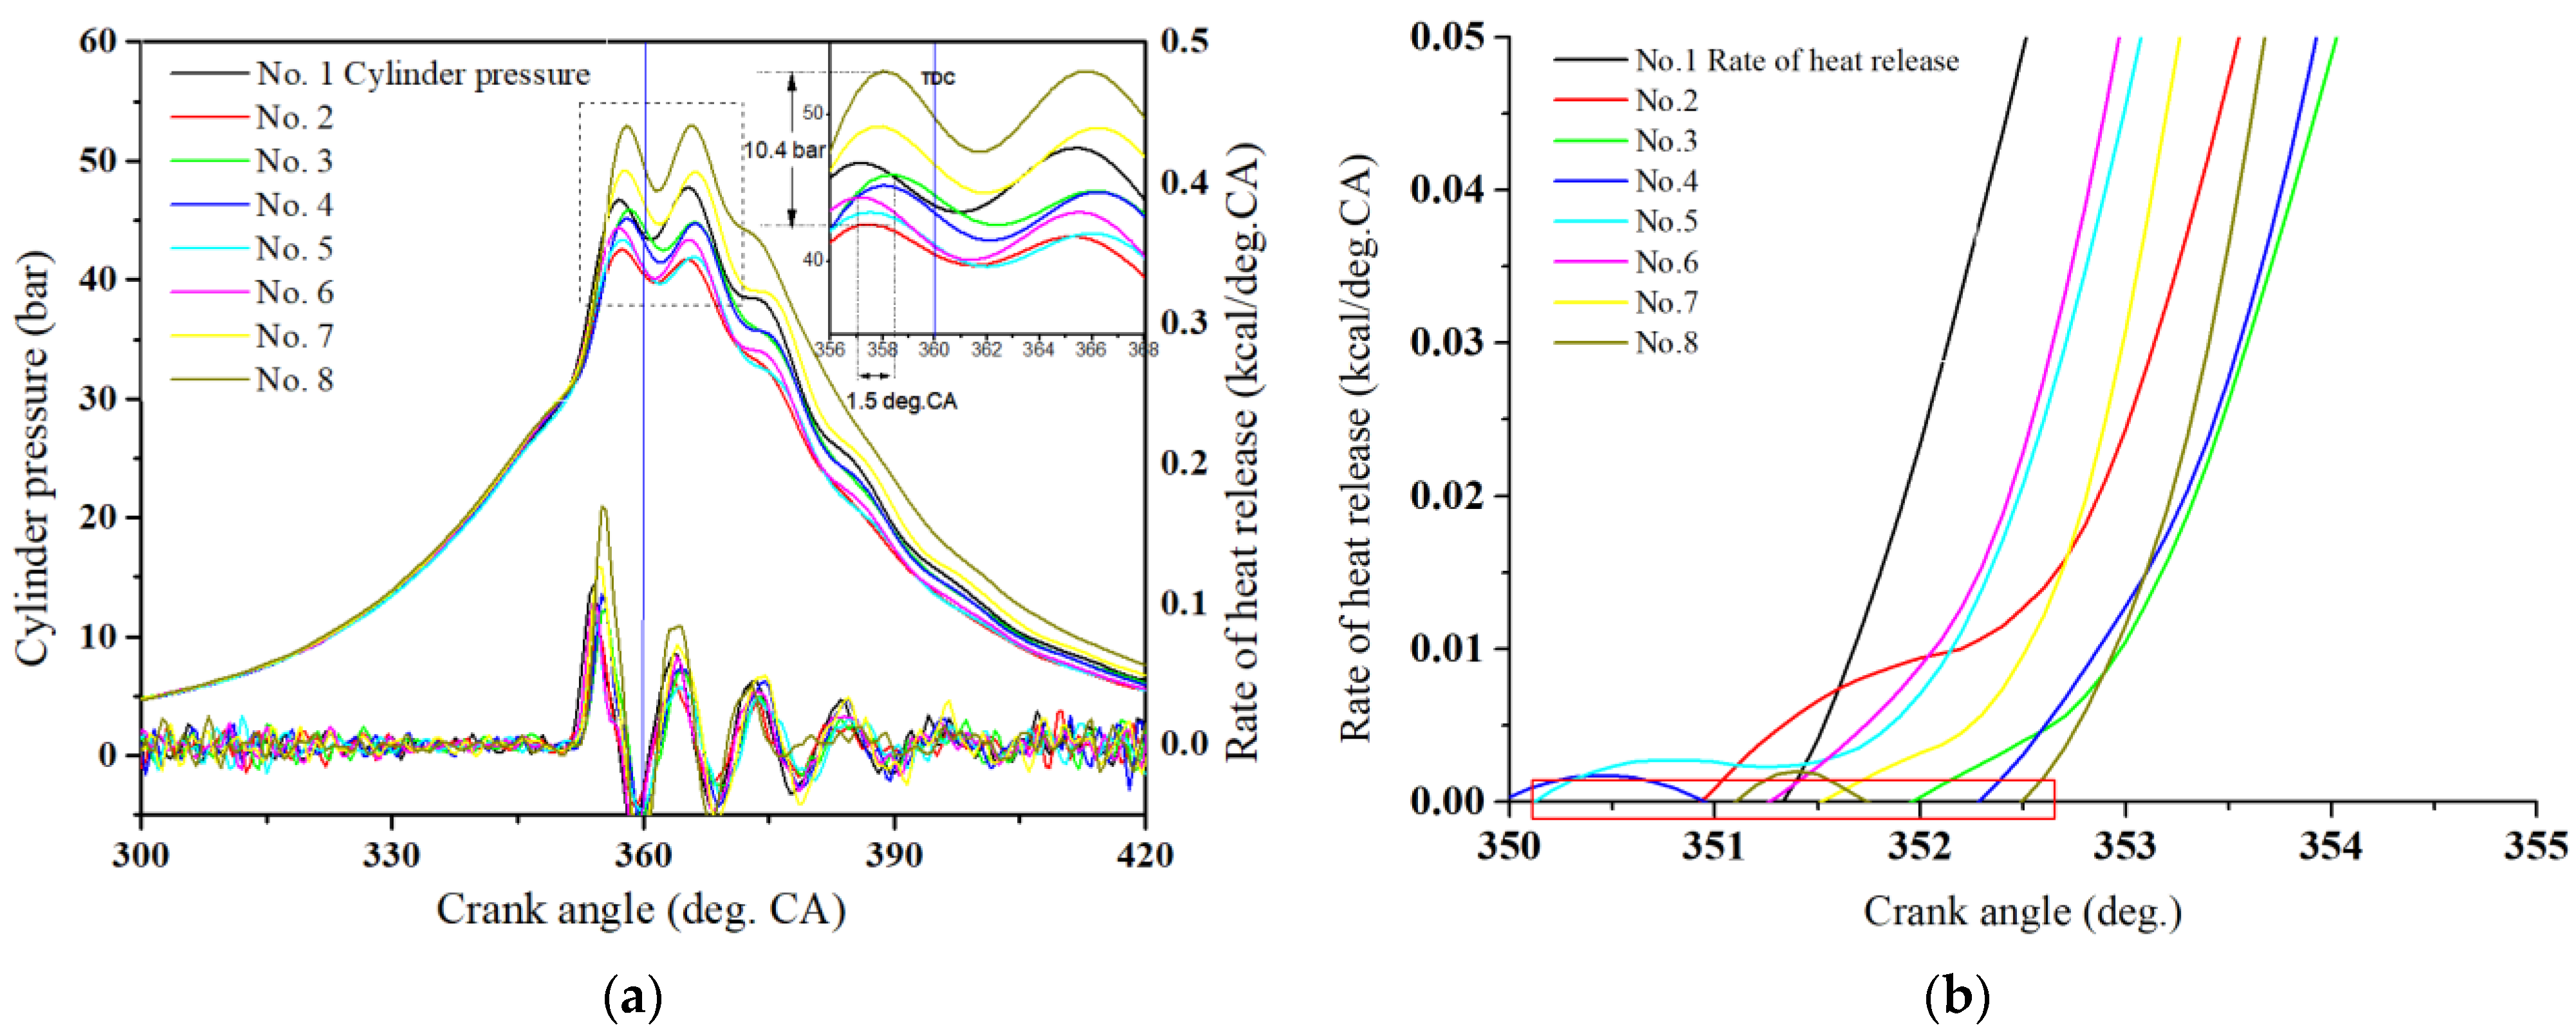
  • The flywheel TDC mark was positioned 4.5 °CA ahead of the actual TDC.
  • The fuel injection timing was more advanced than that of a typical 4-stroke medium-speed diesel engine.
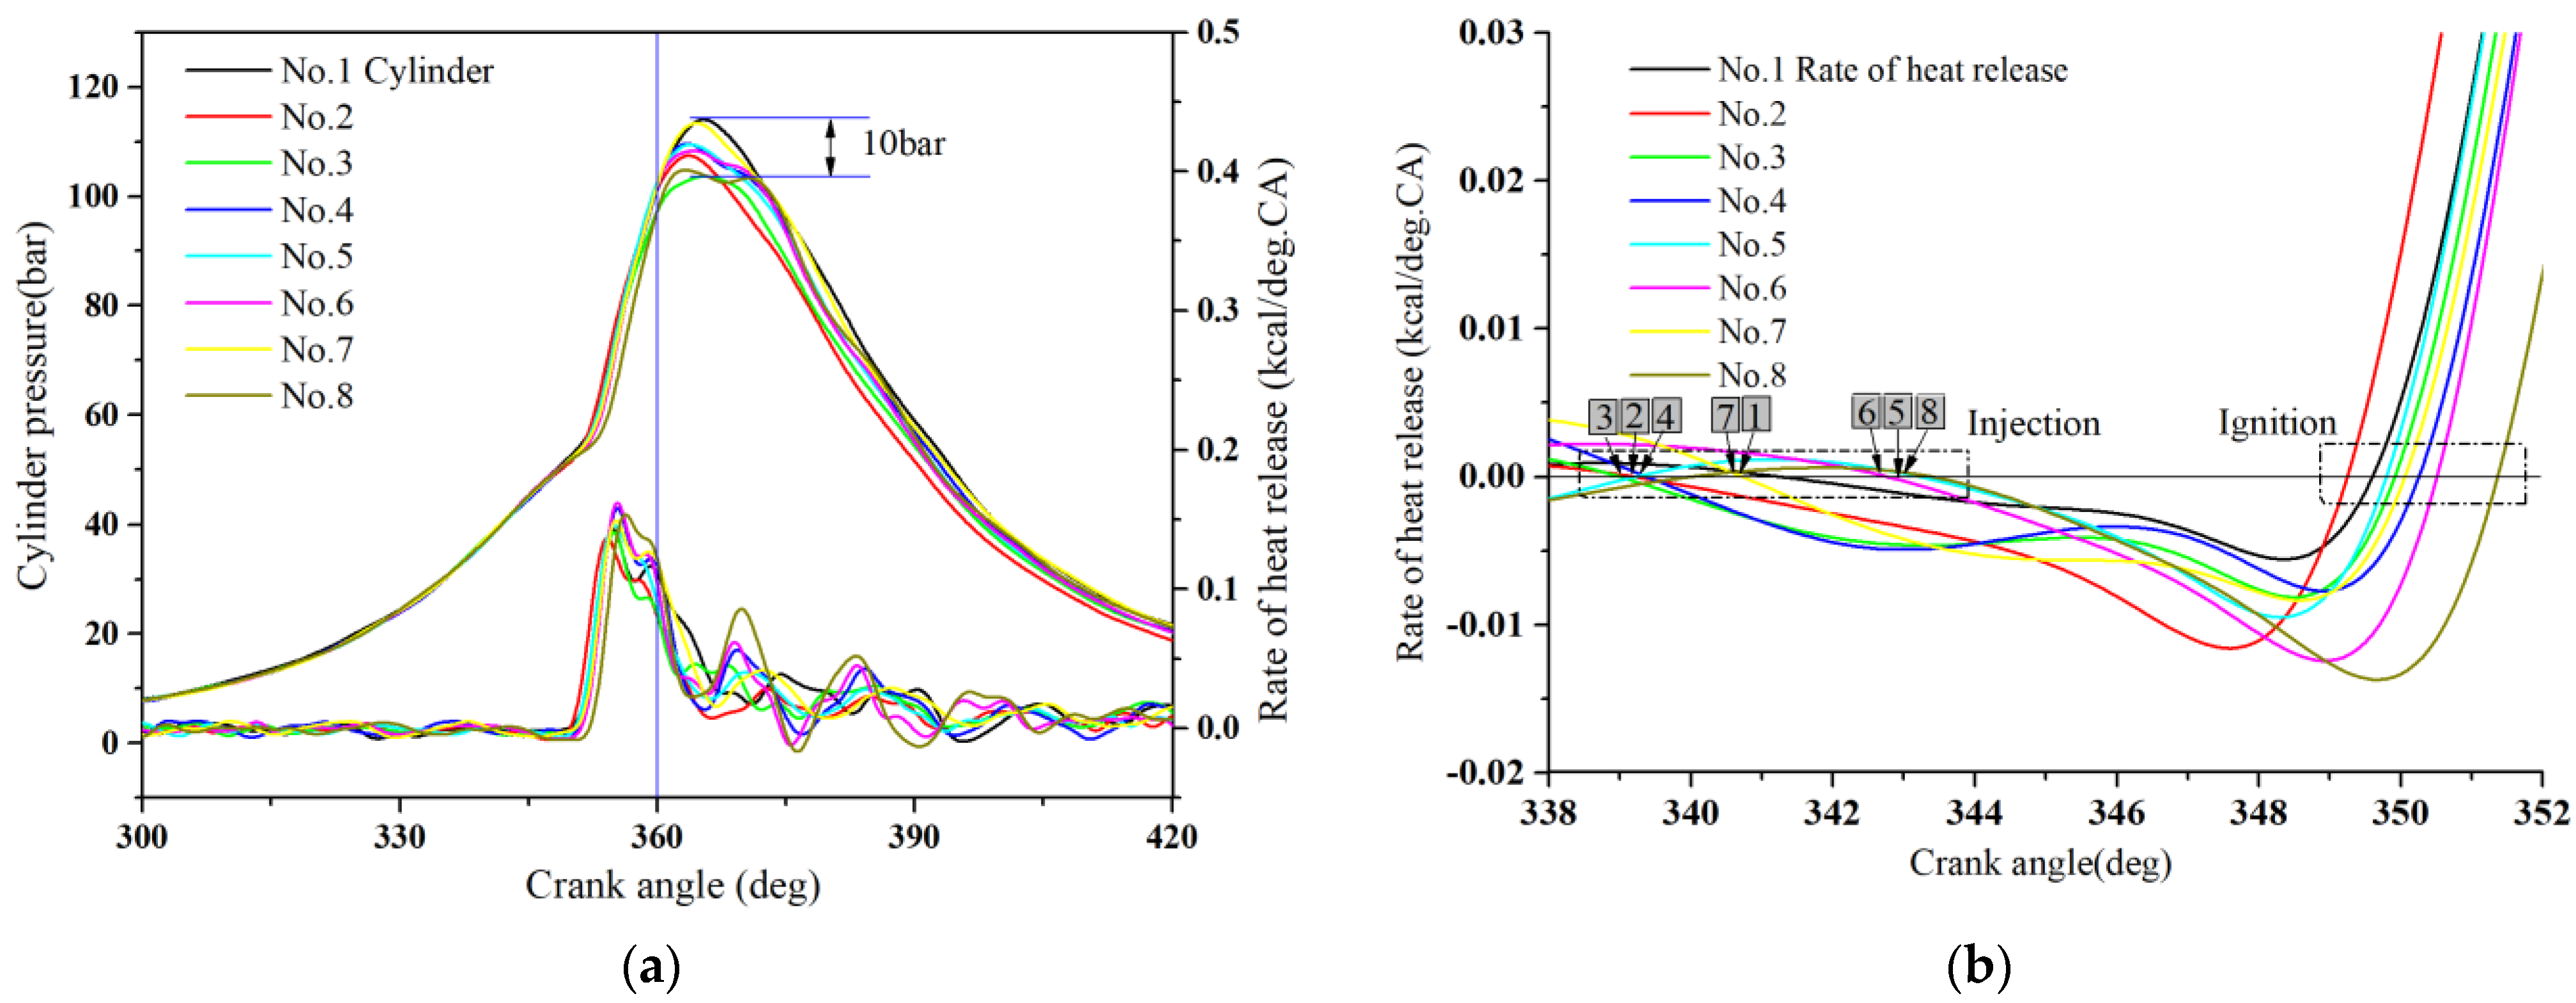
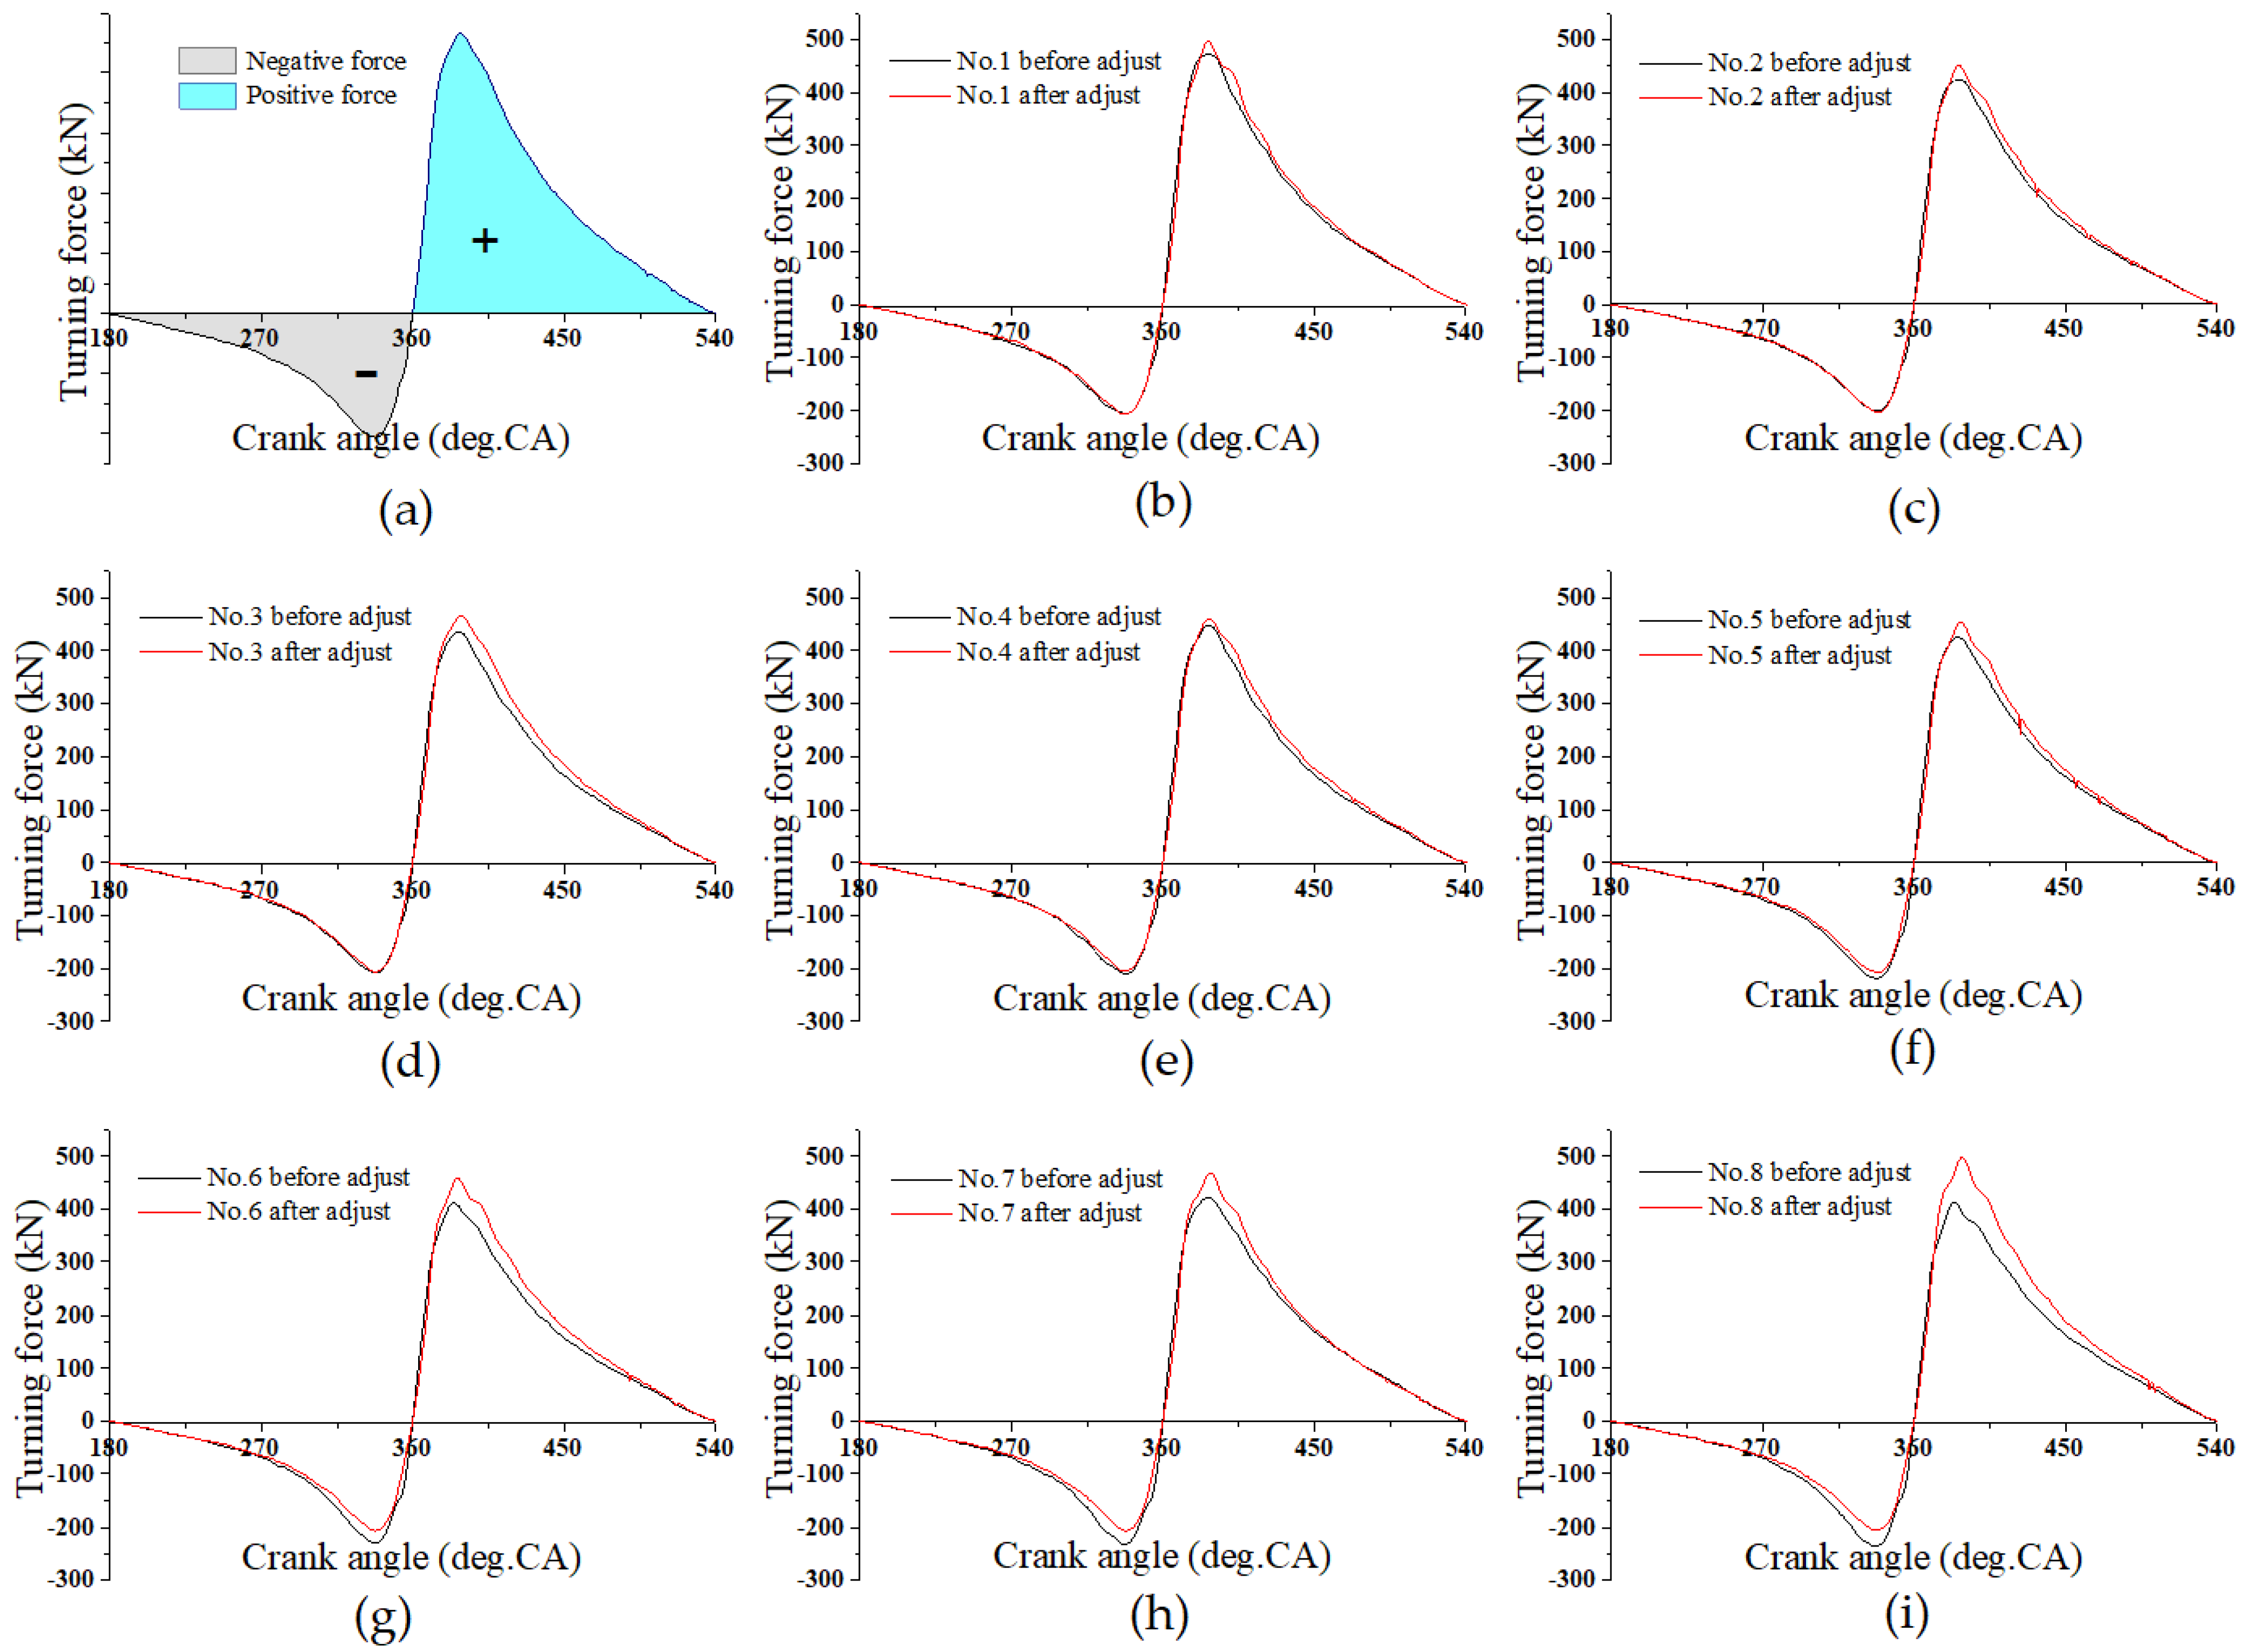
  • Due to excessively advanced fuel injection timing, ignition and Pmax occurred BTDC. This resulted in increased compression work and the occurrence of reverse torque. The dull noise and vibration observed in the engine are believed to have been caused by these combustion phenomena.
Numbered lists can be added. Therefore, considering the condition of the engine, the following adjustments were made simultaneously with the replacement of the fuel injection valves:
  • The fuel injection timing was retarded by 6–7 °CA.
  • By adjusting the fuel injection timing between each cylinder, the ignition timing of all cylinders converged within a range of 1 °CA.
  • The fuel injection quantity was adjusted to ensure that the output deviation of each cylinder was within a range of 3%.

3.2. Before-and-after Comparison of Engine Adjustments

Figure 6 shows the results of measuring the combustion pressure of all cylinders in the idle running state after adjusting the fuel injection timing. Figure 6a simultaneously displays the cylinder combustion pressure and ROHR curves. A comparison with the graph of Figure 4a, which represents the idle running state before adjusting the fuel injection timing, reveals that the position of Pmax shifted from before top dead center (TDC) to after TDC. As the ignition delay period decreased, Pmax decreased in all cylinders. However, the difference in Pmax between cylinders increased to 15 bar, which was higher than the pre-adjustment difference. Performance measurements of a turbocharged diesel engine under no-load conditions always show suboptimal combustion, due to insufficient air flow, so a performance comparison requires comparison in high-load operating ranges. In the Figure 6b graph, the ignition timing can be observed. The ignition timing was approximately 351 to 353 °CA, which was about 1 degree later compared to the pre-adjustment.
Through the Figure 6 analysis, it can be observed that the portion of combustion occurring before TDC in the engine was significantly reduced. In actual engine observations, it was noted that the engine’s dull noise and starting failure issues were also eliminated. Based on these findings, it can be concluded that all the anomalies observed in the engine were caused by excessive advancement of fuel injection timing, leading to negative torque. However, there is still room for improvement, in terms of output uniformity between cylinders.
Figure 7 represents the pressure and ROHR waveforms after adjusting the fuel injection timing. Despite the experimental conditions on an actual operating ship engine, where the engine operated at the same speed (511 rpm), a slight load difference of approximately 3% occurred due to the cargo-loading condition (ballast vs. laden). However, it was deemed acceptable for comparison purposes. Comparing the fuel injection timing and ignition timing between Figure 5 and Figure 7, it can be observed that the fuel injection timing shifted from 339 °CA to 343 °CA to 352 °CA to 354 °CA, and the ignition timing shifted from 349 °CA to 351 °CA to 356.5 °CA to 357.5 °CA after adjusting the fuel injection timing. The ignition timing of the fuel was delayed by approximately 6.5 °CA via the adjustment of fuel injection timing, and the ignition timing of each cylinder converged within a range of 1 °CA. Pmax decreased by approximately 15 bar, and the ∆Pmax between cylinders also decreased by approximately 2.5 bar.
Figure 8 illustrates the pressure–volume (P–V) diagrams before and after the adjustment of fuel injection timing. In this graph, although Pmax decreased due to the reduction in ignition delay period, the P–V area increased due to the prolonged diffusive combustion phase, which is a characteristic of diesel engines. This indicates an increase in the indicated work, as shown in the graph.
Table 2 compares the compression, expansion, and indicated work during one cycle in the P–V diagram before and after adjusting the fuel injection timing. The compression work before the fuel injection timing adjustment appeared to be larger than the compression work after the adjustment in all cylinders. A larger compression work resulted in greater losses during the cycle. The expansion work after the fuel injection timing adjustment was larger than the expansion work before the adjustment, indicating an increase in indicated work throughout the overall cycle in all cylinders. In the P-theta diagram, it is observed that the position of Pmax before the fuel injection timing adjustment was located before TDC in all cylinders. Pmax before TDC exerted a force in the opposite direction to the piston’s movement during the compression process. As a result, the compression work increased while the expansion work decreased.
Figure 9 represents the explosive force of all cylinders as the turning force of the crankshaft. Figure 9a shows the turning force of crankshaft from 180 degrees to 360 degrees of crank angle, indicating negative force from BDC to TDC, and from 360 degrees to 540 degrees of crank angle, indicating positive turning force. The graphs in Figure 9b–i visually demonstrate that the positive force after the adjustment was increased in all cylinders compared to the force before the adjustment. In Figure 9f–i, it can be observed that the torque during the expansion process was increased after the adjustment. The diagram of turning force revealed that after adjusting the fuel injection timing, the negative force decreased and the positive force increased, resulting in an overall increase in the turning force of the crankshaft.

4. Discussion

This study analyzed the combustion pressure measured during the diagnosis and recovery process of abnormal operating conditions in a ship’s engine during actual navigation. The abnormal phenomena observed included engine startup failure, dull noise from the combustion chamber during operation, and engine vibration. Ship engines are classified into air running and fuel running, with the latter using compressed air for ignition instead of battery startup. In the measured engine, which experienced a failure during fuel running, it was determined that there was an issue with the fuel injection timing. The analysis of the measured data revealed that the injection timing was excessively advanced, as indicated by the position of Pmax. The difficulty in achieving the designed fuel injection timing for the measured engine posed a limitation in establishing criteria for engine recovery. Additionally, the fuel pump lead value was adjusted as a method of adjusting the injection timing. This method involved adjusting the height of the thrust piece of the roller guide between the fuel pump and camshaft. Therefore, there was a limitation in accurately determining the exact degree of change in crank angle [25].
Thus, in this study, confirmation was made using the pressure-theta diagram and a ROHR diagram. To analyze the engine cycle, a data acquisition device with a very high sampling rate is required. In this study, the cylinder pressure was measured at a crank angle interval of 0.5 degrees, necessitating data collection at a sampling rate of at least 6000 Hz. Despite applying filters to remove noise from data, there were difficulties in accurately determining the fuel injection timing from the ROHR curve, due to a significant amount of noise. Via the physical adjustment of injection timing delay and the ROHR diagram, it was confirmed that the engine’s injection timing was excessively advanced prior to adjustment. The start failure was resolved by adjusting the injection timing, but the study had limitations in providing conclusive data to support this.
The engine equipped with turbocharging demonstrates proper performance of the turbocharger under the NCR load, as it operates at its full potential. However, at low loads, the diesel engine suffers from insufficient airflow [26]. Typically, the NCR load is set at around 85–90% of the MCR, while the 43% and 46% loads measured in this study represented the low-load range [27]. Since the focus of this study was not on performance improvement at low loads but rather on the impact of excessive fuel injection timing, the data collected at low loads were considered valid. However, to ensure greater confidence in the study results, data from the commercially operating NCR range would be valuable. Due to limitations in applying desired experimental scenarios in actual commercially operated vessels, the inability to collect data at NCR loads was a limitation of this study.
Considering the abnormal symptoms of noise and vibration in the engine, presenting the results of noise and vibration measurements would have led to a higher level of research outcomes. While there is disappointment about not having measured data on noise and vibration, the improvement level of vibration can be inferred through the variation of angular velocity data of the crankshaft [28]. Figure 10 presents the angular velocity variation data of the crankshaft before and after the adjustment of fuel injection timing, along with the corresponding fast Fourier transform (FFT) results. Figure 10a shows the angular velocity variation before and after the adjustment within one cycle, while Figure 10b presents the normalized angular velocity variation. Figure 10c represents the FFT result of the angular velocity variation data from Figure 10a. In Figure 10b, it can be observed that the variation of the crankshaft angular velocity before the adjustment of injection timing was close to 20% at maximum. After the adjustment, the angular velocity variation occurred within 10%. The cause of this was attributed to the ignition timing and the different interval and magnitude of Pmax. After the adjustment of fuel injection timing, the ignition timing was uniformly adjusted, and the position of Pmax shifted from BTDC to ATDC, resulting in a reduced difference in Pmax. This adjustment is believed to have influenced the angular velocity variation. Since the significant fluctuation in crankshaft angular velocity corresponds to engine vibration, the reduction in engine vibration through the adjustment of injection timing can be indirectly confirmed by the data on angular velocity variation of the crankshaft. As shown in the graph in Figure 10c, the FFT result before the adjustment of injection timing exhibited significant amplitude at around 34 Hz. This frequency corresponded to the occurrence of four power strokes per revolution at 511 rpm. Continuous high amplitude at specific frequencies leads to engine vibration. Therefore, it can be inferred that the adjustment of injection timing reduced the amplitude and, consequently, decreased engine vibration.

5. Conclusions

This study aimed to measure and diagnose the performance of an engine operating in commercially operated vessels, based on abnormal phenomena. Additionally, the study reported the results of readjusting the fuel injection timing to restore the engine’s performance and remeasuring its performance. The findings of the study can be summarized as follows.
  • The engine’s starting fail, dull noise, and vibrations were attributed to excessively advanced fuel injection, resulting in premature ignition and peak pressure occurring before TDC, as well as significant variations in Pmax height among cylinders.
  • By retarding the injection timing by approximately 10 degrees, Pmax decreased by up to 15 bar and the ignition timing was delayed by 6.5 degrees.
  • Excessively advanced ignition reduced the work performed during the cycle by increasing compression work and decreasing expansion work.
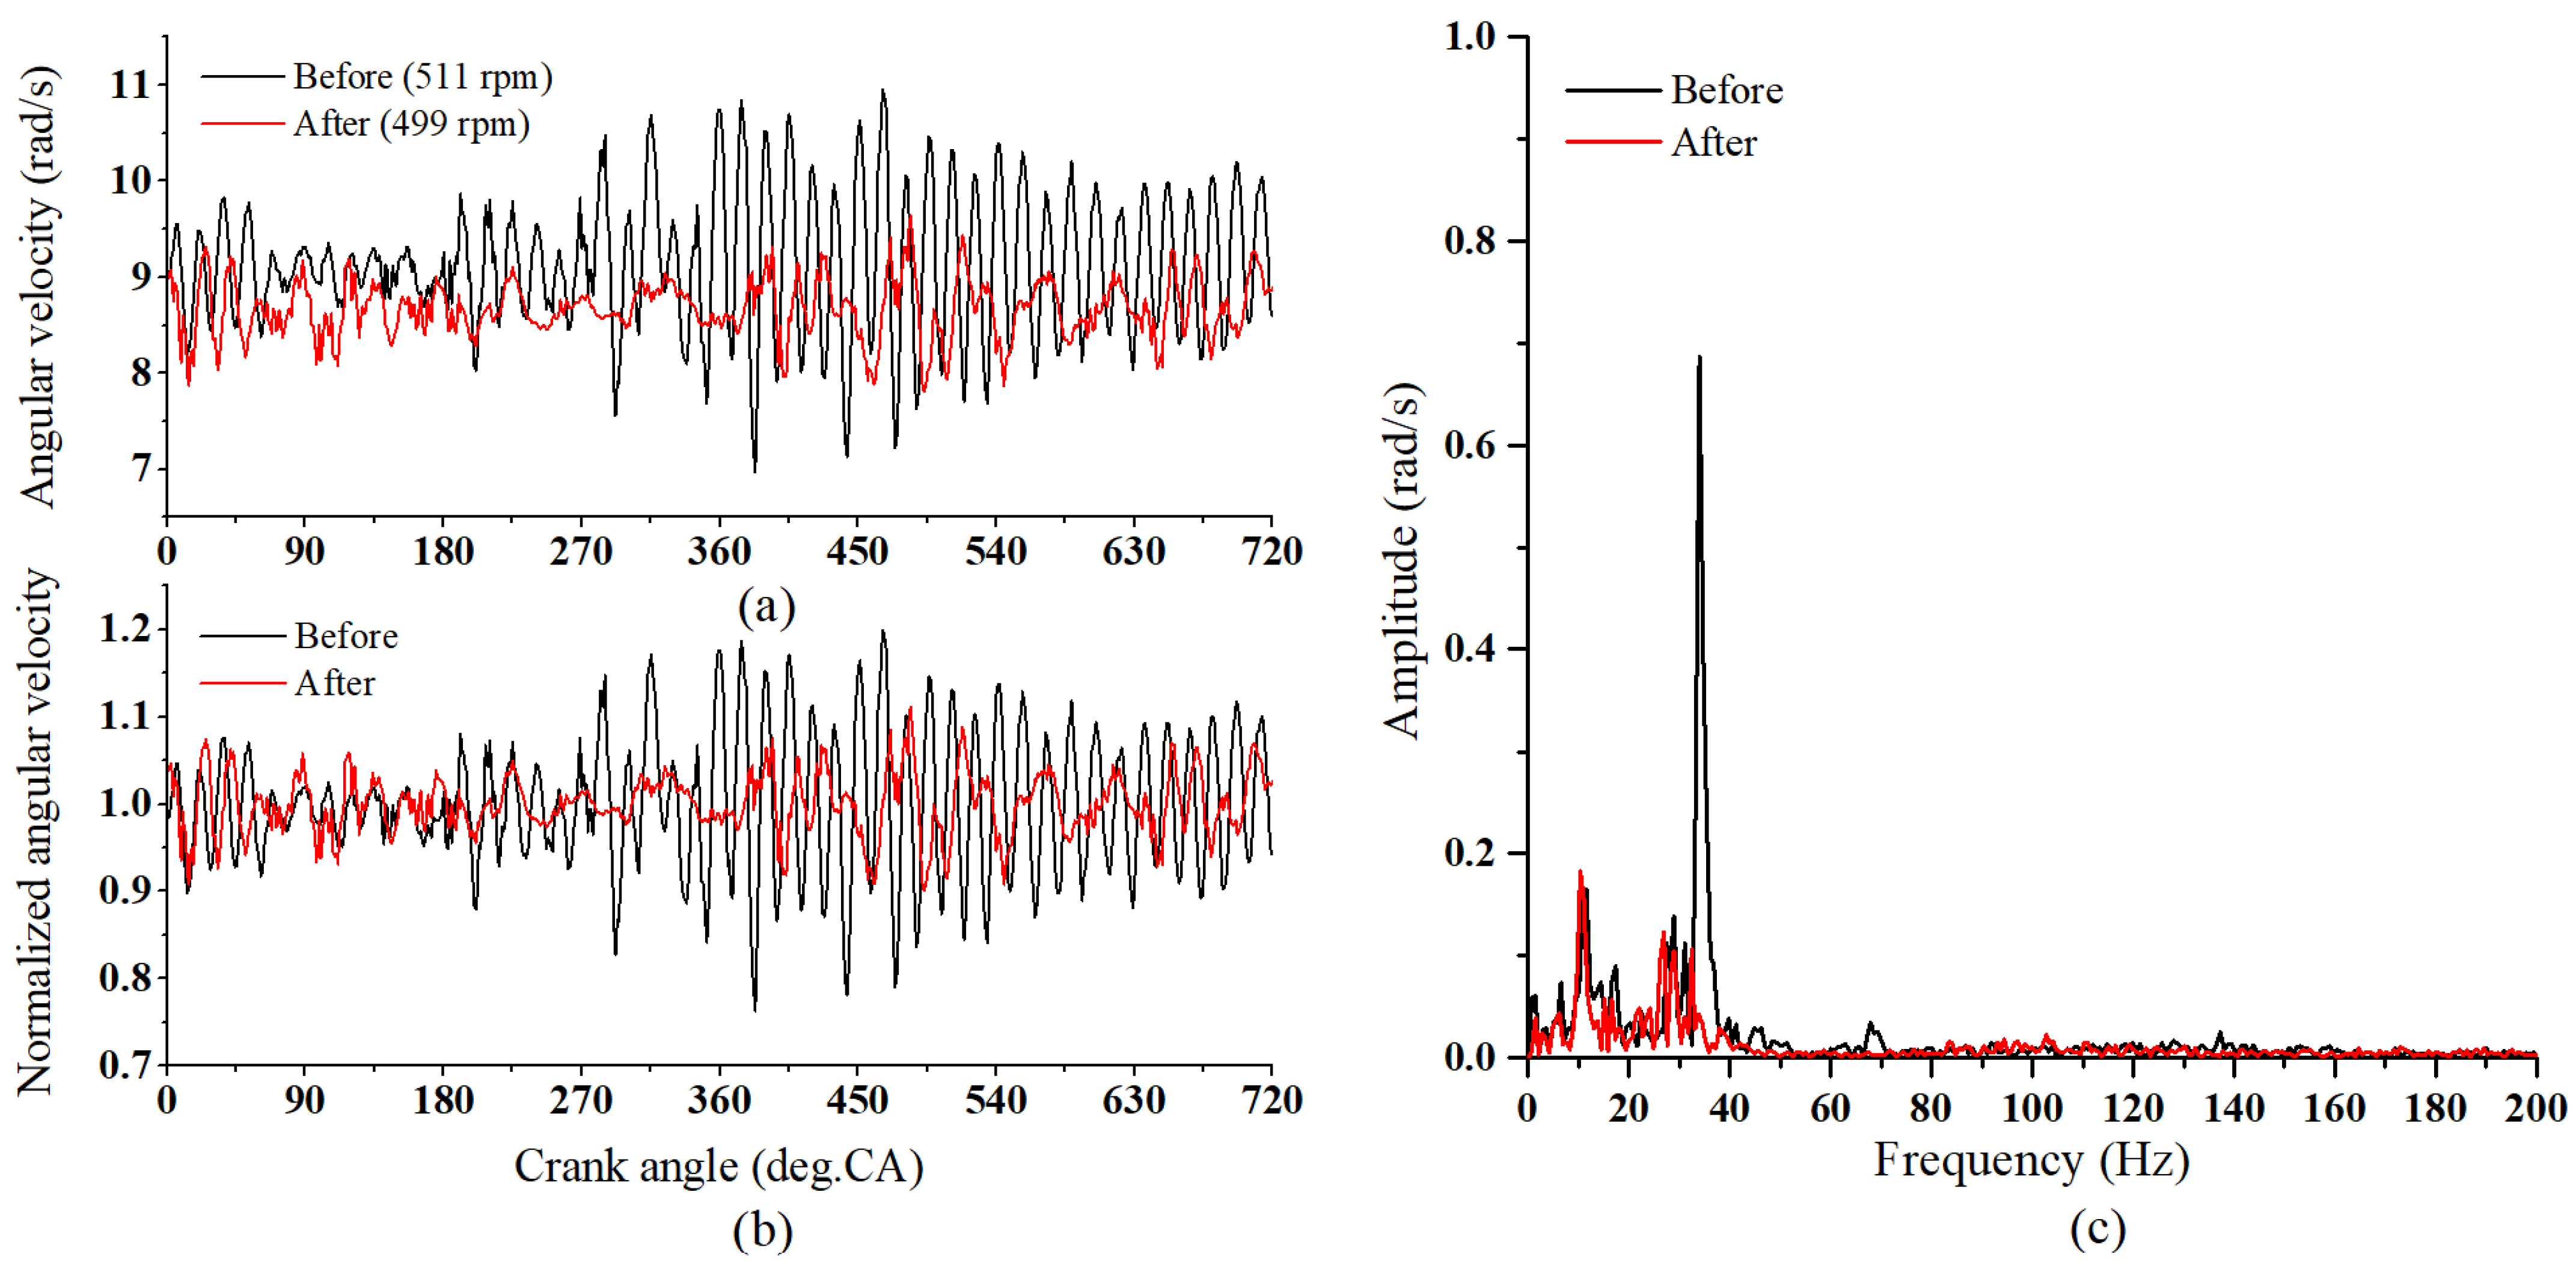
  • Excessively advanced ignition and large variations in Pmax led to significant fluctuations in the crankshaft’s angular velocity, causing engine vibrations.
The accurate criteria for injection timing discussed in this study is a limitation of the study, as is the impact of injection timing on combustion in the NCR. These limitations need to be addressed in future research on engine normalization. Furthermore, research investigating the detection of injection timing and the combustion state through variations in engine angular velocity or vibration measurements could become very interesting in engine diagnostics.

Author Contributions

Conceptualization, G.-S.J. and J.-W.L.; Data curation, G.-S.J.; Formal analysis, Q.D.V.; Funding acquisition, J.-W.L. and J.-U.L.; Investigation, H.-M.B. and J.-U.L.; Methodology, G.-S.J.; Project administration, J.-W.L. and J.-U.L.; Resources, G.-S.J.; Software, H.-M.B.; Supervision, J.-W.L. and J.-U.L.; Validation, H.-M.B. and J.-U.L.; Visualization, Q.D.V.; Writing—original draft, H.-M.B. and J.-U.L.; Writing—review and editing, J.-U.L. and J.-W.L. All authors have read and agreed to the published version of the manuscript.

Funding

This research was funded by the National Research Foundation of Korea (NRF), grant funded by the Korea government (MIST) (No. NFR-2021R1G1A1008612126 and No. NRF-2021R1F1A1047115).

Institutional Review Board Statement

Not applicable.

Informed Consent Statement

Not applicable.

Data Availability Statement

Not applicable.

Conflicts of Interest

The authors declare no conflict of interest.

References

  1. Chang, H.; Zhang, Y.; Chen, L. An applied thermodynamic method for correction of TDC in the indicator diagram and its experimental confirmation. Appl. Therm. Eng. 2005, 25, 759–768. [Google Scholar] [CrossRef]
  2. Stas, M.J. Thermodynamic Determination of TDC in Piston Combustion Engines; Society of Automotive Engineers, Inc.: Warrendale, PA, USA, 1996. [Google Scholar]
  3. Staś, M.J. An Universally Applicable Thermodynamic Method for TDC Determination; SAE Technical Paper 0148-7191; SAE: Warrendale, PA, USA, 2000. [Google Scholar]
  4. Morishita, M.; Kushiyama, T. An Improved Method of Determining the TDC Position in a PV-Diagram; SAE Technical Paper 0148-7191; SAE: Warrendale, PA, USA, 1998. [Google Scholar]
  5. Pipitone, E.; Beccari, A. Determination of TDC in internal combustion engines by a newly developed thermodynamic approach. Appl. Therm. Eng. 2010, 30, 1914–1926. [Google Scholar] [CrossRef] [Green Version]
  6. Varbanets, R.A.; Zalozh, V.I.; Shakhov, A.V.; Savelieva, I.V.; Piterska, V.M. Determination of top dead centre location based on the marine diesel engine indicator diagram analysis. Diagnostyka 2020, 21, 51–60. [Google Scholar] [CrossRef]
  7. Pawletko, R.; Polanowski, S. Influence of TDC determination methods on mean indicated pressure errors in marine diesel engines. J. KONES 2011, 18, 355–363. [Google Scholar]
  8. Lee, J.; Jung, G.-S.; Lee, W.-J. Causes of Top Dead Center Error in Marine Generator Engine Power-Measuring Device. J. Korean Soc. Mar. Environ. Saf. 2020, 26, 429–435. [Google Scholar] [CrossRef]
  9. Eder, L.; Kiesling, C.; Priesching, P.; Pirker, G.; Wimmer, A. Multidimensional Modeling of Injection and Combustion Phenomena in a Diesel Ignited Gas Engine; SAE Technical Paper 0148-7191; SAE: Warrendale, PA, USA, 2017. [Google Scholar]
  10. Kim, H.J.; Park, S.H.; Lee, C.S. Impact of fuel spray angles and injection timing on the combustion and emission characteristics of a high-speed diesel engine. Energy 2016, 107, 572–579. [Google Scholar] [CrossRef]
  11. Saravanan, S.; Nagarajan, G.; Lakshmi Narayana Rao, G.; Sampath, S. Theoretical and experimental investigation on effect of injection timing on NOx emission of biodiesel blend. Energy 2014, 66, 216–221. [Google Scholar] [CrossRef]
  12. Kannan, G.R.; Anand, R. Effect of injection pressure and injection timing on DI diesel engine fuelled with biodiesel from waste cooking oil. Biomass Bioenergy 2012, 46, 343–352. [Google Scholar] [CrossRef]
  13. Vadlamudi, S.; Gugulothu, S.K.; Panda, J.K.; Deepanraj, B.; Kumar, P.R.V. Paradigm analysis of performance and exhaust emissions in CRDI engine powered with hydrogen and Hydrogen/CNG fuels: A green fuel approach under different injection strategies. Int. J. Hydrogen Energy 2022. [Google Scholar] [CrossRef]
  14. Nwafor, O.M.I.; Rice, G.; Ogbonna, A.I. Effect of advanced injection timing on the performance of rapeseed oil in diesel engines. Renew. Energy 2000, 21, 433–444. [Google Scholar] [CrossRef]
  15. Park, H.; Shim, E.; Lee, J.; Oh, S.; Kim, C.; Lee, Y.; Kang, K. Large–squish piston geometry and early pilot injection for high efficiency and low methane emission in natural gas–diesel dual fuel engine at high–load operations. Fuel 2022, 308, 122015. [Google Scholar] [CrossRef]
  16. Varbanets, R.; Alexandrovskaya, N.; Golovan, A.; Kucherenko, Y.N. Experimental trial of VIT system of the low-speed diesel MAN 6l80MCE. Vestn. Astrakhan State Tech. Univ. Ser. Mar. Eng. Technol. 2013, 2013, 85–92. [Google Scholar]
  17. Zhang, M.; Zi, Y.; Niu, L.; Xi, S.; Li, Y. Intelligent Diagnosis of V-Type Marine Diesel Engines Based on Multifeatures Extracted From Instantaneous Crankshaft Speed. IEEE Trans. Instrum. Meas. 2019, 68, 722–740. [Google Scholar] [CrossRef]
  18. Çelik, V.; Arcaklioğlu, E. Performance maps of a diesel engine. Appl. Energy 2005, 81, 247–259. [Google Scholar] [CrossRef]
  19. Moussa Nahim, H.; Younes, R.; Shraim, H.; Ouladsine, M. Modeling with Fault Integration of the Cooling and the Lubricating Systems in Marine Diesel Engine: Experimental validation. IFAC-PapersOnLine 2016, 49, 570–575. [Google Scholar] [CrossRef]
  20. Çay, Y.; Çiçek, A.; Kara, F.; Sağiroğlu, S. Prediction of engine performance for an alternative fuel using artificial neural network. Appl. Therm. Eng. 2012, 37, 217–225. [Google Scholar] [CrossRef]
  21. Basurko, O.C.; Uriondo, Z. Condition-Based Maintenance for medium speed diesel engines used in vessels in operation. Appl. Therm. Eng. 2015, 80, 404–412. [Google Scholar] [CrossRef]
  22. Jung, K.S.; Lee, S.K. System for Measuring Output of Large-Sized Low-Speed Two-Stroke Engine and Method for Measuring Output of Large-Sized Low-Speed Two-Stroke Engine. European Patent EP3561271B1, 12 January 2022. [Google Scholar]
  23. Jung, K.S.; Lee, S.K. Combustion Analysis Apparatus for Large-Sized Low-Speed Engine and Method for Determining Combustion State of Engine Using the Same. European Patent EP3561475B1, 31 March 2021. [Google Scholar]
  24. Yokogawa Test & Measurement Corporation. Combustion Pressure Analysis Software (for Diesel); IM 720340-02EN; Yokogawa Test & Measurement Corporation: Tokyo, Japan, 2019. [Google Scholar]
  25. Marine Engineers Knowledge. Available online: https://www.marineengineersknowledge.com/2022/02/fuel-pump-timing-adjustment-in-marine.html (accessed on 7 July 2023).
  26. Hountalas, D.T.; Sakellaridis, N.F.; Pariotis, E.; Antonopoulos, A.K.; Zissimatos, L.; Papadakis, N. Effect of Turbocharger Cut Out on Two-Stroke Marine Diesel Engine Performance and NOx Emissions at Part Load Operation. In Proceedings of the ASME 2014 12th Biennial Conference on Engineering Systems Design and Analysis, Copenhagen, Denmark, 25–27 June 2014. [Google Scholar]
  27. Tufte, E.D. Impacts of Low Load Operation of Modern Four-Stroke Diesel Engines in Generator Configuration. Master’s Thesis, Institutt for Marin Teknikk, Trondheim, Norway, 2014. [Google Scholar]
  28. Charchalis, A.; Dereszewski, M. Processing of instantaneous angular speed signal for detection of a diesel engine failure. Math. Probl. Eng. 2013, 2013, 659243. [Google Scholar]
Figure 1. Schematic diagram of the experimental device.
Applsci 13 09263 g001
Figure 2. Pulse waveform tolerances of angle sensor (encoder).
Applsci 13 09263 g002
Figure 3. (a) Compression pressure−crank angle diagram at idle running; (b) d p / d θ diagram of compression pressure at idling running.
Applsci 13 09263 g003
Figure 4. (a) Cylinder pressure−crank angle diagram at idle running before injection timing adjustment; (b) rate of heat release (ROHR) diagram at idle running before injection timing adjustment.
Applsci 13 09263 g004
Figure 5. (a) Cylinder pressure−crank angle diagram at 43% load before injection timing adjustment; (b) ROHR diagram at 43% load before injection timing adjustment.
Applsci 13 09263 g005
Figure 6. (a) Cylinder pressure-crank angle diagram at 46% load after injection timing adjustment; (b) ROHR diagram at 46% after injection timing adjustment.
Applsci 13 09263 g006
Figure 7. (a) Cylinder pressure–crank angle diagram at 46% load after injection timing adjustment; (b) ROHR diagram at 46% load after injection timing adjustment.
Applsci 13 09263 g007
Figure 8. Comparison of pressure–volume (P–V) diagrams before and after fuel injection timing adjustment.
Applsci 13 09263 g008
Figure 9. (a) Positive and negative turning force during one cycle; (bi) individual cylinder turning force curves before and after fuel injection timing adjustment.
Applsci 13 09263 g009
Figure 10. (a) Crank shaft angular velocity at 43% (511 rpm) and 46% (499 rpm) load; (b) normalized angular velocity from (a); (c) fast Fourier transform result of (a) graph.
Applsci 13 09263 g010
Table 1. Engine specification.
Model Engine Specification
TypeYANMAR 8N330-EN (4-stroke diesel)
Bore/stroke330/440 [mm]
Cylinders8
Fuel injection pumpSpill port type mechanically controlled by camshaft
compression ratio13.5:1
Firing order1-4-7-6-8-5-2-3
Normal rated speed620 [rpm]
Maximum output3310 [kW]
Maximum pressure12.2 [MPa]
Table 2. Compression, expansion, and indicated work for each cylinder before and after fuel injection timing adjustment.
UnitNo. 1No. 2No. 3No. 4No. 5No. 6No. 7No. 8
Before
(43% load)
Compression workkJ3.43.23.33.33.53.63.63.6
Expansion work8.17.37.57.67.37.17.57.2
Indicated work4.74.14.24.33.93.63.93.6
After
(46% load)
Compression work3.33.23.23.23.33.23.23.2
Expansion work8.37.68.07.97.77.87.98.4
Indicated work5.04.44.84.74.44.64.75.1
Disclaimer/Publisher’s Note: The statements, opinions and data contained in all publications are solely those of the individual author(s) and contributor(s) and not of MDPI and/or the editor(s). MDPI and/or the editor(s) disclaim responsibility for any injury to people or property resulting from any ideas, methods, instructions or products referred to in the content.

