Article

Dynamic Torsional Stiffness of Reducers and Its Testing Method

Beijing Engineering Research Center of Precision Measurement Technology and Instruments, Beijing University of Technology, Beijing 100124, China
*
Author to whom correspondence should be addressed.
Appl. Sci. 2023, 13(16), 9277; https://doi.org/10.3390/app13169277
Submission received: 6 August 2023 / Revised: 11 August 2023 / Accepted: 13 August 2023 / Published: 15 August 2023

Abstract

:
The torsional stiffness of the reducer is commonly assumed to be static and tested using the hysteresis curve method. However, practical engineering experience shows that the torsional stiffness is dynamic rather than static, and the hysteresis curve method cannot accurately represent the reducer’s torsional stiffness during actual operation. To address these issues, this study conducts theoretical research on the dynamic characteristics of torsional stiffness, introduces a new concept called dynamic torsional stiffness, and provides its analytical formula. A dynamic torsional stiffness testing method based on the transmission error method is proposed, and its feasibility and consistency with the hysteresis curve method are theoretically demonstrated. This method allows the torsional stiffness information of the reducer to be obtained under all operating conditions. Through experimental research, the limitations of the hysteresis curve method are explained, and the dynamic characteristics of the reducer’s torsional stiffness, along with the effectiveness of the transmission error method, are verified. Consequently, the torsional stiffness information of the reducer under all operating conditions is obtained. In conclusion, this method is valuable for both theoretical and engineering applications, as it offers a more accurate representation of the dynamic torsional stiffness of the reducer in real-world scenarios.

1. Introduction

Torsional stiffness is an important factor influencing the transmission quality of a reducer. It signifies the reducer’s capability to withstand torsional deformation during twisting and depends on factors like the reducer’s material and structure. The hysteresis curve method is commonly used to test the torsional stiffness of a reducer, often performed alongside the evaluation of the reducer’s lost motion.
The method for testing is illustrated in Figure 1 [1]. During this test, the input side of the reducer remains stationary while the output side is progressively loaded to its rated torque before being released. This process is then repeated, but with the load applied in the opposite direction up to the rated torque and subsequently released. From this, multiple sets of torque and angle values are obtained, enabling the plotting of a comprehensive torque–angle curve. The testing procedure is detailed as follows, with the five steps shown in Figure 1: (1) load the output end towards the specified torque T r ; (2) unload the output end to a value of 0; (3) load the output end in the opposite direction to the specified torque T r ; (4) unload the output end back to 0; (5) once again, load the output end towards the specified torque T r . The relationship between the specified torque T r on the curve and the associated rotation angle θ r represents the torsional stiffness.
Researchers from various fields have different understandings of the static and dynamic characteristics of torsional stiffness. For instance, as mentioned in Reference [2], it is noted that the torsional stiffness of concrete structures, such as load-bearing beams, is dynamic in nature and can be determined through modal torsional rates. Reference [3] proposes a dynamic torsional stiffness model where a magneto-sensitive circular annular rubber bushing is presented with influences of frequency, amplitude and magnetic field dependence included. In Reference [4], it is indicated that the dynamic torsional stiffness of rubber couplings is related to the transmitted torque, increasing with higher transmitted torques, and exhibiting a trend of initially decreasing and then increasing with increasing frequency. The torsional stiffness of reducers is conventionally regarded as a constant value, unaffected by other factors [5,6]. When conducting calculations and simulation analyses, it is assumed to possess static characteristics [7,8,9,10].
However, based on extended engineering observations, the actual torsional stiffness of reducers, when exposed to varying operational conditions, does not always align with values derived from the hysteresis curve method. This discrepancy arises due to several reasons: Real-world operational challenges, such as speed and torque variations, cause internal system dynamics within the reducer to be unstable. This leads to fluctuations in torsional stiffness. For instance, according to Reference [11], a dual-rigid-wheel harmonic drive is subject to the influence of manufacturing errors, causing its torsional stiffness to become time-varying and exhibit dynamic characteristics. Additionally, Reference [12] highlights that the torsional stiffness of a helicopter transmission system is dynamic, subsequently affecting the system’s steady-state characteristics. The hysteresis curve method is inherently static, offering a snapshot of the reducer’s torsional stiffness in a quasi-static scenario. This can be different from the reducer’s behavior in real operational settings. Reducer hysteresis exhibits a dependency on the loading rate [13]. Therefore, the hysteresis curve, when drawn for different loading rates, can yield varying results, creating inconsistent torsional stiffness measurements.
To address these gaps, this paper investigated the dynamic characteristics of the torsional stiffness of reducers. It will introduce the concept of “dynamic torsional stiffness” to better represent reducer performance. Additionally, a novel testing technique—based on the transmission error method—will be introduced. This method will be capable of assessing both the actual working-state torsional stiffness and the transmission error of the reducer. Transmission error is a fundamental concept in the field of gear transmission engineering, playing a crucial role in characterizing gear transmission quality, analyzing gear dynamic characteristics (such as vibration and noise), and guiding high-performance gear design [14,15,16,17]. However, its application in the testing of reducer torsional stiffness has not been realized, primarily due to the lack of relevant theoretical underpinning, which hinders its correlation with the hysteresis loop method. This paper aims to undertake theoretical analysis and experimental research on the dynamic torsional stiffness of reducers, investigating the coherence between the transmission error method and the hysteresis loop method. The objective is to offer guidance for the design and testing of reducer torsional stiffness.

2. Dynamic Characteristics of Torsional Stiffness

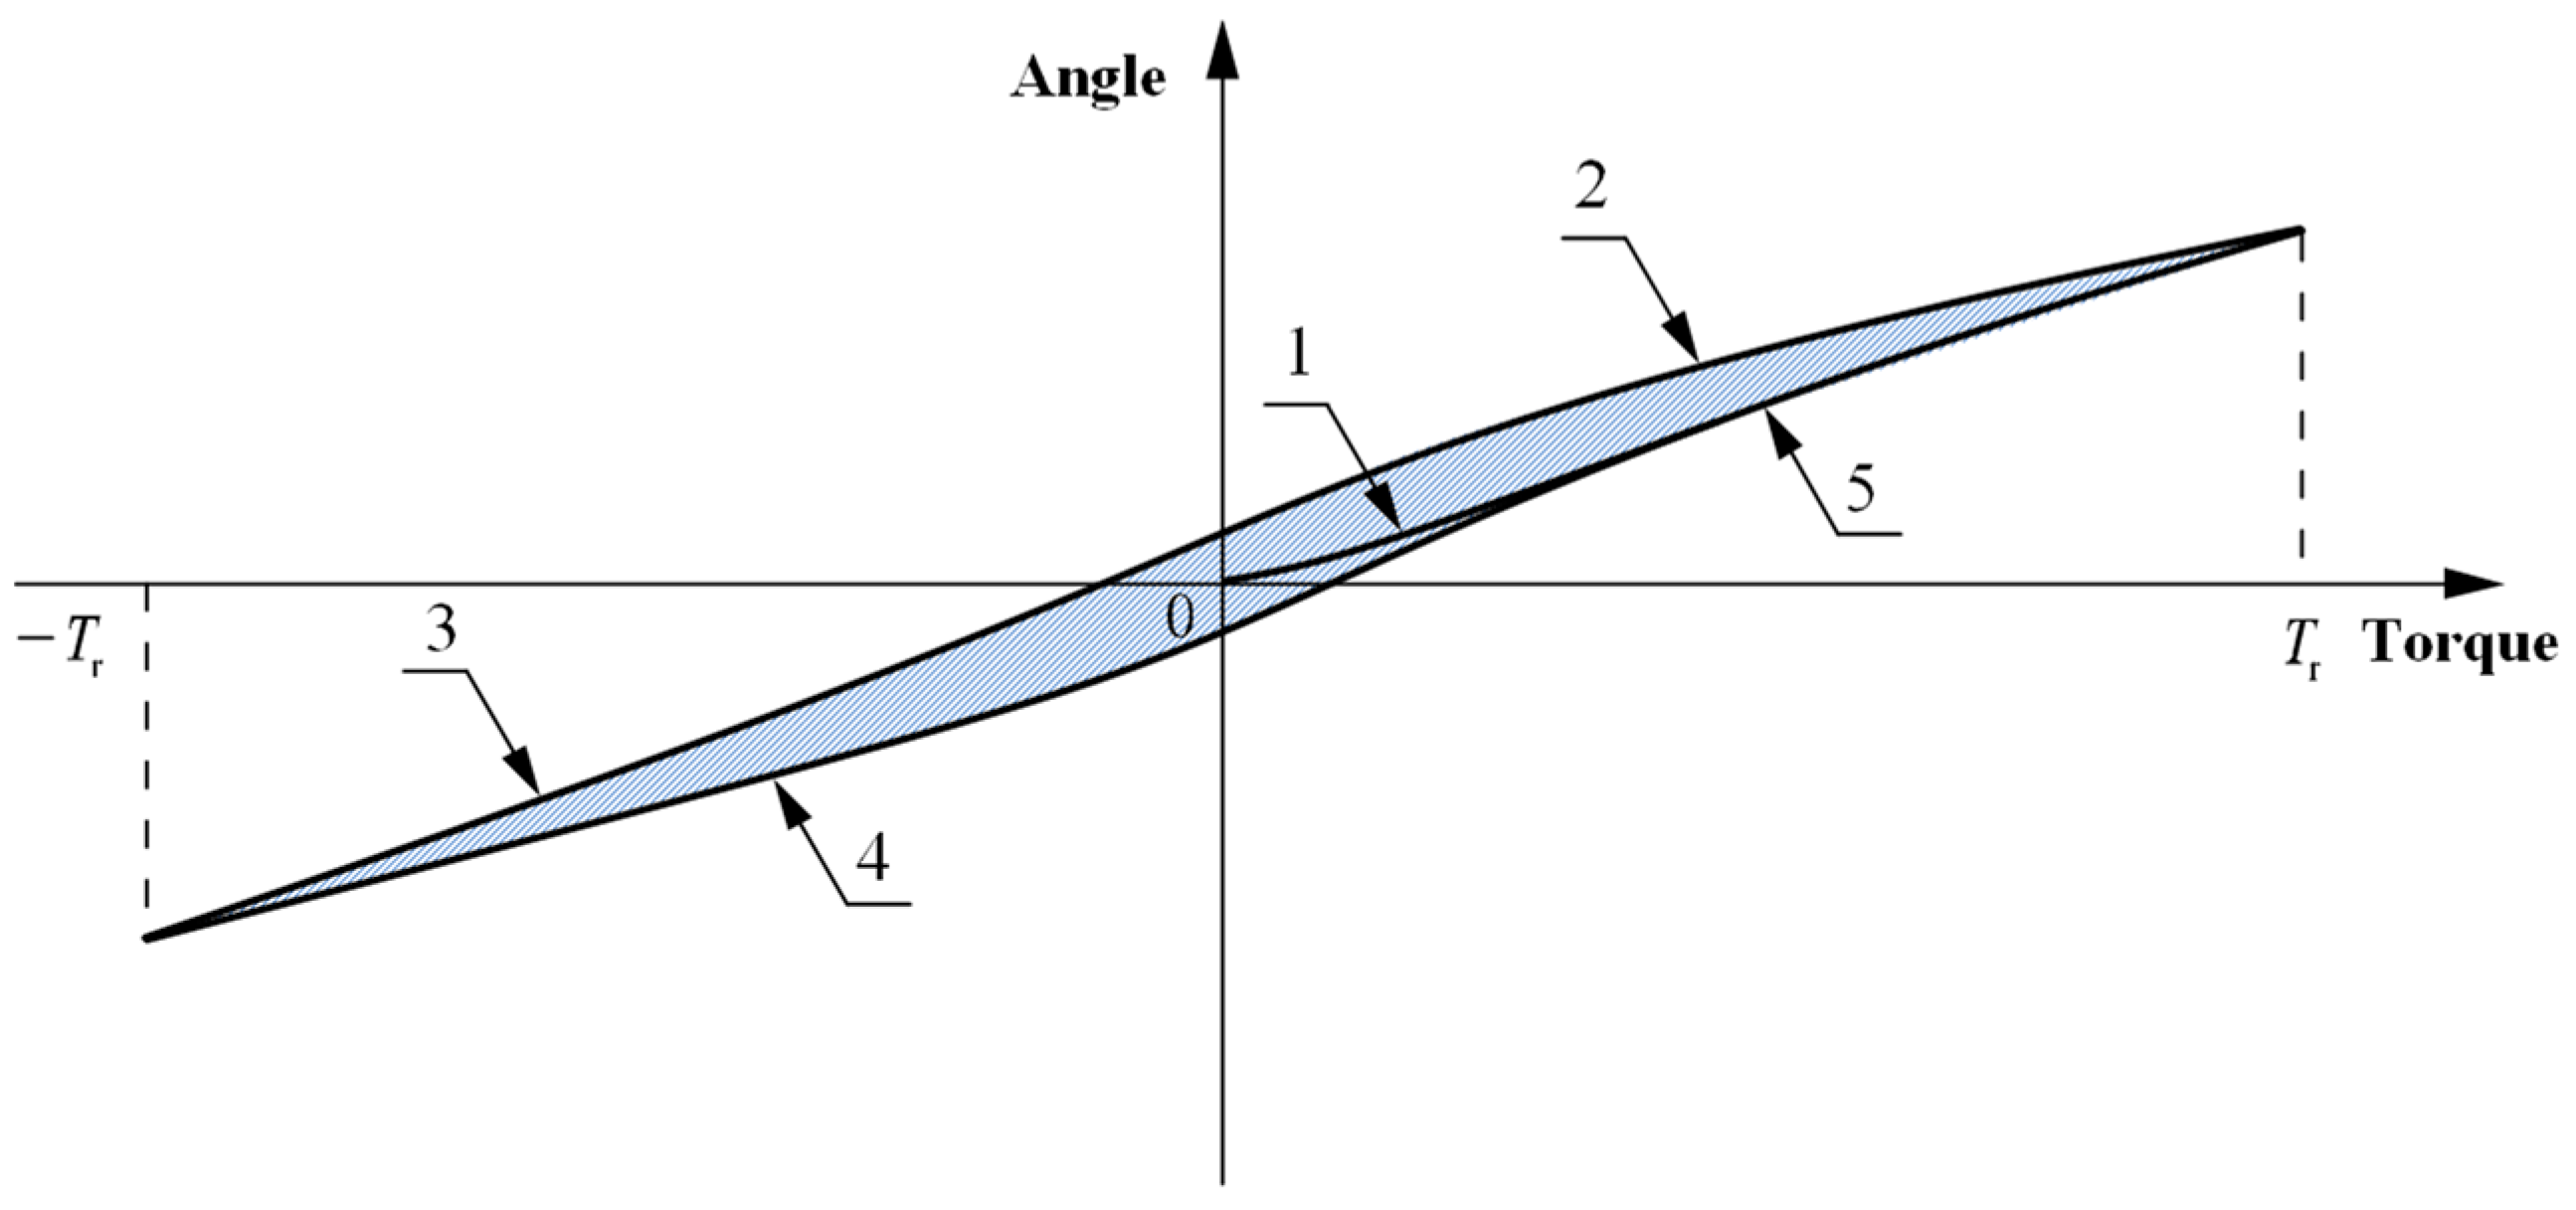
2.1. Static Torsional Stiffness

The reducer’s hysteresis is shaped by an interplay of geometric inaccuracies, friction, and elastic deformation. As a result, the hysteresis curve’s depiction of the torque–angle relationship incorporates elements like geometric discrepancies and friction [18,19,20,21].
The output angle curve of the reducer is set as θ o u t ( τ , τ ˙ ) , and represented as the rising curve and the falling curve, as shown in Equation (1). The output torque is τ and τ ˙ is the loading rate [22]. It is superimposed by θ g ( τ ) generated by geometric errors, θ f ( τ , τ ˙ ) is generated by friction, and θ s ( τ ) is generated by elastic deformation. θ g ( τ ) and θ f ( τ , τ ˙ ) mainly determine the enclosed area [4], which mainly affects the degree of inclination of θ s ( τ ) [13,23]. The relationship between them is shown in Figure 2 and Equation (2). In this equation, R stands for the transmission ratio of the reducer.
θ o u t ( τ , τ ˙ ) = θ o u t + ( τ , τ ˙ ) , τ ˙ > 0 θ o u t ( τ , τ ˙ ) , τ ˙ < 0
θ o u t ( τ , τ ˙ ) = θ f + ( τ , τ ˙ ) + θ s + ( τ ) + θ g + ( τ ) + θ i n R , τ ˙ > 0 θ f ( τ , τ ˙ ) + θ s ( τ ) + θ g ( τ ) + θ i n R , τ ˙ < 0
Equation (2) can be expressed in another form, as shown in Equation (3).
θ o u t ( τ , τ ˙ ) = θ e ( τ ) + θ f ( τ , τ ˙ ) + θ g ( τ ) + θ i n R
During the torsional stiffness testing, the input end is held fixed, and the input angle θ i n is set to 0. In this scenario, Equation (3) simplifies to Equation (4).
θ o u t ( τ , τ ˙ ) = θ e ( τ ) + θ f ( τ , τ ˙ ) + θ g
At this point, the torsional stiffness K s of the reducer, calculated based on the test results, represents the static stiffness of the reducer, as shown in Equation (5).
K s = τ θ o u t ( τ , τ ˙ ) = τ θ s ( τ ) + θ f ( τ , τ ˙ ) + θ g

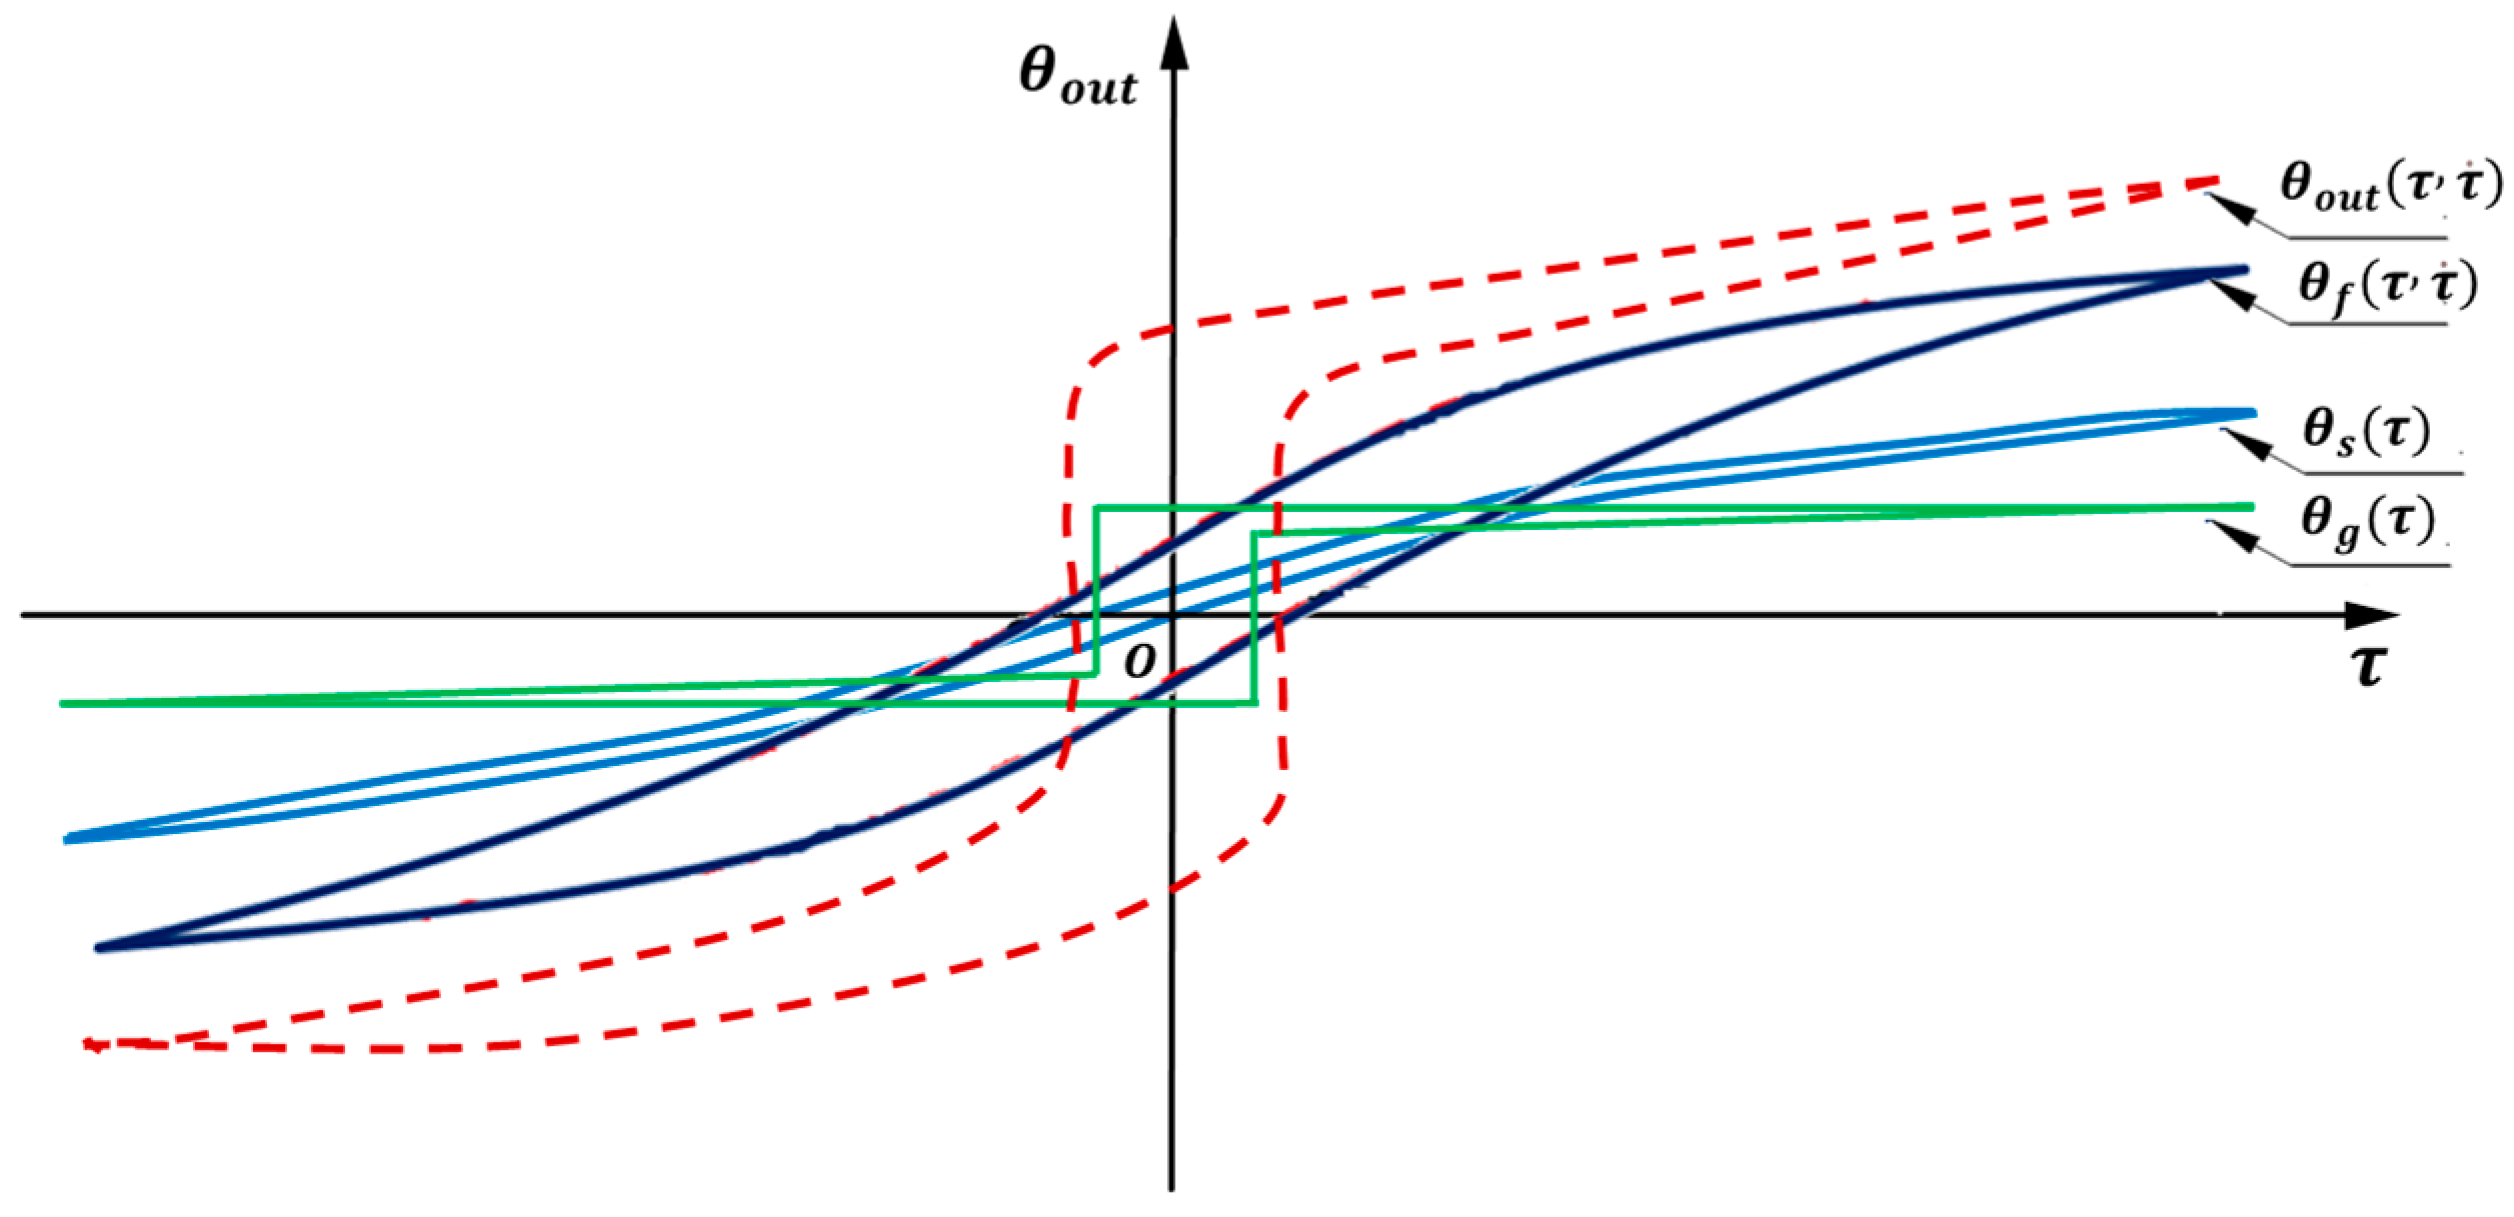
2.2. Effect of the Loading Rate Dependence on Hysteresis Curve Method

The analytical expression of Equation (4) can be given as Equation (6).
θ o u t ( τ , τ ˙ ) = 0 t τ ˙ ( t ) d t K n + d E f ( t ) d τ ( t ) + θ g
where K n is the nominal torsional stiffness of the reducer, t is the loading time, τ ˙ ( t ) is a function of the loading rate, τ ( t ) represents the torque function, E f ( t ) is the dissipated energy caused by internal and external friction of the reducer, and θ g ( τ ) can be considered as a constant θ g during testing.
During testing, the reducer is typically subjected to the target torque τ r . Let us assume the loading rates as τ ˙ 1 and τ ˙ 2 , where τ ˙ 1 > τ ˙ 2 ;   thus ,   d τ 1 ( t ) > d τ 2 ( t ) . Assuming d E f ( t ) remains constant, the test results are illustrated in Equations (7) and (8).
θ o u t 1 ( τ r , τ ˙ 1 ) = τ r K n + d E f ( t ) d τ 1 ( t ) + θ g
θ o u t 2 ( τ r , τ ˙ 2 ) = τ r K n + d E f ( t ) d τ 2 ( t ) + θ g
At this point, θ o u t 1 ( τ r , τ ˙ 1 ) θ o u t 2 ( τ r , τ ˙ 2 ) calculates the torsional stiffness K s 1 and K s 2 of the reducer based on this result, as shown in Equations (9) and (10).
K s 1 = τ r θ o u t 1 ( τ r , τ ˙ 1 )
K s 2 = τ r θ o u t 2 ( τ r , τ ˙ 2 )
The analysis reveals that K s 1 K s 2 is a consequence of the loading rate dependence on the hysteresis curve method. The impact on the hysteresis curve method diminishes as the loading rate decreases. However, it is important to note that a loading rate of 0 is merely an ideal scenario and is not achievable in reality. The influence of loading rate dependence persists even under low loading rates.

2.3. Dynamic Torsional Stiffness

During the practical operation of a reducer, its transmission performance is influenced by the rotational speed. The presence of torque fluctuations and friction gives rise to elastic deformation, leading to dynamic changes in the torsional stiffness, making it non-constant. At this stage, the torsional stiffness K d represents the dynamic torsional stiffness of the reducer, expressed as Equation (11), where v denotes the speed of the reducer.
K d = τ θ s ( τ , v ) + θ f ( τ , τ ˙ , v ) + θ g
As per Equation (11), we can represent the static torsional stiffness K s of the reducer using Equation (12), where K s is a special case of K d .
K s = τ θ s ( τ , 0 ) + θ f ( τ , τ ˙ , 0 ) + θ g

3. Measurement of Torsional Stiffness Using Transmission Error Method

3.1. Test Principle

The testing principle of the transmission error method is depicted in Figure 3. The reducer is tested for forward transmission error at a torque τ 1 of and a speed of v 1 . Throughout the forward testing process of the reducer, the forward transmission error at position θ o u t 1 can be described by Equation (13) assuming that the load remains constant and the loading rate is 0.
T E z ( θ o u t 1 ( τ 1 ,   0 ,   v 1 ) ) = θ o u t 1 ( τ 1 ,   0 ,   v 1 ) θ i n R
At this point, the torsional stiffness represents the dynamic torsional stiffness K d of the reducer, which can be expressed as Equation (14).
K d = τ 1 θ o u t 1 ( τ 1 ,   0 ,   v 1 ) θ i n R = τ 1 T E z ( θ o u t 1 ( τ 1 ,   0 ,   v 1 ) )

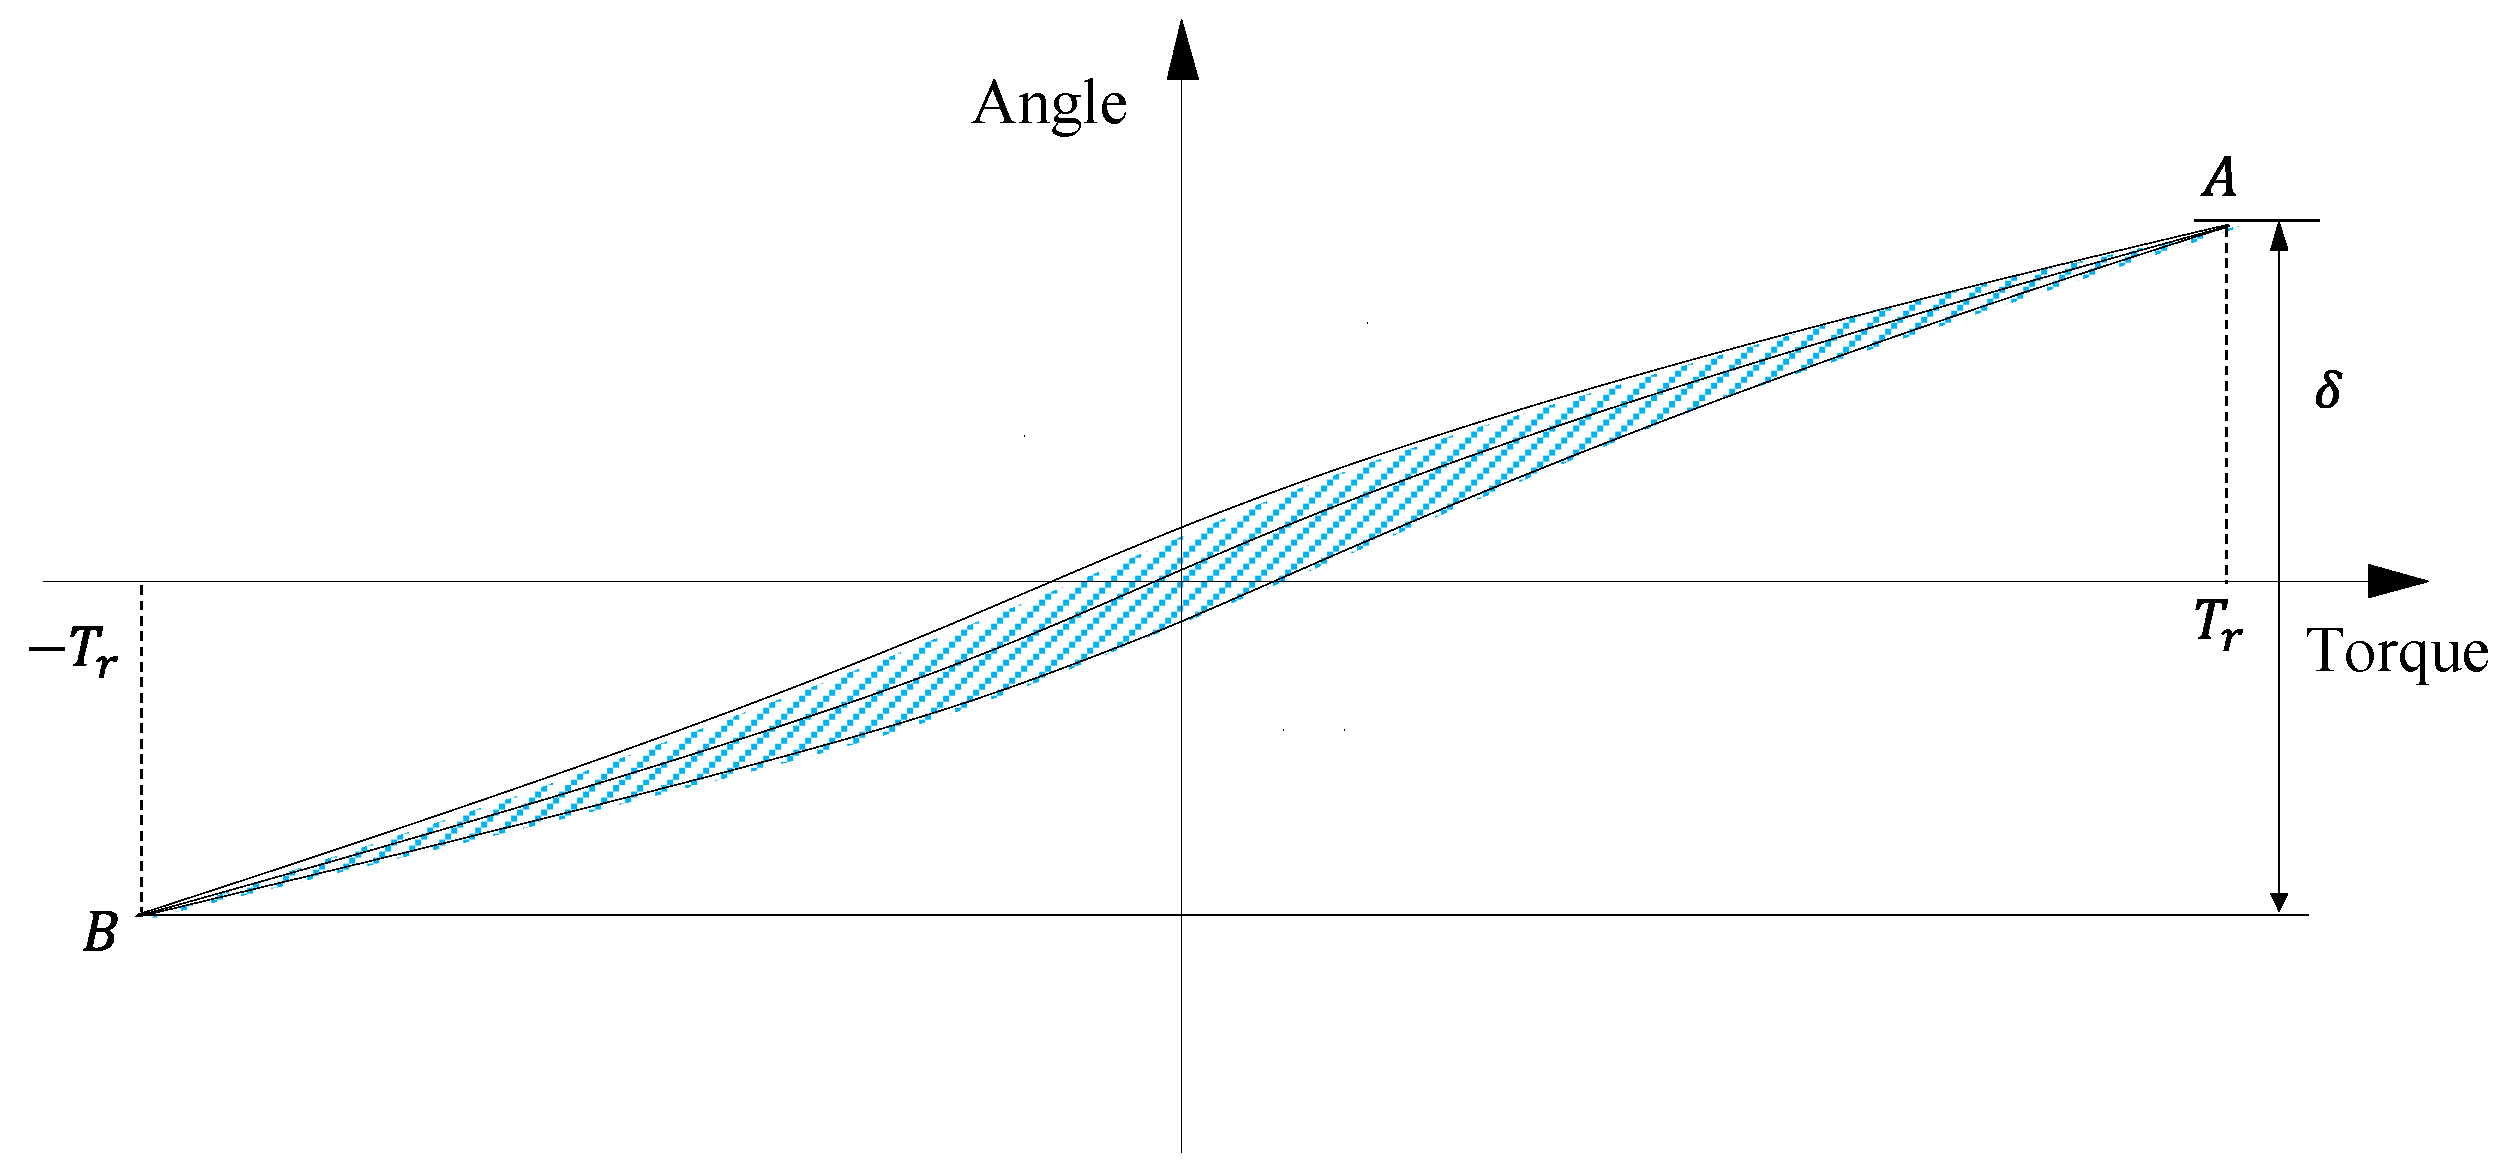
3.2. Unification with Hysteresis Curve Method

Assuming the reducer is subjected to torsional stiffness testing using a hysteresis curve at the output θ o u t 1 position, with a loading rate of τ ˙ 1 and torque values at the endpoints A as τ 1 , then θ o u t A is shown in Figure 4 and represented by Equation (15).
θ o u t A ( τ 1 , τ ˙ 1 , 0 ) = θ s + ( τ 1 , 0 ) + θ f + ( τ 1 , τ ˙ 1 , 0 ) + θ g + ( τ 1 ) + θ i n R
Equation (14) can be transformed into Equation (16).
θ o u t A ( τ 1 , τ ˙ 1 , 0 ) θ i n R = θ s + ( τ 1 , 0 ) + θ f + ( τ 1 , τ ˙ 1 , 0 ) + θ g + ( τ 1 )
When the test is conducted at the θ o u t 1 position of the reducer, the angle value of point A at torque τ 1 is given in Equation (17).
θ o u t A ( τ 1 , τ ˙ 1 , 0 ) = θ o u t 1 ( τ 1 , τ ˙ 1 , 0 )
By substituting Equation (17) into Equation (16), we obtain Equation (18).
θ o u t 1 ( τ 1 , τ ˙ 1 , 0 ) θ i n R = θ s + ( τ 1 , 0 ) + θ f + ( τ 1 , τ ˙ 1 , 0 ) + θ g + ( τ 1 )
In an ideal state, during the test at a loading rate τ ˙ 1 = 0 , Equation (18) simplifies to Equation (19).
θ o u t 1 ( τ 1 , 0 , 0 ) θ i n R = θ s + ( τ 1 , 0 ) + θ f + ( τ 1 , 0 , 0 ) + θ g + ( τ 1 )
By introducing Equation (19) into Equation (12), we can express the static torsional stiffness K s of the reducer as Equation (20).
K s = τ 1 θ o u t 1 ( τ 1 , 0 , 0 ) θ i n R = τ 1 θ s + ( τ 1 , 0 ) + θ f + ( τ 1 , 0 , 0 ) + θ g + ( τ 1 )
When using transmission error for testing and assuming a speed of 0, Equation (13) can be rewritten as Equation (21).
T E z ( θ o u t 1 ( τ 1 ,   0 ,   0 ) ) = θ o u t 1 ( τ 1 ,   0 ,   0 ) θ i n R
At this point, the torsional stiffness represents the dynamic torsional stiffness K d of the reducer, which can be expressed as Equation (22).
K d = τ 1 θ o u t 1 ( τ 1 ,   0 ,   0 ) θ i n R = τ 1 T E z ( θ o u t 1 ( τ 1 ,   0 ,   0 ) )
The relationship between them can be observed in Equations (23) and (24).
T E z ( θ o u t 1 ( τ 1 ,   0 ,   0 ) ) = θ s + ( τ 1 , 0 ) + θ f + ( τ 1 ,   0 ,   0 ) + θ g + ( τ 1 )
τ 1 T E z ( θ o u t 1 ( τ 1 , 0 , 0 ) ) = τ 1 θ s + ( τ 1 , 0 ) + θ f + ( τ 1 , 0 , 0 ) + θ g + ( τ 1 )
At this point, the relationship between K d and K s is shown in Equation (25).
K d = K s
Based on the theoretical analysis above, it becomes apparent that when using the transmission error method for torsional stiffness testing, if the testing speed is 0, the dynamic torsional stiffness K d obtained equals the static torsional stiffness K s at a loading rate of 0. This indicates the alignment of the transmission error method and the hysteresis curve method. However, having both a speed of 0 and a loading rate of 0 are ideal situations, but they are not achievable in reality. Nevertheless, the transmission error method employs a loading rate of 0, minimizing the impact of loading rate dependence on torsional stiffness testing. Simultaneously, the method also takes into account the influence of rotational speed, ensuring that the obtained dynamic torsional stiffness more accurately reflects the torsional stiffness in the actual working state of the reducer.

3.3. Torsional Stiffness Testing of Reducers under All Operating Conditions

In Equation (13), if each part exhibits nonlinear characteristics and the impact of loading rate dependence can be disregarded, then K d can also be expressed as a generalized polynomial, as shown in Equation (26).
K d = H ( T E z ( θ o u t ) , τ , v )
When testing under all operating conditions, first, the speed is set as v = v i , the rated torque τ r of the reducer is determined and the position θ o u t = θ k is measured. Assuming m points are measured within the rated torque range, i.e., one point is tested at each interval τ r / m , the torsional stiffness curve of the reducer can be obtained, as illustrated in Figure 5.
Next, alter the speed v , while ensuring that n curves are measured within the rated speed v r range, and conduct one torsional stiffness test for every v r / n intervals. By doing so, the torsional stiffness of the reducer under all operating conditions can be determined, as depicted in Figure 6.
The torsional stiffness K d ( i ) within the rated speed range can be expressed as the following Equation:
K d ( i ) = { H ( T E z ( θ k ) , τ , v 1 ) , , H ( T E z ( θ k ) , τ , v i ) , , H ( T E z ( θ k ) , τ , v n ) }
By considering the average value of the transmission error T E m e a n within one revolution of the output shaft and incorporating it into Equation (26), the overall torsional stiffness of the reducer can be accurately represented. This results in the expression of Equation (28).
K t ( i ) = { H ( T E m e a n , τ , v 1 ) , , H ( T E m e a n , τ , v i ) , , H ( T E m e a n , τ , v n ) }

4. Experimental Procedure

4.1. Experimental Details

This research involved conducting experiments on both small and large reducers as the test subjects. The test benches specifically designed for the small and large reducers are illustrated in Figure 7 and Figure 8, respectively. Detailed equipment performance parameters can be found in Table 1.
Figure 9 displays the small reducer used in the test, measuring 40 mm × 20 mm × 40 mm overall. It utilized parallel shaft gears and employed a three-stage deceleration mechanism. The gear material used was powder metallurgy. On the other hand, Figure 10 illustrates the large reducer, which was a cycloidal pinwheel reducer made of high-strength steel, with an outer diameter of 190 mm. The detailed parameters of the reducers are given in Table 2.

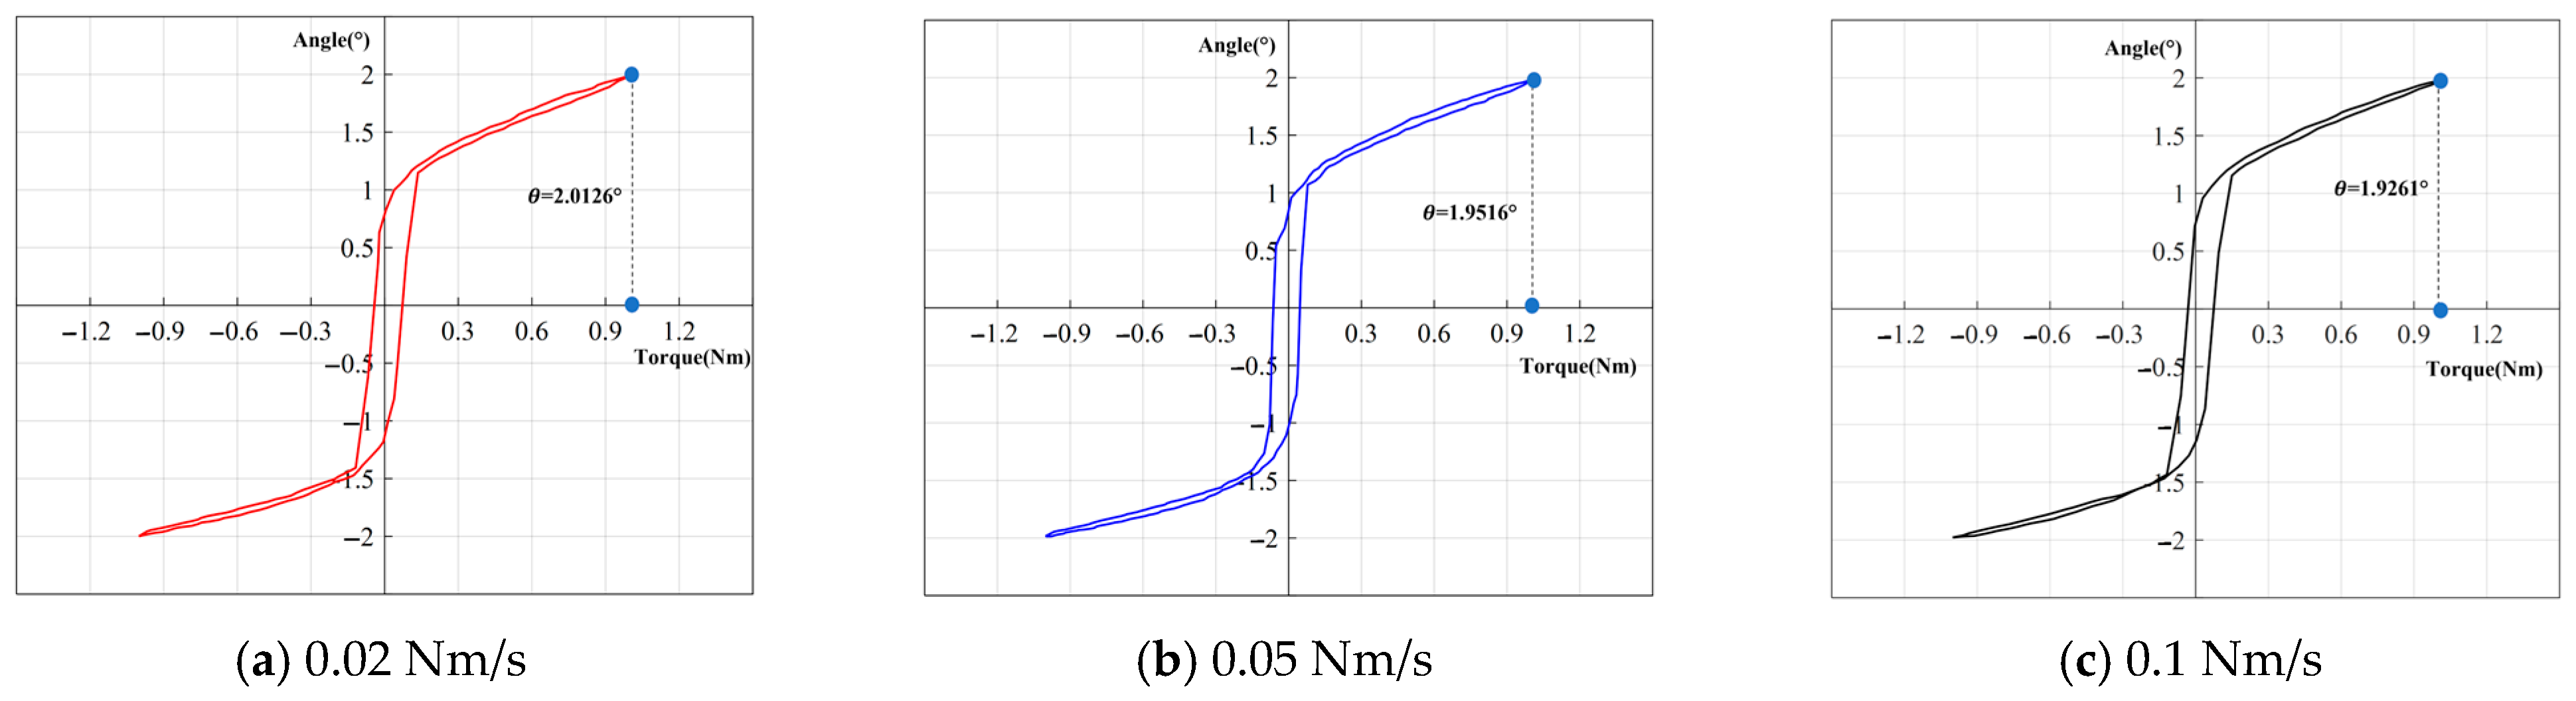
4.2. Hysteresis Curve Method for Testing Torsional Stiffness

In this study, the hysteresis curve method was employed to test the torsional stiffness of two reducers. The small reducers were subjected to a rated torque of 1.0 Nm at varying loading rates, while the large reducers were subjected to a rated torque of 380 Nm at different loading rates. The specific test conditions are provided in Table 3.
In Table 3, Condition 1 represents the lowest loading rate typically encountered in engineering practice. To confirm the analysis presented earlier, tests were performed under various conditions. Figure 11 displays the test curve for small reducers, and Figure 12 shows the test curve for large reducers. The corresponding test results can be found in Table 4.
Based on the test results, it is evident that as the loading rate increases, the following changes occur: The angle test results of the reducer are affected, leading to a decrease in the angle value. Specifically, for the small reducer, the angle decreases from 2.0126° to 1.9261°, and for the large reducer, it decreases from 4.3552° to 4.0473°. Correspondingly, the torsional stiffness exhibits an increasing trend. For the small reducers, it increases from 0.4969 Nm/° to 0.5192 Nm/°, and for the large reducers, it increases from 5235.1212 Nm/° to 5633.3852 Nm/°.
From these findings, it is evident that when using the hysteresis curve method to test the torsional stiffness of the reducer, the results are affected by the loading rate dependence, resulting in variations in the test outcomes at different loading rates. The reason for this situation lies in the inconsistency between the rate of change in internal dynamics from one equilibrium point to another when the reducer is externally loaded and the rate of external input action, i.e., the loading rate. This discrepancy leads to changes in the output shaft angle as follows: At slow loading rates, the angle change can keep up with the loading rate. At fast loading rates, the loading reaches the target torque, but the turning angle is not yet in place. As a result, the results of torsional stiffness testing become inaccurate.

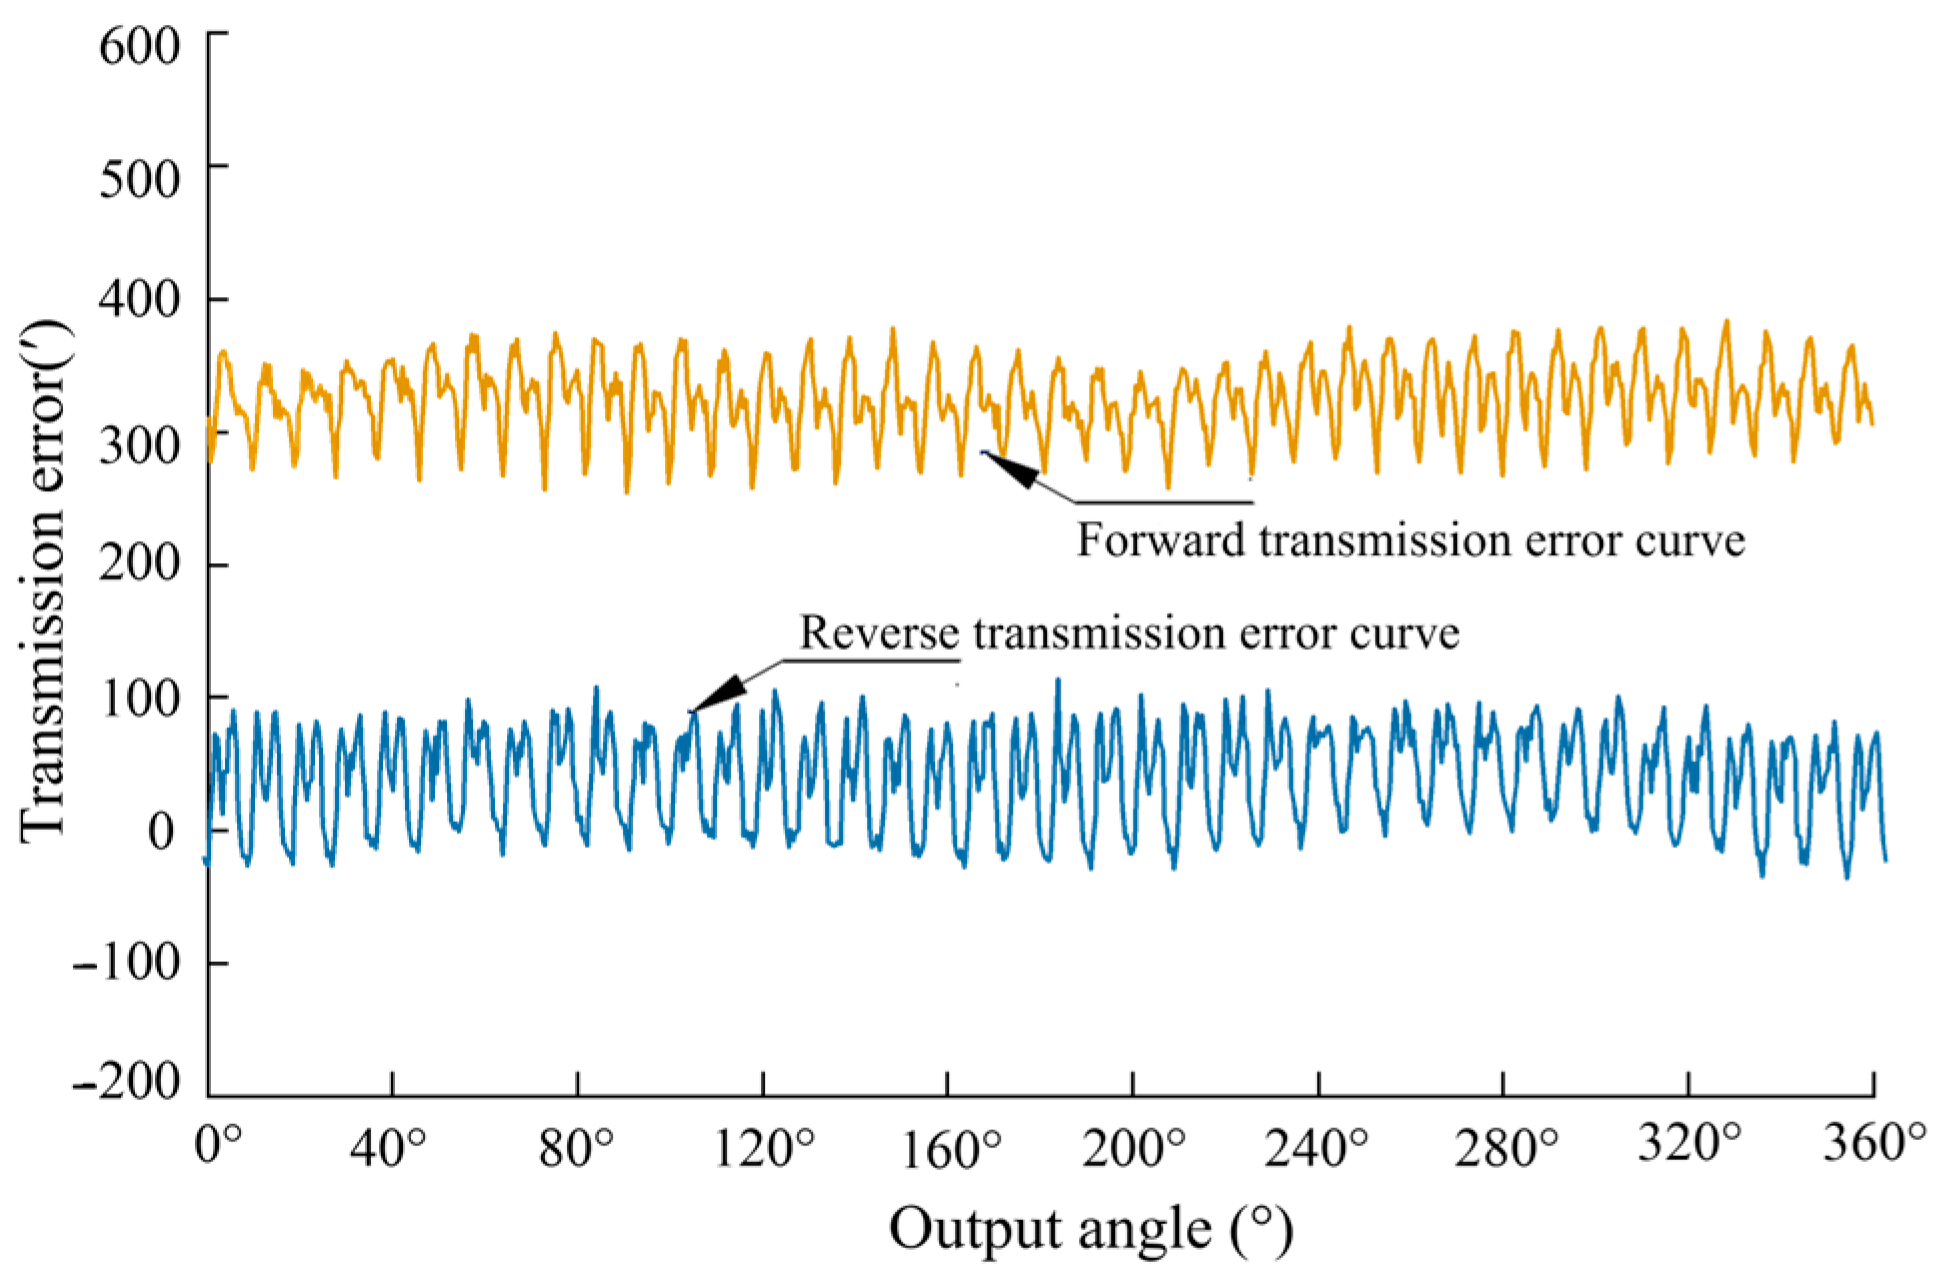
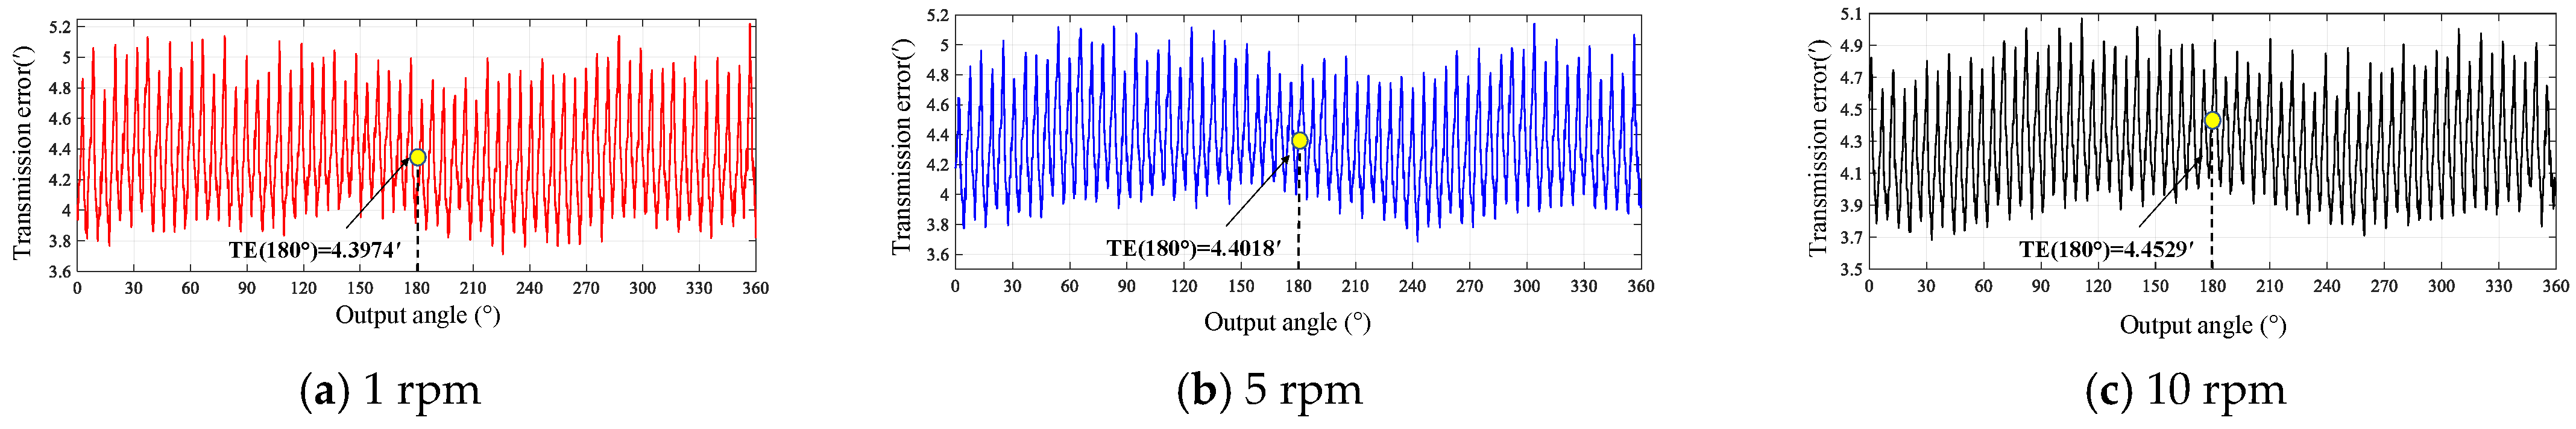
4.3. Transmission Error Method for Testing Torsional Stiffness

In this research, the torsional stiffness of two reducers was examined using the transmission error method. The small reducer was subjected to a rated torque of 1.0 Nm, while the large reducer was loaded with a rated torque of 380.0 Nm. The test speeds were within the rated speed range of their respective output shafts, and the specific test conditions are presented in Table 5. The obtained test curves are displayed in Figure 13 and Figure 14, while the detailed test results can be found in Table 6.
Based on the test results, the following observations can be made: At low output shaft speeds, the torsional stiffness results obtained using the transmission error method closely match those obtained from the hysteresis curve method for low loading rates. As the speed increases for the small reducer at the 180° position, the transmission error value rises from 2.0128° to 2.8436°, leading to a corresponding decrease in torsional stiffness from 0.4964 Nm/° to 0.3517 Nm/°. In comparison, large reducers exhibit smaller variations, with transmission error values increasing from 4.3974° to 4.4529°, and corresponding torsional stiffness decreasing from 5184.8820 Nm/° to 5122.587 Nm/°. These results reveal that when using the transmission error method to test the torsional stiffness of the reducer, the test results differ at various speeds. This discrepancy is attributed to torque fluctuations, elastic deformation due to friction, and gear disengagement inside the reducer as the speed increases. These factors cause changes in the internal dynamics of the system, leading to variations in the actual torsional stiffness.
Furthermore, it is evident that the torsional stiffness of small reducers is significantly influenced by rotational speed, whereas the torsional stiffness of large reducers remains relatively stable. This disparity is attributed to variations in the precision of gear processing and installation between small and large reducers, resulting in different dynamic performance under actual working conditions.
(1)
Small reducers are typically employed in scenarios with lower demands for transmission precision or load-bearing capacity, such as in applications like toy robots or food service robots. Consequently, the performance requirements of transmission components such as gears, gear shafts, bearings, and other related parts, as well as the precision requirements for overall assembly, tend to be less stringent. This results in a relatively moderate transmission performance for small-scale reducers, making them susceptible to occurrences such as gear mesh impacts, gear disengagement, and similar phenomena. As a consequence, this can lead to more pronounced torque fluctuations, further contributing to significant variations in the actual torsional stiffness.
(2)
The large reducers mentioned in this study, on the other hand, are designed for precision applications in the fields of industrial robotics, collaborative robotics, and similar domains. These precision reducers exhibit significantly higher transmission precision and load-bearing capacity for components such as gears and bearings, as well as stricter requirements for overall assembly accuracy compared to small-scale reducers. Consequently, their operation is characterized by greater stability, resulting in reduced torque fluctuation amplitudes and a relatively stable actual torsional stiffness.

4.4. Torsional Stiffness Test of Reducer under All Operating Conditions

In the previous test, it was observed that the torsional stiffness of the reducer varies with changes in speed. Consequently, it becomes imperative to investigate the alterations in the torsional stiffness of the reducer under real working conditions. To accomplish this, the transmission error method is utilized to examine the torsional stiffness at different speeds and torques.
Figure 15 displays the test curve of the small reducer at the 180° position, while Figure 16 presents the average torsional stiffness test curve within one revolution range. These curves reveal that the torsional stiffness of small reducers decreases as the rotational speed increases. This behavior reflects the dynamic characteristics of the actual torsional stiffness of the reducer. The torsional stiffness curve takes on an approximately parabolic shape, illustrating the nonlinear changes in the internal system dynamics of the reducer.
On the other hand, Figure 17 shows the test curve of the large reducer at the 180° position, and Figure 18 illustrates the average torsional stiffness test curve within one revolution range for this large reducer. Similar to the small reducers, the test results for the large reducer also show a decrease in torsional stiffness with increasing rotational speed. However, the torsional stiffness curve of the large reducer takes on an approximately linear shape, which is influenced by factors such as its structure and material properties.

5. Value and Application

Through the research in this article, it was discovered that the proposed dynamic torsional stiffness can more accurately represent the changes in torsional stiffness of reducers under real working conditions. Additionally, the suggested testing method avoids the influence of loading rate dependence and provides more precise test results, opening up a new direction for studying the torsional stiffness of reducers. The benefits of this method are as follows:
(1)
Torsional stiffness testing under different loads aligns better with the actual working conditions of the reducer.
(2)
The hysteresis curve method is inefficient and unsuitable for industrial applications, whereas the transmission error method offers higher testing efficiency and enables online full inspection.
(3)
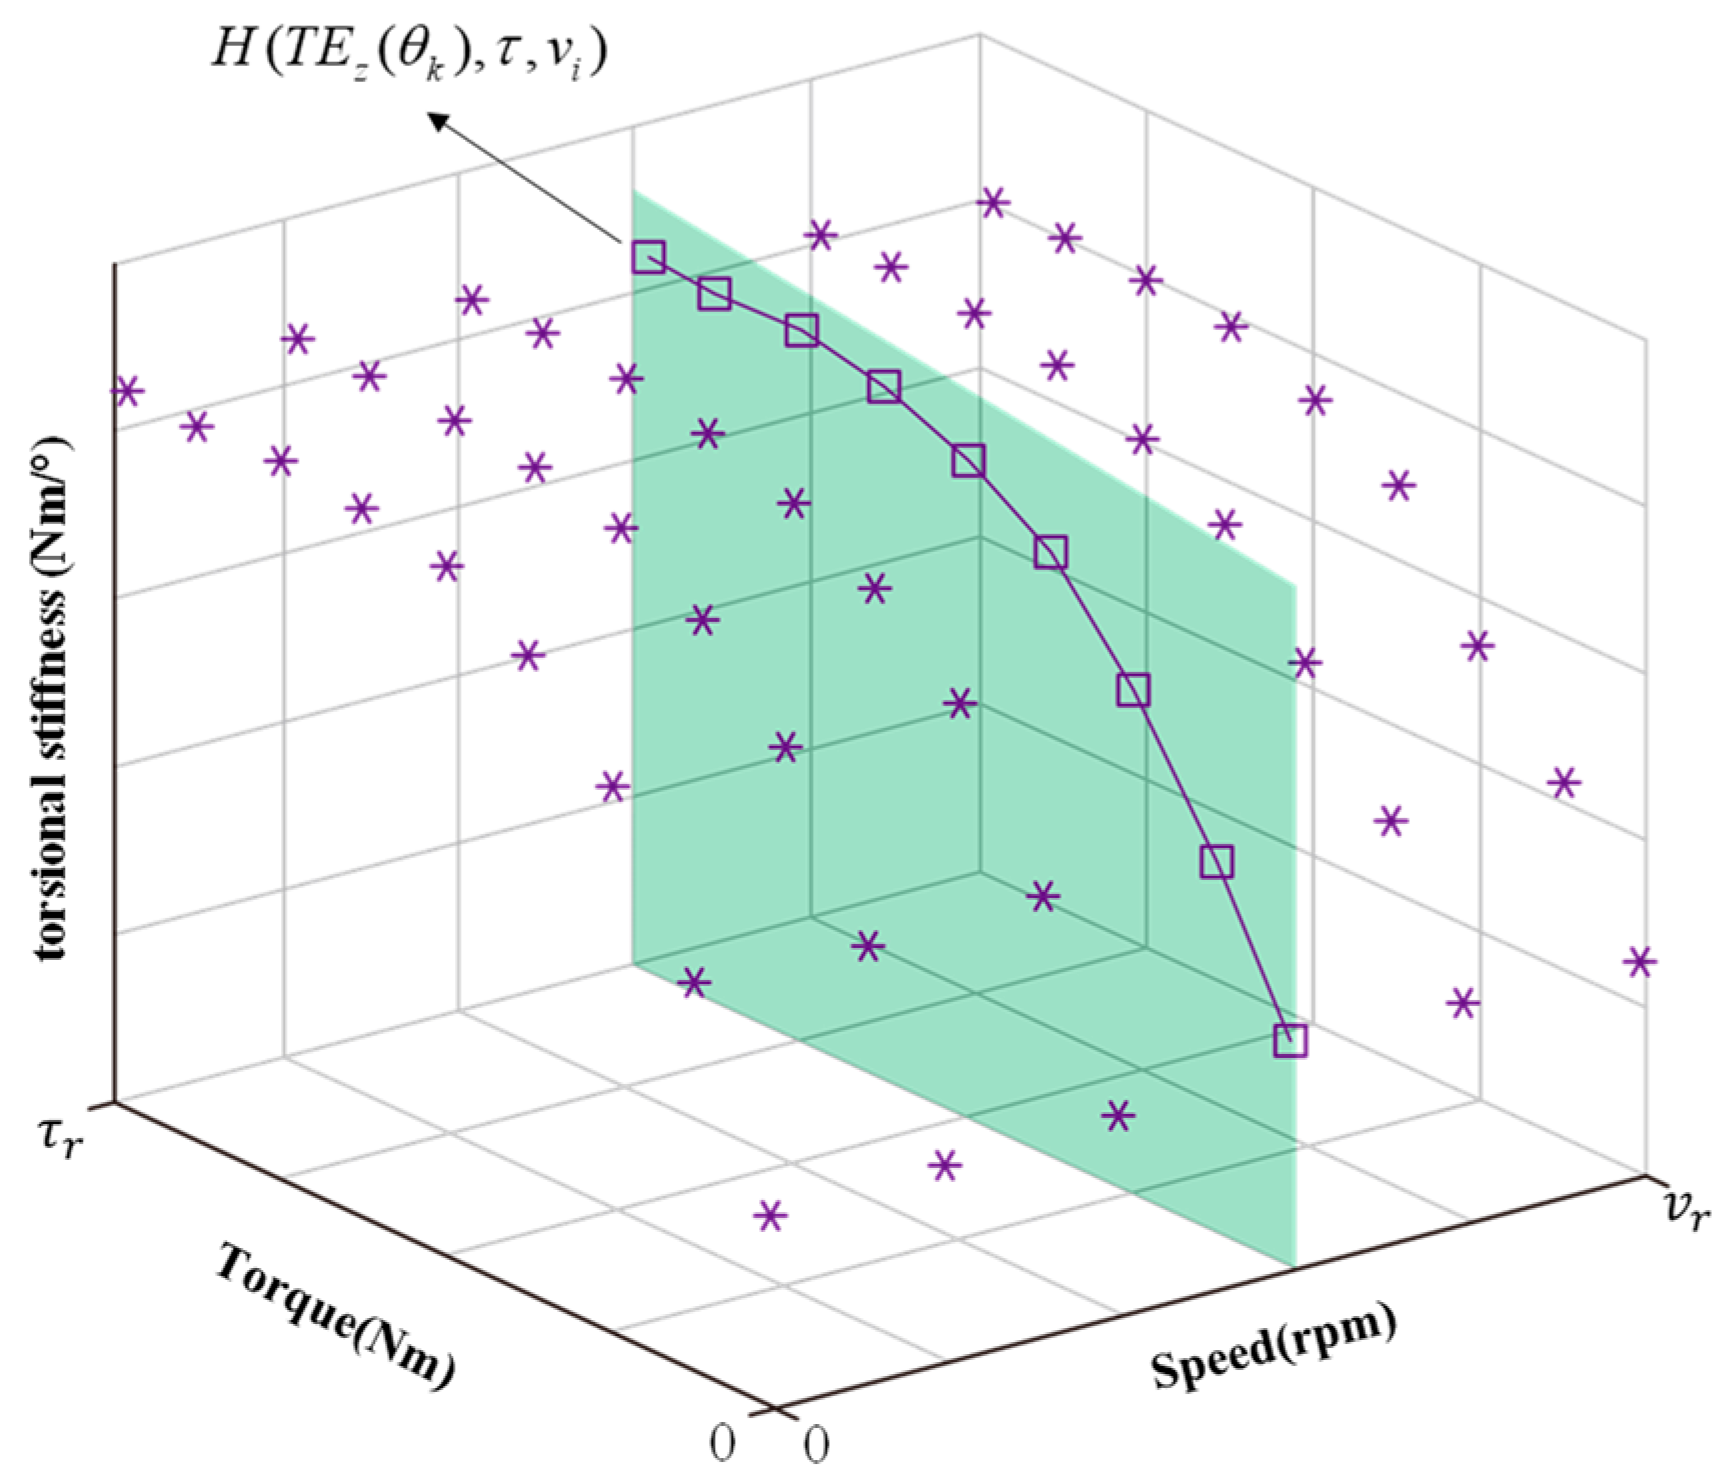
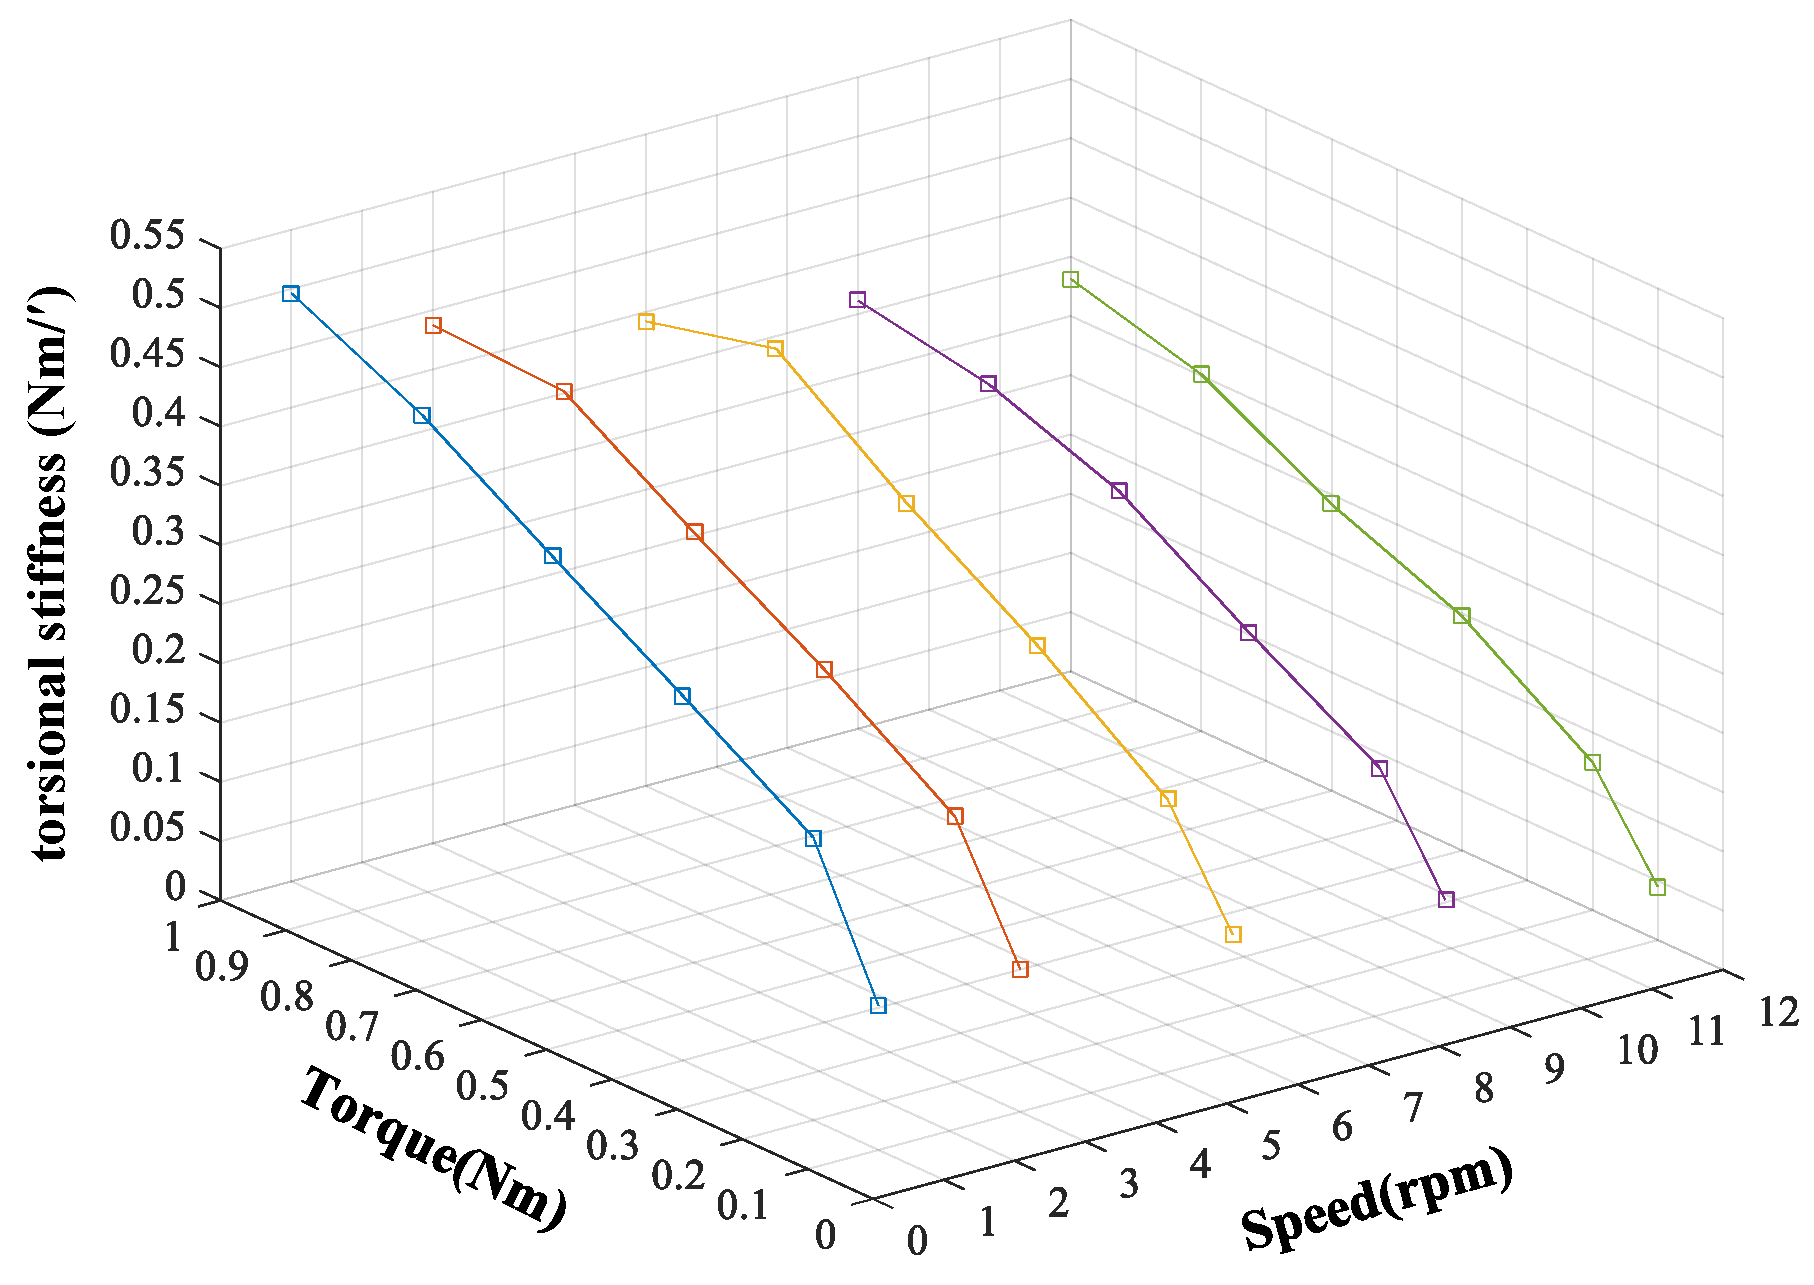
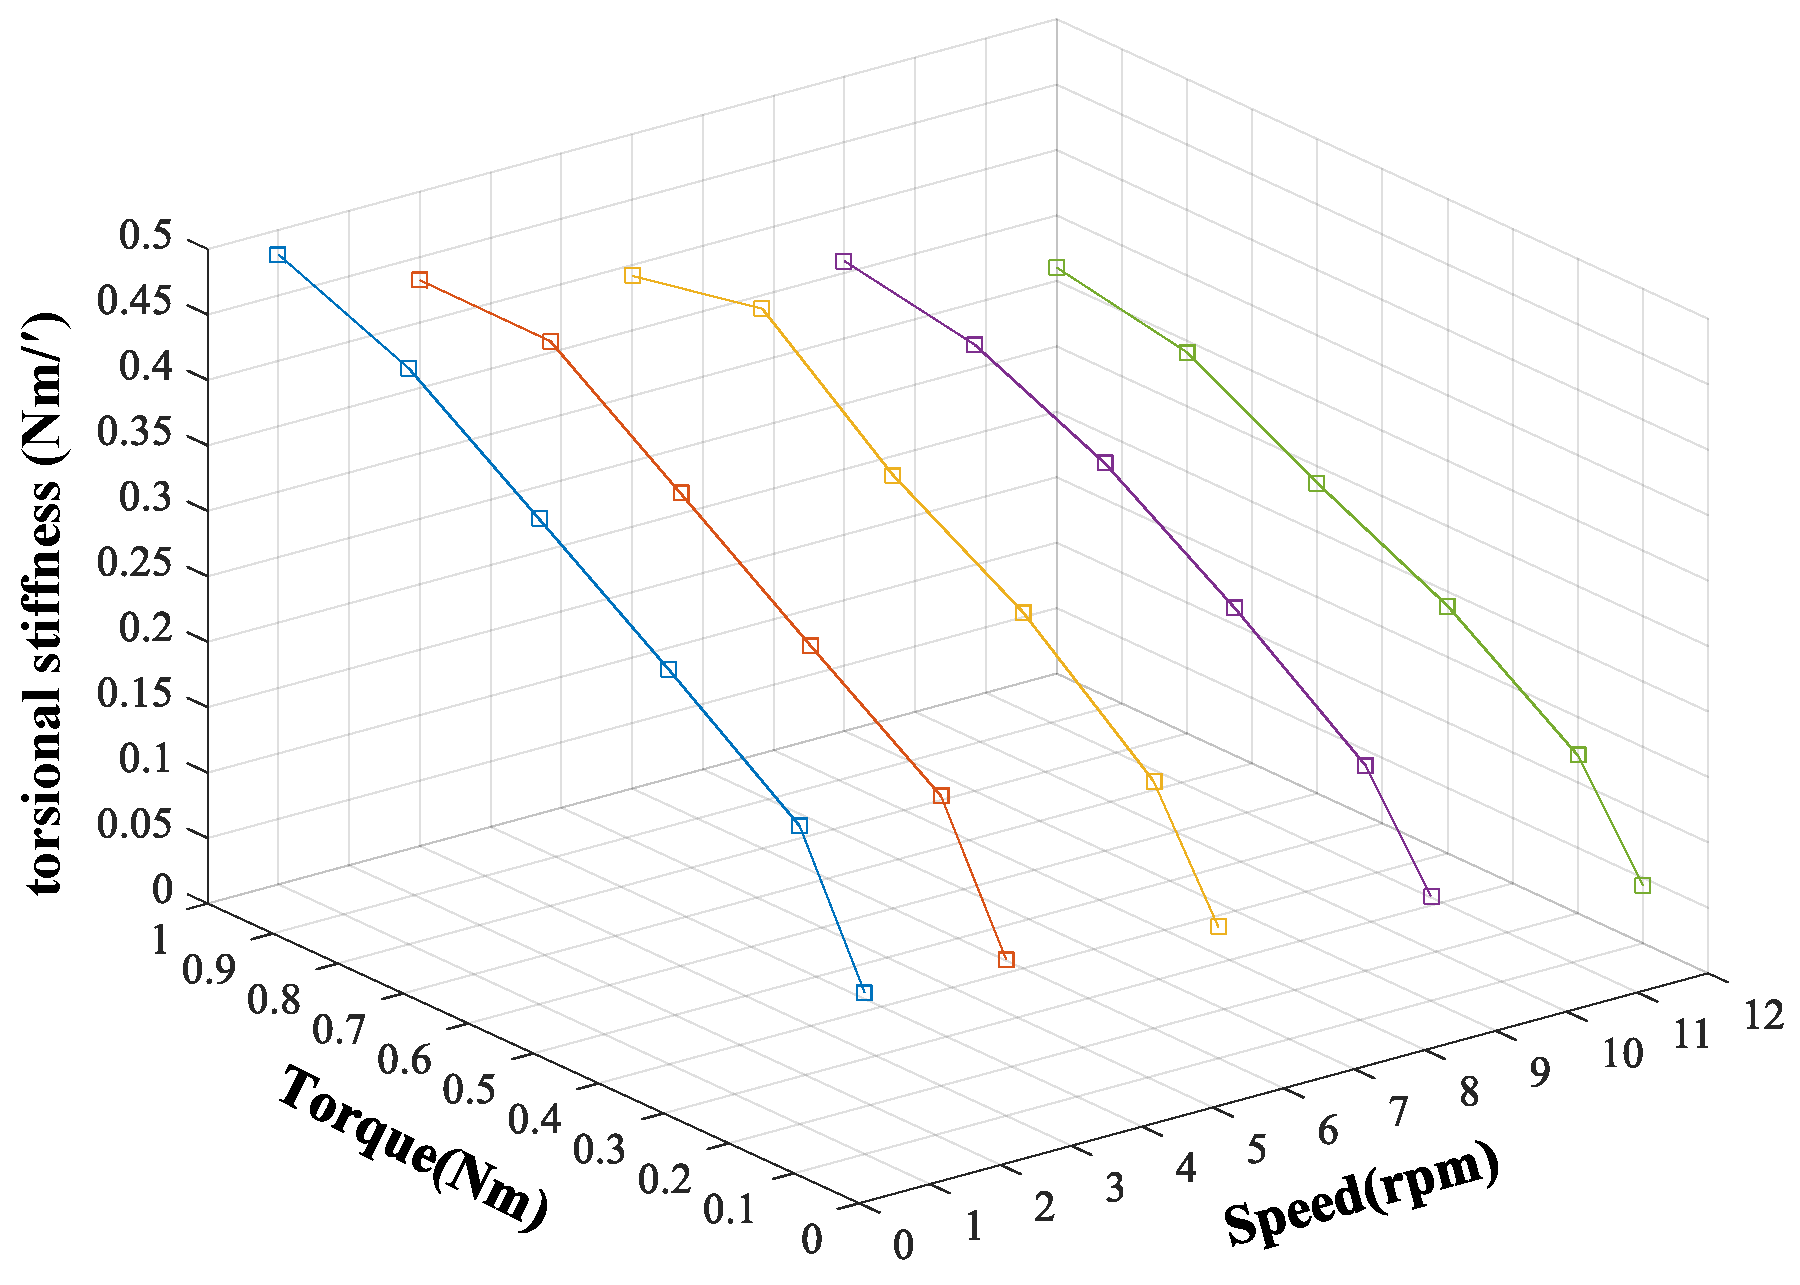
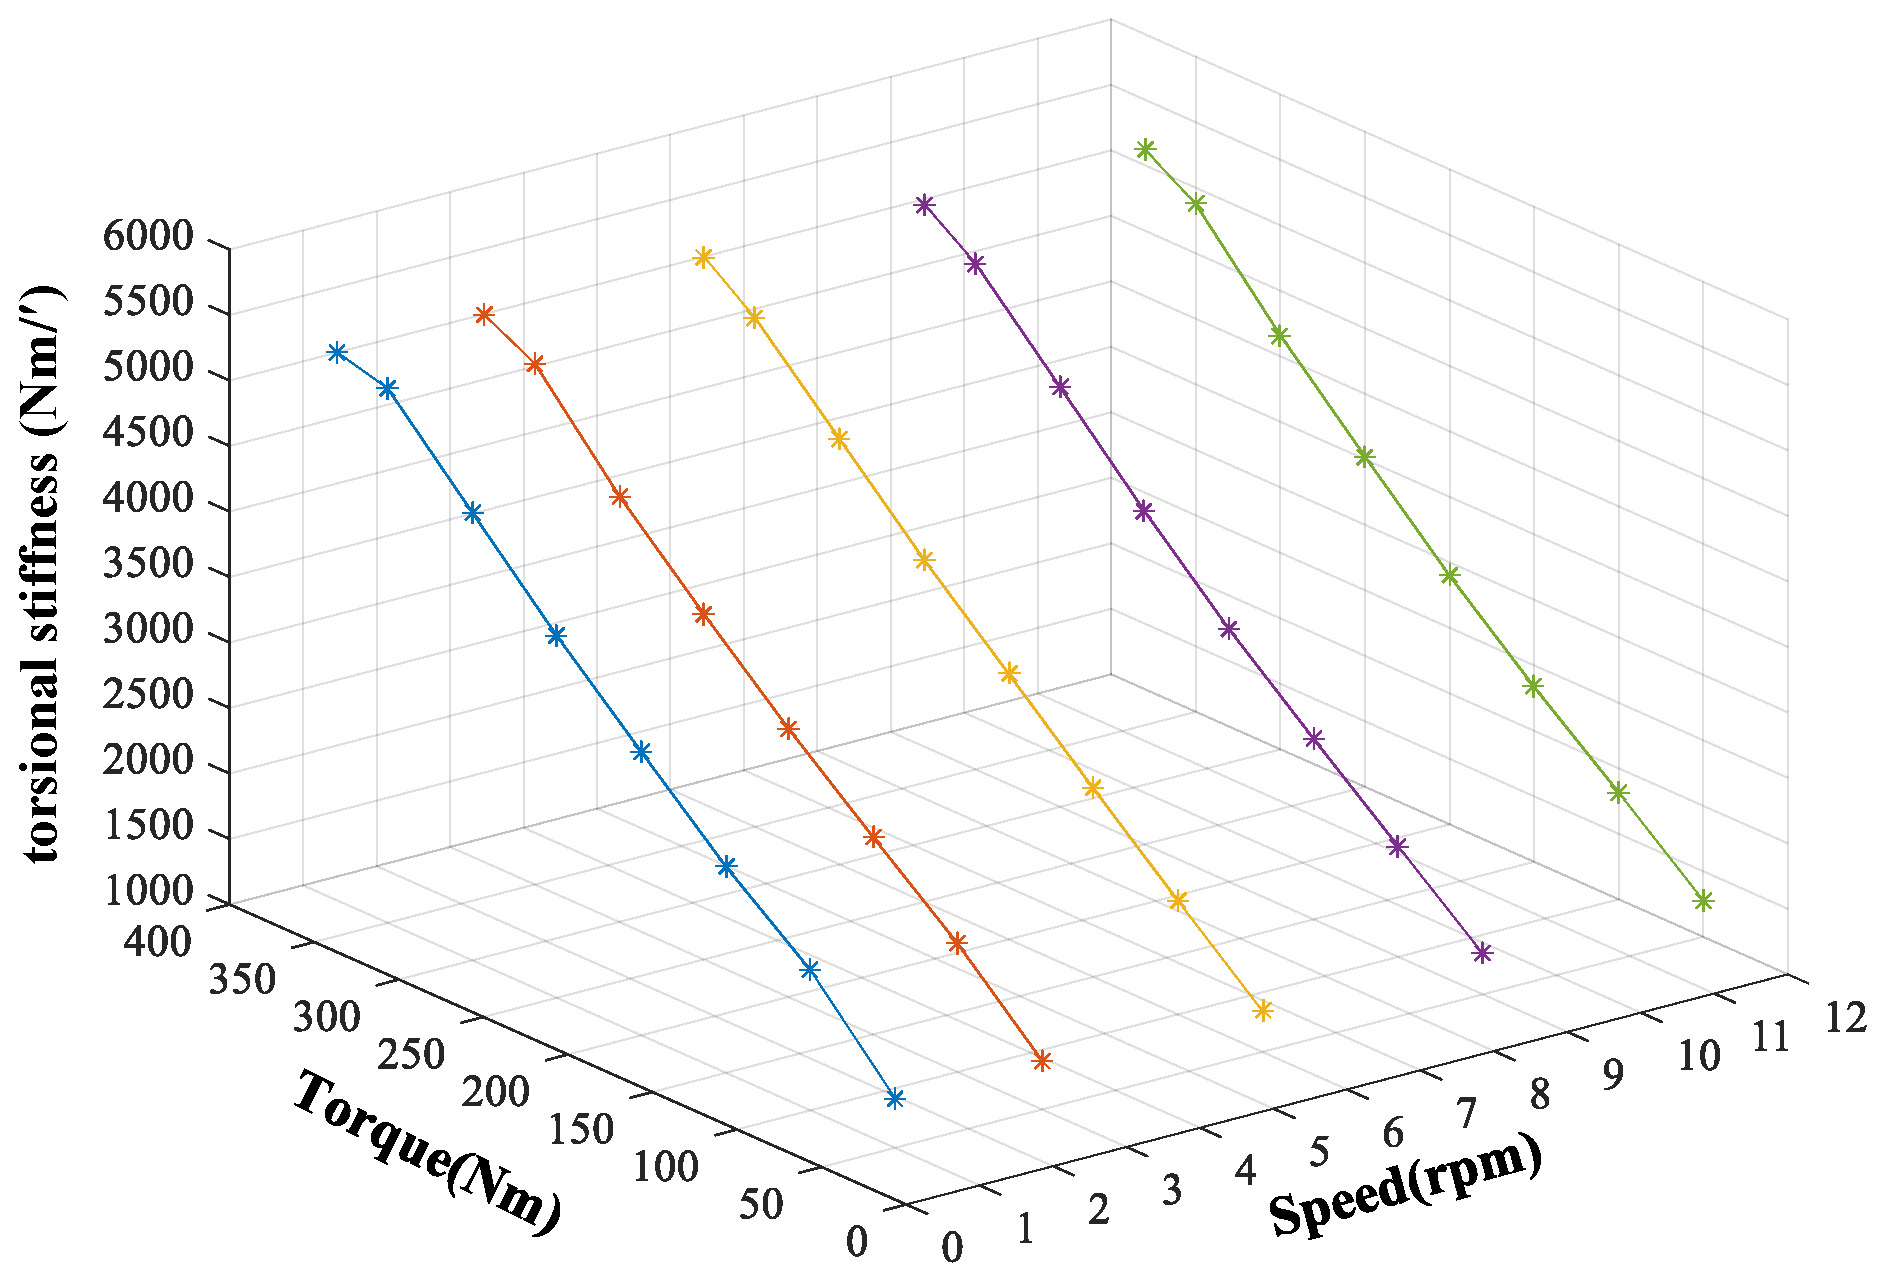
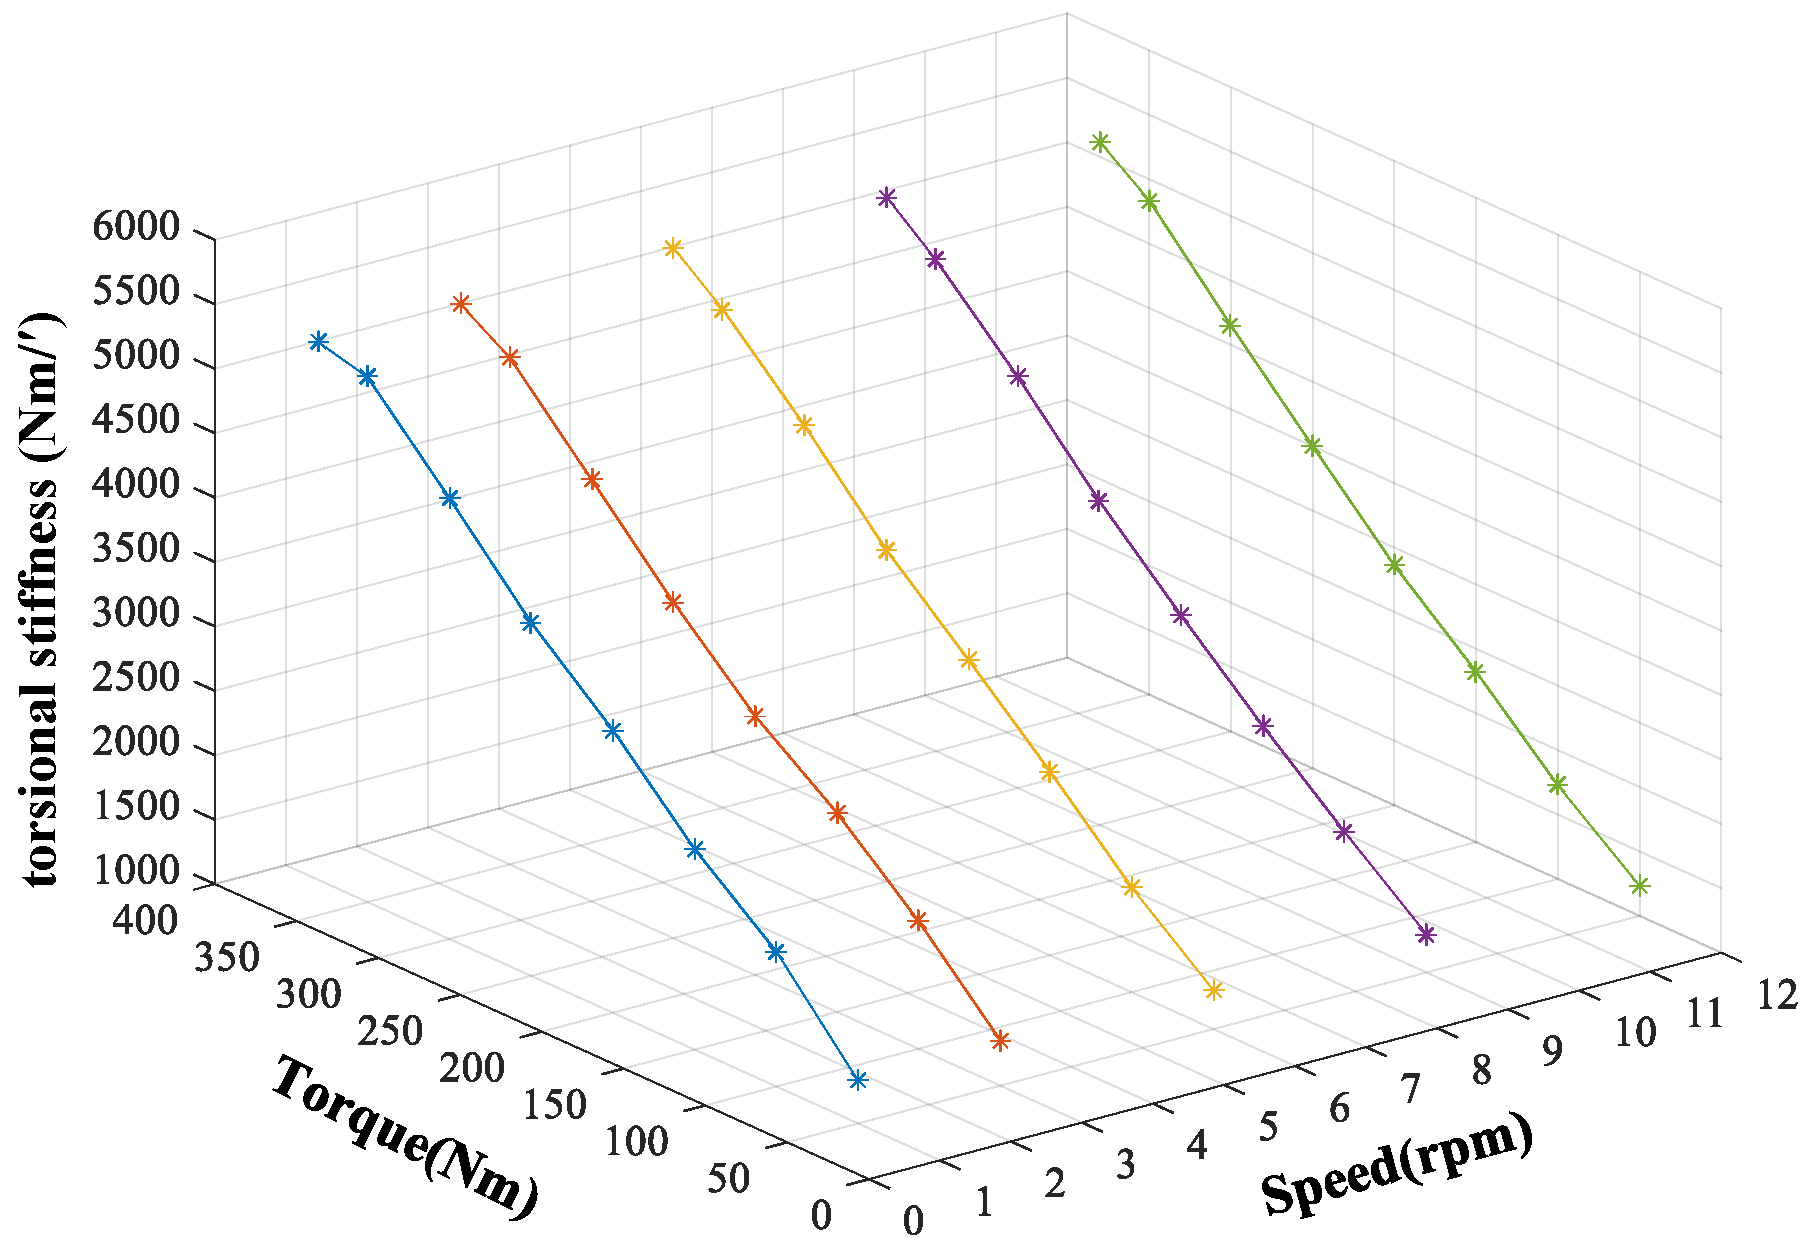
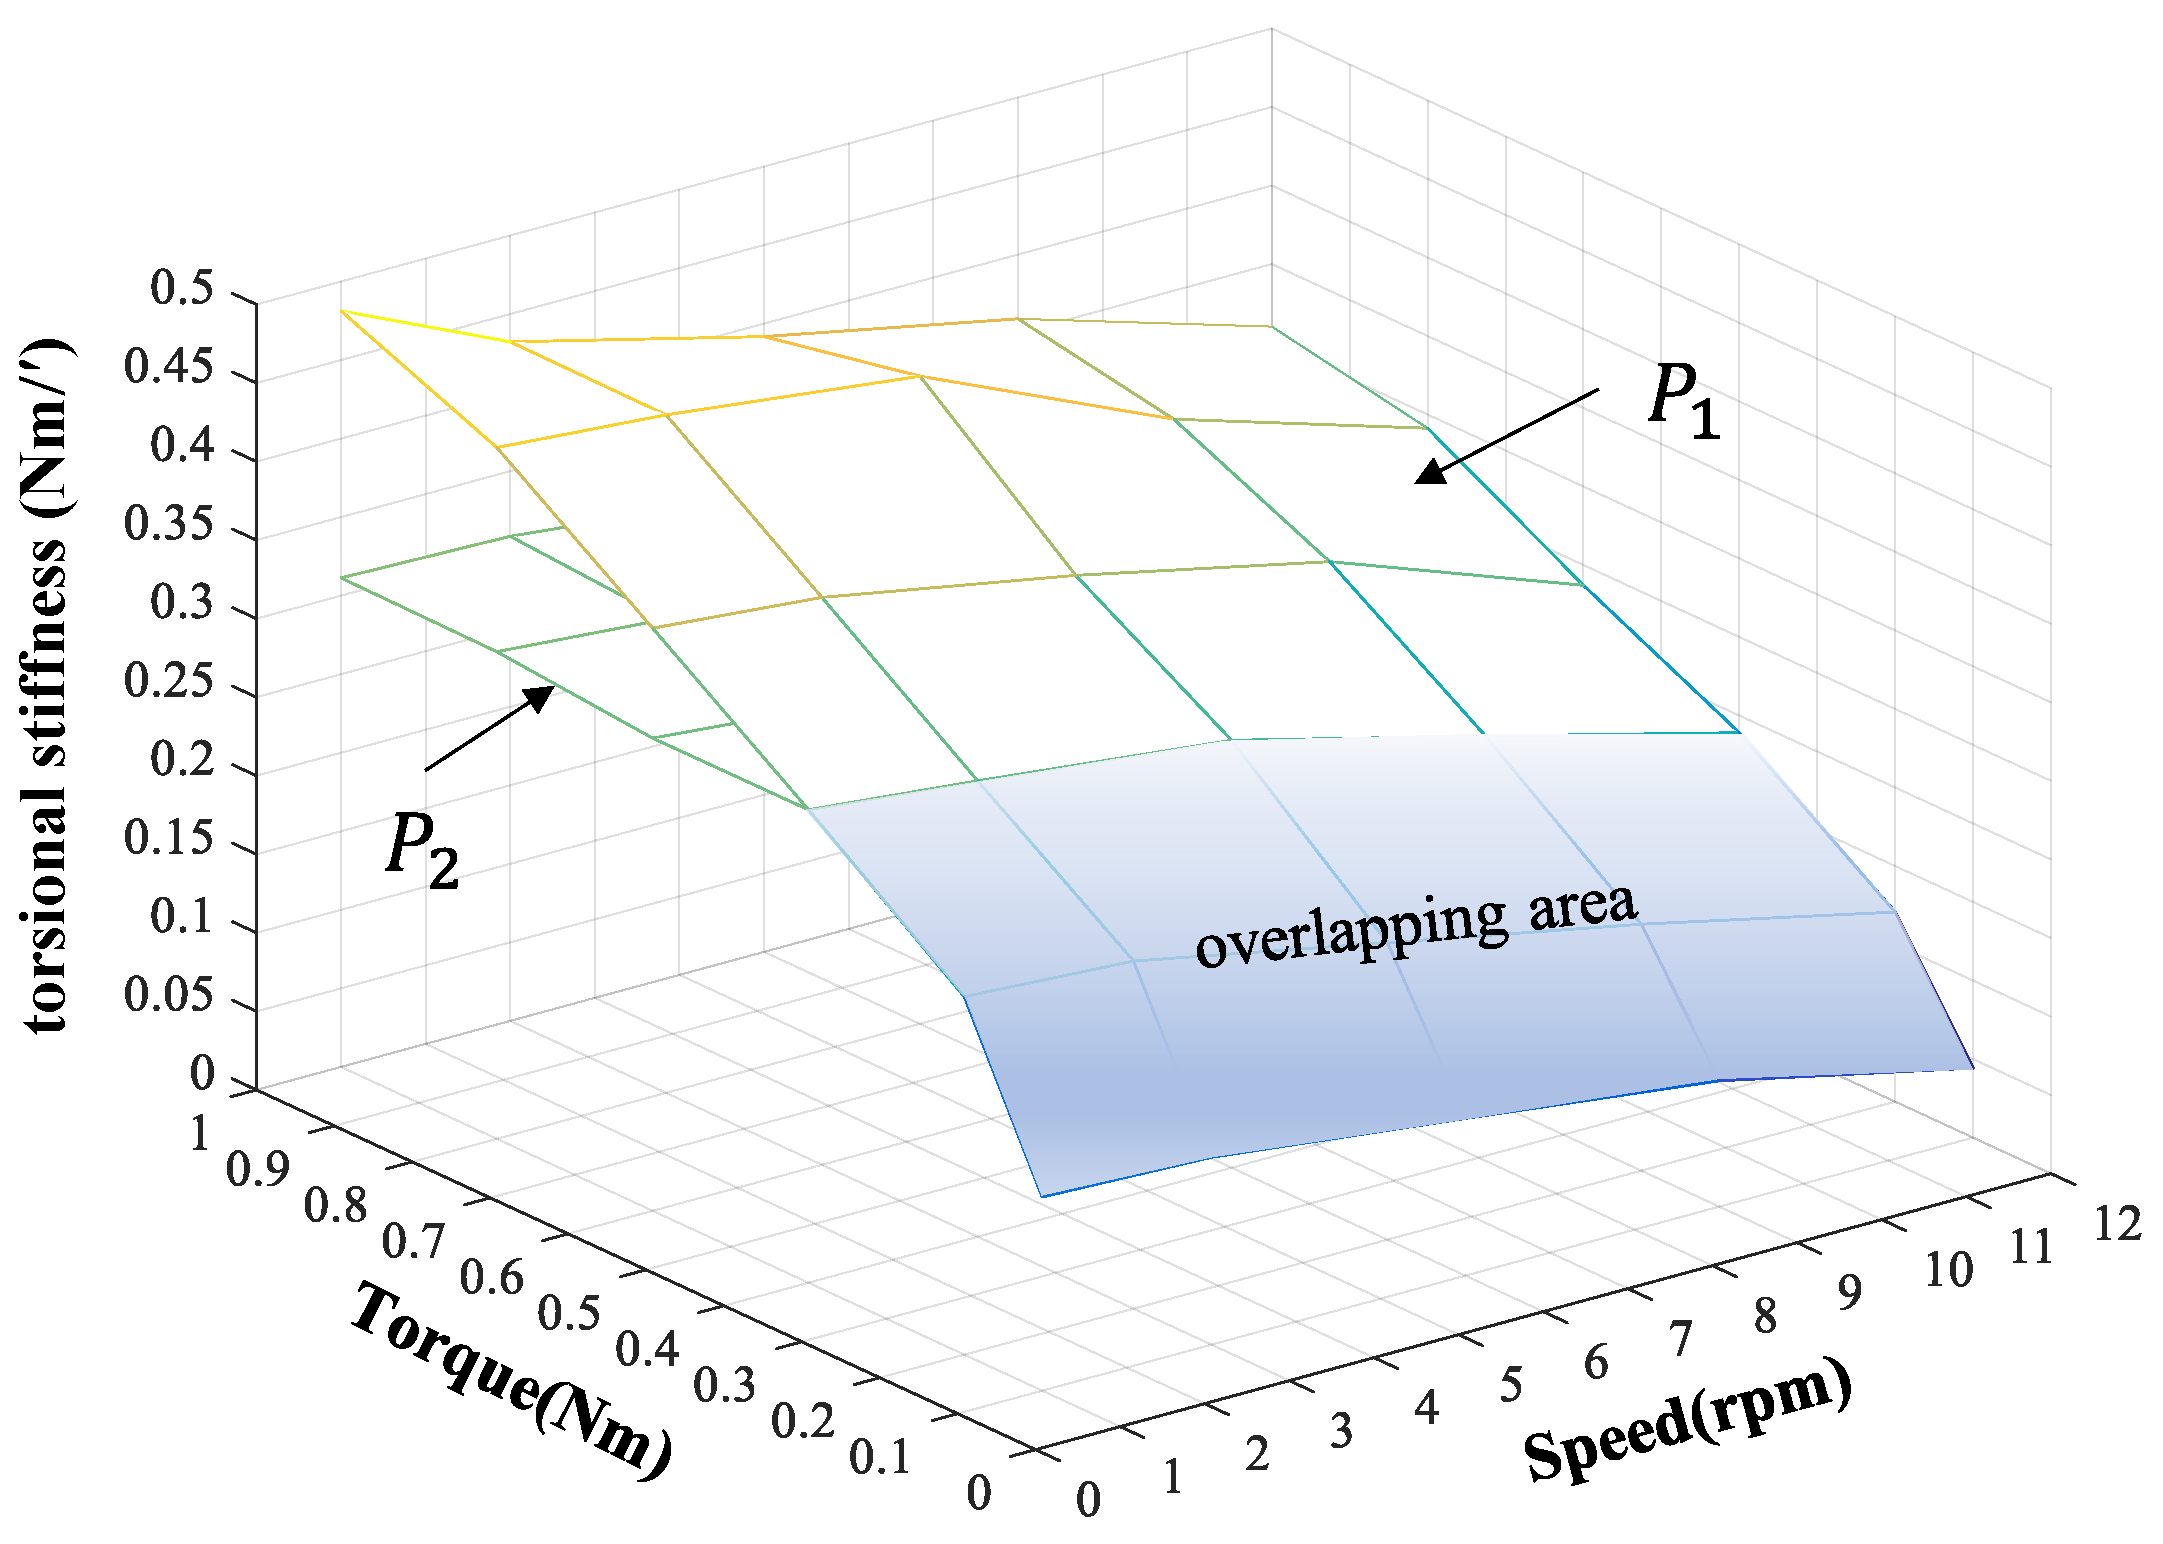
Acquiring complete information about the reducer’s torsional stiffness in various working conditions. This method’s significant advantage lies in obtaining comprehensive information about the torsional stiffness of the reducer (demonstrated in Figure 16 and Figure 18, etc.). This information empowers application personnel to adjust the reducer’s speed and torque, ensuring that its torsional stiffness consistently meets usage requirements. For example, in Figure 19, the torsional stiffness, torque, and speed surfaces of the small reducer during normal operation are represented by P1, while the fault surface is depicted as P2. An overlap exists between the two surfaces. Consequently, as long as the reducer’s torque and speed during operation fall within the overlap area, its torsional stiffness will meet the usage requirements, and there would be no need to replace the faulty reducer.

6. Conclusions

(1)
The reducer’s torsional stiffness is not static but dynamic. A novel concept called “dynamic torsional stiffness” was introduced to accurately represent the reducer’s torsional stiffness under real working conditions. An analytical formula for this dynamic torsional stiffness was provided.
(2)
A testing method for dynamic torsional stiffness in reducers, based on the transmission error method, was proposed. The theoretical demonstration confirmed its feasibility and its consistency with the hysteresis curve method.
(3)
Experimental research was conducted to explain the limitations of the hysteresis curve method. Additionally, the dynamic characteristics of torsional stiffness and the effectiveness of the transmission error method were verified. As a result, the torsional stiffness information of the reducer under all operating conditions was obtained.
(4)
The transmission error method takes into account the actual working conditions of the reducer, and its results comprehensively consider the influences of torque and speed, while also avoiding the effects of loading rate dependency. Therefore, the test results are more accurate and reliable, making it more valuable in both theoretical analysis and practical engineering applications.

Author Contributions

Conceptualization, Z.S. and H.C.; methodology, H.C.; software, Z.Y.; validation, G.Z., H.C. and Z.Y.; formal analysis, H.C.; writing—review and editing, H.C.; supervision, Z.S.; project administration, Z.S. All authors have read and agreed to the published version of the manuscript.

Funding

This research was funded by supported by the Zhongguancun open laboratory concept project (grant number Q7001004202101).

Institutional Review Board Statement

Not applicable.

Informed Consent Statement

Not applicable.

Data Availability Statement

The raw/processed data required to reproduce the above findings cannot be shared at this time as the data also form part of an ongoing study.

Conflicts of Interest

The authors declare no conflict of interest. The funders had no role in the design of the study; in the collection, analyses, or interpretation of data; in the writing of the manuscript; or in the decision to publish the results.

References

  1. GB/T 40731–2021; Method of Test and Evaluation for Lost Motion of Precision Reducer. State Administration for Market Regulation and Standardization Administration: Beijing, China, 2021.
  2. Maeck, J.; Roeck, G.D. Dynamic Bending and Torsion Stiffness Derivation from Modal Curvatures and Torsion Rates. J. Sound Vib. 1999, 225, 153–170. [Google Scholar] [CrossRef]
  3. Peter, B.; Leif, K. The frequency, amplitude and magnetic field dependent torsional stiffness of a magneto-sensitive rubber bushing. Int. J. Mech. Sci. 2012, 60, 54–58. [Google Scholar]
  4. Sheng, B.; Li, S.; Ding, H.; Wei, B. Dynamic Torsion Stiffness Analysis of Gear-type Rubber Coupling. J. Mech. Transm. 2013, 37, 129–139. [Google Scholar]
  5. Xu, H.; Shi, Z.; Yu, B.; Wang, H. Optimal measurement speed and its determination method in the transmission precision evaluation of precision reducers. Appl. Sci. 2019, 9, 2146. [Google Scholar] [CrossRef] [Green Version]
  6. Cheng, H.; Shi, Z.; Yu, B.; Zhu, Y.; Ding, H. Experiment research on hysteresis measurement of the small-size joint of service robot. Chin. J. Sci. Instrument 2020, 41, 48–57. [Google Scholar]
  7. Xue, S.; Entwistle, R.; Mazhar, I.; Howard, I. The spur planetary gear torsional stiffness and its crack sensitivity under quasi-static conditions. Eng. Fail. Analysis 2016, 63, 106–120. [Google Scholar] [CrossRef] [Green Version]
  8. Wang, J.; Howard, I. The torsional stiffness of involute spur gears. Proc. Inst. Mech. Eng. Part C-J. Mech. Eng. Sci. 2004, 218, 131–142. [Google Scholar] [CrossRef]
  9. Ruderman, M.; Bertram, T.; Iwasaki, M. Modeling, observation, and control of hysteresis torsion in elastic robot joints. Mechatronics 2014, 24, 407–415. [Google Scholar] [CrossRef]
  10. Yang, H.; Zhu, Y.; Chen, Y.; Shen, G. Analysis of the Characteristics of Torsional Stiffness of RV Reducer. J. Tianjin Univ. (Sci. Technol.) 2015, 48, 111–118. [Google Scholar]
  11. Gu, J. Study on Torsional Stiffness and Dynamic Problems in Harmonic Reducer with Dual Rigid Gear. Ph.D. Dissertation, Shanghai University, Shanghai, China, 2021. [Google Scholar]
  12. Jin, H.; Ren, W.; Zhu, P. Influence of Torsional Stiffness on Load Sharing Characteristics of Power Split Transmission System. J. Aerosp. Power 2019, 34, 2478–2489. [Google Scholar]
  13. Shi, Z.; Cheng, H.; Yu, B.; Li, H. Loading Rate Dependence of Reducer Hysteresis and Its Influence on Lost Motion Test. Machines 2022, 10, 765. [Google Scholar] [CrossRef]
  14. Litvin, F.; Daniele, V.; Kenji, Y. Reduction of noise of loaded and unloaded misaligned gear drives. Reduct. Noise Loaded Unloaded Misaligned Gear Drives 2006, 117, 262–268. [Google Scholar] [CrossRef]
  15. Munro, R. Effect of geometrical errors on the transmission of motion between gears. Proc. Inst. Mech. Eng. Conf. Proc. 2006, 184, 79–84. [Google Scholar] [CrossRef]
  16. Shi, Z.; Kang, Y.; Lin, J. A comprehensive dynamics model and dynamic response analysis of a spur gear pair based on gear pair integrated error. J. Mech. Eng. 2022, 46, 56–61. [Google Scholar] [CrossRef]
  17. Stadtfeld, H. The ultimate motion graph. ASME J. Mech. Des. 2000, 122, 316–322. [Google Scholar] [CrossRef]
  18. Visintin, A. Reviewed Work: Hysteresis and Phase Transitions. SIAM Rev. 1997, 39, 559–561. [Google Scholar]
  19. Kennedy, M.P.; Chua, L.O. Hysteresis in electronic circuits: A circuit theorist’s perspective. Int. J. Circ. Theory Appl. 1991, 19, 471–515. [Google Scholar] [CrossRef]
  20. Bernard, Y.; Mendes, E.; Bouillault, F. Dynamic hysteresis modeling based on Preisach model. IEEE Trans. Magn. 2002, 38, 885–888. [Google Scholar] [CrossRef]
  21. Fang, J.C.; Chen, M.; Li, H.T. Hysteresis modeling for harmonic drive in DGMSCMG gimbal system. Opt. Precis. Eng. 2014, 22, 2950–2958. [Google Scholar] [CrossRef]
  22. Zhaoyao, S.H.I.; Huiming, C. Status and prospects of domestic and international research on robot actuator testing technology. J. Harbin Eng. Univ. 2023, 44, 679–688. [Google Scholar]
  23. Merola, A.; Colacino, D.; Cosentino, C.; Amato, F. A parsimonious friction model for efficient identification and compensation of hysteresis with non-local memory. Int. J. Model. Identif. Control 2015, 23, 85–91. [Google Scholar] [CrossRef]
Figure 1. Hysteresis curve method.
Applsci 13 09277 g001
Figure 2. Composition of the hysteresis curve.
Applsci 13 09277 g002
Figure 3. Measuring principle of transmission error.
Applsci 13 09277 g003
Figure 4. Schematic diagram of hysteresis curve.
Applsci 13 09277 g004
Figure 5. Torsional stiffness curve.
Applsci 13 09277 g005
Figure 6. Torsional stiffness evaluation model.
Applsci 13 09277 g006
Figure 7. Testing machine for the small-sized reducer.
Applsci 13 09277 g007
Figure 8. Testing machine for the large reducer.
Applsci 13 09277 g008
Figure 9. Physical picture of the small-sized reducer.
Applsci 13 09277 g009
Figure 10. Physical picture of the large reducer.
Applsci 13 09277 g010
Figure 11. Static torsional stiffness test results of a small-size reducer.
Applsci 13 09277 g011
Figure 12. Static torsional stiffness test results of a large reducer.
Applsci 13 09277 g012
Figure 13. Dynamic torsional stiffness test results of a small-size reducer.
Applsci 13 09277 g013
Figure 14. Dynamic torsional stiffness test results of a large reducer.
Applsci 13 09277 g014
Figure 15. Evaluation curve of a small-size reducer at the 180° position.
Applsci 13 09277 g015
Figure 16. Average torsion evaluation curve of small-size reducers.
Applsci 13 09277 g016
Figure 17. Evaluation curve of a large reducer at the 180° position.
Applsci 13 09277 g017
Figure 18. Average torsion evaluation curve of large reducers.
Applsci 13 09277 g018
Figure 19. Application of evaluation results.
Applsci 13 09277 g019
Table 1. Parameters of the test equipment.
ProgramSmall-Size ReducerLarge Precision Reducer
Torque range0–10 Nm0–1500 Nm
Torque measurement accuracy±0.1% F.S±0.1% F.S
Circular grating resolution±1.44″±1″
Table 2. Parameters of the two types of reducers used in the experiments.
TypeRate TorqueMax SpeedLost Motion
Small-size reducer1.0 Nm70 rpm3.6°
Large precision reducer380 Nm70 rpm2′
Table 3. Experimental conditions of static torsional stiffness.
TypePositionCondition 1Condition 2Condition 3
Small-size reducer180°0.02 Nm/s0.05 Nm/s0.1 Nm/s
Large precision reducer180°1 Nm/s2.5 Nm/s5 Nm/s
Table 4. Test results of static torsional stiffness.
TypeResult 1Result 2Result 3
Small-size reducer0.4969 Nm/°0.5124 Nm/°0.5192 Nm/°
Large precision reducer5235.1212 Nm/°5474.5840 Nm/°5633.3852 Nm/°
Table 5. Experimental conditions of dynamic torsional stiffness.
TypeLoad TorqueCondition 1Condition 2Condition 3
Small-size reducer1.0 Nm1 rpm5 rpm10 rpm
Large precision reducer380.0 Nm1 rpm5 rpm10 rpm
Table 6. Test results of dynamic torsional stiffness.
TypeResult 1Result 2Result 3
Small-size reducer0.4964 Nm/°0.3880 Nm/°0.3517 Nm/°
Large precision reducer5184.8820 Nm/°5179.6992 Nm/°5120.2587 Nm/°
Disclaimer/Publisher’s Note: The statements, opinions and data contained in all publications are solely those of the individual author(s) and contributor(s) and not of MDPI and/or the editor(s). MDPI and/or the editor(s) disclaim responsibility for any injury to people or property resulting from any ideas, methods, instructions or products referred to in the content.

