Abstract
Food safety and quality are the first steps in the food chain. This work reports a miniaturized, low-cost, and easy-to-use near-infrared spectroscopy (NIRS) measurement system for alfalfa quality control. This is a significant challenge for dairy farm technicians and producers who need rapid and reliable knowledge of the forage quality on their farms. In most cases, the instrumentation suitable for these specifications is expensive and difficult to operate. The core of the proposed NIR spectroscopy measurement system is Texas Instruments’ NIRscan Nano evaluation module (EVM) spectrometer. This module has a large sensing area and high resolution, suitable for forage samples. To evaluate the feasibility of the prototype for analyzing agrifood samples, different ways of presenting the sample, intact or ground, were tested. The final objective of the research is not just to check the efficiency of the proposed system. It is also to determine the characteristics of the measurement system, and how to improve them for alfalfa quality control.
1. Introduction
The nutritional value of animal feed is essential to quality, safe feed consumption, and animal welfare []. In addition to this fact, and due to the great variability in the raw materials used to feed animals, it is necessary to develop strategies focused on the tight control of animal feed products. These should be combined with the research and development of new, simple, economical, and robust methods for monitoring quality and safety parameters [,].
Forage is one of the main feed products in animal husbandry and must, therefore, be subject to safety and quality controls. Among the most important quality parameters for forages, the following three can be highlighted []. The fiber content is mainly provided by the fodder cell wall, and represents its carbohydrate. The mineral content (ash) gives information about possible contamination with soil, and supplies micronutrients to the diet. It also provides information on the quality of the forage. The third parameter is the protein content, which is extremely important in animal production.
Several important books on NIR spectroscopy are currently available, but some of them are not up to date. Ozaki et al. [] report a new state-of-the-art textbook on NIR spectroscopy, covering its principles, spectral analysis and data treatments, instrumentation, and applications. In [], Huck et al. review the fundamental principles of NIRS, and its applicability, regulatory issues, advantages, and limitations in natural product research.
Near-infrared spectroscopy (NIRS) techniques have always been valued and used in food analysis and quality control, due to the speed of analysis, the simplicity of sampling, the non-invasive nature of the techniques, and the possibility of their being implemented in the production line. In this review [], Shenk et al. introduce scientific and technical reports using the NIRS to evaluate food, agriculture, and forest products.
In addition to the advantages of this technique, the possibility of developing miniaturized NIR systems that are easy to use, and specialized in the quality control of the raw forages used in animal feed, makes it possible to increase quality control (sampling). Thus, Cherney et al. [] evaluate several hand-held NIR instruments for the precision and accuracy of the currently available calibrations for dry-matter and forage nutritive value. Crocombe [] outlines the technologies used in portable spectroscopy, and Beć et al. [] discuss the characteristics of miniaturized NIR sensors in comparison to benchtop laboratory spectrometers.
The use of easy-to-use portable NIRS instrumentation minimizes time losses, because nonspecialized personnel are able to analyse samples on site, and a real-time response is achieved as soon as the analysis is carried out. These characteristics are some of those required in precision farming [].
Several miniaturized spectrophotometers have been developed and marketed in the last decade, some of which are extremely small, light, and inexpensive. By allowing measurements in the field, at the point of delivery, production, sale, purchase, and use, these spectrometers transform NIRS technology. Table 1 lists some commercial miniaturized NIRSs, and presents their main characteristics, as found on the websites of the manufacturers.

Table 1.
Main specifications of some commercial miniaturized NIRSs.
This work evaluates the feasibility of a miniaturized and low-cost NIRS measurement system for alfalfa quality control. The core of this system is a NIR spectrometer based on the Texas Instruments NIRscan Nano evaluation module (EVM). It has a large sensing area and high resolution to analyse forage samples. To evaluate the feasibility of the prototype, different ways of presenting the sample, intact (raw) or ground, were studied. This equipment has already been tested for use in liquid sample analysis [], with a specific cuvette for liquid samples. For this purpose, alfalfa samples were analysed. Alfalfa is one of the main forages used to feed animals, due to its high biomass production, and protein and fiber contents. In summary, this work contributes:
- to confirming the efficiency of the proposed NIRS measurement system;
- to identifying the qualities of the equipment; and
- to looking for aspects to improve and implement in the future.
2. Materials and Methods
2.1. NIRscan Nano Evaluation Module
The core of the optoelectronic measurement system is the Texas Instruments NIRscan Nano evaluation module (USD 1000 approx.) []. The block diagram of this module for reflectance measurements is shown in Figure 1. A slit collects and concentrate diffuse reflections, by illuminating samples at an angle that eliminates specular reflections. Light passing through the slit is collimated, low-pass filtered, and then dispersed into its constituent wavelengths via a reflective grating. Each wavelength is represented by a separate image created by the focusing lens of the digital micromirror device (DMD).
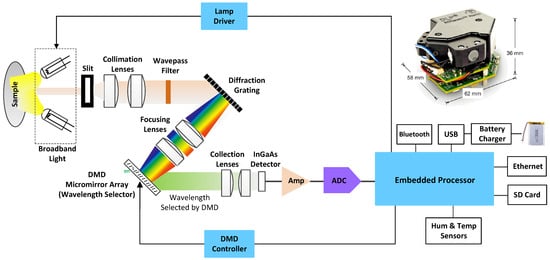
Figure 1.
Block diagram and image (upper right corner) of the Texas Instruments DLP NIRscan Nano EVM.
The DMD is controlled by the embedded processor, which turns only certain mirrors on and off at certain times. The width of the DMD columns selected as “on” determines the amount of light directed to the photodetector, as well as the resolution of the system. The DMD columns selected as “off” divert unselected wavelengths away from the photodetector’s optical path, to prevent interference. By doing this, they can achieve high signal-to-noise ratios (SNRs). An array detector cannot take advantage of the adaptive scanning techniques that can be performed using this type of architecture. Light energy is collected and concentrated, by the collection lenses, onto the single-point InGaAs photodetector. Analog-to-digital converters (ADCs) convert photodetector signals to digital values through transimpedance amplifiers.
2.2. NIRS Measurement System
The instrument sample window can be enlarged if raw samples with larger particle sizes are analyzed. This will produce reproducible spectra. However, this is difficult when measuring samples directly, as the sample window is very small (10 mm × 10 mm). This problem was overcome through the attaching of a semicircular sample holder to the spectrometer, as shown in Figure 2a. To ensure homogenous results for the sample, 10 measurements are made at each holder position. Figure 2b shows the microcontroller (LOLIN ESP32, USD 10) attached to the spectrometer module that drives the servomotor (MG90S, USD 10). This servo motor is powered by a 3.7 V to DC–DC converter (Pololu U1V0F5, USD 6). When the start button is pressed, the servo motor rotates, and stops at different positions to take measurements. After rotating 180°, the holder returns to its original position, and waits for another measurement to take place. When the load button is pressed, the servo motor rotates 90° to an intermediate position, making loading and unloading easier. When neither of these two actions occur, the microcontroller enters sleep mode.
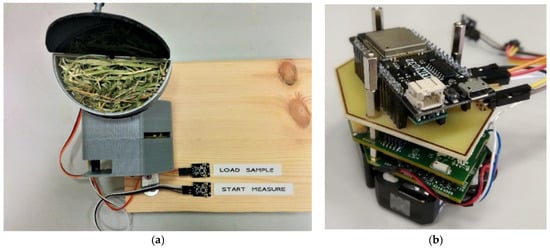
Figure 2.
Measurement system with (a) a whole sample, and (b) a microcontroller board attached over the spectrometer module.
2.3. Forage Samples
For this study, a calibration set of 57 samples of hay or dehydrated alfalfa collected in the north of Spain was utilized. Approximately 200 g of alfalfa was collected during the sampling procedure, to be analyzed using miniaturized NIRs. Prior to the collection of the raw scans, the samples were homogenized. After that, the alfalfa samples were milled, using a domestic spice mill (which is cheap and easy to use), and re-scanned in their ground form. This type of mill does not allow mesh-size setting. The variability associated with this factor appears in the collected spectra, and also in the chemometric results. This is because all spectroscopic information is considered when developing calibrations.
When the NIR analysis was complete, the quality of the alfalfa samples, based on animal feed requirements, was characterized, according to their nutritive value parameters. This was done using laboratory reference procedures. A Van Soest analysis [] was performed on the neutral detergent fiber (NDF), a gravimetric analysis was conducted on the mineral content (MC), and a Kjeldahl analysis was conducted on the crude protein (CP). The CP and NDF are two of the critical parameters for classifying alfalfa quality. CP values of 19% or higher, combined with crude fiber values of 29% or lower, are related to good forage quality []. Table 2 summarizes the statistics for the nutritive parameters of all the samples involved in this study. It includes the range and variability in each analyzed parameter. Appendix A includes the individual values for each alfalfa sample included in this study.
Table 2.
Statistics for the nutritive value of the alfalfa samples (N = 57).
2.4. Spectral Acquisition
Spectral acquisition requires a scan configuration (see Figure 3). Texas Instruments provides two different scan configurations within the "Factory” settings: “Column” and “Hadamard”.
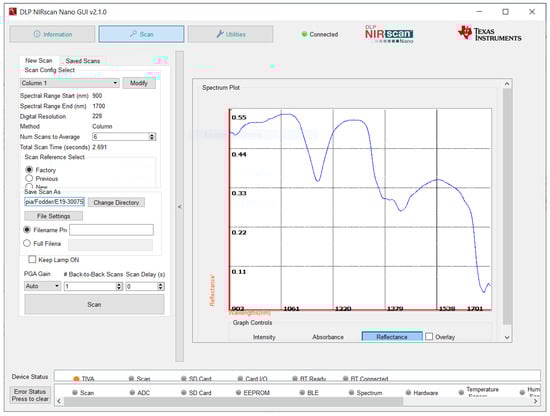
Figure 3.
NIRscan Nano GUI scan screen (reflectance signal).
Column scanning selects wavelengths one at a time. With Hadamard scanning, several wavelengths are multiplexed at a time, and the wavelengths are decoded individually. Hadamard scanning collects light, and offers a higher SNR, but it depends heavily on the spectrum being measured, and on the measurement system []. Column analysis is more effective for analyzing forage samples, because it is more accurate than other methods of analysis, due to its reproducibility.
Before scan collection, one to five sections can be configured, depending on the type of method (Column or Hadamard), the spectral range (the starting wavelength and ending wavelength), the digital resolution (the wavelength points captured within the defined spectral range) the exposure time (between 0.635 and 60.960 milliseconds), and the number of scans per sample (in this work, 10 scans at 10 different points in the sample).
In this work, all samples were scanned in reflectance mode, using the measurement system shown in Figure 2.
In order to increase the sampling window and improve the spectroscopic information for each sample, after the alfalfa samples were homogenized, each was divided into three subsamples and scanned using miniaturized NIRs. Each spectrum is an average of 10 spectra, in a wavelength range between 901 and 1700 nm, with a non-linear path wavelength between 2.9 and 3.9 nm. A total of 30 scans were collected for each alfalfa sample. The precision of the collected spectrum for each sample or signal reproducibility was evaluated for the raw and ground alfalfa. The statistic of the root-mean-square error (RMSE) was calculated. Using (1), it is possible to calculate the RMSE for each sample spectrum. Lower RMSE values are related to reproducible and repeatable spectra.
- = log 1/R to λ for the average spectrum resulting from averaging a number of scans, and R is reflectance.
- = log 1/R to λ for the average spectrum resulting from averaging b number of scans
- = number of spectral data
2.5. Spectral Data Processing
To establish a calibration model to quantify alfalfa nutritive parameters, different chemometric strategies were assayed. The software Unscrambler X version 10.4 was employed to find the linear correlation between the NIRS spectra and nutritive parameters. This software takes NIRS spectra and transforms them into a matrix with X and Y variables, defined as the wavelength and reflectance. To detect potential spectral outliers, a principal component analysis was performed on the calibration set, before regression models were constructed using partial least squares (PLSs) []. An optimal number of PLSs factors is determined using the Unscrambler X software version 10.4 package, based on the minimum residual variance and 20 segments. Different spectrum mathematical pretreatment strategies were used for NDF, MC, and CP quantification. These approaches were performed using both the full range of equipment, from 900 to 1700 nm, and a reduced one, from 900 to 1600 nm.
To establish a successful model, a combination of pretreatments, including scatter correction with the standard normal variate (SNV), and the first and second Savitzky–Golay derivatives (SG), were tested in this study. Six possible pre-treatments were developed for three parameters, studying two possible wavelength ranges, for both the raw and milled samples. A total of 72 mathematical pre-treatments were assayed.
For the evaluation and selection of the most suitable chemometric model, the following statistics were calculated: the coefficient of determination for calibration (R2, see Equation (2)), and the standard error of calibration (SEC, see Equation (3)) [].
are the reference values obtained in the laboratory, is the prediction of the model, and n represents the number of samples used in the calibration set.
This parameter provides an average of the typical uncertainty for future sample prediction based on the and values for the ith sample.
For each parameter evaluated, the best mathematical pre-treatment was selected for the raw and ground NIR sample analysis. The criteria for the selection of these pre-treatments were based on the lowest values of calibration standard error (SEC), as well as the values closest to one for the calibration determination coefficients (R2) [].
3. Results and Discussion
For an NIRS procedure to be understood, the characterization of the spectrum data obtained using the NIRscan Nano prototype is essential. Figure 4 shows the raw and SNV spectra, plus the first Savitzky–Golay derivative spectra of the alfalfa samples included in the calibration procedure. Within the NIR wavelength range of the NIRscan Nano prototype, we can identify some characteristic bands of forages. According to the bibliography, those bands observed at 1166 nm are related to the protein content of the samples [], and those observed at around 1350 nm are related to the fiber content []. Additionally, around 1400 nm, there is a band that can give information about the moisture content because, at that wavelength, OH bond overtone vibrations are observed []. In Figure 4 and Figure 5, a rectangle highlights all the cited wavelengths, and the referenced respective parameters. Hence, in Figure 4b, which is an extended area between 1650 and 1700 nm of Figure 4a, we can observe that some of the collected spectra show a noisy signal at the end of the collected spectra. This noisy wavelength range, as shown in Figure 4c, can be minimized after scattering correction (SNV) is applied, along with other mathematical pretreatments, such as derivatives.
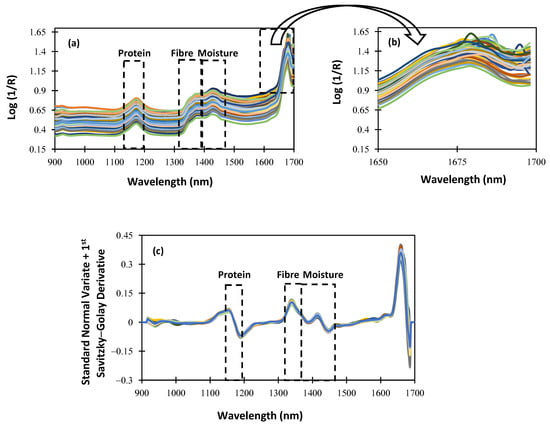
Figure 4.
Spectra of the whole samples: (a) raw spectra; (b) extended area from 1650 to 1700 nm; (c) standard normal variate + first Savitzky–Golay derivative pretreatment.
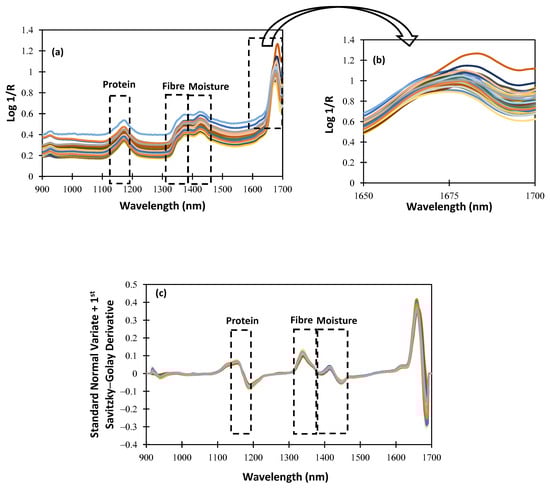
Figure 5.
Spectra of the ground samples: (a) raw spectra; (b) extended area from 1650 to 1700 nm; (c) standard normal variate + first Savitzky–Golay derivative pretreatment.
To evaluate the effect of the sample pretreatment on the spectral data set, ground samples were scanned using NIRscan Nano. Figure 5a shows the spectral data set. As can be seen, no differences in the representative bands are observed. Moreover, the extended wavelength range (1650–1700 nm; see Figure 4b and Figure 5b) shows that, after milling the sample pre-treatment, the noisy wavelength range disappears. These data confirm that the spectral quality depends on the sampling procedure (raw or ground). This distorted wavelength range is due to the huge and non-homogeneous particle size of the alfalfa samples. It is worthy of mention that, after the application of mathematical pretreatments, no differences were observed in the collected spectra of the alfalfa samples (see Figure 4c and Figure 5c).
As observed in Figure 4 and Figure 5, between 1600 and 1700 nm, the absorbance increases, and the SNR is lower than in other ranges. It is because the intensity measured at the detector is proportional to the number of DMD mirrors positioned to reflect the incident illumination towards it. As the number of pixels changes, the measured intensity is affected as well, resulting in an increase in noise levels.
Once the spectra were evaluated, the precision of the subsampling procedure for each scanned sample (raw and ground alfalfa) was evaluated []. Five samples were randomly selected from the 57 analysed. The RMS value was calculated for both the intact and ground samples with the two ranges proposed (901–1700 nm and 901–1600 nm). The results are shown in Table 3.
Table 3.
The root-mean-square error (RMS) values for the paired subsamples of the same scanned sample.
Once the values have been calculated, two clear trends can be observed. As expected, the RMS values obtained for the intact samples (raw) are higher than those obtained for the ground ones. These results could be due to heterogeneity in the raw alfalfa. The difference was also significant when the entire spectrum was compared or the last 100 nm was suppressed. Table 3 shows that the RMS values ranging from 900 to 1600 nm are lower than the full range of values. These results highlight the influence of the sampling procedure on the spectrum data precision.
After characterizing the spectral signal, the next step was to develop a calibration model. To attempt calibration, it is necessary to build a data matrix including nutritive values (the NDF, MC, and CP) and spectral data. After that, prior to the carrying out of calibrations, as mentioned in the Material and Methods section, different mathematical pre-treatments were applied, for the three parameters, to the raw and ground samples, both for the full range and the reduced range. Partial-least-square regression is used to establish the correlation between the spectra and the assayed parameters.
Table 4 summarizes the NIRS models’ calibration statistics to quantify the NDF. As can be seen in Table 4, the R2 values are higher and the SEC values are lower in the chemometric models developed with the reduced wavelength range than in those developed using the full one. In relation to the variability in the results depending on the mathematical pretreatment, it is important to note that the SNV plus the second Savitzky–Golay derivative reached the best calibration statistics for the raw and ground samples. Previous authors [], after evaluating different commercial portable NIRS instruments to analyze ground forages, obtained R2 values for the NDF ranging between 0.95 and 0.71, depending on the instrumentation employed. Regarding the SEC values, their results were between 2.85 and 1.21. It is not possible to obtain SEC values lower than 1, because the standard error of the laboratory (SEL) for this parameter is higher than 1.3 [].
Table 4.
Calibration statistics of NIR multivariate models for neutral detergent fiber quantification.
Table 5 summarizes the calibration statistics for the CP. Most mathematical treatments reach R2 values lower than 0.5 for raw alfalfa samples. This could be related to the heterogeneity in alfalfa forage, with two clearly different parts, the leaf and the stem. The leaf is the part of the plant that contains a protein fraction. However, it is important to remark that using the reduced range, the spectrum mathematical pretreatment of the SNV for the scatter correction, and the second Savitzky–Golay derivative (the same mathematical pretreatment as for the NDF), R2 values of 0.885, with an SEC of 0.377, were achieved. A typical SEL for reference CP analysis is around 0.210 [].
Table 5.
Calibration statistics of NIR multivariate models for crude protein quantification.
Based on the ground samples, and a reduced range (901–1600 nm), the developed models showed statistics around 0.7 or higher, with SEC values between 0.530 and 0.986. Considering these results, it is worth mentioning that, even though the homogeneity in the ground samples gives better calibration statistics, NIRscan Nano reached acceptable values when scanning the raw samples.
Feeding animals with minerals is a common practice; however, if there is an abnormal mineral content, there is a high probability of contamination with soil, which is not desirable in animal feeding systems. To quantify the MC in alfalfa forages, 24 different calibration models have been developed, assaying different mathematical pretreatments of spectrum data. The statistics of the proposed PLS models are shown in Table 6. As stated before, the reduced range gave better calibration statistics than the full one. Comparing mathematical pretreatments, the scatter correction applied after the derivatization procedure increased the R2 values, and reduced the SEC. The highest R2 and the lowest SEC values were 0.861/0.219 and 0.867/0.318 for the raw and ground samples, respectively.
Table 6.
The calibration statistics of the mineral content multivariate models.
These NDF, CP, and MC calibration model statistics, obtained using the NIRS measurement system, are like those acquired via commercial portable instruments, using a wavelength range like that evaluated in this work [,]. The SEC values are in accordance with laboratory results, and the effect of the sampling procedure has been studied comparatively in this work. As a summary of the obtained results, Table 7 selects the best models obtained for each sampling procedure (raw or ground alfalfa) and parameter. As can be seen, the second derivative is the best of the assayed pretreatments that provide satisfactory results for the nutritive value quantification.
Table 7.
Statistical analysis of alfalfa nutritive values (N = 57).
4. Conclusions and Future Work
In this work, heterogeneous forage (alfalfa) has been selected as a model to evaluate the precision of instrumental measures (spectra collected), and the effects of sampling presentation (raw or ground), on calibration statistics. The results have revealed that homogeneous forage samples (those milled) allow us to achieve better calibration models than those scanned in their raw form (heterogeneous). However, for all sampling procedures, it has been possible to obtain satisfactory calibration to quantify the nutritive parameters.
Through the proposed instrumentation, users can evaluate the forage quality, increase sampling without incurring costs, and obtain results in real time. This is done by avoiding delays related to carrying samples from the farm to the laboratory. Furthermore, this instrument does not require specialized training.
In the future, with the use of internet of things (IoT) tools, data can be sent to the cloud for processing. In this way, they would be accessible from any device. Thanks to storage and processing in the cloud, data are accessible from any site with internet access. This allows the use of data in decisions.
Author Contributions
Conceptualization, A.S., C.M. and J.M.C.-F.; methodology, A.S. and C.M.; validation, C.M. and A.L.; formal analysis, J.M.C.-F.; investigation, A.L.; resources, F.F., J.M.C.-F. and A.L.; data curation, F.F.; writing—original draft preparation, C.M. and F.F.; writing—review and editing, C.M., A.S., A.L. and F.F.; visualization, A.L. and F.F.; supervision, A.S.; funding acquisition, J.M.C.-F. All authors have read and agreed to the published version of the manuscript.
Funding
This research was funded by the Spanish Ministry of Science and Innovation (PID2020-117282RBI00 and MCI-20-PID2019-109698GB-I00) and by Principado de Asturias GRUPIN IDI/2021/000081.
Institutional Review Board Statement
Not applicable.
Informed Consent Statement
Not applicable.
Data Availability Statement
Not applicable.
Acknowledgments
We would like to thank Jairo Tuñón Díaz for his help scanning the samples.
Conflicts of Interest
The authors declare no conflict of interest.
Appendix A
| Alfalfa Sample Code | Mineral Content | Crude Protein | Neutral Detergent Fiber |
| 1 | 11.41 | 13.69 | 48.42 |
| 2 | 13.71 | 12.12 | 52.30 |
| 3 | 10.80 | 14.68 | 40.53 |
| 4 | 10.46 | 15.06 | 39.69 |
| 5 | 12.04 | 14.05 | 42.10 |
| 6 | 9.96 | 13.59 | 43.37 |
| 7 | 10.83 | 7.19 | 61.01 |
| 8 | 9.55 | 13.18 | 43.82 |
| 9 | 10.65 | 14.20 | 40.02 |
| 10 | 11.09 | 15.17 | 38.52 |
| 11 | 9.92 | 16.53 | 32.17 |
| 12 | 12.16 | 17.01 | 38.92 |
| 13 | 9.44 | 13.35 | 46.84 |
| 14 | 11.26 | 15.98 | 34.66 |
| 15 | 9.98 | 16.27 | 36.25 |
| 16 | 9.58 | 13.88 | 43.68 |
| 17 | 10.61 | 13.78 | 43.17 |
| 18 | 11.52 | 15.90 | 37.41 |
| 19 | 10.24 | 14.49 | 42.38 |
| 20 | 10.54 | 14.22 | 41.76 |
| 21 | 10.86 | 13.28 | 43.66 |
| 22 | 11.42 | 16.28 | 37.79 |
| 23 | 10.78 | 16.83 | 39.99 |
| 24 | 10.88 | 14.01 | 42.53 |
| 25 | 10.61 | 14.56 | 40.62 |
| 26 | 10.27 | 14.35 | 42.58 |
| 27 | 10.42 | 12.74 | 47.38 |
| 28 | 11.41 | 15.89 | 37.76 |
| 29 | 9.41 | 10.53 | 51.14 |
| 30 | 10.47 | 14.23 | 42.64 |
| 31 | 10.77 | 16.86 | 35.55 |
| 32 | 11.32 | 14.17 | 42.64 |
| 33 | 10.04 | 14.64 | 29.24 |
| 34 | 11.14 | 13.76 | 43.73 |
| 35 | 10.49 | 15.50 | 37.09 |
| 36 | 10.87 | 14.23 | 40.99 |
| 37 | 10.51 | 14.96 | 40.71 |
| 38 | 9.39 | 13.69 | 39.99 |
| 39 | 11.57 | 14.67 | 44.27 |
| 40 | 11.47 | 13.28 | 36.94 |
| 41 | 10.08 | 13.95 | 45.79 |
| 42 | 11.33 | 14.28 | 39.69 |
| 43 | 11.45 | 16.35 | 35.44 |
| 44 | 11.48 | 14.91 | 39.50 |
| 45 | 8.49 | 16.43 | 44.22 |
| 46 | 9.89 | 16.69 | 40.03 |
| 47 | 9.22 | 13.60 | 45.70 |
| 48 | 8.47 | 14.17 | 31.49 |
| 49 | 10.95 | 16.65 | 31.44 |
| 50 | 9.40 | 13.87 | 35.89 |
| 51 | 11.15 | 15.85 | 36.56 |
| 52 | 11.86 | 16.42 | 33.51 |
| 53 | 10.56 | 14.50 | 39.19 |
| 54 | 10.79 | 14.69 | 36.60 |
| 55 | 10.46 | 14.40 | 36.64 |
| 56 | 10.35 | 10.82 | 47.84 |
| 57 | 10.67 | 15.13 | 36.26 |
| Average | 10.64 | 14.48 | 40.70 |
| Maximum | 13.71 | 17.01 | 61.01 |
| Minimum | 8.47 | 7.19 | 29.24 |
| Standard Deviation | 0.91 | 1.70 | 5.50 |
References
- Food and Agricultural Organization of the United Nations. Available online: https://www.google.com.hk/url?sa=t&rct=j&q=&esrc=s&source=web&cd=&cad=rja&uact=8&ved=2ahUKEwiuhcH6iNuAAxW34DgGHanIAWMQFnoECB0QAQ&url=https%3A%2F%2Fwww.fao.org%2Fabout%2Fen%2F&usg=AOvVaw2ikccPM_zDoInRJYBZakYo&opi=89978449 (accessed on 4 August 2023).
- FAO. The Feed Analysis Laboratory: Establishment and Quality Control; FAO: Rome, Italy, 2013; Available online: https://www.fao.org/3/i3535e/i3535e.pdf (accessed on 4 August 2023).
- Prache, S.; Adamiec, C.T.; Astruc, E.; Baéza-Campone, P.E.; Bouillot, A.; Clinquart, C.; Feidt, E.; Fourat, J.; Gautron, A.; Girard, L.; et al. Review: Quality of animal-source foods. Animal 2022, 16, 100376. [Google Scholar] [CrossRef] [PubMed]
- Katoch, R. Forage Quality Indices. In Techniques in Forage Quality Analysis; Springer: Singapore, 2023. [Google Scholar]
- Ozaki, Y.; Huck, C.W.; Tsuchikawa, S.; Engelsen, S.B. (Eds.) Near-Infrared Spectroscopy; Springer: Singapore, 2021. [Google Scholar]
- Huck, C.W.; Beć, K.B.; Grabska, J. Near infrared spectroscopy in natural product research. In Encyclopedia of Analytical Chemistry: Applications, Theory and Instrumentation; Meyers, R.A., Ed.; John Wiley & Sons: Hoboken, NJ, USA, 2020; pp. 1–29. [Google Scholar]
- Shenk, J.S.; Workman, J.J.; Westerhaus, M.O. Application of NIR spectroscopy to agricultural products. In Handbook of Near Infrared Analysis; Burns, D.A., Ciurczak, E.W., Eds.; CRC Press: Boca Raton, FL, USA, 2008; pp. 347–387. [Google Scholar]
- Cherney, J.H.; Digman, M.F.; Cherney, D.J. Handheld NIRS for forage evaluation. Comput. Electron. Agric. 2021, 190, 106469. [Google Scholar] [CrossRef]
- Crocombe, R.A. Portable spectroscopy. App. Spectr. 2018, 72, 1701–1751. [Google Scholar] [CrossRef] [PubMed]
- Beć, K.B.; Grabska, J.; Huck, C.W. Miniaturized NIR Spectroscopy in Food Analysis and Quality Control: Promises, Challenges, and Perspectives. Foods 2022, 11, 1465. [Google Scholar] [CrossRef] [PubMed]
- Mizik, T. How can precision farming work on a small scale? A systematic literature review. Precis. Agric. 2023, 24, 384–406. [Google Scholar] [CrossRef]
- Melendreras, C.; Soldado, A.; Costa-Fernández, J.M.; López, A.; Valledor, M.; Campo, J.C.; Ferrero, F.J. An affordable NIR spectroscopic system for fraud detection in olive oil. Sensors 2023, 23, 1728. [Google Scholar] [CrossRef] [PubMed]
- Texas Instruments. DLP NIRscan™ Nano EVM User´s Guide. 2017. Available online: https://www.ti.com/lit/pdf/dlpu030 (accessed on 2 January 2023).
- Van-Soest, P.J.; Robertson, J.B.; Lewis, B.A. Methods for dietary fiber, neutral detergent fiber, and nonstarch polysaccharides in relation to animal nutrition. J. Dairy Sci. 1991, 74, 3583–3597. [Google Scholar] [CrossRef] [PubMed]
- Thompson, M.; Wood, R. Using uncertainty functions to predict and specify the performance of analytical methods. Accred. Qual. Assur. 2006, 10, 471–478. [Google Scholar] [CrossRef]
- Xu, J.; Liu, H.; Lin, C.; Sun, Q. SNR analysis and Hadamard mask modification of DMD Hadamard transform near-infrared spectrometer. Opt. Commun. 2017, 383, 250–254. [Google Scholar] [CrossRef]
- Lacefield, G.D. Alfalfa Hay Quality Makes the Difference. In Agriculture and Natural Resources; University of Kentucky UKnowledge, Agriculture and Natural Resources Publications: Lexington, KY, USA, 1988; p. 32. [Google Scholar]
- Rego, G.; Ferrero, F.; Valledor, M.; Campo, J.C.; Forcada, S.; Royo, L.J.; Soldado, A. A portable IoT NIR spectroscopic system to analyze the quality of dairy farm forage. Comput. Electron. Agric. 2020, 175, 105578. [Google Scholar] [CrossRef]
- Coelho, M.H.; Hembry, F.G. Laboratory methods of forage evaluation. Near infrared reflectance analysis. Livest. Prod. Day Rep. La. Agric. Exp. Stn. Anim. Sci. Dep. 1982, 3, 195–199. [Google Scholar]
- Andrés, S.; Murray, I.; Calleja, A.; Giráldez, F.J. Nutritive Evaluation of Forages by near Infrared Reflectance Spectroscopy. J. Near Infrared Spectrosc. 2005, 13, 301–311. [Google Scholar] [CrossRef]
- Martínez, M.L.; Garrido-Varo, A.; Pedro, E.D.; Sánchez, L. Effect of sample heterogeneity on near infrared meat analysis: The use of the RMS statistic. J. Near Infrared Spectrosc. 1998, 6, A313–A320. [Google Scholar] [CrossRef]
- Berzaghi, P.; Cherney, J.H.; Casler, M.D. Prediction performance of portable near infrared reflectance instruments using preprocessed dried, ground forage samples. Comput. Electron. Agric. 2021, 182, 106013. [Google Scholar] [CrossRef]
- Gorla, G.; Taiana, A.; Boqué, R.; Bani, P.; Gachiuta, O.; Giussani, B. Unravelling error sources in miniaturized NIR spectroscopic measurements: The case study of forages. Anal. Chim. Acta 2022, 1211, 339900. [Google Scholar] [PubMed]
Disclaimer/Publisher’s Note: The statements, opinions and data contained in all publications are solely those of the individual author(s) and contributor(s) and not of MDPI and/or the editor(s). MDPI and/or the editor(s) disclaim responsibility for any injury to people or property resulting from any ideas, methods, instructions or products referred to in the content. |
© 2023 by the authors. Licensee MDPI, Basel, Switzerland. This article is an open access article distributed under the terms and conditions of the Creative Commons Attribution (CC BY) license (https://creativecommons.org/licenses/by/4.0/).