Article

Cytotoxic Effect of L-Methioninase from Brevibacterium linens BL2 in Combination with Etoposide against Glioblastoma Cells

by
Semih Latif İpek
1,
Meryem Damla Özdemir
2 and
Dilek Göktürk
2,*
1
Department of Food Engineering, Adana Alparslan Türkeş Science and Technology University, 01250 Adana, Türkiye
2
Department of Bioengineering, Adana Alparslan Türkeş Science and Technology University, 01250 Adana, Türkiye
*
Author to whom correspondence should be addressed.
Appl. Sci. 2023, 13(16), 9382; https://doi.org/10.3390/app13169382
Submission received: 3 July 2023 / Revised: 1 August 2023 / Accepted: 15 August 2023 / Published: 18 August 2023
(This article belongs to the Section Applied Biosciences and Bioengineering)

Abstract

:
L-methioninase degrades methionine, which is essential in methionine-dependent cancer cells, resulting in specific cell death. Normal cells can synthesize their own methionine amino acids even in the absence of exogenous methionine. This selective targeting of cancer cells makes L-methioninase a promising therapeutic candidate for cancer. In this study, L-methioninase was partially purified from Brevibacterium linens BL2. The specific activity of the enzyme was found as 3.055 units/mg. IC50 values (24 h) of the enzyme were 5.792 units/mL for U87MG cell line and 5.215 units/mL for T98G cell line. When L-methioninase and etoposide were used in combination, synergistic cytotoxic and cell migration inhibition effects on U87MG and T98G cells alongside decreased cytotoxic activity on the Mouse Embryonic Fibroblast and HaCaT cells compared to etoposide alone were observed. Additionally, colony numbers of U87MG cells were significantly reduced by L-methioninase and etoposide administration after 21 days of incubation. Furthermore, L-methioninase suppressed the expression levels of survivin and c-Myc while increasing the expression level of Caspase-3 in both glioblastoma cell lines. These effects were enhanced when etoposide was used in combination with etoposide. This investigation reveals that the L-methioninase enzyme not only exhibited cytotoxic effects on U87MG and T98G cells but also enhanced the anti-proliferative effects of etoposide when used in combination while also demonstrating fewer adverse effects on normal cells.

1. Introduction

Each year, millions of individuals face the devastating impact of cancer, whether through cancer-related deaths or the difficulties associated with treatment. In addition to the financial burden of cancer treatment, there is a need for the development of new drugs and improvements in existing drugs owing to factors such as drug resistance observed in various types of cancer. Methionine plays a vital role in protein synthesis, methylation, and cellular functions. Unlike normal cells, cancer cells rely heavily on external methionine sources for survival owing to their altered metabolic pathways [1]. Studies have shown that under conditions of methionine deficiency, normal human cells are capable of maintaining their cell cycle in the presence of homocysteine, whereas methionine deficiency leads to the death of cancer cells. This is because normal cells have the metabolic ability to convert homocysteine to methionine, whereas most cancer cells do not have this mechanism. Consequently, while normal cells can function independently of methionine, the reliance of the majority of cancer cells on exogenous methionine is known as methionine dependence. Exploiting this reliance, targeting methionine metabolism is a promising therapeutic strategy [2,3,4]. The enzymatic breakdown of methionine using L-methioninase offers a potential treatment approach that induces methionine starvation in cancer cells and provides an alternative avenue for cancer treatment [5,6,7].
L-methioninase (E.C.4.4.1.11), also known as methionine-gamma-lyase, methioninase, methionine lyase, and methionine demethylase, has gained attention as a potential therapeutic agent against various cancer types. By degrading the amino acid methionine, which is essential for cancer cell growth and survival, it exhibits selective cytotoxicity toward methionine-dependent cancer cells while potentially sparing healthy cells [8,9,10]. Additionally, L-methioninase can enhance the antiproliferative effects of chemotherapeutic drugs, potentially leading to shorter treatment periods for patients [11].
The anticancer effect of L-methioninase was first observed in 1973 when the enzyme derived from Clostridium sporogenes was found to effectively inhibit the growth of Walker carcinosarcoma cells in mice [12]. L-methioninase enzymes are found in numerous bacteria, fungi, and yeast. One of the known sources of L-methionine is the Brevibacterium linens BL2 strain. It is a Gram-positive bacterium commonly found on limburger cheeses, contributing to cheese flavor by producing sulfur compounds such as methanethiol [13,14,15,16,17]. Brevibacterium linens BL2, also known as Brevibacterium aurantiacum ATCC® 9175, is commercially sold as a SWING BL-2 by Chr. Hansen Company (Hoersholm, Denmark) was used for cheese ripening. A study investigated the anticancer properties of recombinant L-methioninase from Brevibacterium linens BL2 on HT29, SKOV3, JURKAT, and REH human cancer cell lines, revealing induced cytotoxicity in these cancer cells [18].
Glioblastoma is a highly malignant brain tumor that originates from glial cells and is characterized by aggressive growth and poor prognosis. Glioblastoma tumors, which are composed of various glial cell types, can create their own blood supply, thereby facilitating invasive growth. With limited treatment options, the survival rate of patients with glioblastoma is typically low, highlighting the need for new therapeutic strategies. Glioma cells often exhibit increased methionine consumption and dependency, making methionine a potential therapeutic target [19,20,21]. DNA topoisomerases are vital enzymes that are responsible for regulating the structure of genetic material by inducing temporary breaks in DNA molecules. They play crucial roles in essential biological processes, such as DNA replication, transcription, repair, and chromatin remodeling. Topoisomerases are categorized as type I or type II. Topoisomerase type II (TopoII) is involved in the formation of double-strand breaks. In the field of cancer treatment, etoposide is a widely utilized chemotherapeutic agent that targets TopoII activities, inhibits the rejoining of DNA, and thereby affects various aspects of cell metabolism. Beyond its impact on TopoII, Etoposide also displays a strong affinity for chromatin and histones, suggesting that these components could potentially serve as additional drug targets [22].
However, etoposide has limitations that inhibit its use. One limitation of etoposide is the development of drug resistance in cancer cells. In addition, etoposide is known to have toxic side effects. It can affect healthy cells and tissues, leading to various adverse effects such as bone marrow suppression, gastrointestinal issues, and increased susceptibility to infections [23,24]. To overcome these limitations, researchers and clinicians are exploring different strategies, such as combination therapies.
In this study, L-methioninase was partially purified from the Brevibacterium linens BL2 strain and characterized. L-methioninase was applied to glioblastoma U87 MG and T98G cancer cells. The effect of this enzyme concurrent with etoposide was evaluated by neutral red cell viability tests, migration assays, colony formation assays, the RT-Qpcr analyses of Survivin, C-Myc, and Caspase 3 genes, DAPI, F-actin, and Giemsa staining methods.

2. Materials and Methods

2.1. Materials

The Brevibacterium linens BL2 strain was kindly donated by Chr. Hansen Company (Hoersholm, Denmark). The protein Ladder was purchased from BioLegend (San Diego, CA, USA). The phalloidin-iFluor™ 488 conjugate was purchased from Cayman Chemical Company (Ann Arbor, MI, USA). Dulbecco′s modified Eagle′s medium (DMEM), fetal bovine serumm and DNAse I were purchased from Thermo Fisher Scientific (Waltham, MA, USA). All other chemicals were purchased from Merck (Darmstadt, Germany). Milli-Q® Type I water (Merck, Darmstadt, Germany) was used in all experiments.

2.2. Methods

2.2.1. Bacterial Strain and Growth Conditions

Brevibacterium linens BL2 was grown in a sterile 500 mL Tryptic Soy Broth containing 0,1% methionine in two liters of Erlenmeyer flasks and was incubated for 36 h on an IKA 4000 incubation shaker (IKA, Berlin, Germany) at 250 rpm and 25 °C. The enzyme solution (10 mL) was partially purified from a 500 mL culture of Brevibacterium linens BL2, which was incubated for 36 h.

2.2.2. Partial Purification of L-Methioninase Enzyme

L-methioninase was partially purified according to the method described by Dias and Weimer in 1998 [13] with some minor modifications. Cells grown in flasks were harvested by centrifugation (6000× g for 15 min. at 4 °C) in a benchtop centrifuge (Hettich, Germany) and were washed twice with a 50 mM potassium phosphate buffer containing 2% ethanol, 0.02 mM prydoxal-5-phosphate (PLP), 1 mM EDTA, and 1 mM phenylmethylsulfonylfluoride (PMSF). The cell precipitate was resuspended in the same buffer using a vortex mixer. To lyase the cells, 1 mg/mL of lysozyme was added, and the cells were incubated at 37 °C for 1 h. Next, 0.25 µg/mL DNAse I was added and stirred at room temperature for 1 h. The cells were subjected to ultrasonic treatment for 4 min at 70% power for 5 cycles using an ultrasonic probe (Bandelin Sonoplus 2450, Bandelin electronic, Berlin, Germany) at 4 °C. After centrifugation (10,000× g, 1 h, 4 °C), the supernatant was decanted and considered as the crude enzyme for ammonium sulfate precipitation. Ammonium sulfate was gradually added to the crude enzyme using a magnetic stirrer (IKA, Germany) until 55% saturation was reached in an ice bath. After centrifugation (10,000× g, 20 min, 4 °C), the saturated solution was resuspended in a KP buffer containing EDTA, PLP, ethanol, and PMSF. The enzyme solution was then desalted using Amicon® Ultra-15 Centrifugal Filters (MWCO 30 kDa) at 4000× g and 4 °C in a centrifuge.

2.2.3. Enzyme Activity Assay

The 5,5-dithio-bis-2-nitrobenzoic acid (DTNB) method was employed to assess enzyme activity by measuring the number of free thiol groups [25]. The enzyme solution was mixed with 20 mM of L-methionine in phosphate-buffered saline (PBS) (pH: 7.2), 0.1 mM pyridoxal-5-phopsphate (PLP), and 0.25 mM (DTNB) at a final volume of 1 mL. The mixture was incubated for 1 h at 37 °C in an incubator (Memmert, Schwabach, Germany). Absorbance was measured at 420 nm using the Cary 60 UV-Vis spectrophotometer (Agilent, Santa Clara, CA, USA). The number of thiol groups was calculated from the standard curve of sodium methanethiolate. Enzyme activity was expressed as the amount of enzyme that released 1 µmol of free thiol per minute under optimal assay conditions, defined as L-methioninase activity.

2.2.4. Protein Content Analysis

The Bradford protein estimation protocol was used to determine the protein content of the enzyme solution [26,27]. In total, 50 µL of the enzyme solution was added to 2.5 mL of the Bradford protein solution and left for 5 min in a dark place. The absorbance of the blank cuvettes was measured at 595 nm using a UV-visible spectrophotometer (Agilent, USA). A standard curve was created using known amounts of bovine serum albumin (BSA) using the same protocol. The protein content of the enzyme solution was calculated using a standard curve.

2.2.5. SDS-PAGE Analysis

The protein profiles of the partially purified enzyme and crude enzyme were determined using SDS-PAGE analysis [28]. A 12% running gel and a 4% stacking gel were prepared separately. Gels were immediately placed in SDS-PAGE cassettes, and a Tris-glycine buffer was loaded onto the SDS-PAGE pool. Enzyme solutions (10 µL) were mixed with a 10 µL 2× loading buffer containing 4% Sodium Dodecyl Sulfate, 20% glycerol, 0.0004% bromophenol blue, 0.125 M Tris-HCl buffer (pH: 6.8), and 10% 2-mercaptaethanol. The loading solution was then heated at 95 °C for 10 min. The protein ladder and loading solution were placed in SDS-PAGE stacking gel wells. The Mini Protean Tetra Gel System (Bio-Rad, Hercules, CA, USA) was run at 60 V for at least two hours until all bands reached the bottom of the running gel. After the running process was complete, SDS-PAGE gels were gently removed and fixed with 40% methanol and a 10% acetic acid solution for 30 min. Gels were placed in a container filled with a Coomassie Blue staining solution and gently stirred for 4 h. The destaining process was performed, and images of the protein bands were observed using the Bio-Rad Chemidoc Touch (Bio-Rad, USA) image analysis system.

2.2.6. Cell Culture Conditions

The glioblastoma U87MG (ATCC® Manassas, VA, USA, HTB-14™) cell culture and the Human Keratinocyte Cell Line HaCaT (CLS 300493, DKFZ, Heidelberg, Germany) were grown in Dulbecco’s modified Eagle’s medium (DMEM) containing 10% fetal bovine serum (FBS). Mouse embryonic fibroblasts (ATCC® SCRC-1040™) were grown in DMEM containing 5% FBS and 55 µM 2-mercaptaethanol. The glioblastoma T98G [T98-G] (ATCC® CRL-1690™) cell line was grown in DMEM/F12 supplemented with 10% FBS. All the cell lines were incubated in a humidified incubator (Nüve EC 160, Nüve, Ankara, Türkiye) at 37 °C with a constant CO2 level of 5%.

2.2.7. Cell Viability Assay

The neutral red viability test was used to investigate the cytotoxic effects of substances on the cells. The neutral red test is a cell viability test that allows the in vitro quantification of cytotoxicity. This test is based on the ability of living cells to incorporate and bind the supravital dye when neutral red to lysosomes [29]. The viability assay conducted using a neutral red solution was based on the principle that living cells can absorb the neutral red dye, and the density of the absorbed dye was measured at 540 nm [30,31]. The nutrient medium used for the cells to be tested was withdrawn, and the neutral red solution (0.033%) in PBS was sufficient to cover the cell surface. The cells were then incubated for at least 2 h. At the end of the incubation period, the neutral red solution was withdrawn, and a neutral red dissolving solution (1% Acetic Acid, 49% ultra-pure H2O, 50% ethanol) was added. The solution was left in the shaker until a homogeneous color distribution was observed. The absorbance was measured at 540 nm using a microplate reader (Spectrostar Nano, BMG Labtech, Ortenberg, Germany).

2.2.8. Investigation of the Effect of L-Methioninase on Cancer Cells

The IC50 value, which represents the concentration of the L-methioninase enzyme required to induce a 50% reduction in cell viability or cause cell death, was determined. For this purpose, 5000 U87MG and T98G cells were seeded in each well of a 96-well cell plate and cultured in a humid incubator at 37 °C with 5% CO2. The cells were exposed to different concentrations of the L-methioninase enzyme solution (ranging from 0.88 to 4.44 units/mL) for 24 h. Cell viability was assessed using a neutral red assay to calculate the percentage viability at each concentration. The IC50 value, which represents the concentration that induces a 50% reduction in cell viability, was determined from the test results. L-methioninase was stored in the buffer. Therefore, the buffer was administered without the enzyme to the control group to eliminate the effect of the buffer on L-methioninase and etoposide cytotoxicity.
To assess the combined effect of L-methioninase and etoposide on U87MG and T98G cells, they were exposed to different treatments, including etoposide alone, L-methioninase + etoposide, and L-methioninase alone, for 24 and 48 h. The viability of these cells was measured using the neutral red assay to evaluate the combined effect of the determined IC50 value of the L-methioninase enzyme solution and the chemotherapy drug etoposide. Etoposide was used at a concentration of 40 µM, which was determined to be the IC50 value for U87MG cells in our previous study [32]. Etoposide was used at a concentration of 29 µM in the T98G cell line, which was determined as the IC50 value in the study performed by Sevim et al. [33].
Similar experiments were conducted on Mouse Embryonic Fibroblasts (MEF) and Human Keratinocyte HaCaT cells cultured for 48 h.

2.2.9. Migration Assay

The migratory effect of L-methioninase and etoposide on U87MG and T98G cells was assessed following the method described by Suarez-Arnedo et al. [34]. In this method, 2 × 10⁵ cells were seeded in 6 well plates. The following day, a “wound” was created in the cell monolayer by making a straight line using a 1 mm pipette, the culture medium containing the detached cells was removed, and the plates were washed with PBS. Different treatments were applied to the wells, including L-methioninase alone, etoposide alone, a combination of both, and the culture medium as a control. Etoposide was administered at a concentration of 40 µM to U87MG cells and 29 µM to T98G cells. L-methioninase was administered at concentrations of 5.792 units/mL for U87MG and 5.215 units/mL for T98G, which were their respective IC50 values. The plates were then incubated for 24 h. Cells were observed at 0, 8, and 24 h after treatment using an inverted microscope (Leica Biosystems, Wetzlar, Germany), and images of these cells were captured. ImageJ software (1.53t) was used to quantify the migration rate and wound closure based on the captured images.

2.2.10. Colony Formation Assay

A colony formation assay was performed to evaluate the colony formation ability of U87MG cells [35]. Glioblastoma U87MG cells were cultured in six-well plates, and four different conditions were applied to the cells: the control (no treatment), methioninase treatment, etoposide treatment, and a combination of methioninase and etoposide. Etoposide was administered at a concentration of 40 µM for U87MG cells, and L-methioninase was administered at a concentration of 5.792 units/mL, which corresponded to their respective IC50 values. After 24 h of incubation, 500 live cells were counted with a Neuber hemocytometer and seeded into six-well plates. The cells were incubated for 21 d at 37 °C in a humidified atmosphere containing 5% CO2 for colony formation. The cells were then fixed in 4% paraformaldehyde and stained with 2% crystal violet. Colonies were counted using a Leica EZ50 dissecting microscope (Leica Biosystems, Wetzlar, Germany).

2.2.11. Giemsa Staining

Giemsa staining is a histological staining method that enables the staining of chromatin, nuclear membranes, and some cellular components. The solution was then sterile-filtered through a 0.22-micron syringe filter. Glioblastoma U87MG and T98G cells were grown in six-well plates under four different conditions: the control (no treatment), methioninase treatment, etoposide treatment, and a combination of methioninase and etoposide. Etoposide was administered at a concentration of 40 µM for U87MG, 29 µM for T98G cells, and L-methioninase was administered at a concentration of 5.792 units/mL for U87MG and 5.215 units/mL in T98G cells, which were their respective IC50 values. After 24 h of incubation, the cell culture medium was removed, and the cells were washed twice with PBS. In total, 1 mL of 60% methanol in PBS was added to each well of a well plate and incubated for 10 min at room temperature. The solution was removed and washed with pure methanol. The Giemsa staining solution 1 mL (0.01 gr/mL) and Giemsa staining solution was added to each well and left for 20 min at room temperature. After incubation, the Giemsa staining solution was removed, and the cells were washed three times with distilled water. The cell morphology was observed using an LED-inverted microscope (Leica Biosystems, Wetzlar, Germany).

2.2.12. DAPI and F-Actin Staining

In this study, two fluorescent dyes, 4′,6-diamidino-2-phenylindole (DAPI), and phalloidin, were utilized to observe the viability and structural components of U87MG and T98G cells. DAPI is a fluorescent dye that binds specifically to adenine-thymine (AT)-rich regions of DNA within the cell’s nucleus. It enables researchers to visualize the nucleus and assess the viability of cells based on the integrity of their DNA. Phalloidin is a toxin derived from the death cap mushroom that has the ability to bind specifically to F-actin filaments. It stabilizes these filaments and allows for visualization with fluorescent conjugates. U87MG and T98G cells were grown in 24 well plates under four different conditions: the control (no treatment), methioninase treatment, etoposide treatment, and a combination of the methioninase and etoposide treatment. Etoposide was administered at a concentration of 40 µM for U87MG cells and 29 µM for T98G cells. L-methioninase was administered at a concentration of 5.792 units/mL for U87MG cells and 5.215 units/mL for T98G cells, which were their respective IC50 values. After 24 h of incubation, the cells were imaged. The cell culture medium was removed, and the cells were washed twice with PBS. Paraformaldehyde solution (4%) was added to each well and incubated for 20 min at room temperature. The cells were then washed twice with PBS. Next, PBS containing 0.1% Triton X-100 was added to the cells and left for 10 min to permeabilize the cell membranes. The cells were washed twice with PBS. The DAPI and phalloidin-iFluor ™ 488 conjugate was diluted in PBS containing 1% Bovine Serum Albumin (BSA) at a 1:1000 ratio. The staining solution was added to the wells and incubated for 30 min in the dark at room temperature to label the nuclei and F-actin filaments. The cells were then washed twice with PBS containing BSA. Finally, the cells were observed under fluorescent light using a Leica DM IL LED inverted microscope (Leica Biosystems, Wetzlar, Germany).

2.2.13. RNA Isolation and cDNA Synthesis

Glioblastoma U87MG and T98G cells were grown in 75 cm2 cell culture plates. Four different test groups were prepared in separate plates: the control (no treatment), methioninase treatment, etoposide treatment, and a combination of methioninase and etoposide by applying the IC50 values of etoposide and L-methioninase. RNA was isolated after 24 h of incubation. The samples were then incubated at 37 °C in 5% CO2 for 24 h. RNA isolation was conducted using the InvitrogenTM PureLinkTM RNA isolation kit (Thermo Fisher Scientific, USA) according to the manufacturer’s instructions. RNA isolates were used for cDNA synthesis using the Revertaid First Strand cDNA Synthesis Kit (Thermo Fisher Scientific, USA). cDNA was synthesized according to the manufacturer’s instructions. Thermal cycling was performed using a PCR thermal cycler (Agilent Sure cycler 8800, Agilent, Santa Clara, CA USA). The thermal cycling conditions were 25 °C for 10 min, 37 °C for 120 min, and 85 °C for 5 min. The quality and quantity of cDNA were tested using a NanodropTM 2000 spectrophotometer (Thermo Fisher Scientific, USA).

2.2.14. RT-qPCR Analysis

RT-qPCR analysis was performed using a Rotor-Gene Q qPCR device (Qiagen, Hilden, Germany). The reaction parameters were as follows: initial activation at 95 °C for 12 min, denaturation at 95 °C for 15 s, annealing at 55 °C for 20 s, and elongation at 72 °C for 20 s. The ΔCt values were obtained and normalized against the β-actin reference gene expression. The primers used in this study were as follows: 5-TCCACTGCCCCACTGAGAAC-3 (survivin forward primer), 5 -TGGCTCCCAGCCTTCCA-3 (survivin reverse primer), c-myc forward: 5′-TACCCTCTCAACGACAGCAG-3′; c-myc reverse: 5′-TCTTGACATTCTCCTCGG TG-3,’ Caspase 3 forward: 5′-TGACTGGAAAGCCGAAACTC-3′, Caspase 3 reverse: 5′- AGCCTCCACCGGTATCTTCT-3,’ Beta actin forward: 5′-GTGGACATCCGCAAAGAC -3′ and Beta β-actin reverse: 5′-AAAGGGTGTAACGCAACTA-3′.

2.2.15. Statistical Analysis

All experiments were conducted in triplicates. ANOVA and t-tests were used for the statistical evaluation of the results. The p-value was 0.001. Microsoft Excel was used for statistical analyses.

3. Results and Discussion

3.1. Enzyme Activity and Protein Content of Enzyme Solution

The specific activity of the partially purified methioninase enzyme was 3.055 U/mg. The total protein content in 10 mL of enzyme solution was measured to be 21.8 mg.

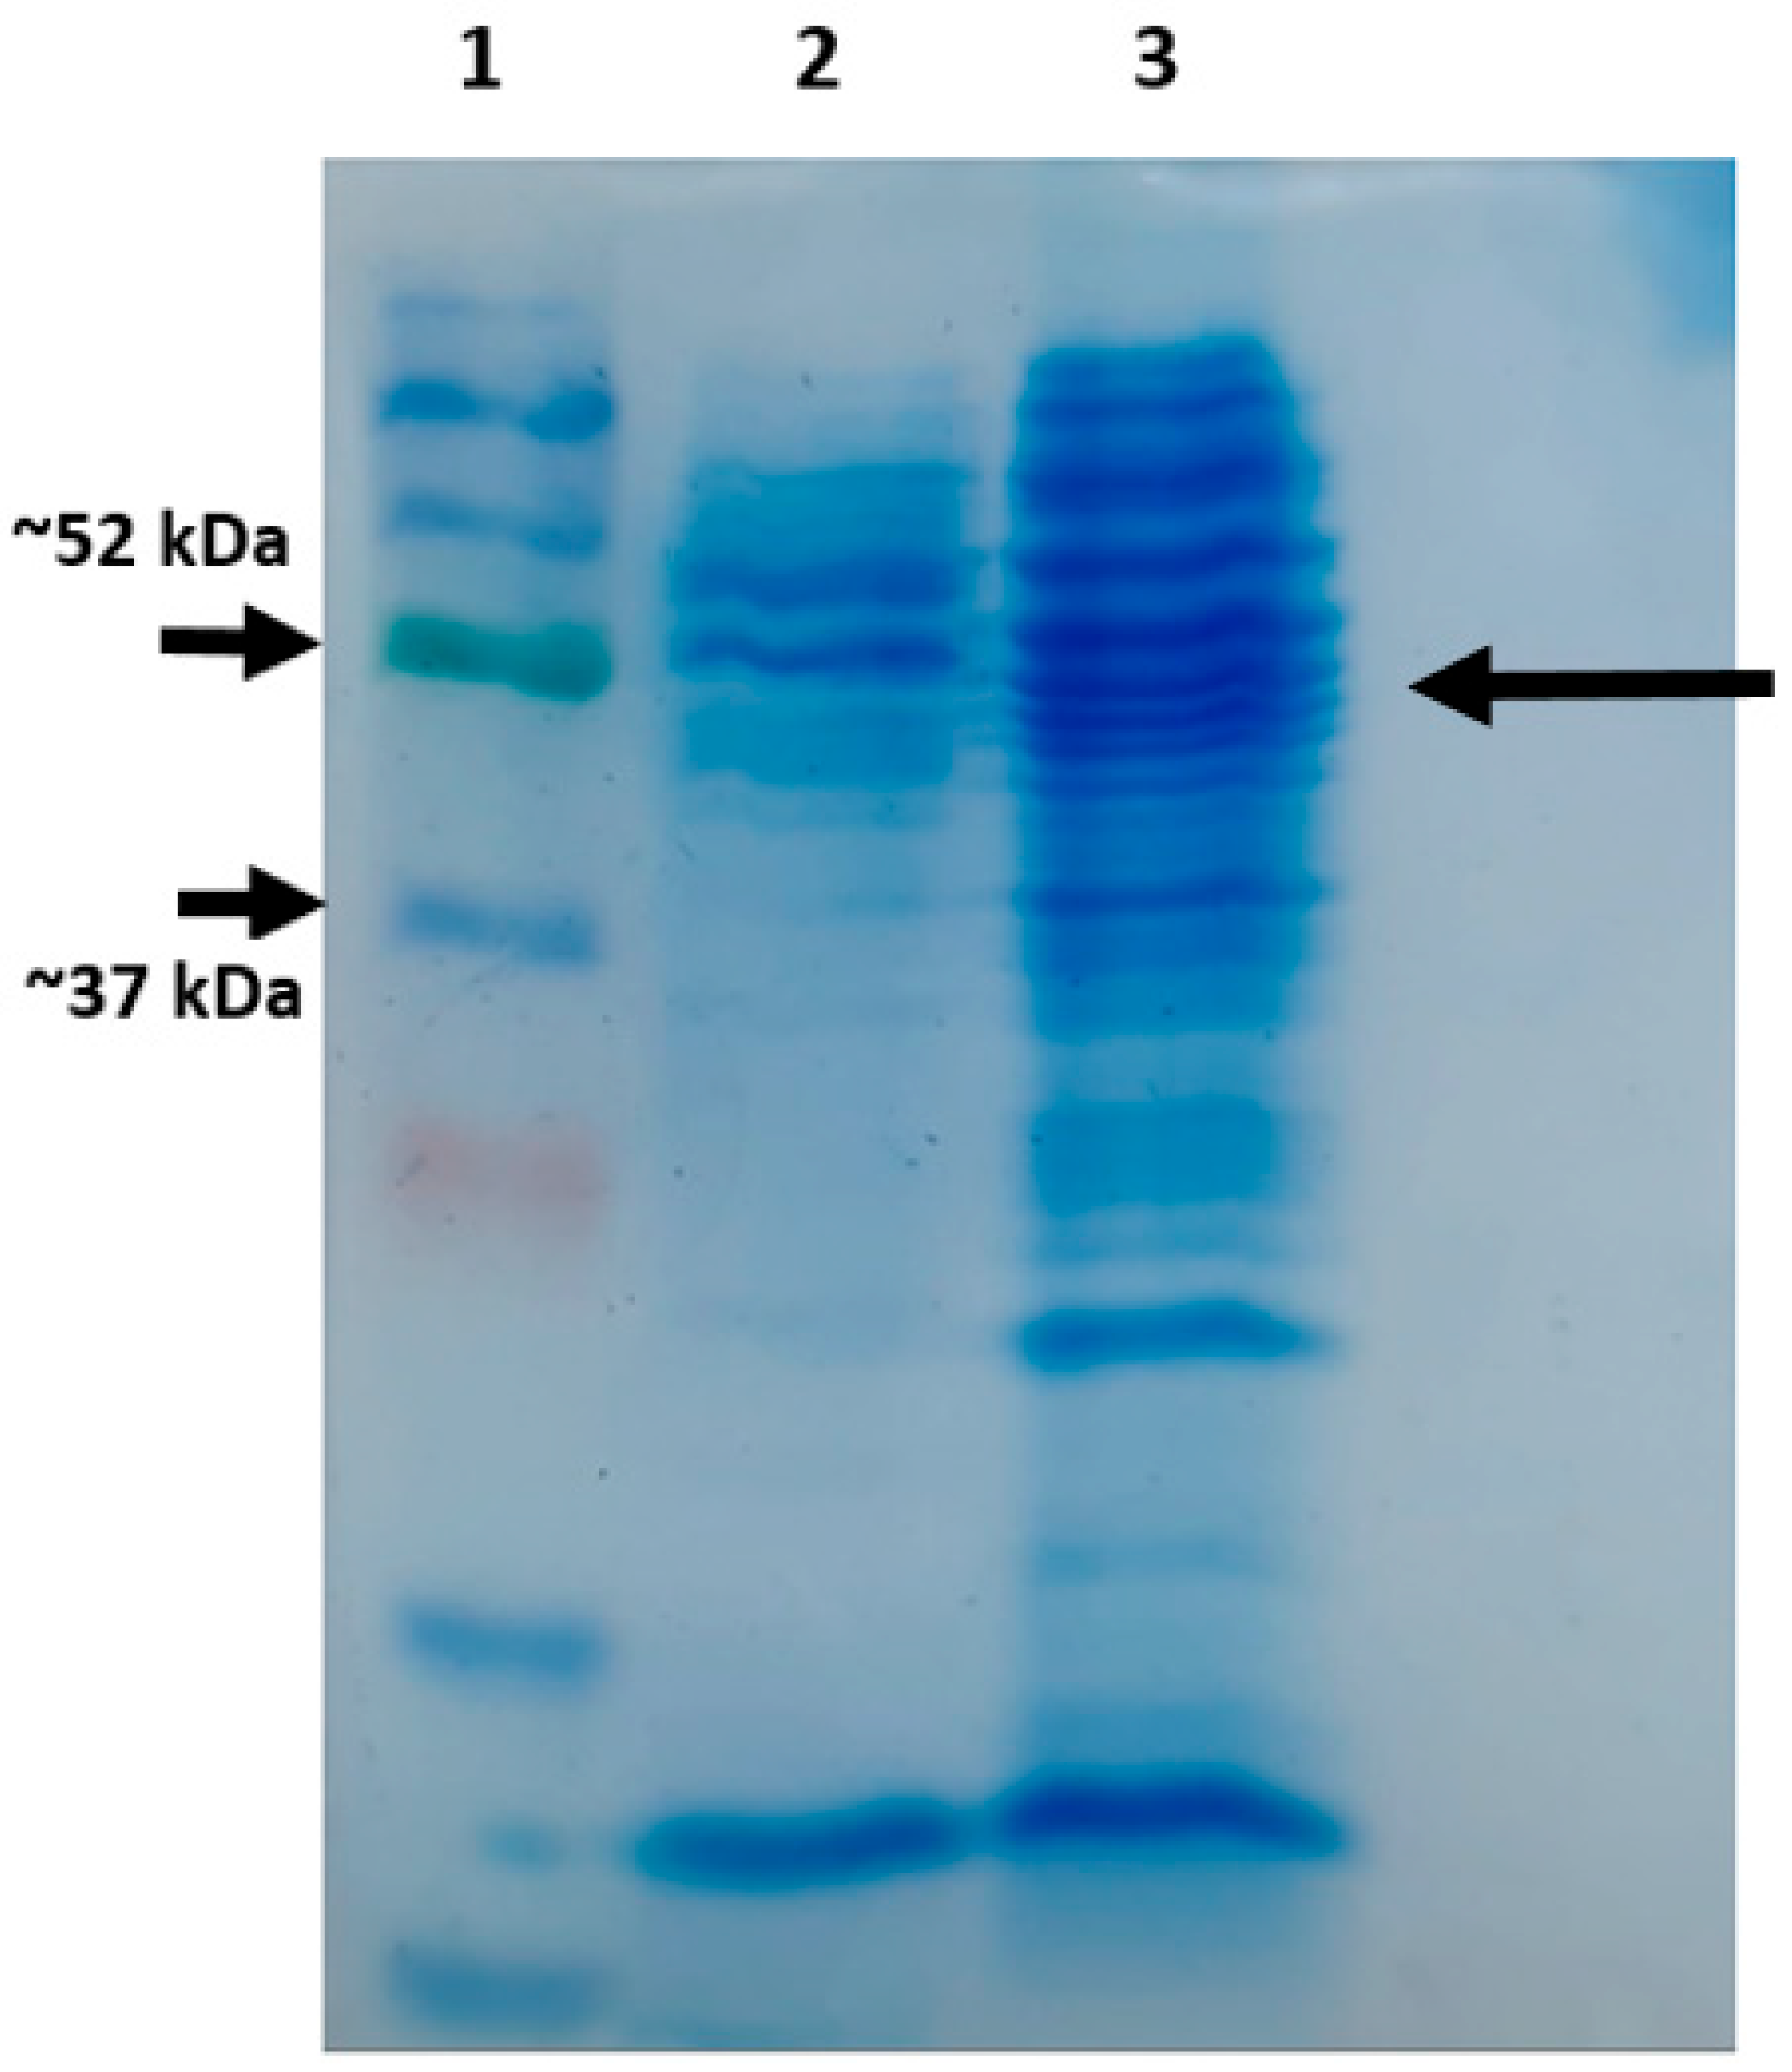
3.2. SDS-PAGE Analysis

According to the SDS-PAGE analysis depicted in Figure 1, intense protein bands were observed in the range of approximately 37–52 kDa. The molecular weight of L-methioninase has been reported to be 43 kDa [13].

3.3. IC50 Graph of L-Methioninase on Glioblastoma Cell Lines

The cytotoxic effect of L-methioninase from Brevibacterium linens BL2 was determined using a neutral red assay. The IC50 value of L-methioninase was determined to be 5.792 units/mL in a cell culture medium for the U87MG cell line and 5.215 units/mL for the T98G cell line (p < 0.001) (Figure 2 and Figure 3). An increase in the concentration of the L-methioninase enzyme resulted in a higher rate of cell death in glioblastoma U87MG and T98G cells. These results indicate that higher concentrations of L-methioninase led to increased efficacy in killing glioblastoma U87MG and T98G cells.

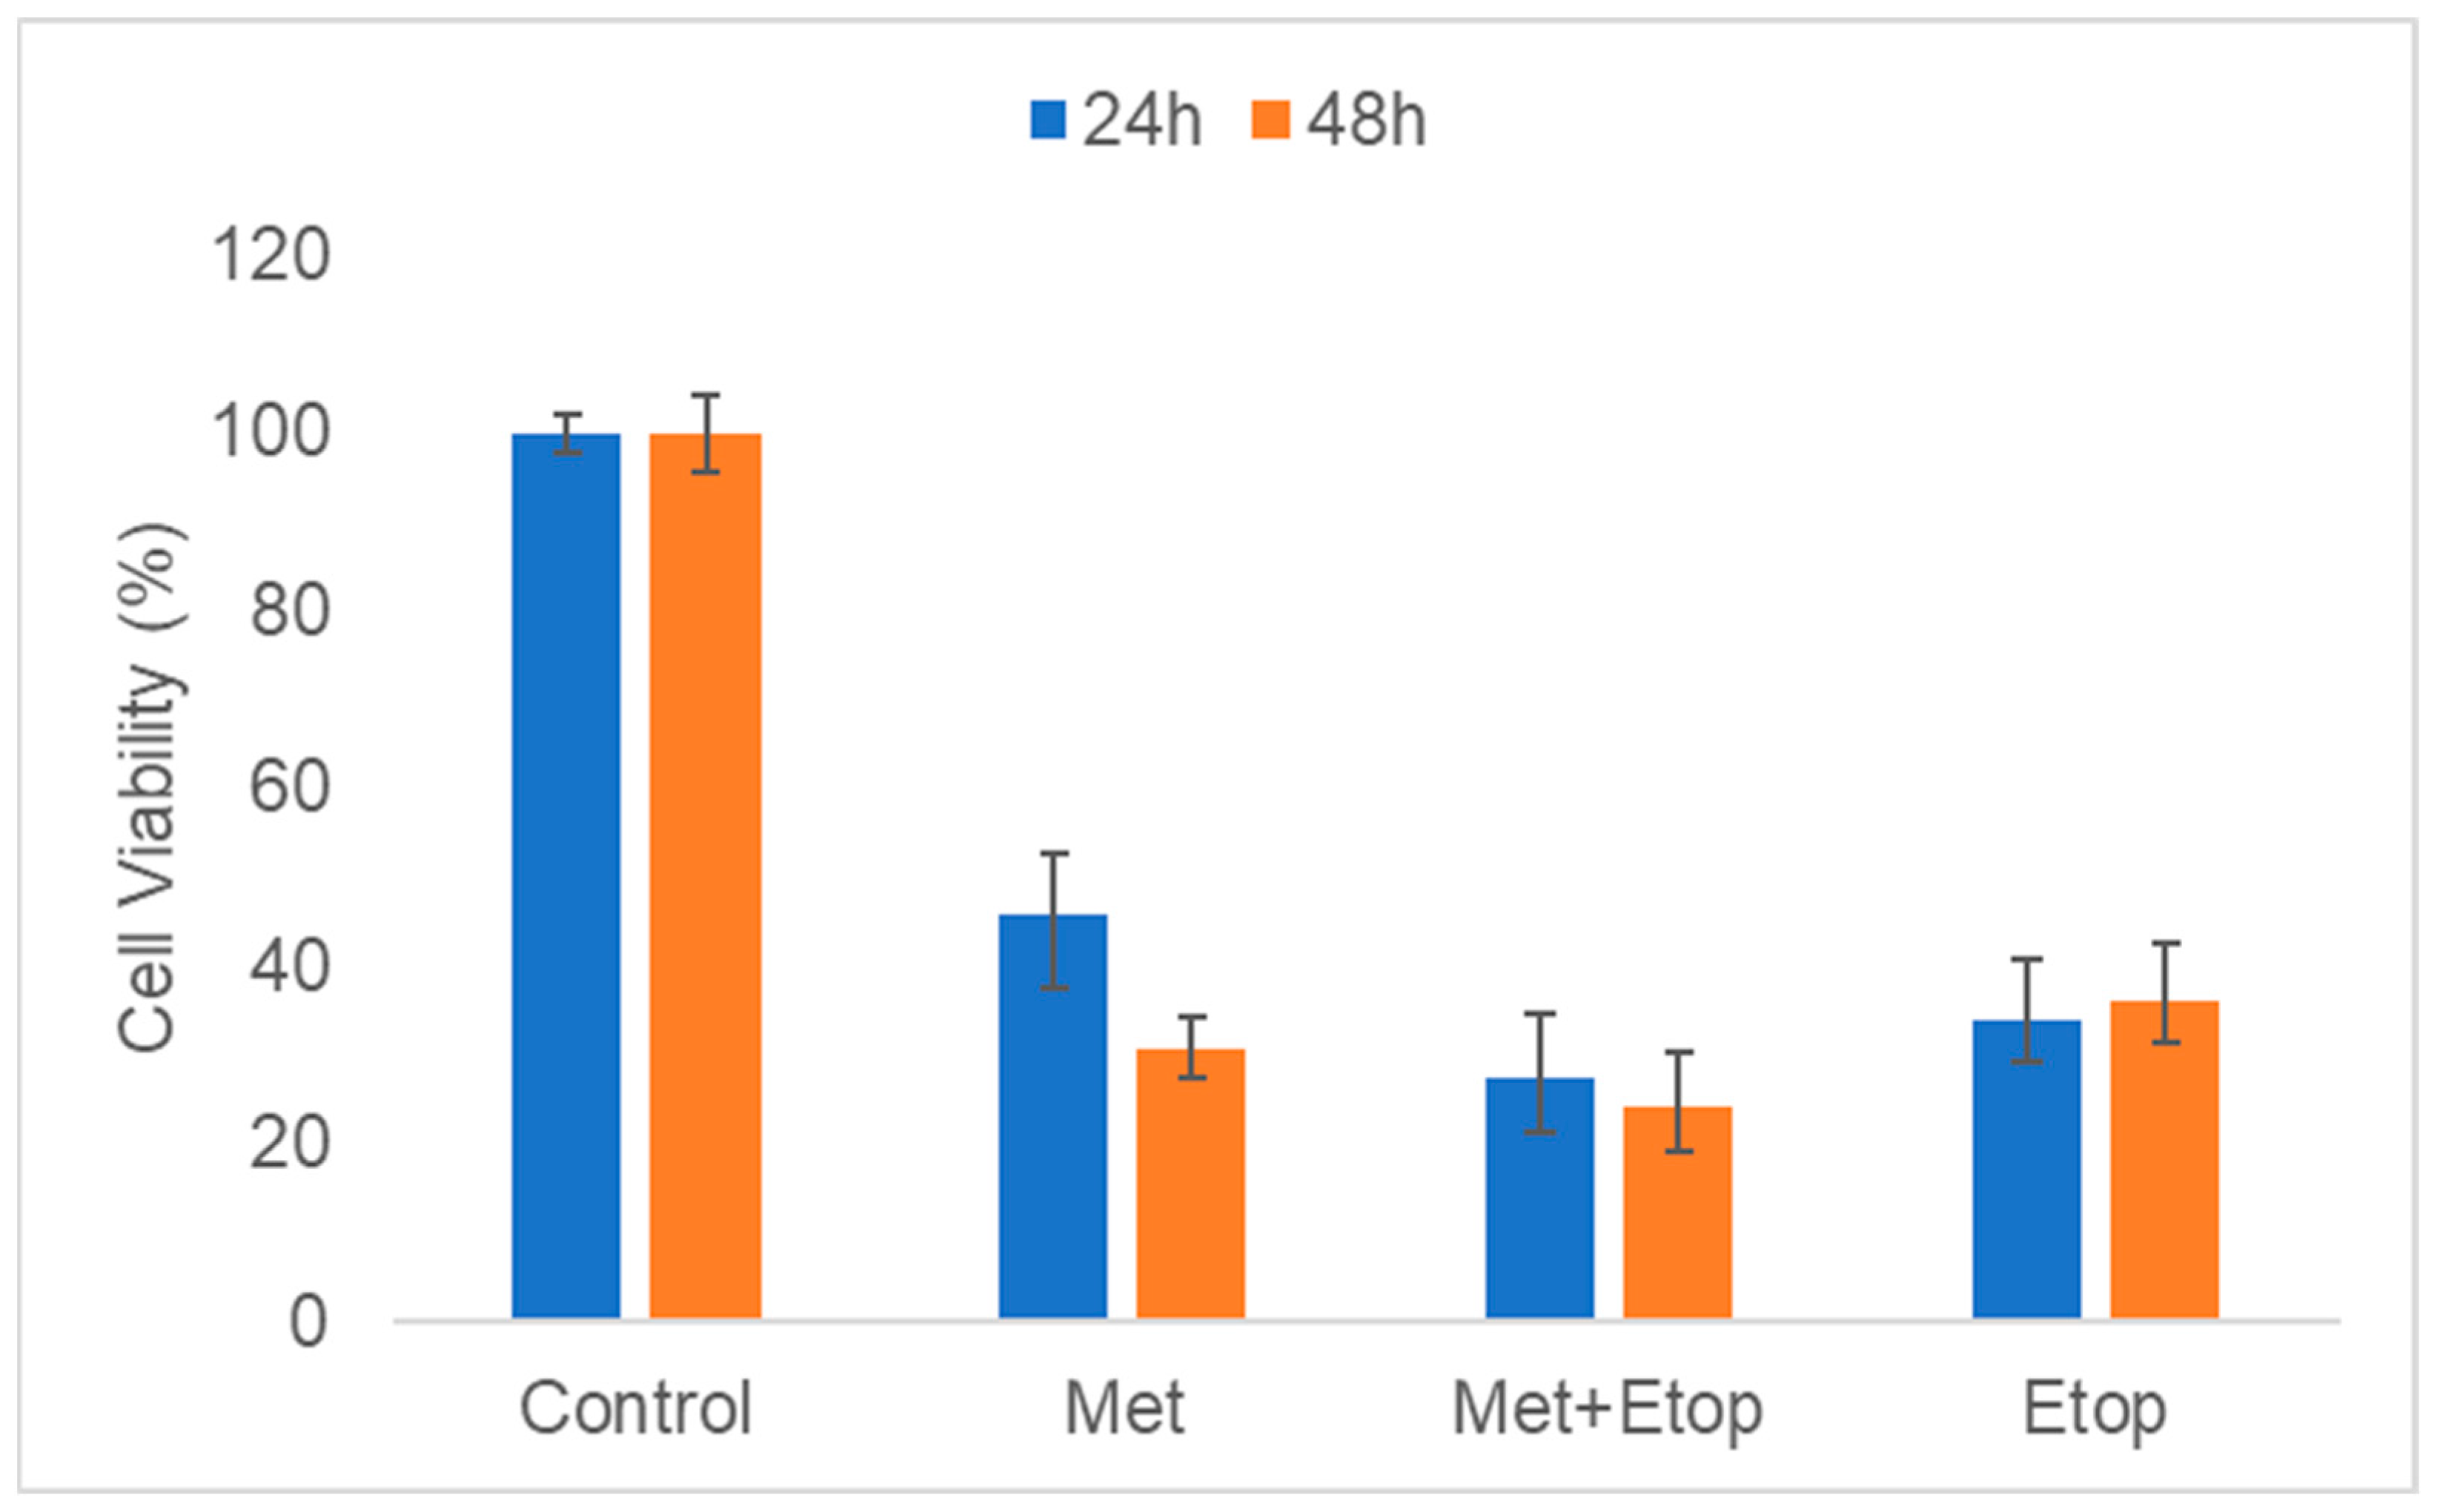
3.4. The Concurrent Effect of L-Methioninase and Etoposide on Cell Viability

The concurrent effect of L-methioninase and etoposide on glioblastoma U87-MG cells was evaluated using a neutral red assay. These results indicate that the cytotoxicity of etoposide increased with the addition of L-methioninase. L-methioninase increased the death of glioblastoma cells on the second day in both L-methioninase, L-methioninase, and etoposide combined culture groups. The combined use of L-methioninase and etoposide resulted in a higher level of cell death in glioblastoma U87MG and T98G cells compared to the individual use of either treatment in both 24 h and 48 h culture conditions. These findings indicate that L-methioninase can enhance the cytotoxicity of etoposide, leading to increased cell death in the glioblastoma U87MG and T98G cell lines (p < 0.001) (Figure 4 and Figure 5).

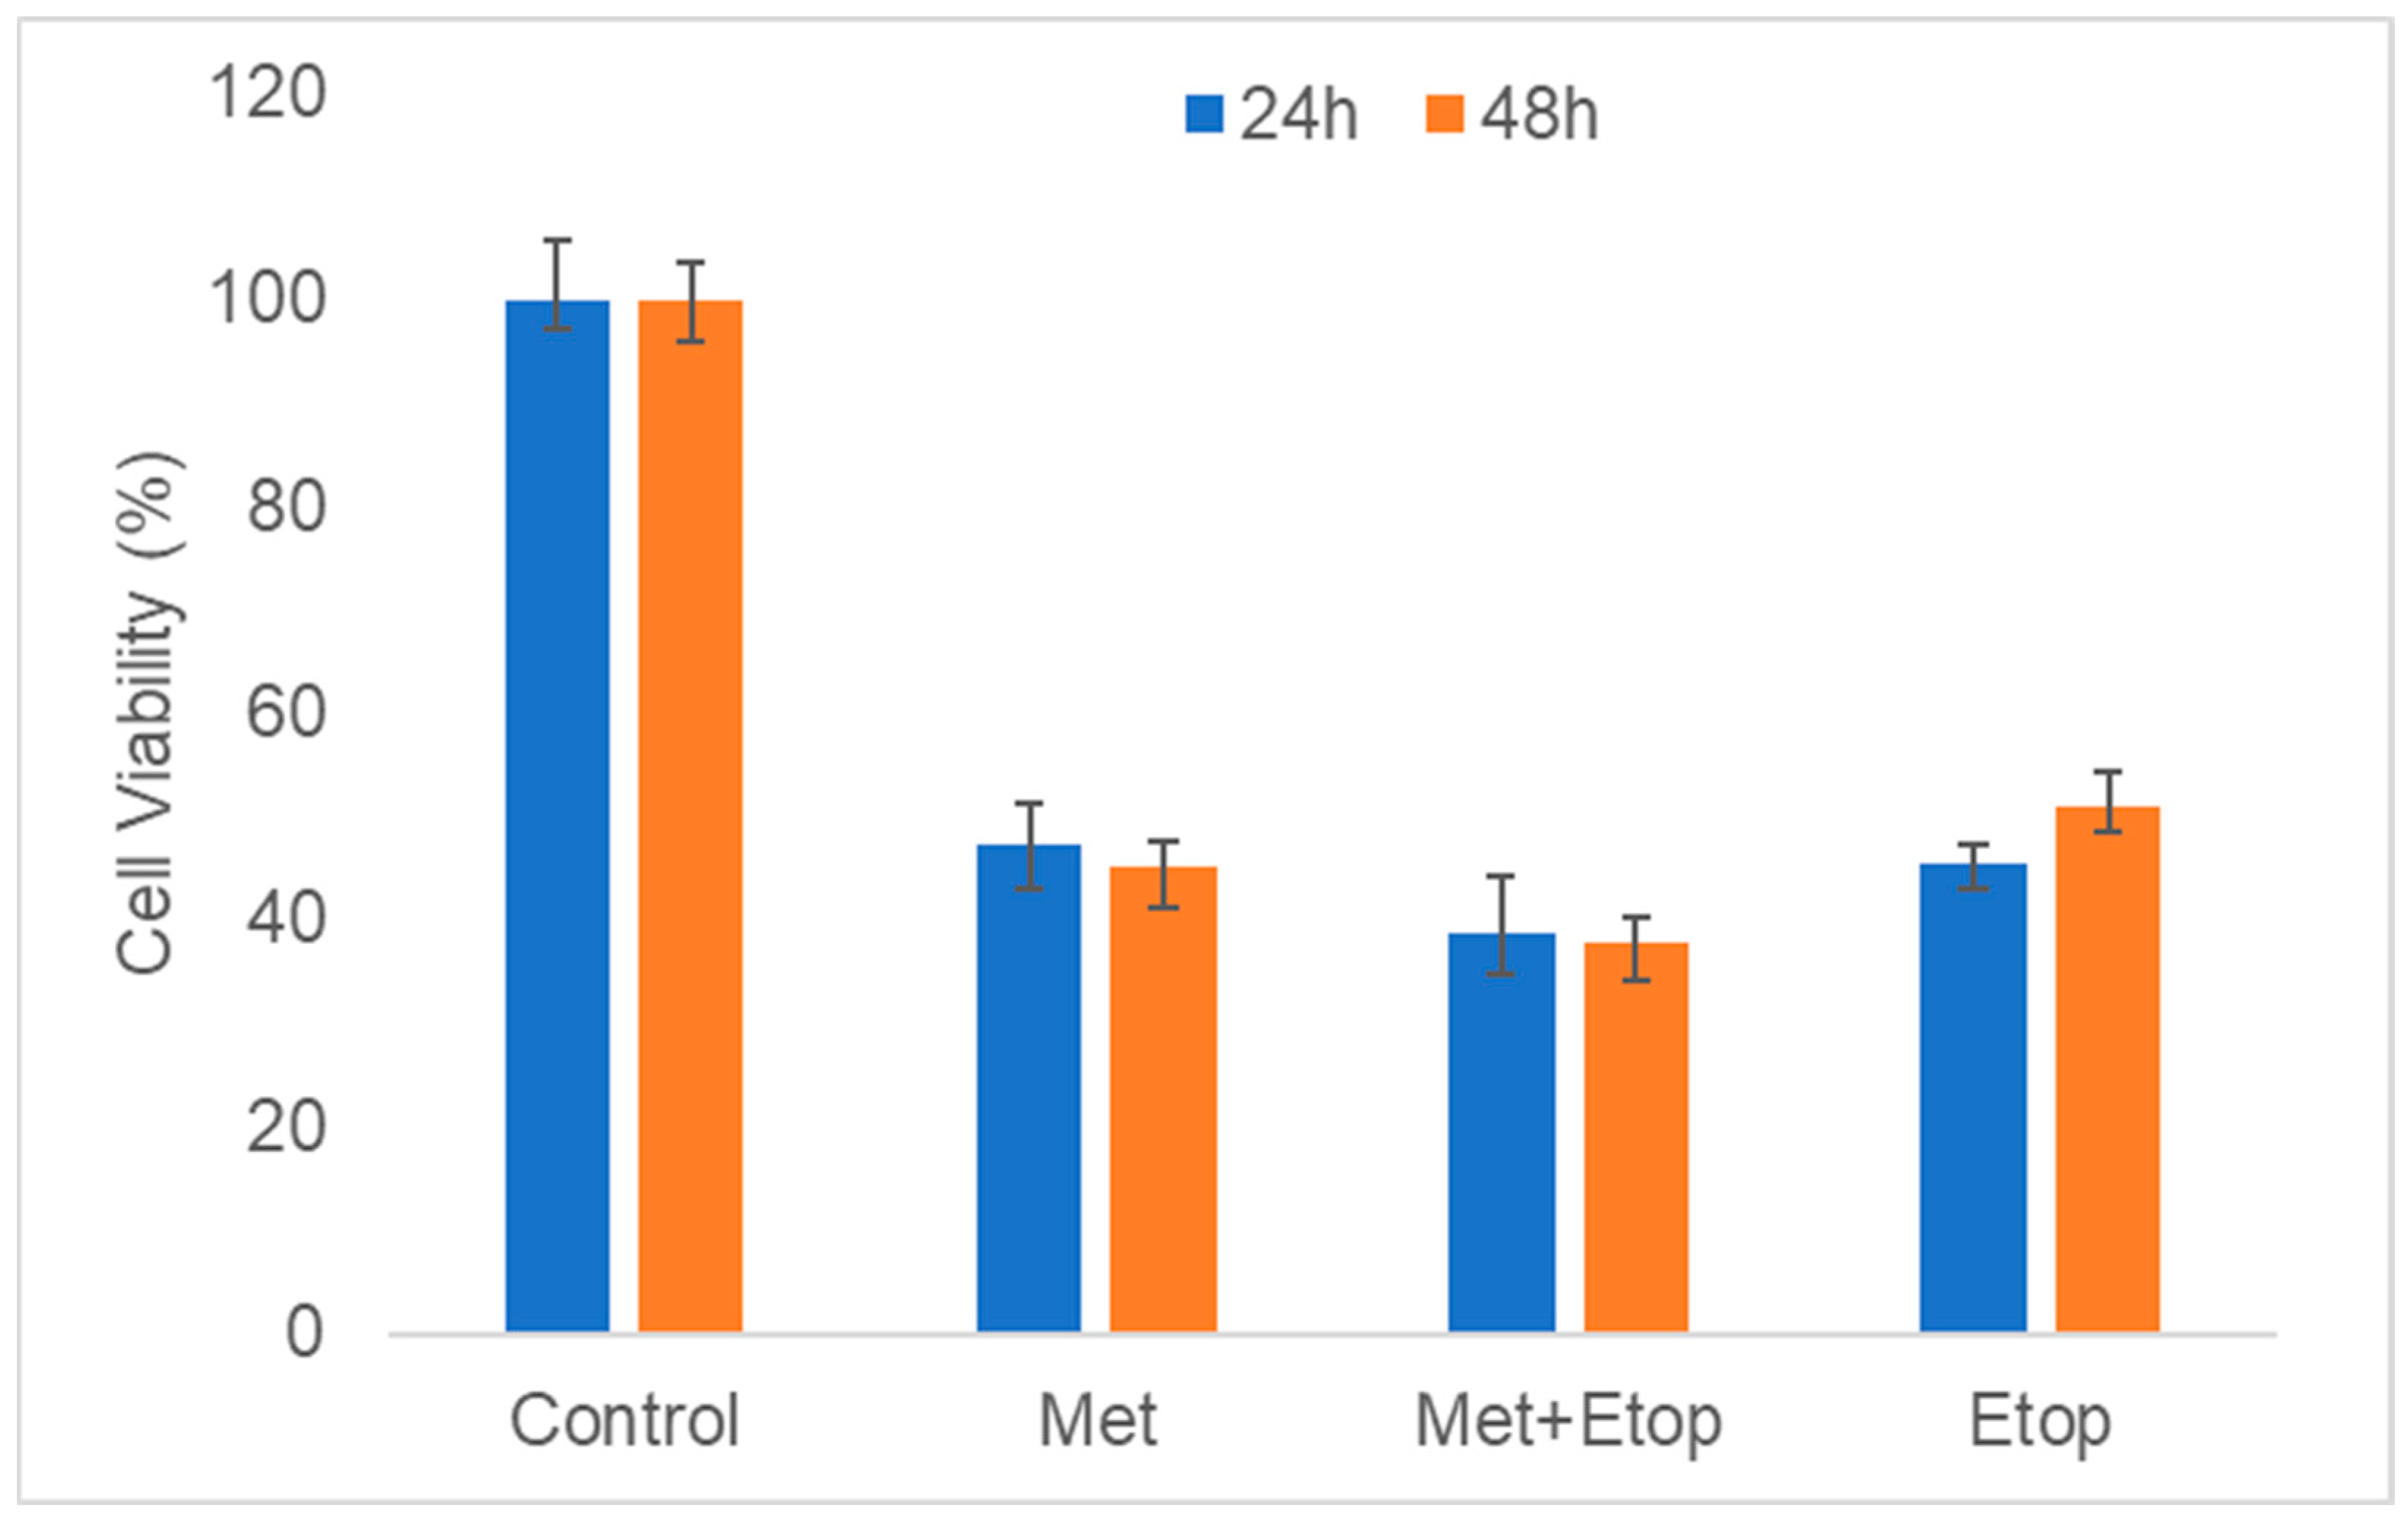
3.5. Evaluation of L-Methioninase with Etoposide on Mouse Embryonic Fibroblast (MEF) and Human Keratinocyte (HaCaT) Cells

In addition to the cytotoxicity of L-methioninase and etoposide against glioblastoma U87MG and T98G cells, their cytotoxic activity against normal cells was evaluated using a neutral red assay. Therefore, MEF and HaCaT cells were used. Based on the results obtained from the 24 h culture of MEF cells, L-methioninase exhibited lower cytotoxicity than etoposide.These results indicated that L-methioninase is less cytotoxic against normal cells even though it contributes less cytotoxic activity to etoposide and alleviates the side effects of etoposide against normal mammalian cells (Figure 6).

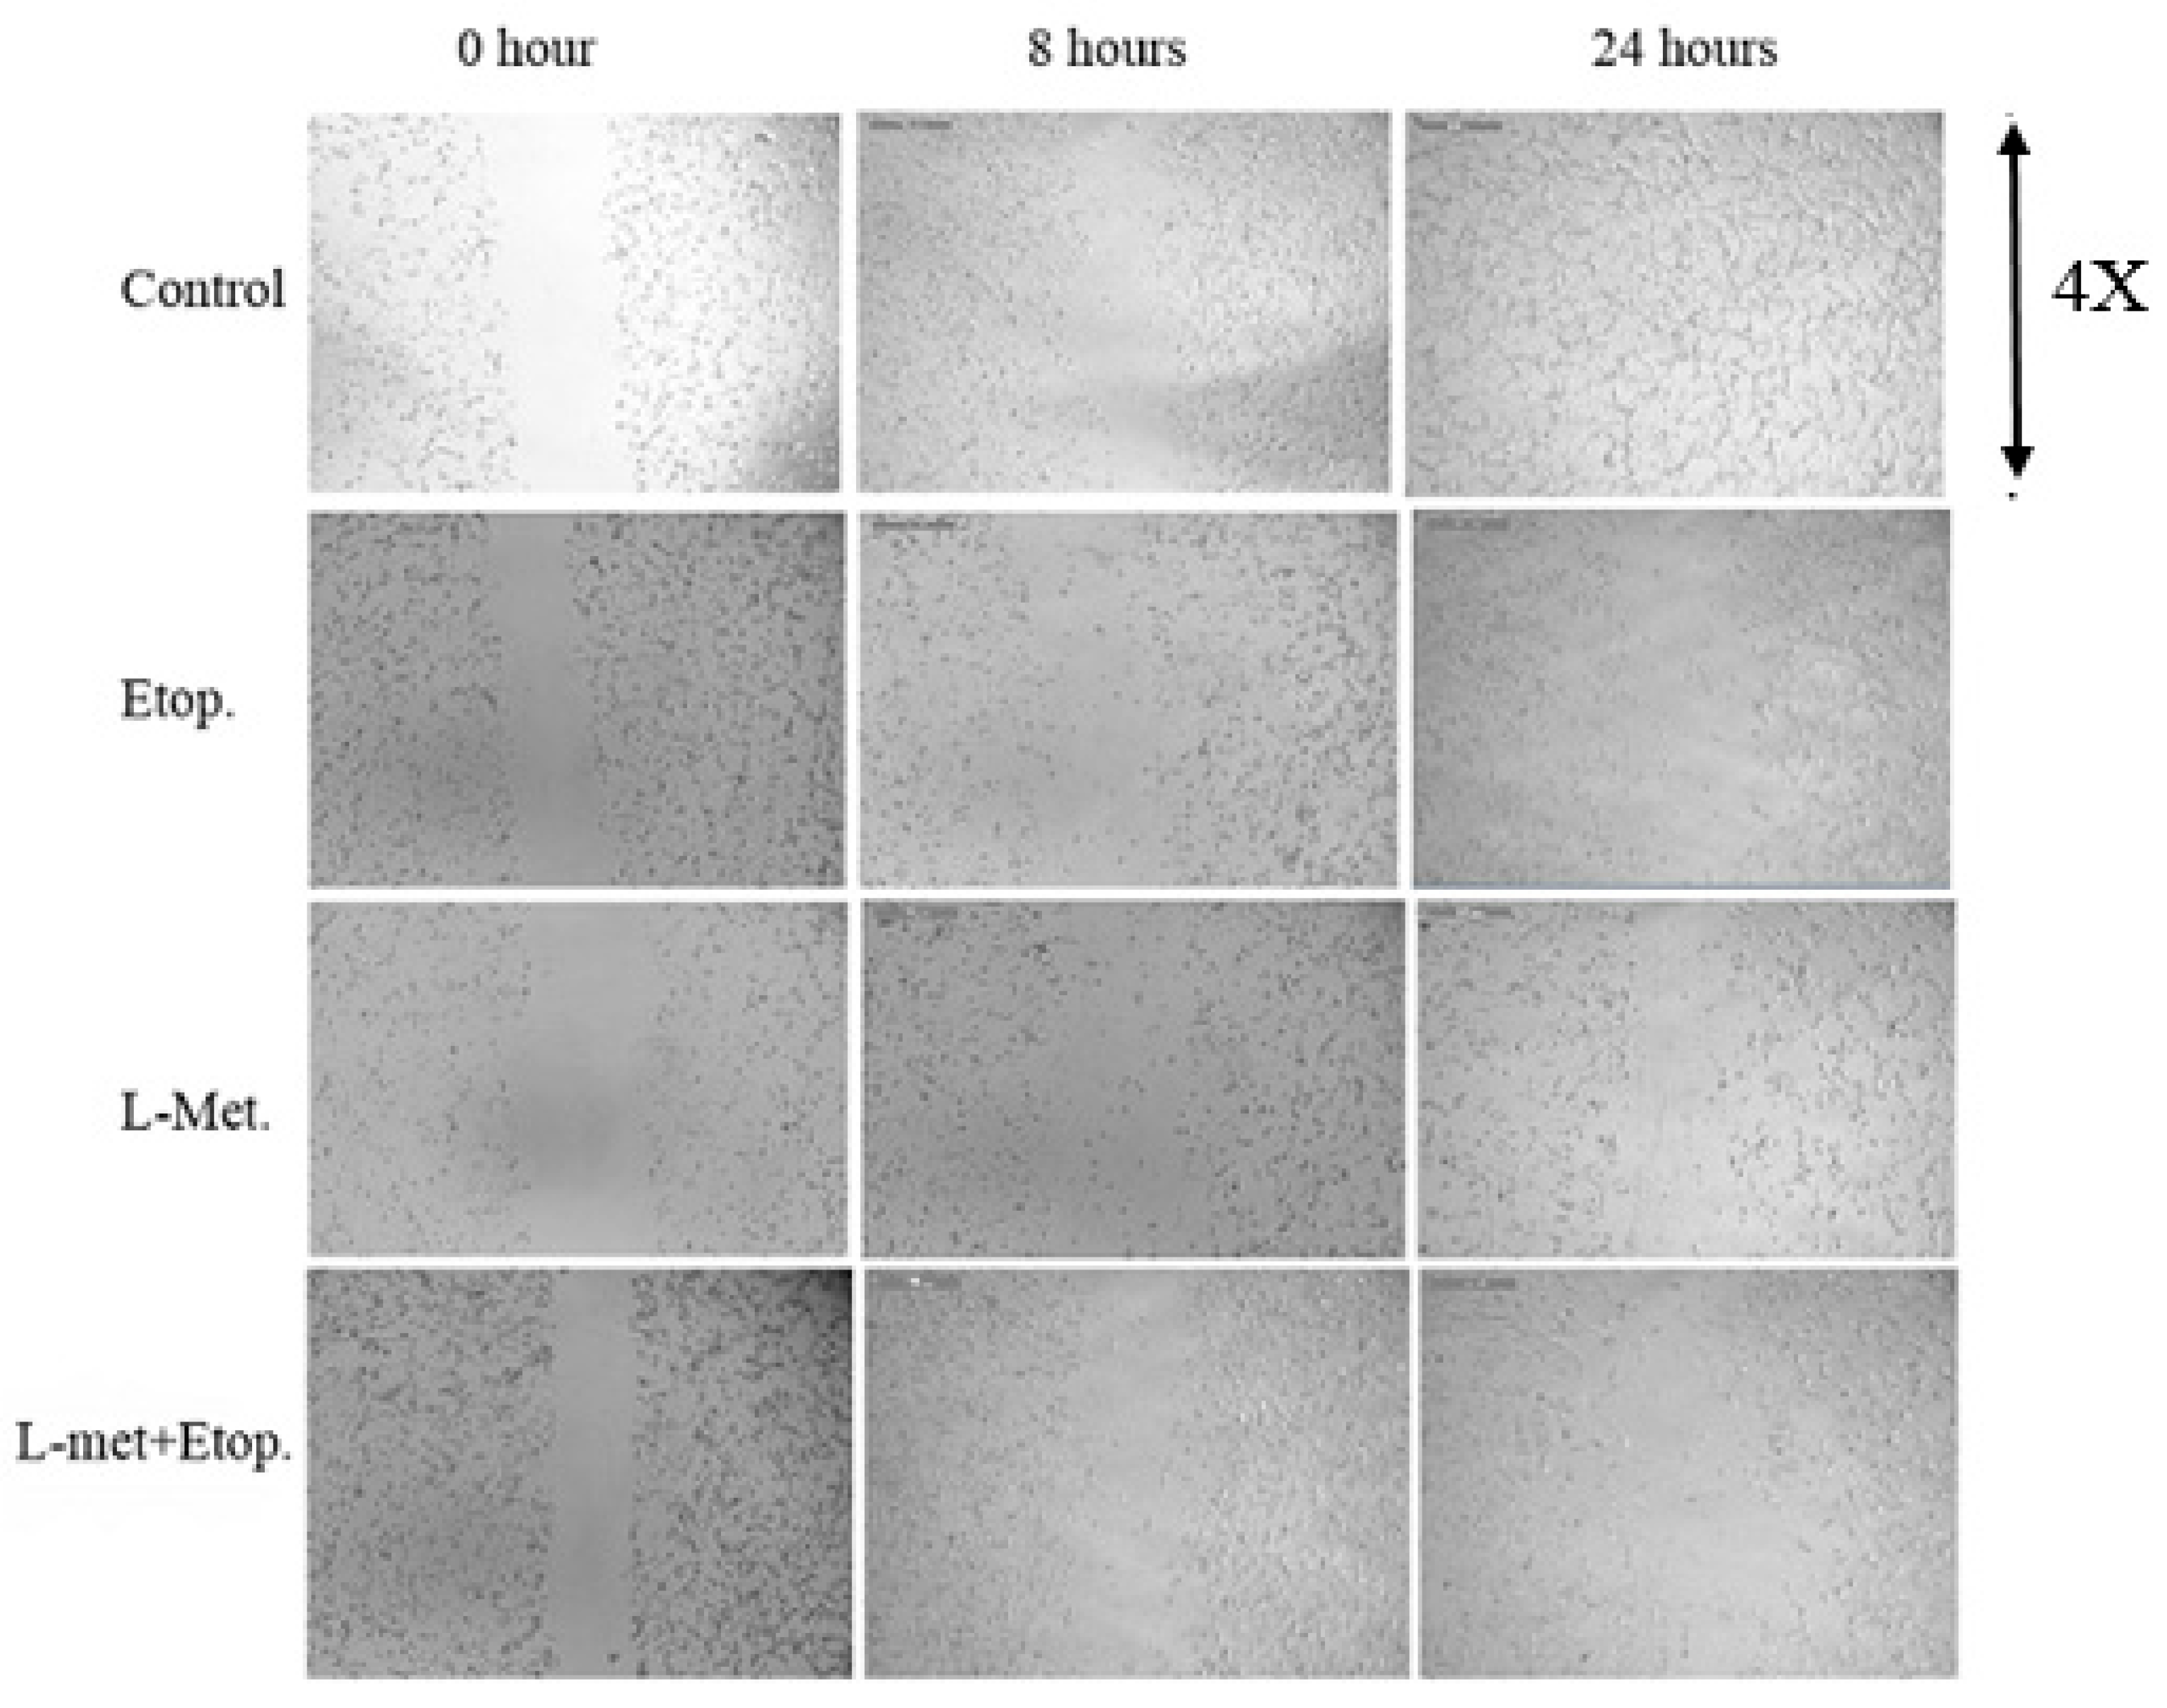
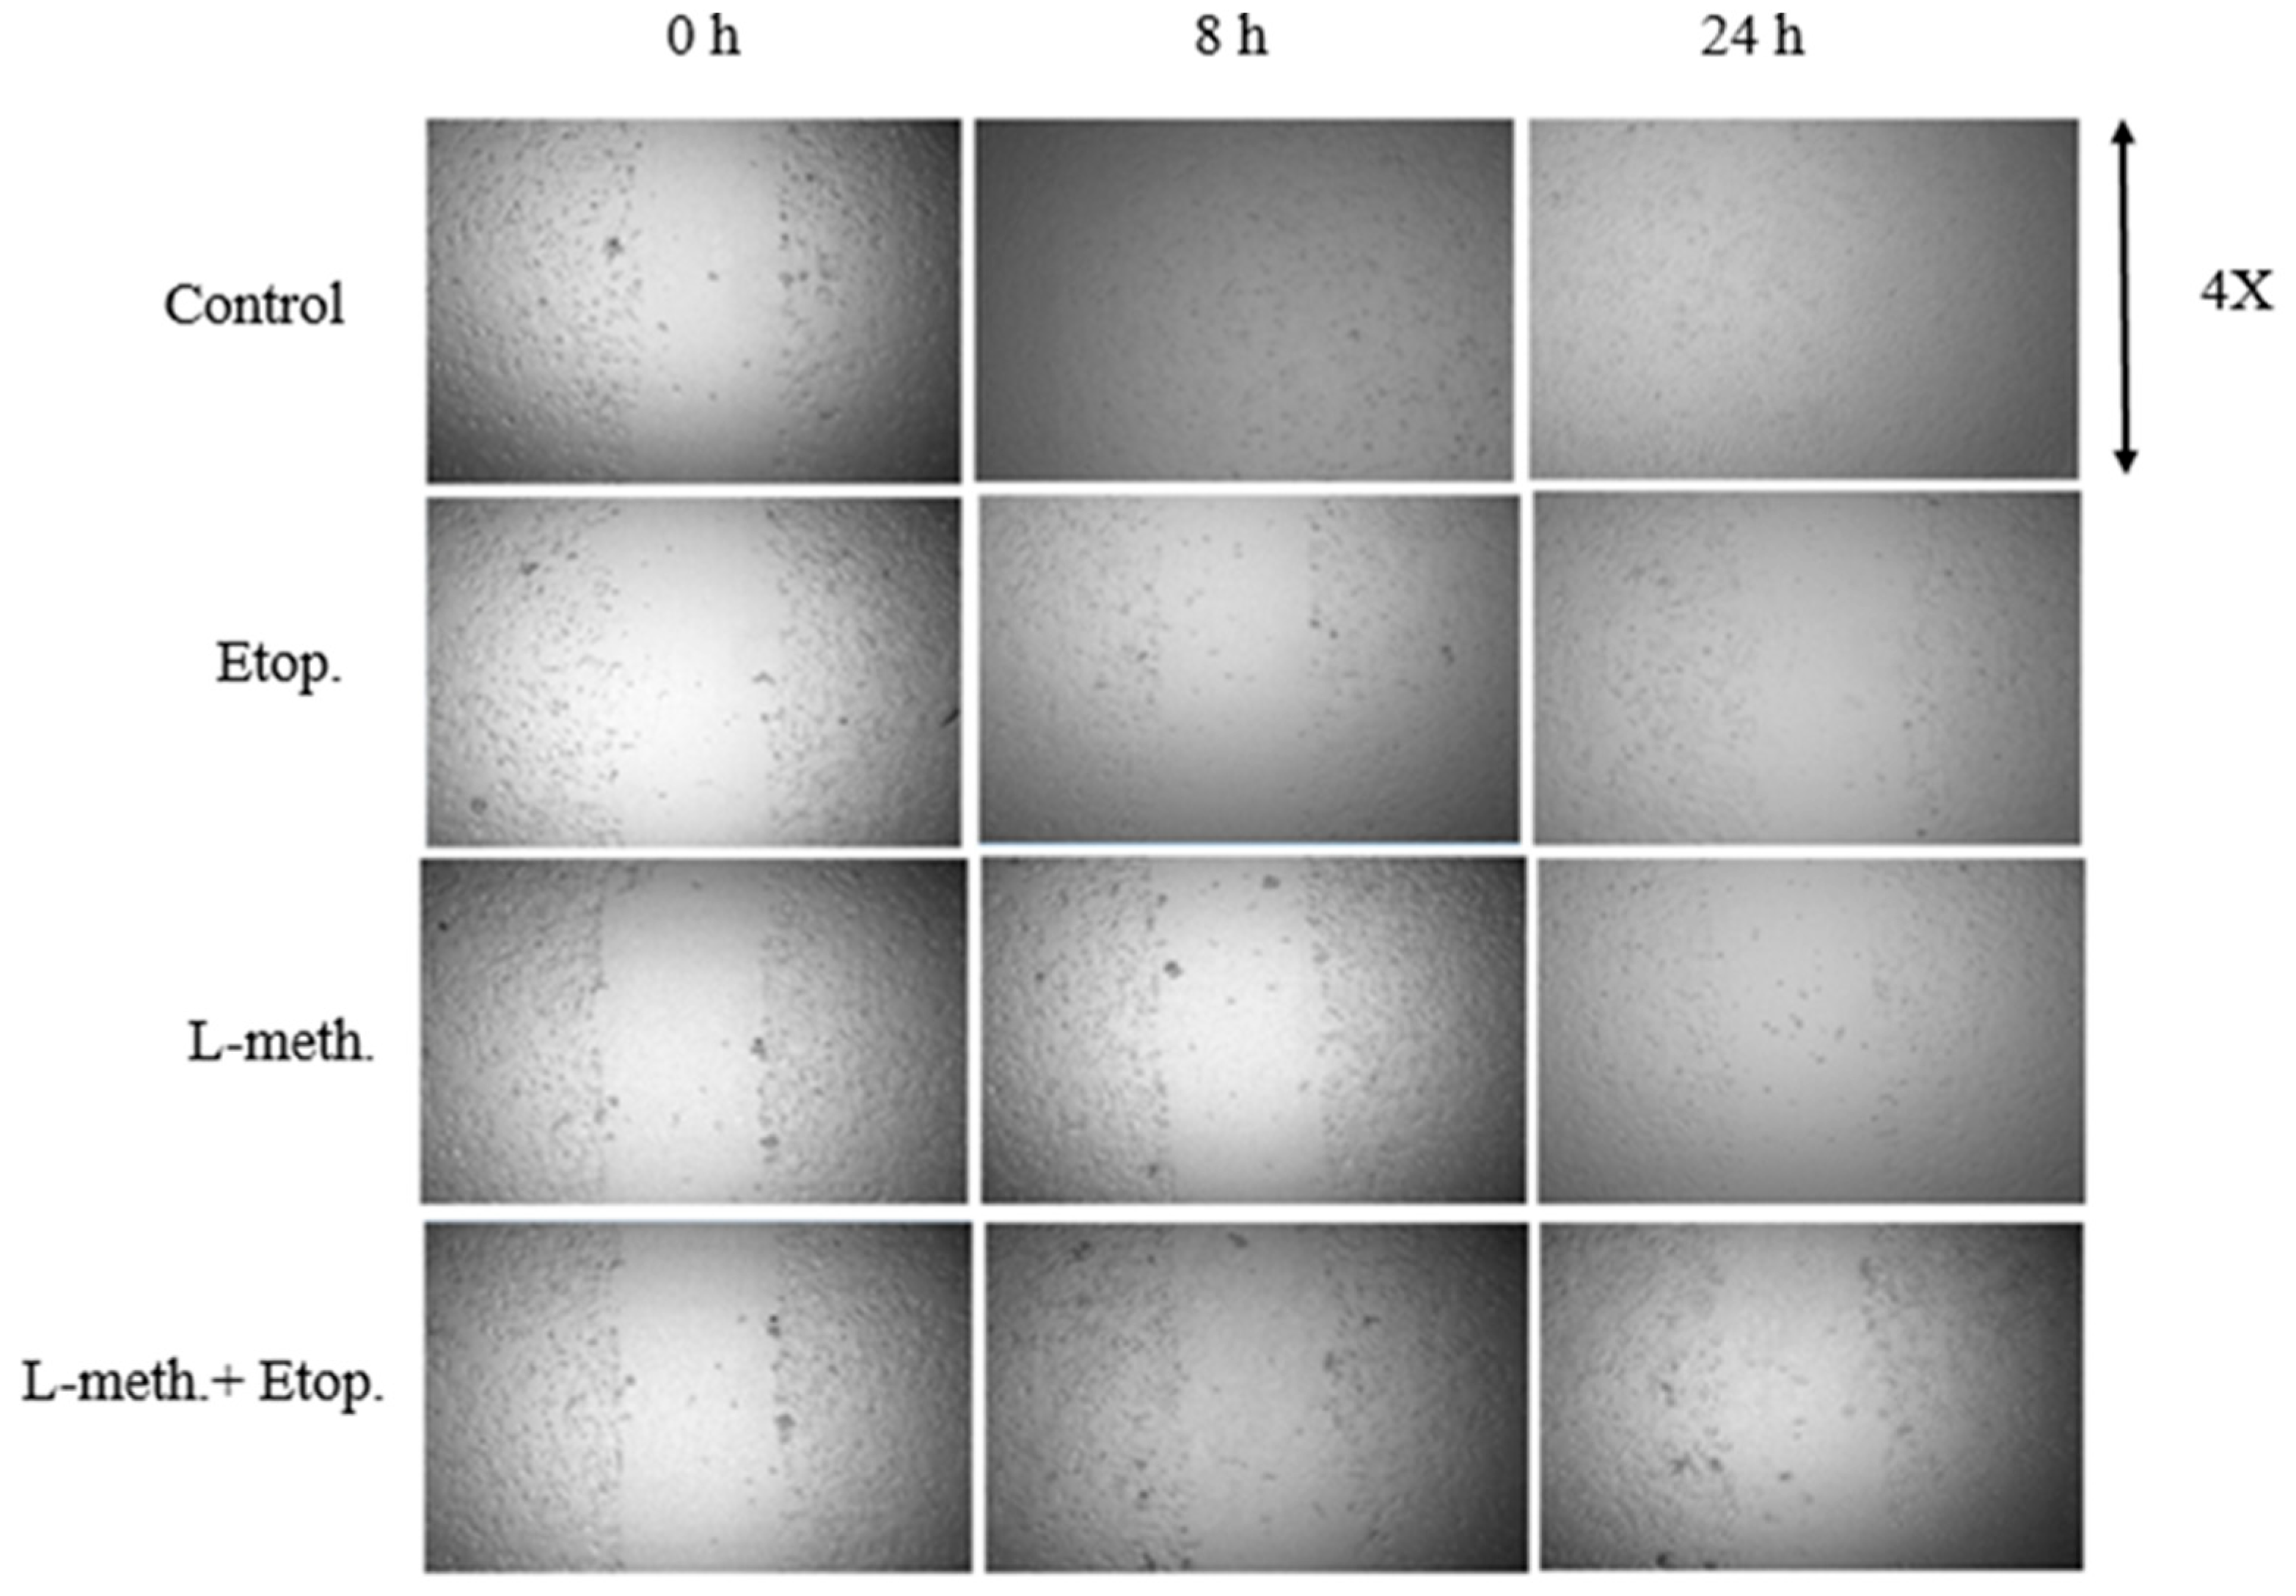
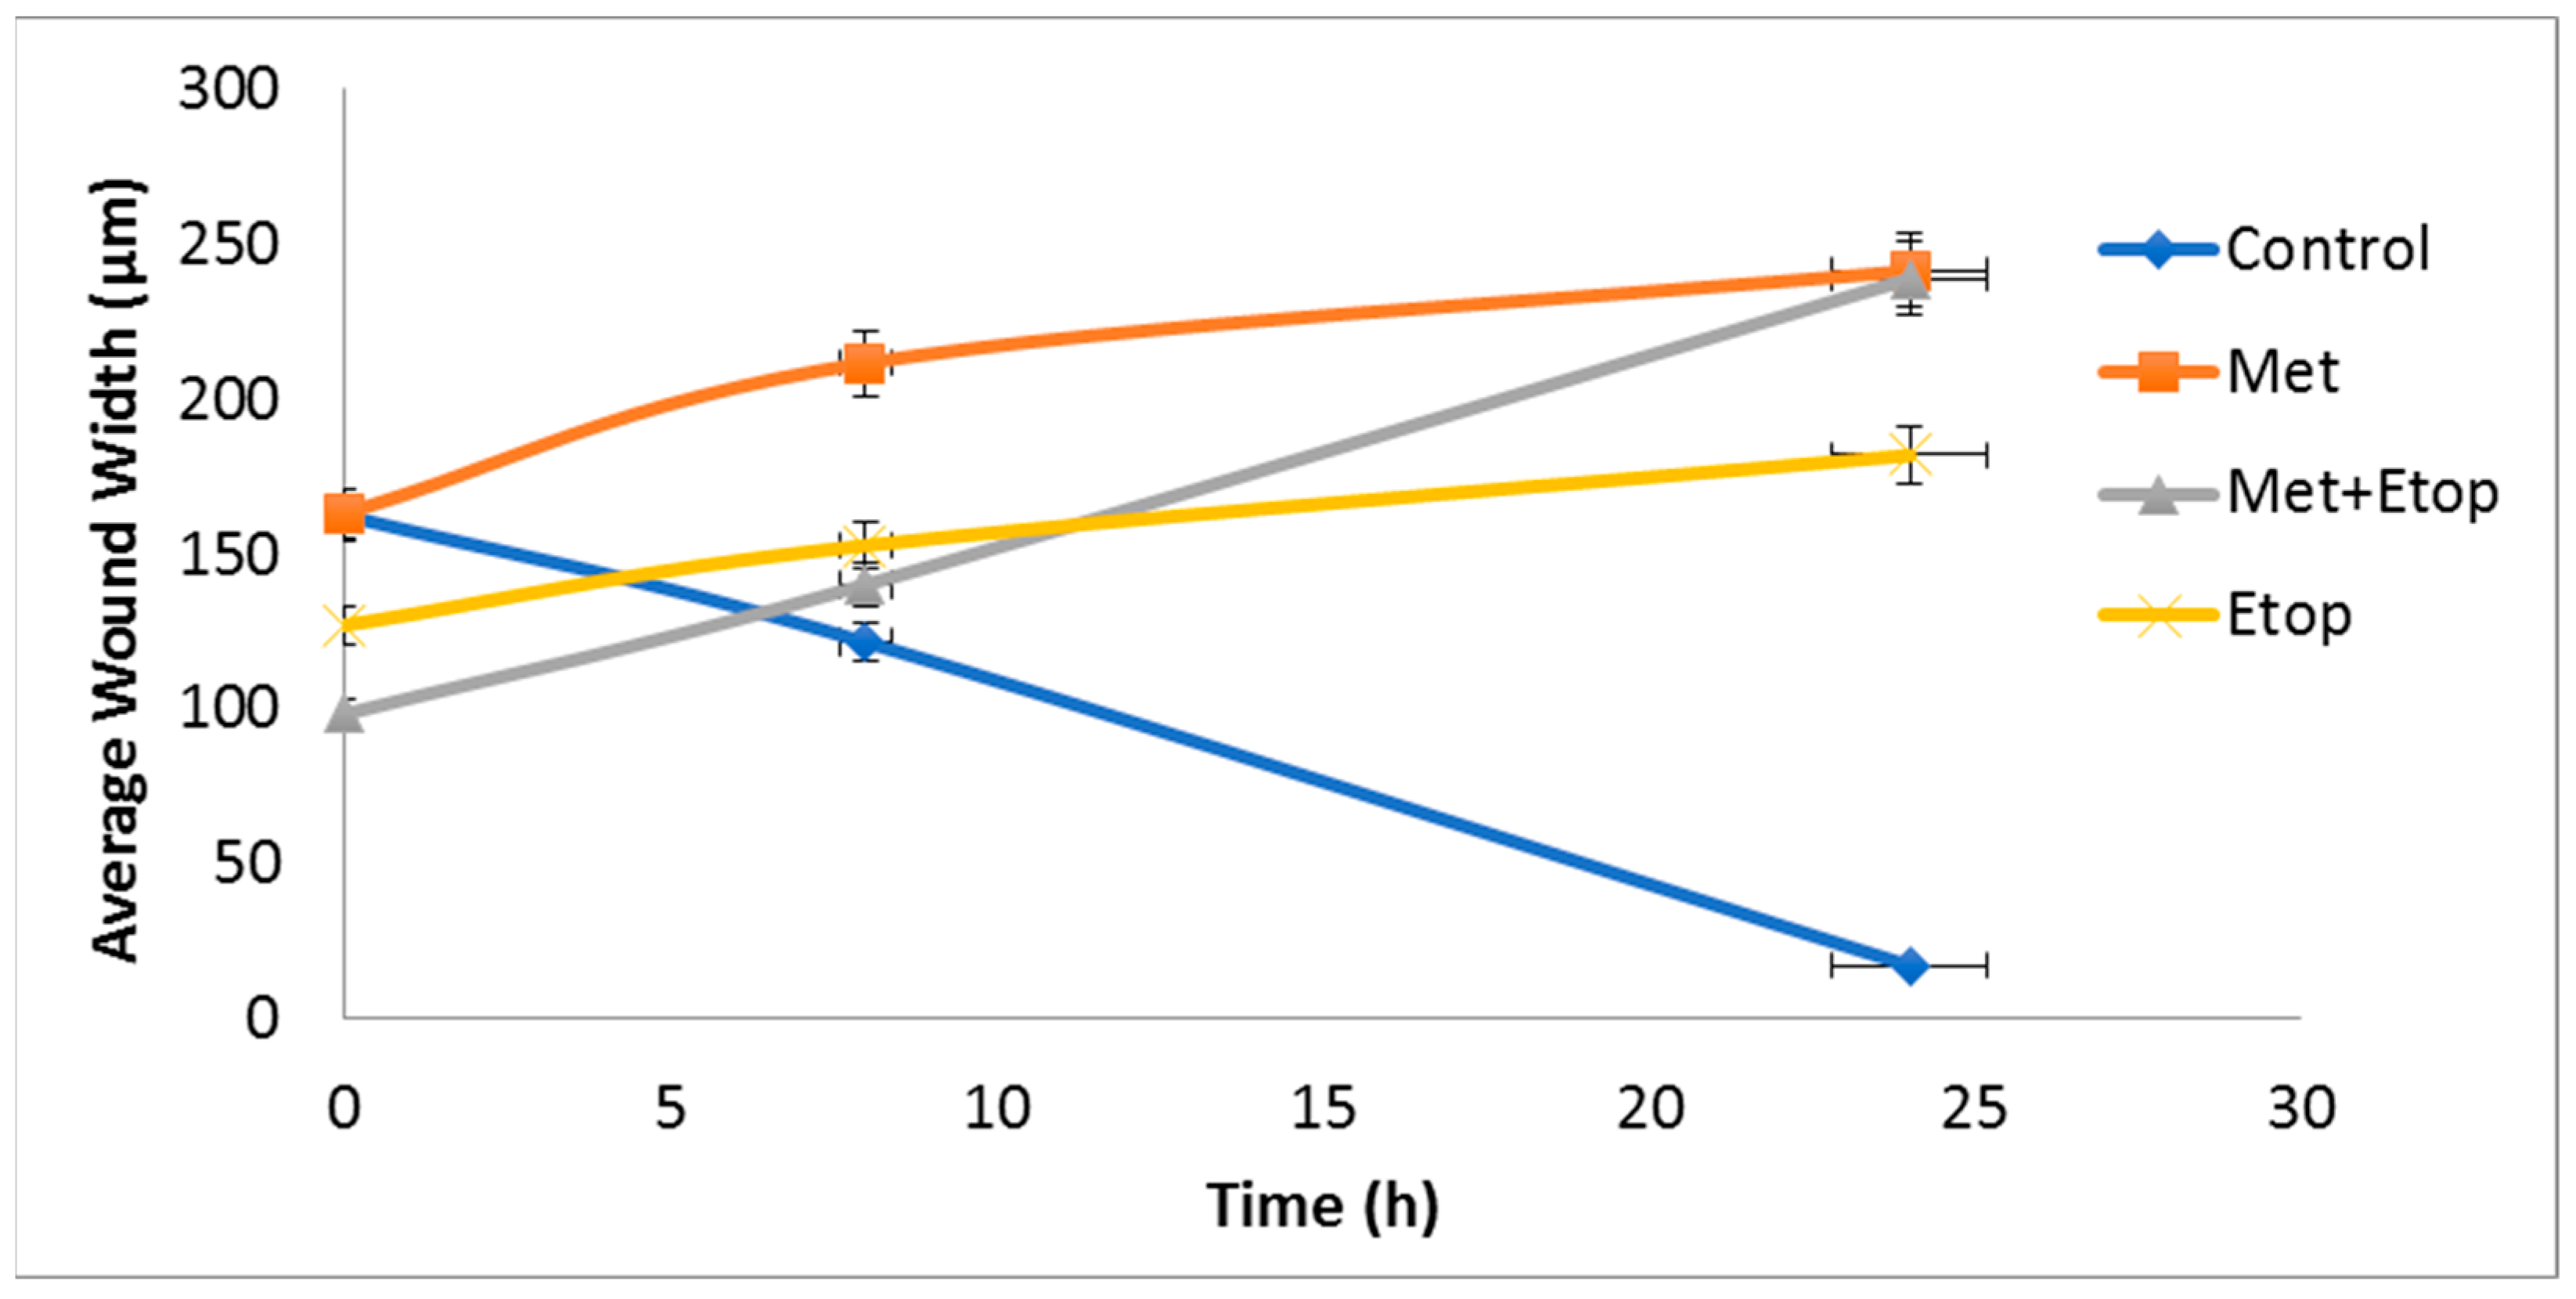
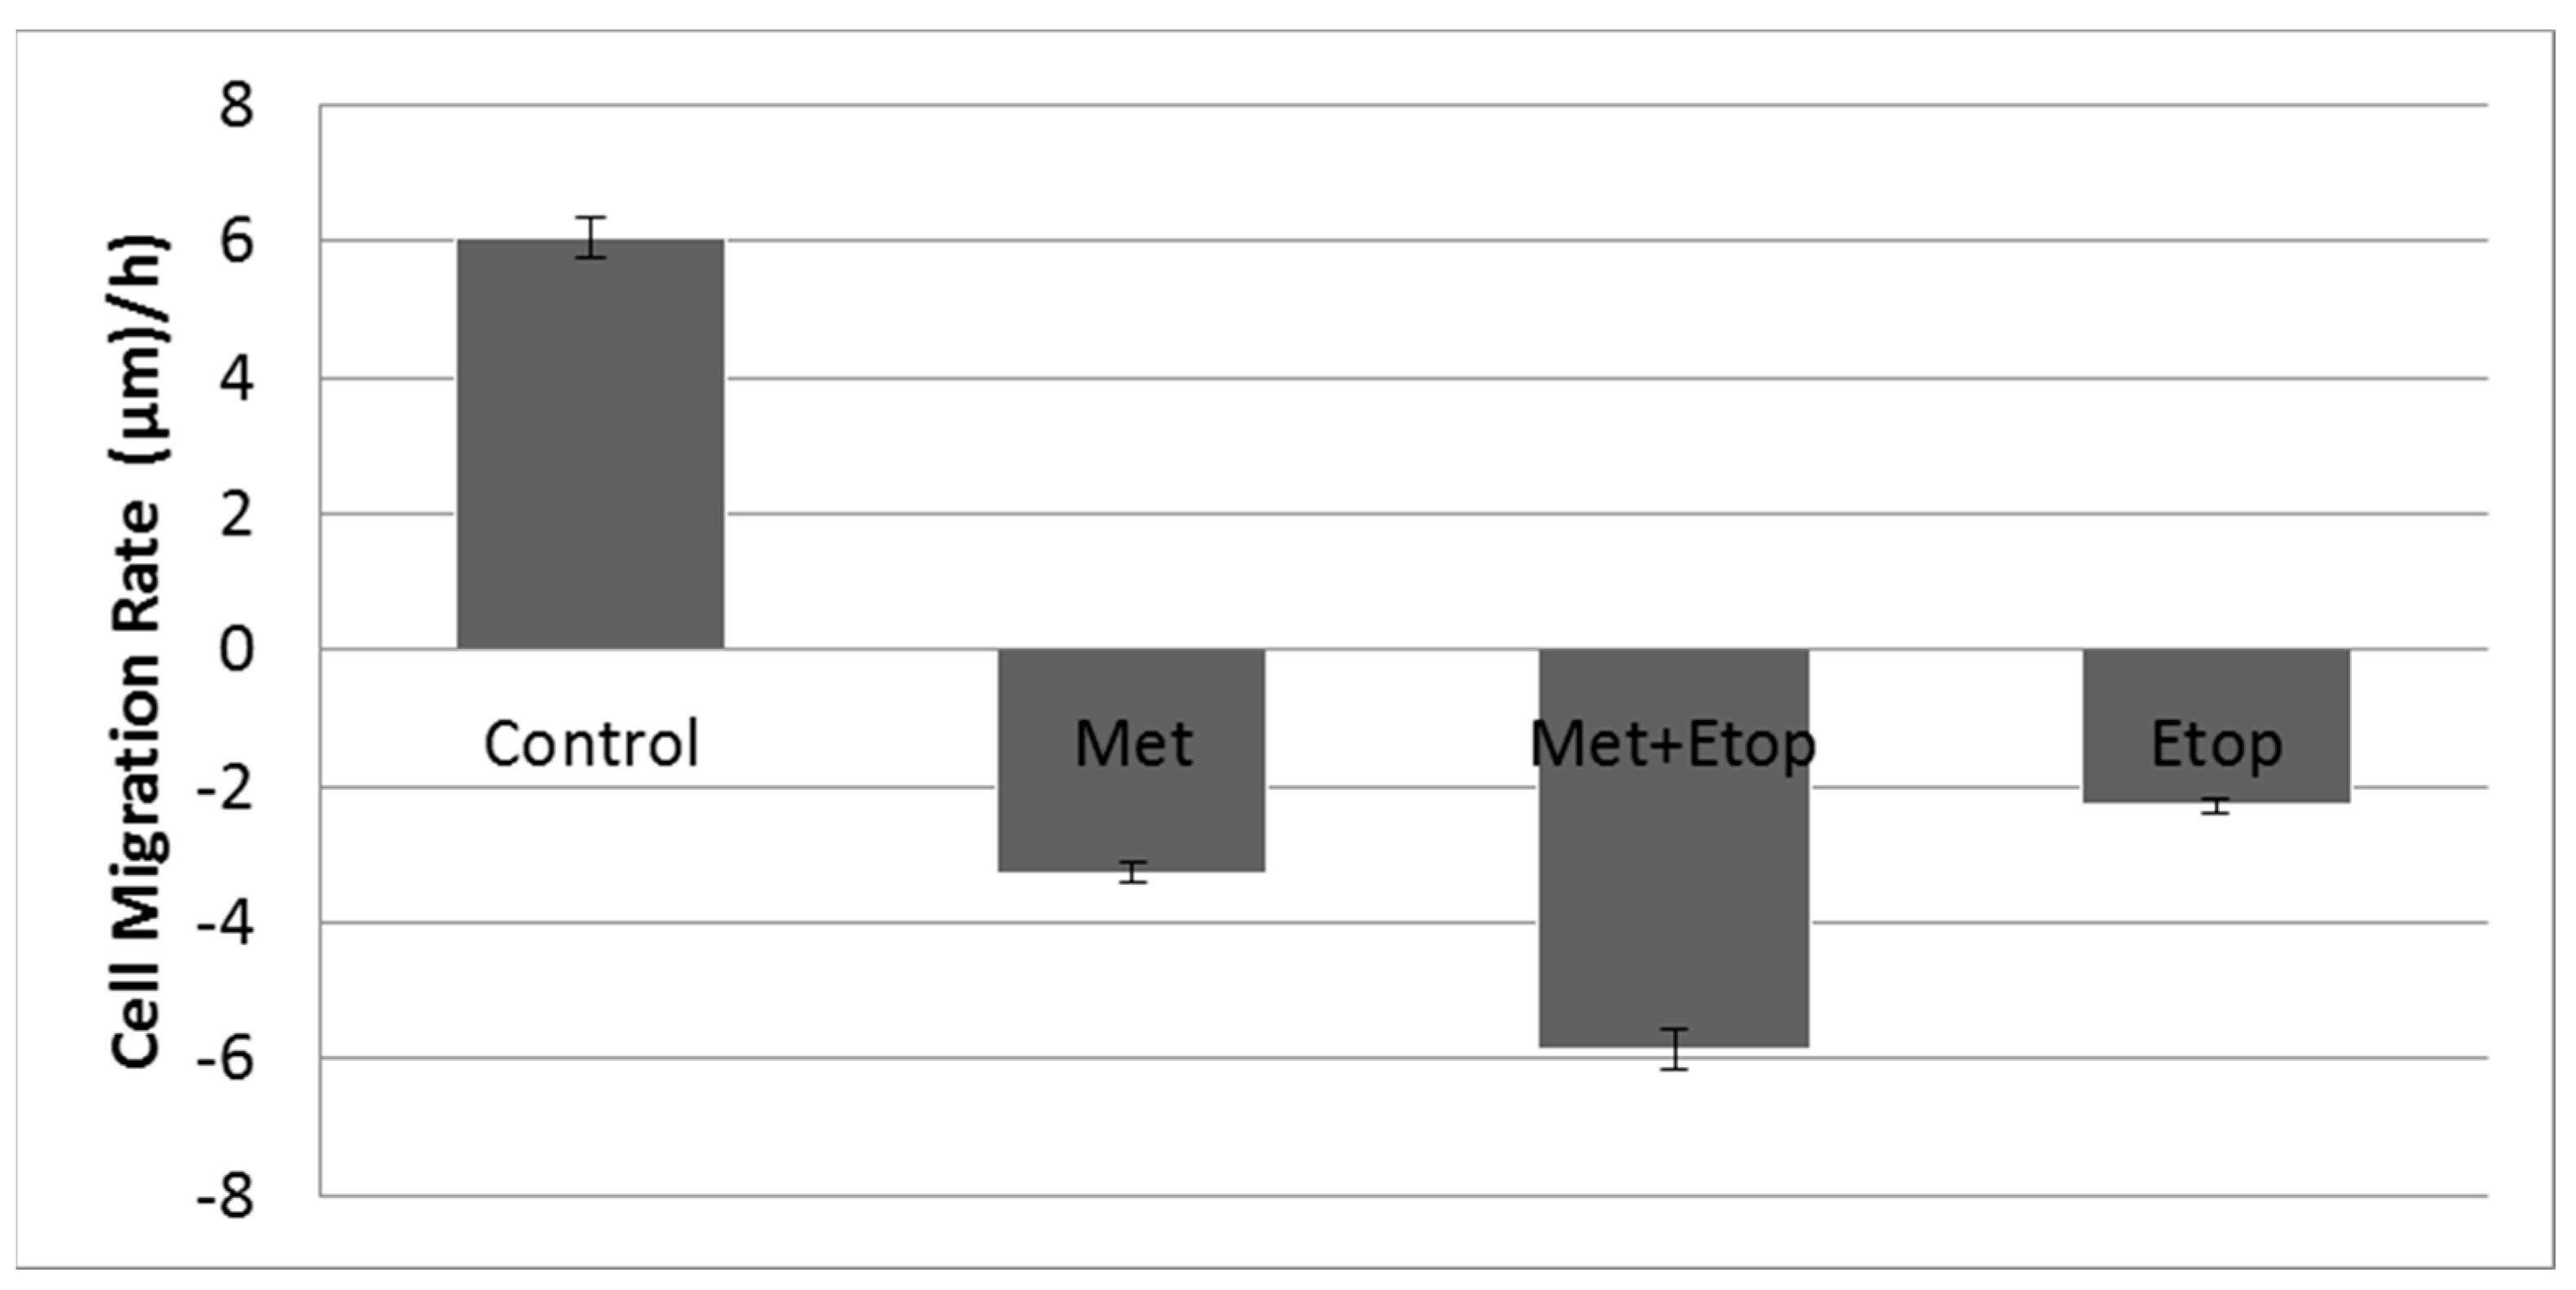
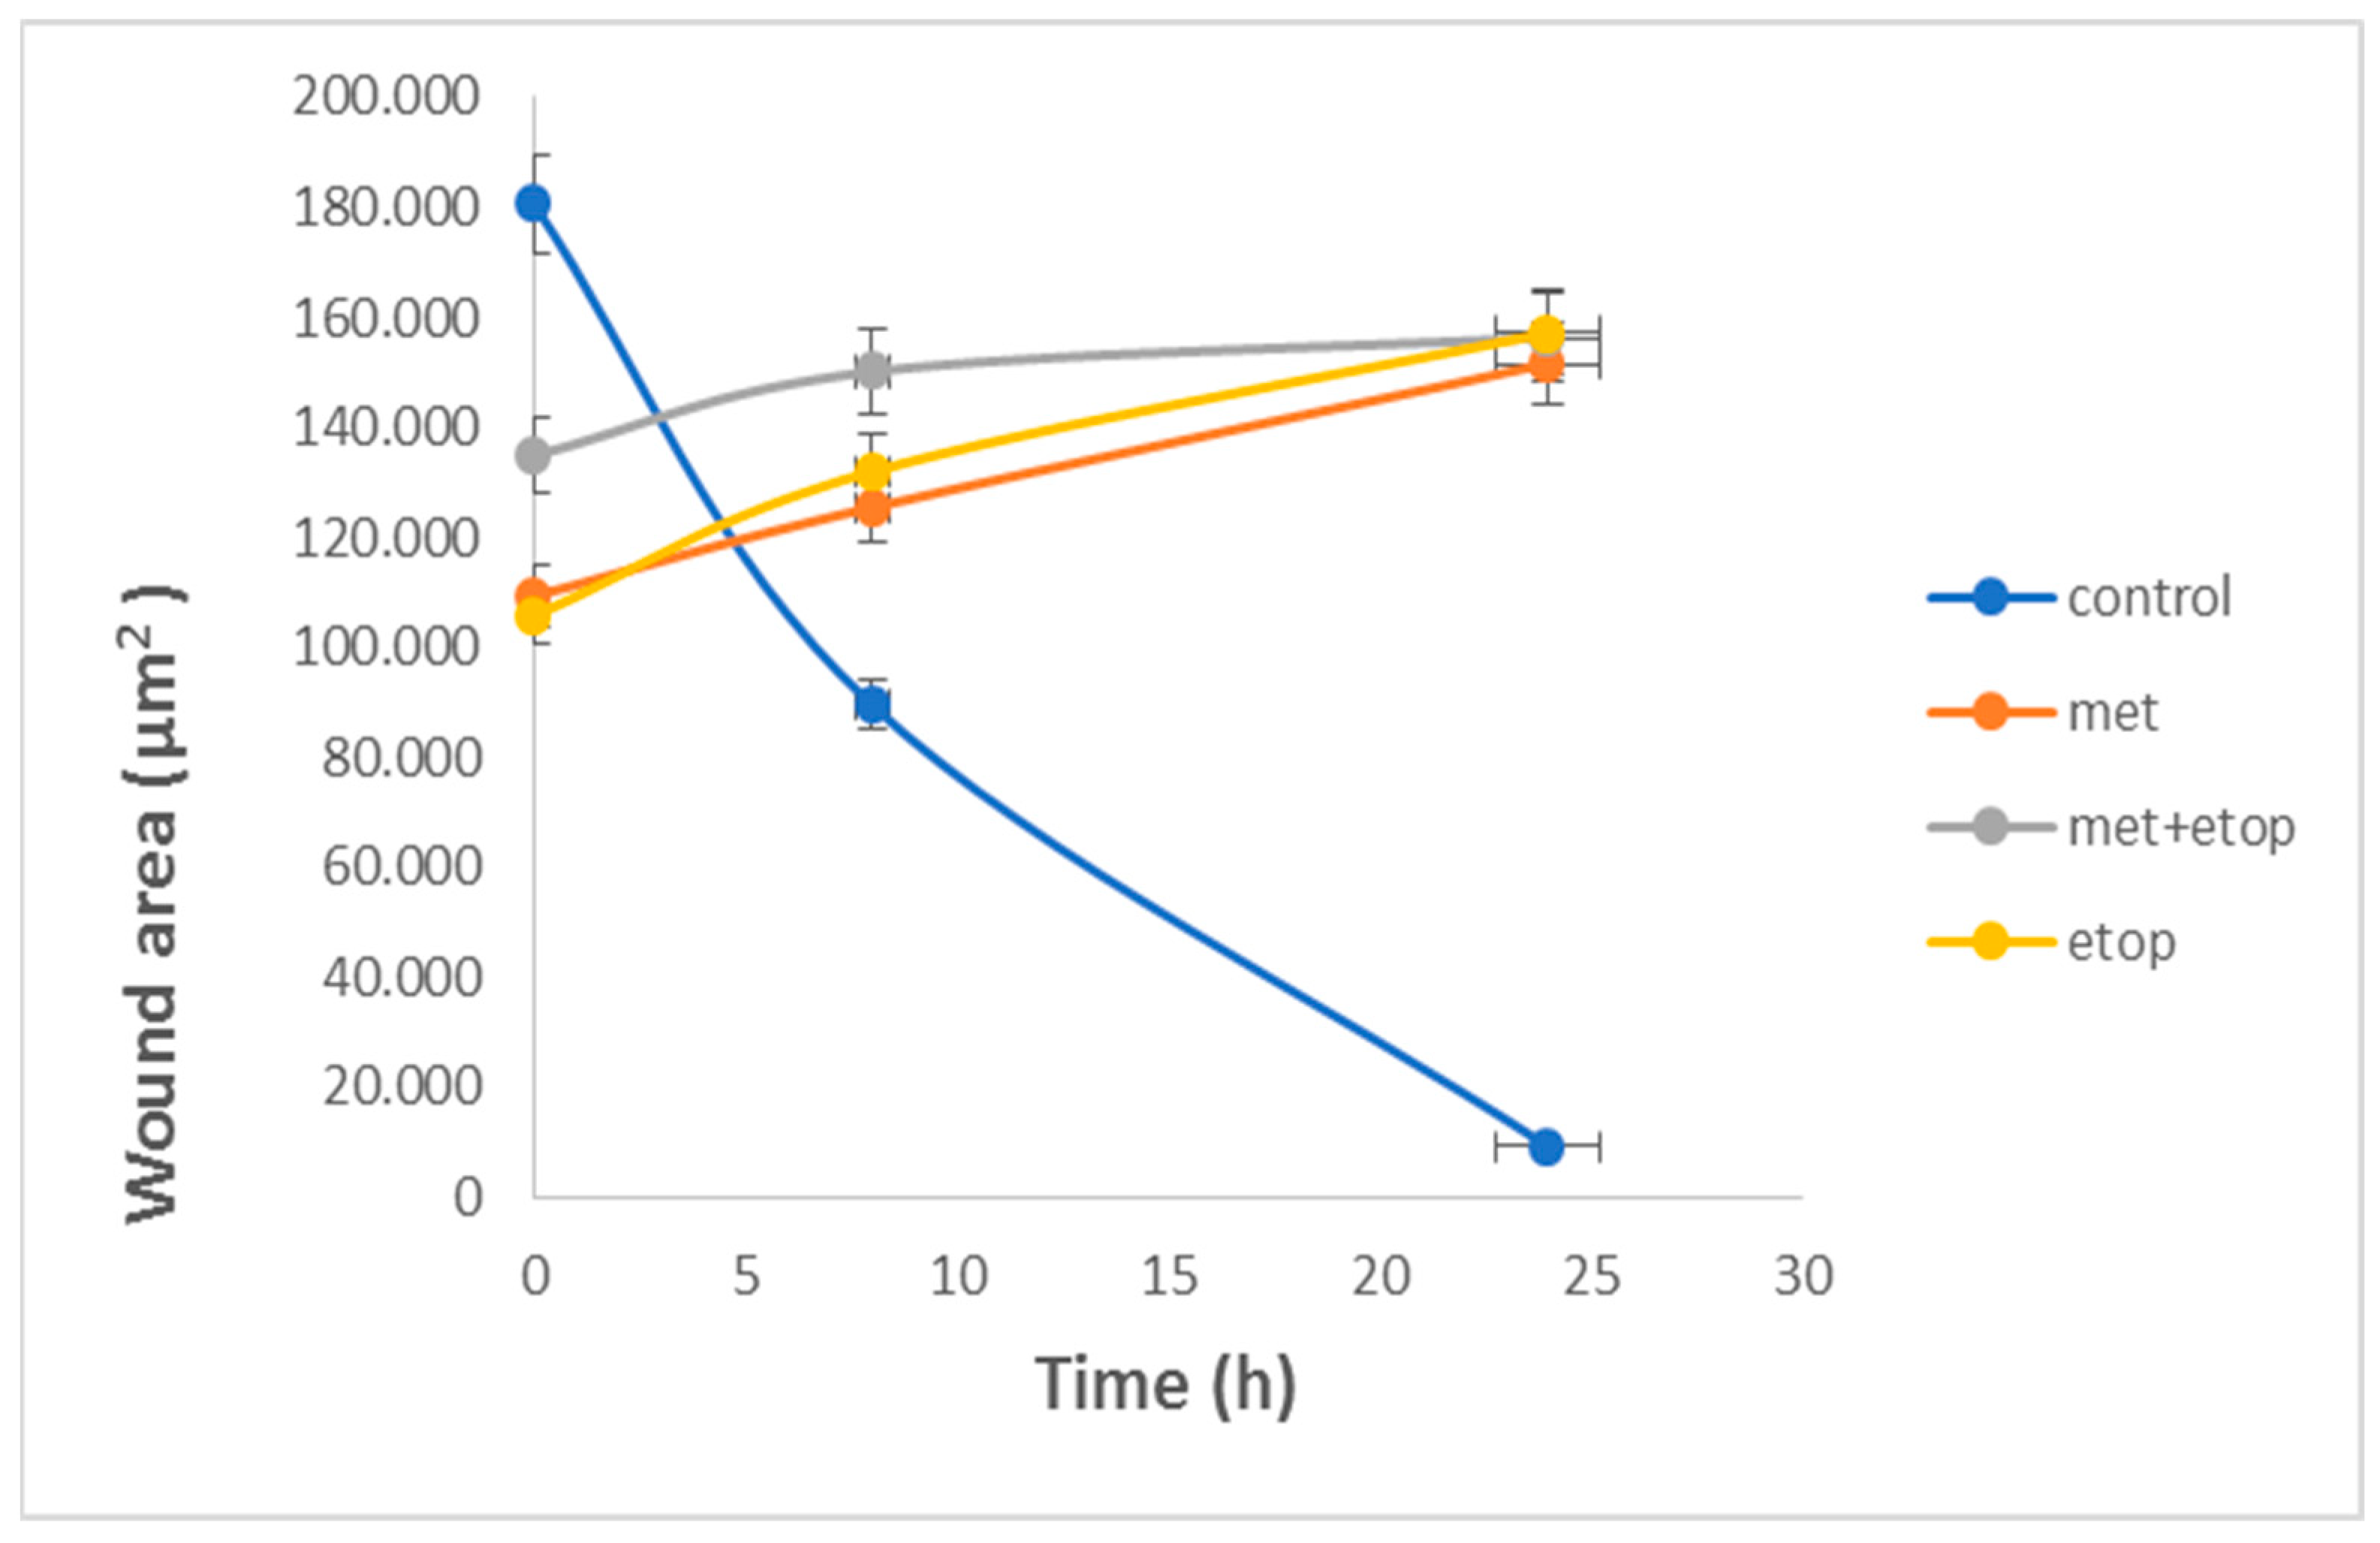
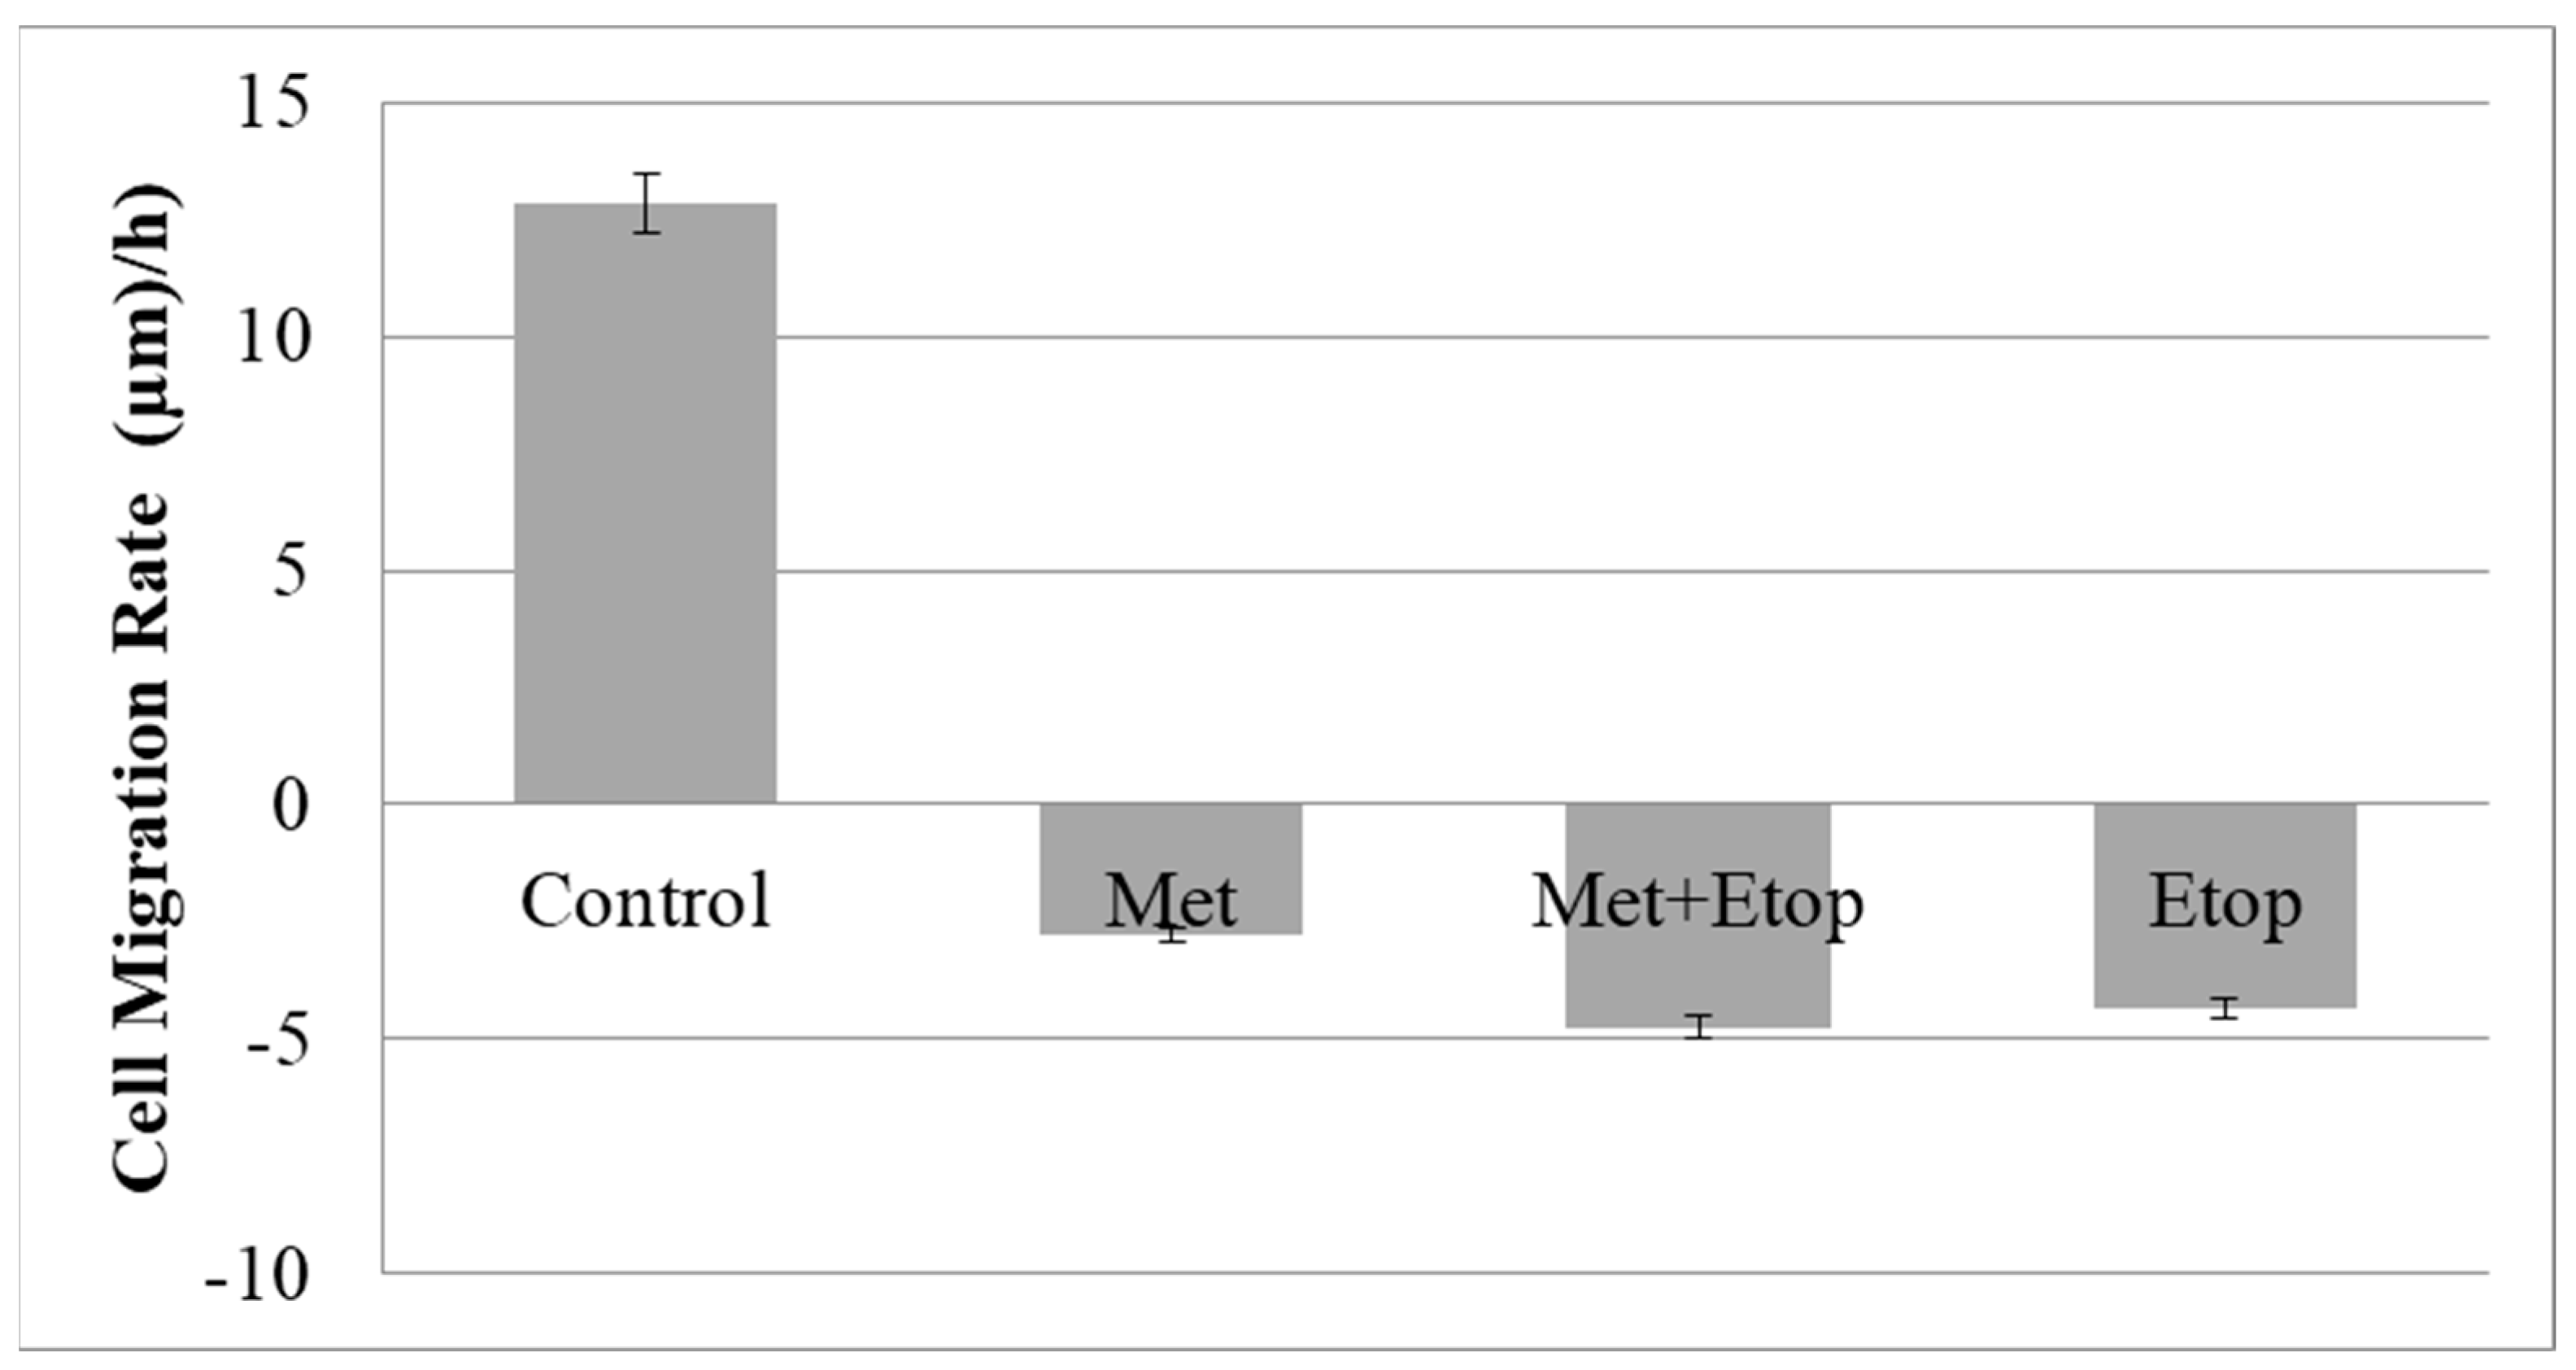
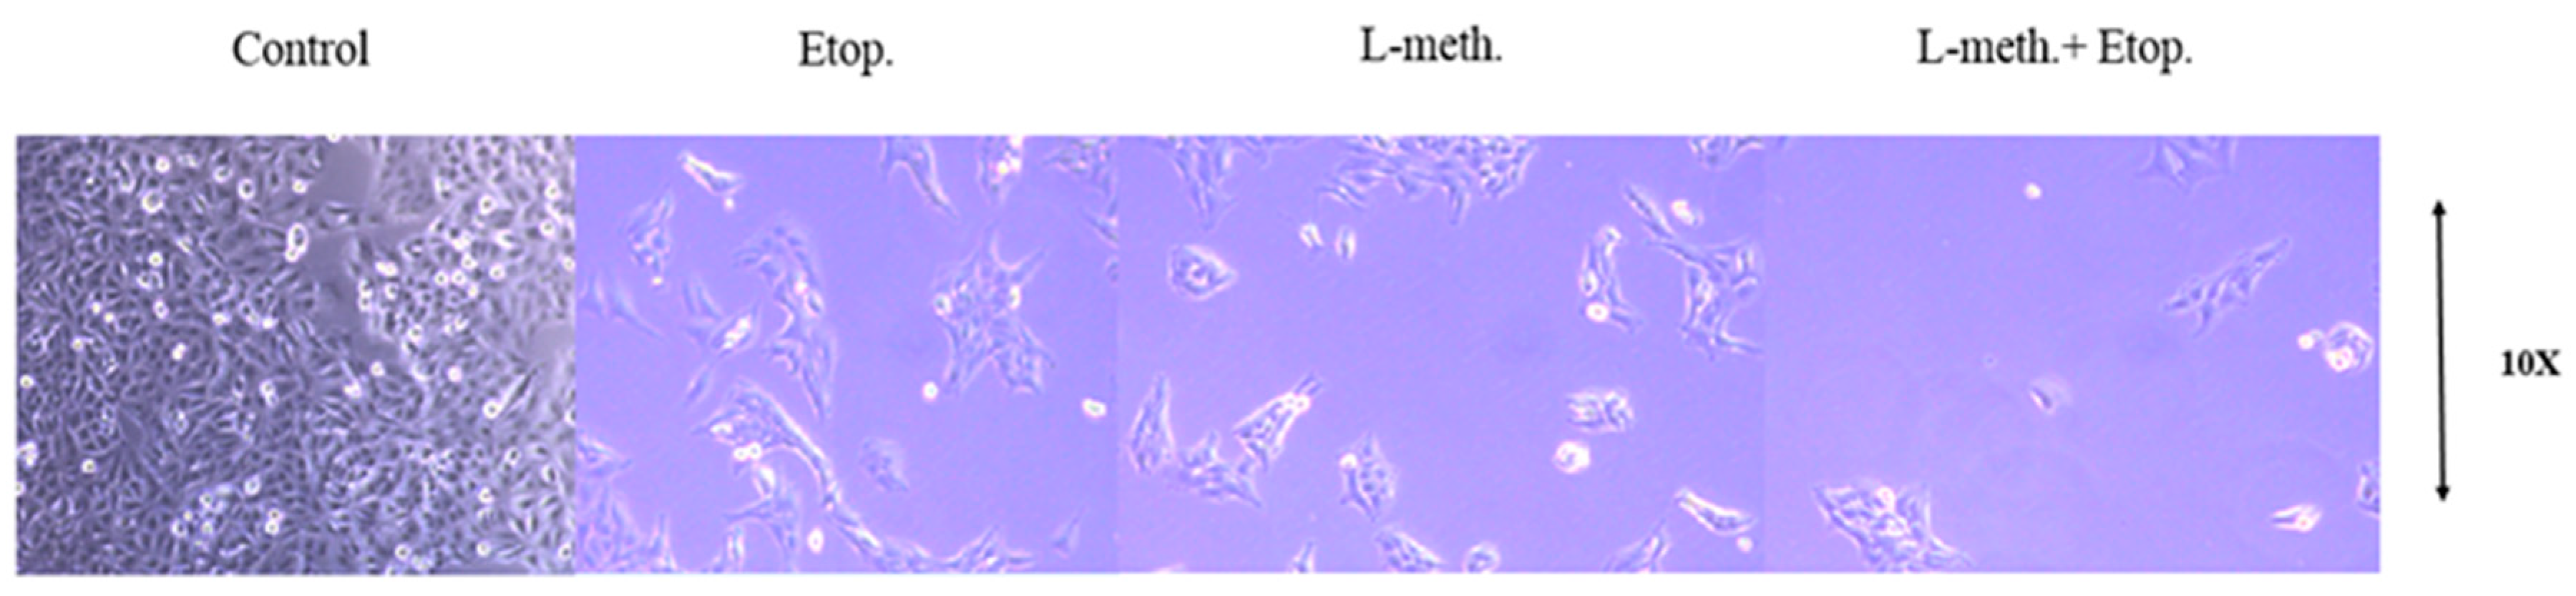
3.6. Evaluation of the Effect of L-Methioninase on Migration Characteristics of Glioblastoma Cells

To evaluate the migratory capabilities of glioblastoma cells in response to L-methioninase, a wound-healing test was performed. L-methioninase application successfully inhibited the migration of U87MG and T98G cells.
For U87MG cells, the photographs taken at 0, 8, and 24 h clearly show that, in the control group, the cells migrated and closed the wound within 24 h. However, in the presence of L-methioninase and etoposide, cell migration was inhibited, and the wound remained open even after 24 h (Figure 7). For T98G cells, the photographs taken at 0, 8, and 24 h clearly show that, in the control group, the cells migrated and closed the wound within 24 h. Similarly, in the presence of L-methioninase and etoposide, cell migration was inhibited, and the wound remained open even after 24 h (Figure 8). These results indicate that L-methioninase can not only induce cytotoxicity against U87MG and T98G cells but also inhibit their migration, which is an important aspect in the treatment of cancer as it can help prevent the dissemination of cancer cells and the formation of metastases.
The migration assay was performed by calculating the wound area and average wound width using ImageJ software. For U87MG cells, the graphs of wound area and average wound width change clearly demonstrate that the presence of L-methioninase, etoposide, and their combination inhibited wound closure over a 24 h period (Figure 9 and Figure 10). A slight increase in the use of both L-methioninase and etoposide, which are cytotoxically powerful, started to kill some cells after 24 h of incubation.
In the control group, cell migration appeared to close the wounds of U87MG cells. However, negative cell migration and wound closure percentages were observed in the experimental groups treated with etoposide and L-methioninase (Figure 11). This observation suggests that the treatments might have resulted in cell death, leading to a decrease in the number of migrating cells, which could have been reopened because of the high cytotoxic effects of L-methioninase and etoposide, which inhibit wound closure.
Wound healing characteristics of T98G cells were observed. The results indcated that L-methioninase and etoposide exhibit similar characteristics like the results in U87MG cells. Wound area change was shown in Figure 12 and avareage wound width change graph was shown in Figure 13. Control cells was completely closed the wound in 24 h. However L-methioninase, etoposide and both inhibited wound closure Cell migration rate in T98G can be seen in Figure 14. L-methioninase and etoposide combination administration significantly inhibited the wound healing characteristics of T98G cells.

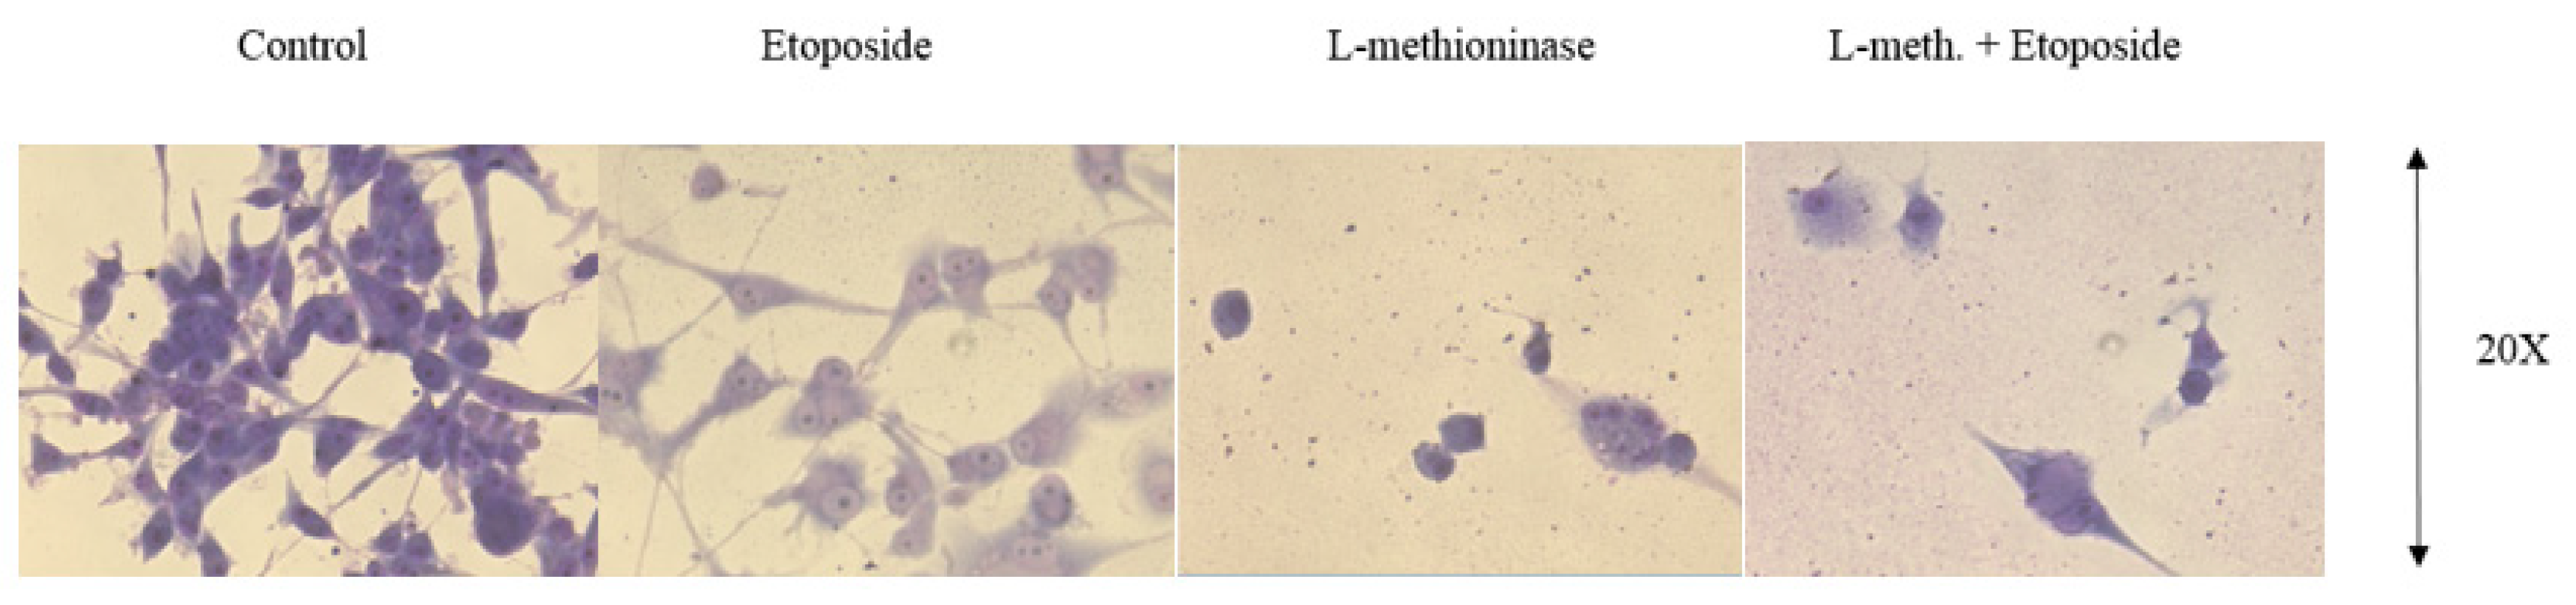
3.7. Giemsa Staining Images of Glioblastoma Cells after L-Methioninase and Etoposide Administration

Giemsa staining was used to observe U87MG and T98G cells during treatment with L-methioninase, and etoposide indicated significant morphological changes and cytotoxic activity in the cells. The star-shaped cells eventually disappeared, and the cells became individual and weakened. This change suggests that treatment with L-methioninase and etoposide affects the cytoskeletal organization and cellular adhesion of glioblastoma U87MG and T98G cells. In addition, some cells became round in shape. This change in cell shape is often associated with cellular stress and the induction of programmed cell death. The rounding-up of cells can be indicative of the cytotoxic effects of L-methioninase and etoposide on treated cells. Furthermore, the number of cells decreased sharply. This suggested that the cytotoxic activity of L-methioninase and etoposide led to a significant reduction in the number of viable cells. Morphology changes after giemsa staining can be seen for both U87MG and T98G cells (Figure 15 and Figure 16).
Before performing Giemsa staining, the cells were observed to ensure that they were in a similar state and had comparable characteristics (Figure 17 and Figure 18).

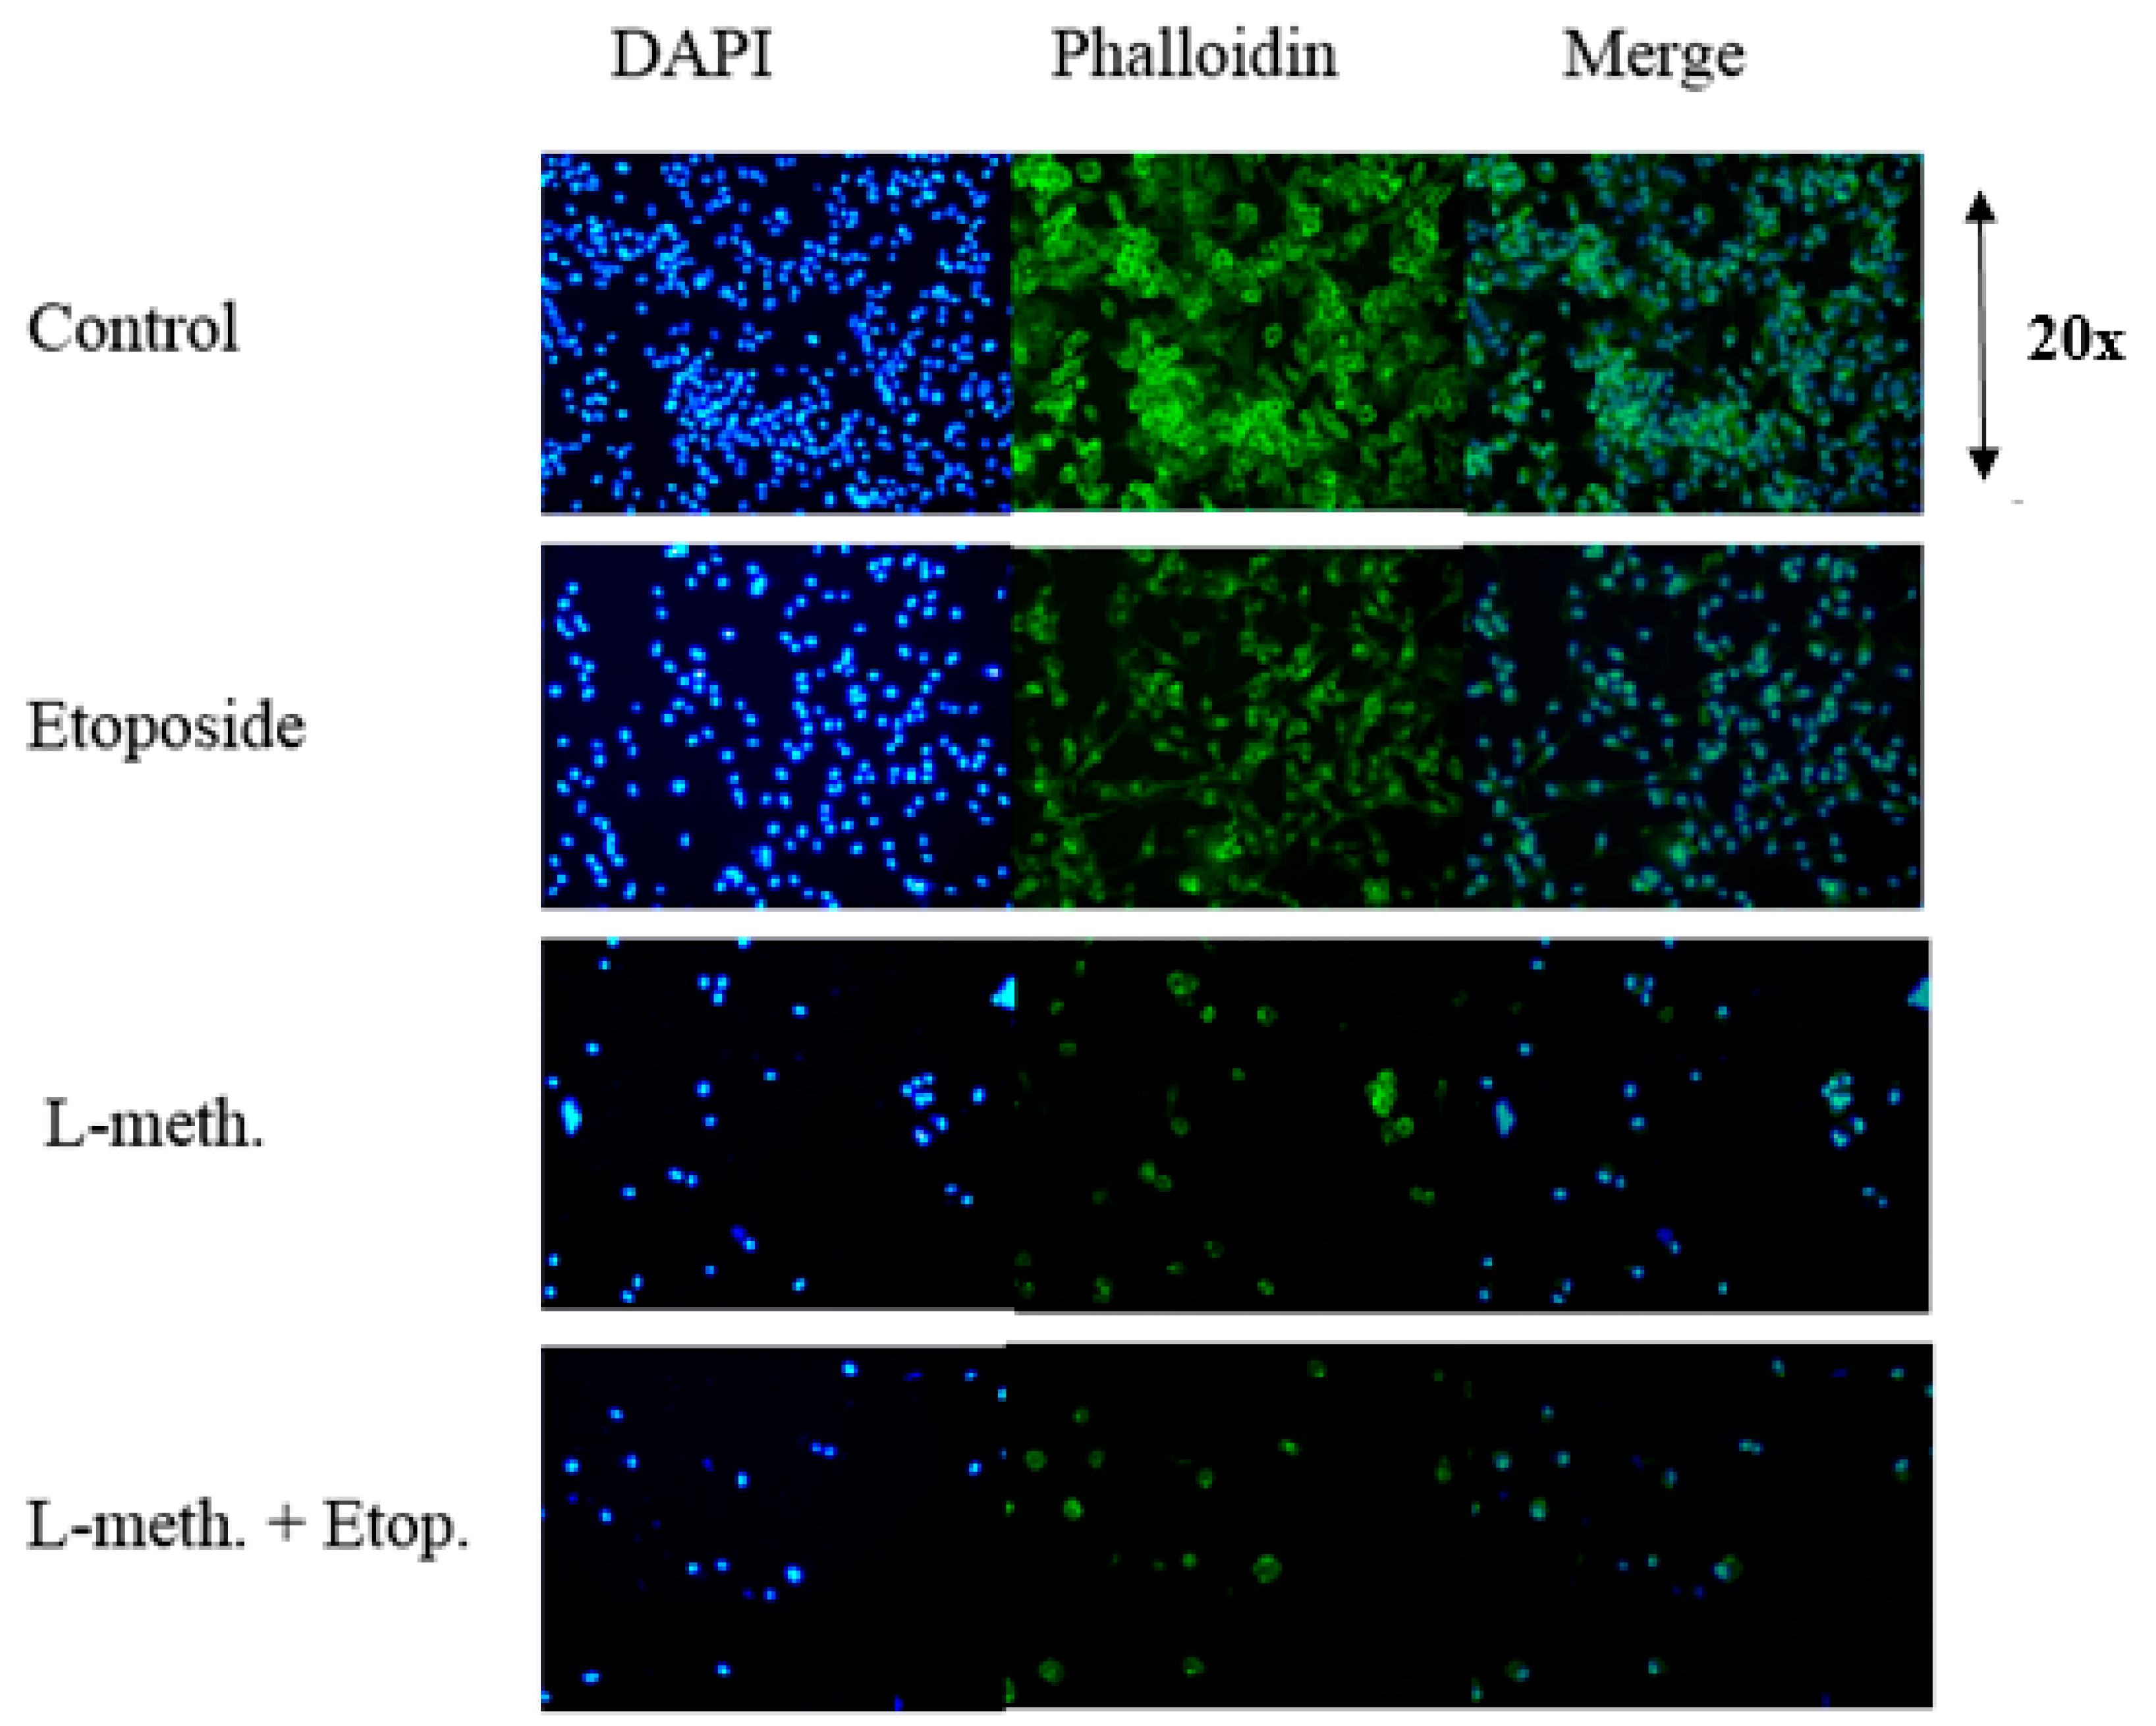
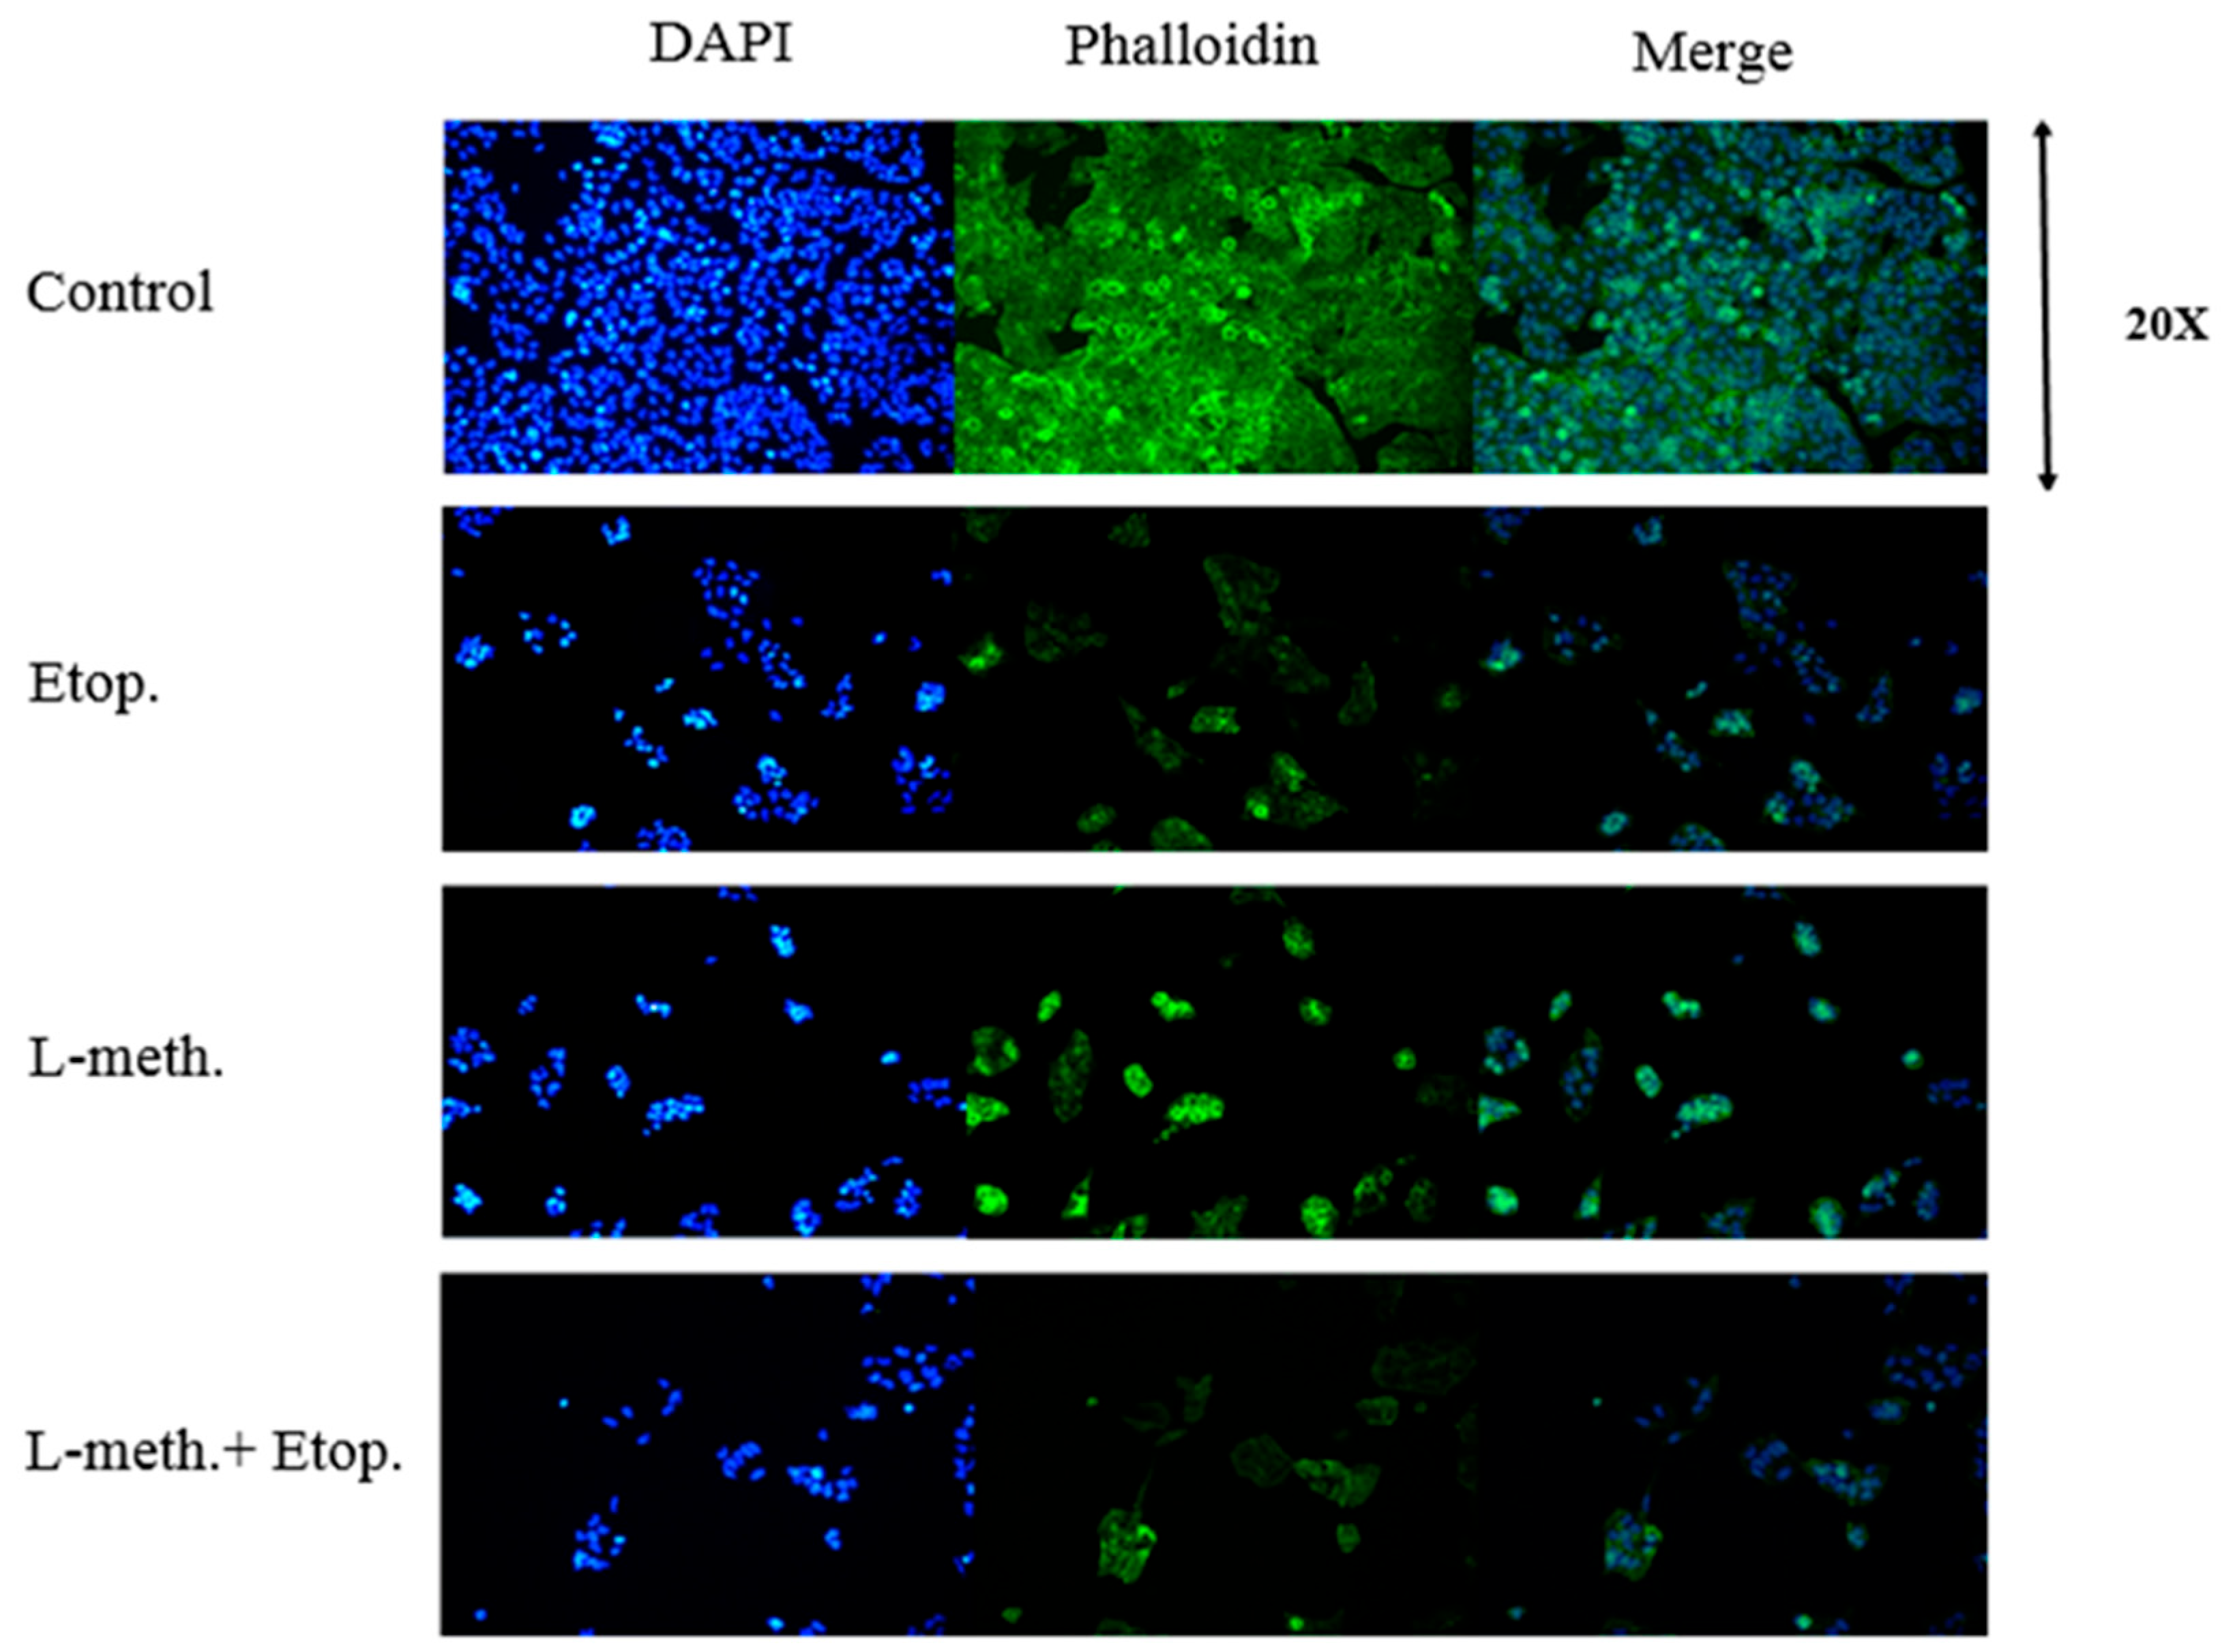
3.8. DAPI and F-Actin Staining Images after L-Methioninase and Etoposide Administration

DAPI and F-actin staining were performed to examine the cellular nuclei and organization of the actin cytoskeleton, respectively. L-methioninase and etoposide were administered to the cells in 24 well plates, and the cells were cultured for 24 h. At the end of the 24 h incubation period, the fluorescence intensity of the cells was examined using a Leica DM IL LED inverted microscope (Leica Biosystems). Treatment with L-methioninase resulted in a significant decrease in the population of nuclei, indicating a potential reduction in cell viability or the induction of cell death, such as apoptosis. Additionally, F-actin filaments exhibited a rounded shape, which is often associated with the cellular changes observed during apoptosis. Furthermore, the star-shaped morphology characteristic of glioblastoma cells appeared after treatment with L-methioninase and etoposide, suggesting an alteration in the cellular structure and the possible disruption of cell processes. The integrity of fluorescent nuclei and filaments changed with the treatment of L-methioninase, etoposide, and their combination (Figure 19 and Figure 20). This could indicate alterations in gene expression, protein levels, and cellular responses associated with treatment.

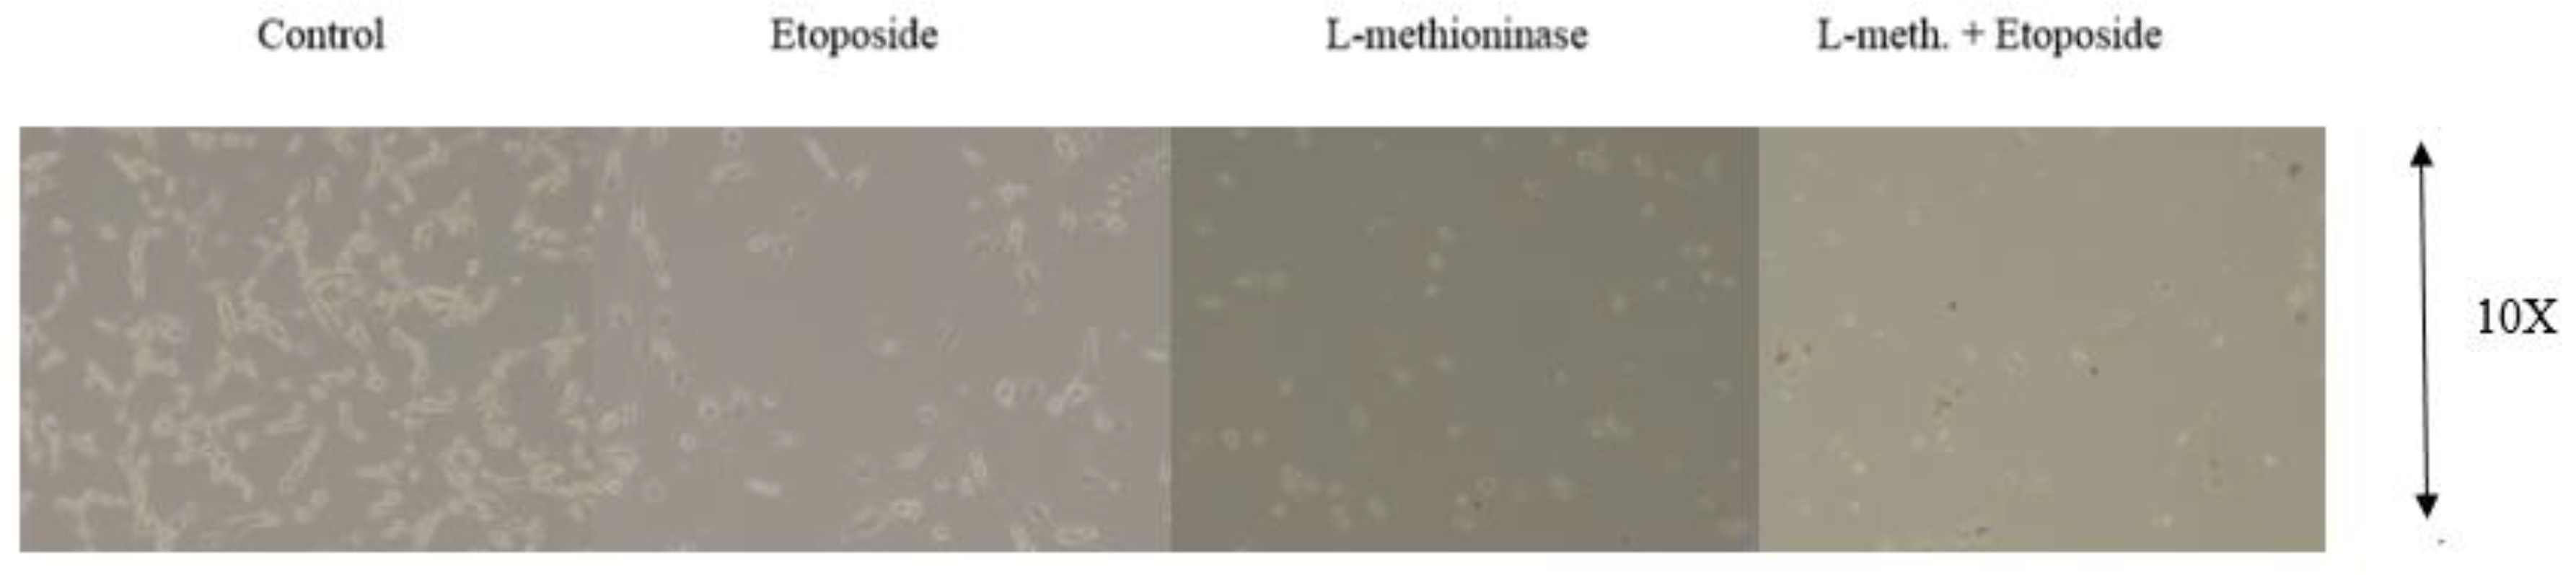
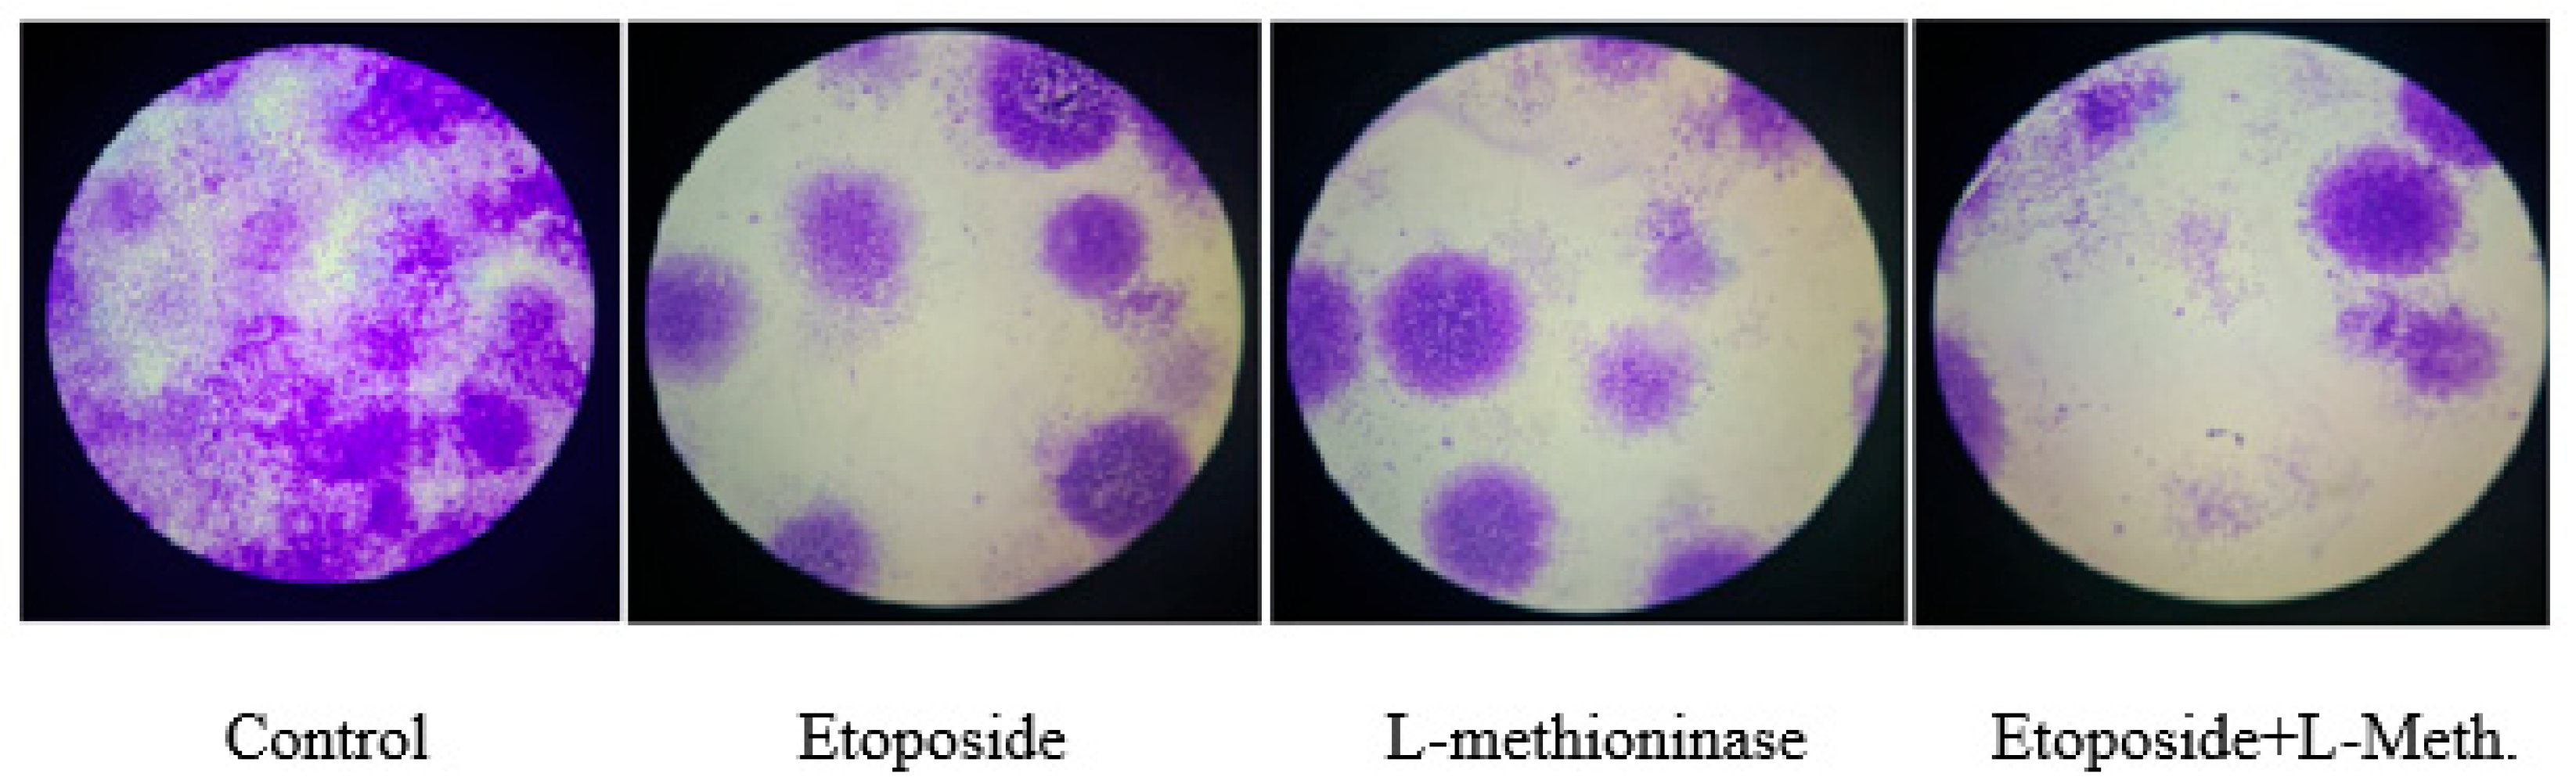
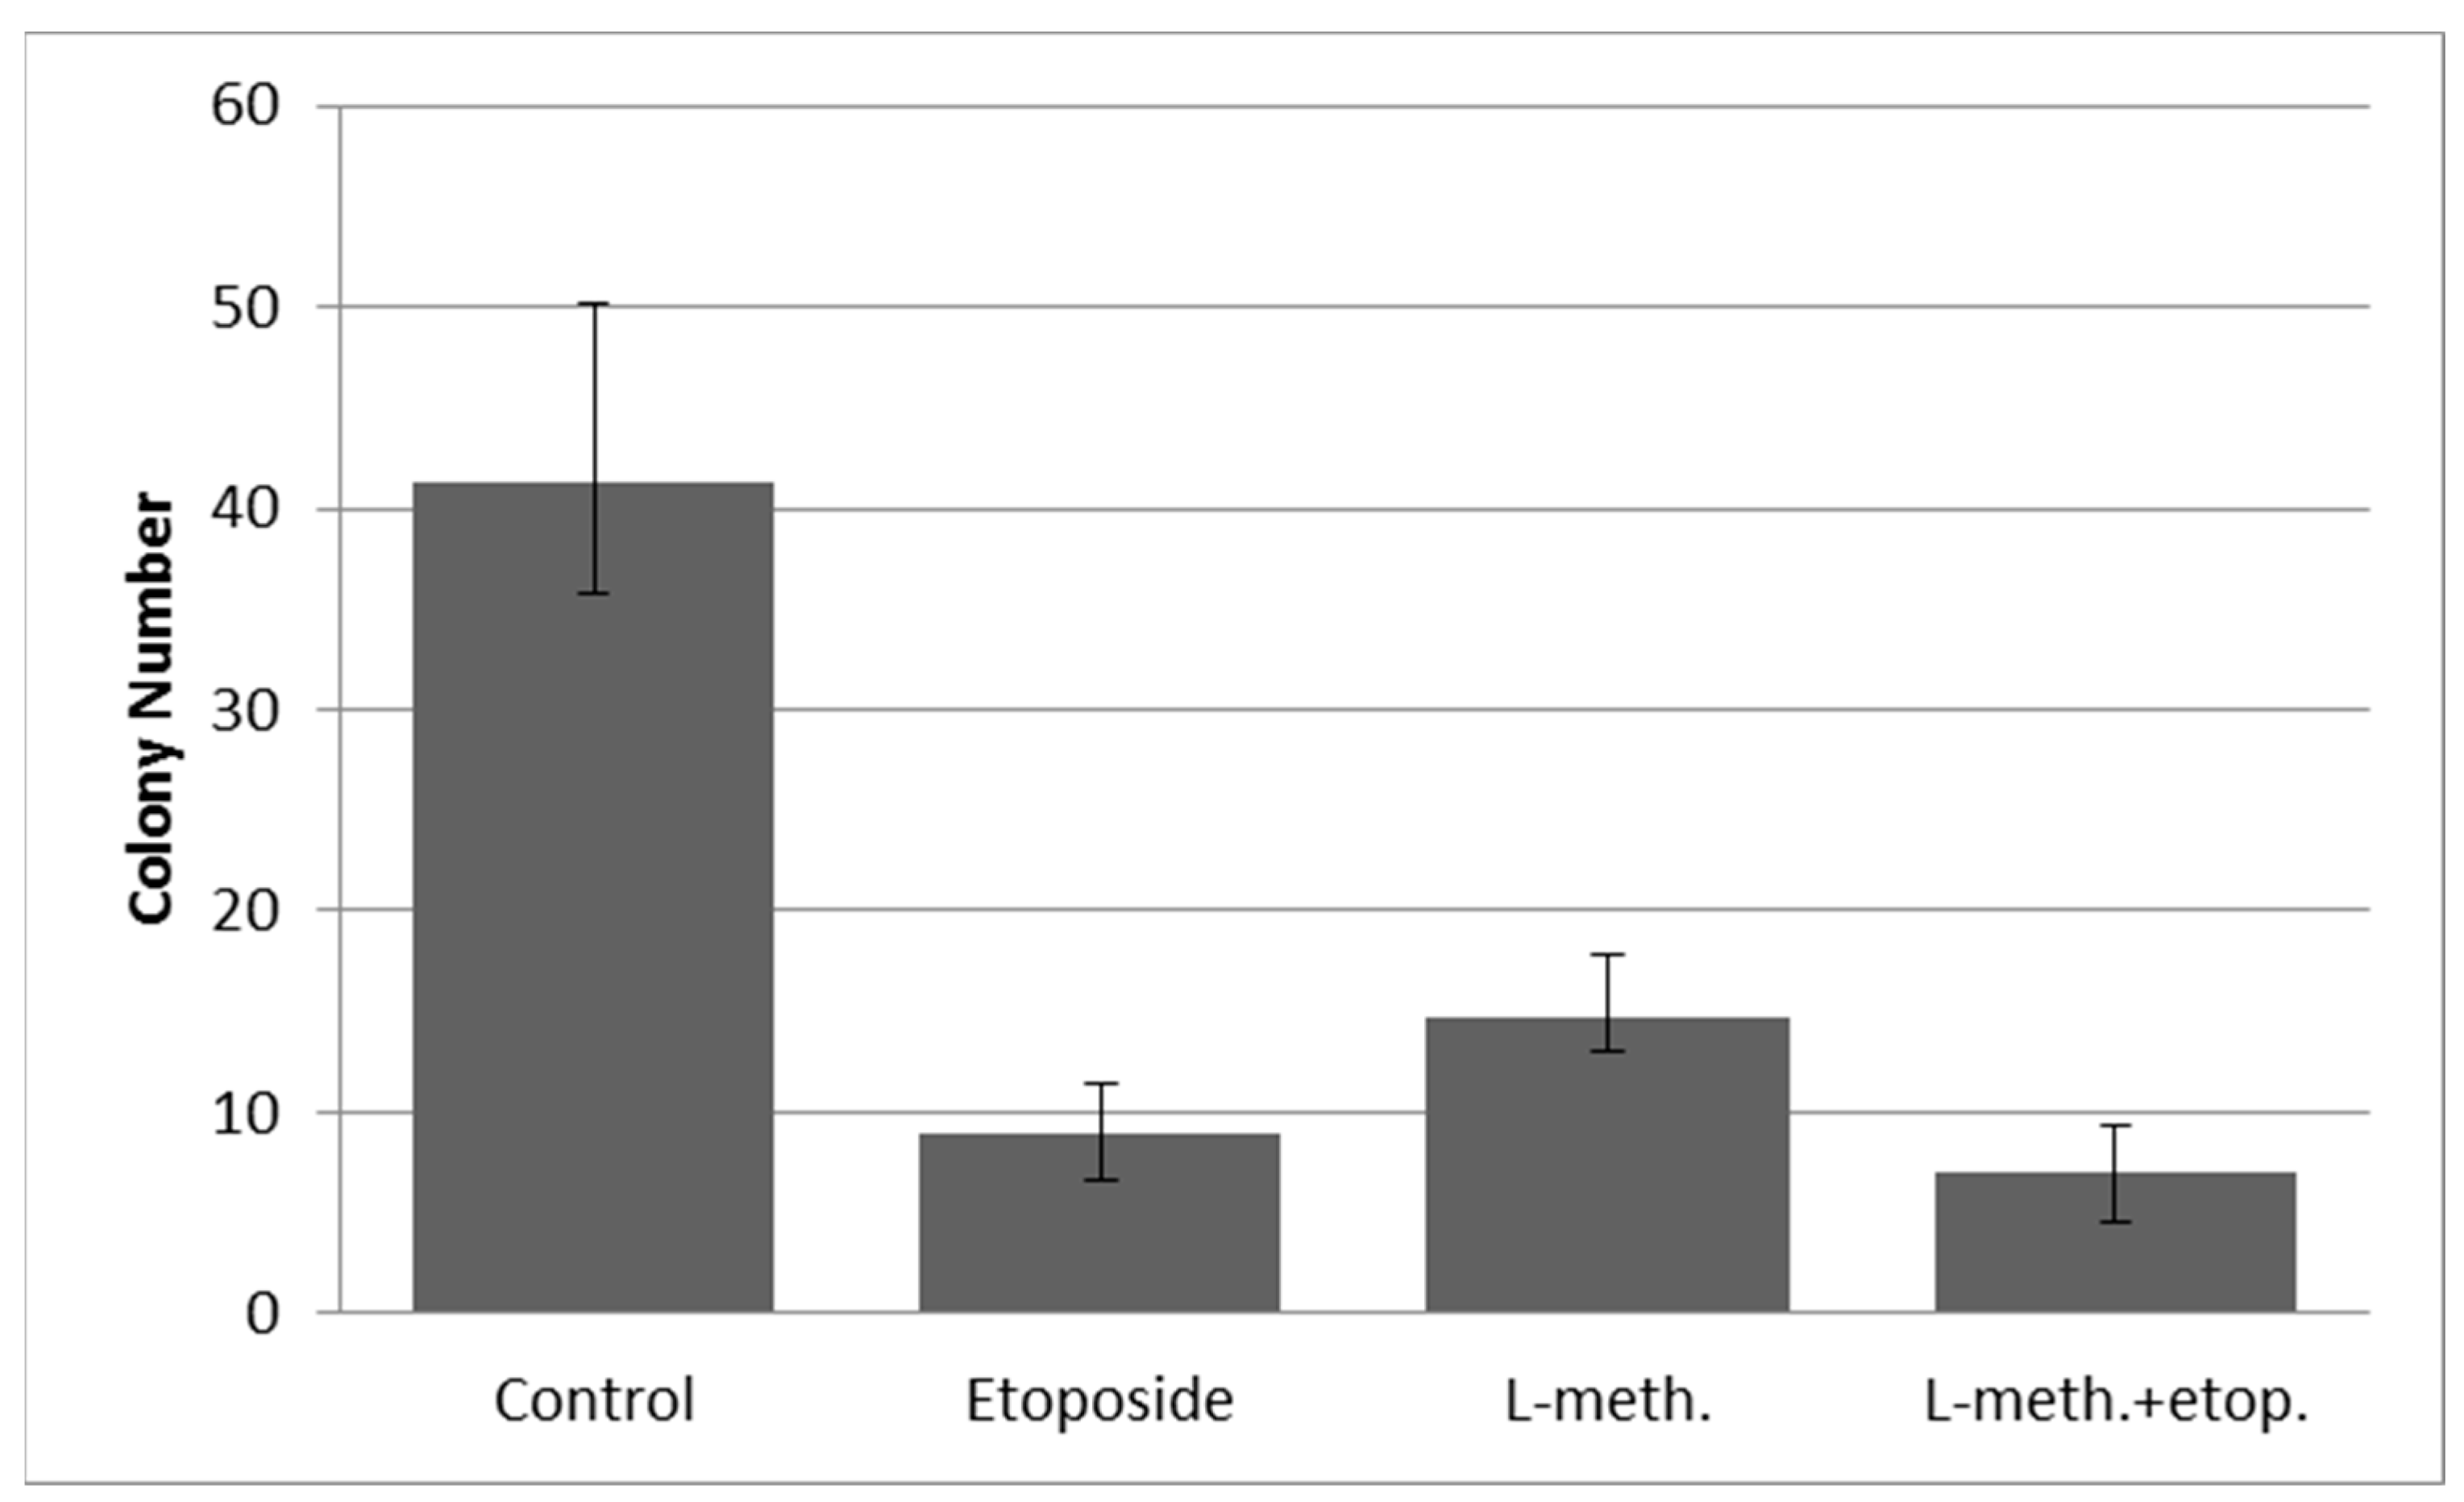
3.9. Clonogenic Assay Images and Colony Numbers after L-Methioninase and Etoposide Administration

A colony formation assay was performed to evaluate the proliferative and clonogenic potential of U87MG cells treated with etoposide, L-methioninase, or their combination. The incubation of U87MG cells with L-methioninase resulted in a significant reduction in colony formation. After three weeks of incubation, the number of colonies formed by U87MG cells decreased sharply (Figure 21).
The observed decrease in colony numbers after incubation with L-methioninase indicated that the enzyme effectively inhibited the clonogenic growth of U87MG cells. This reduction in colony formation suggests that L-methioninase exerts a suppressive effect on the proliferative capacity and survival of these cells. The precise mechanisms by which L-methioninase inhibits colony formation in U87MG cells might involve various factors, including the induction of cell cycle arrest, apoptosis, or the disruption of vital cellular processes that are necessary for colony growth. Colony number change in U87MG cells under the effect of L-methioninase and etoposide and both administration was shown in Figure 22.

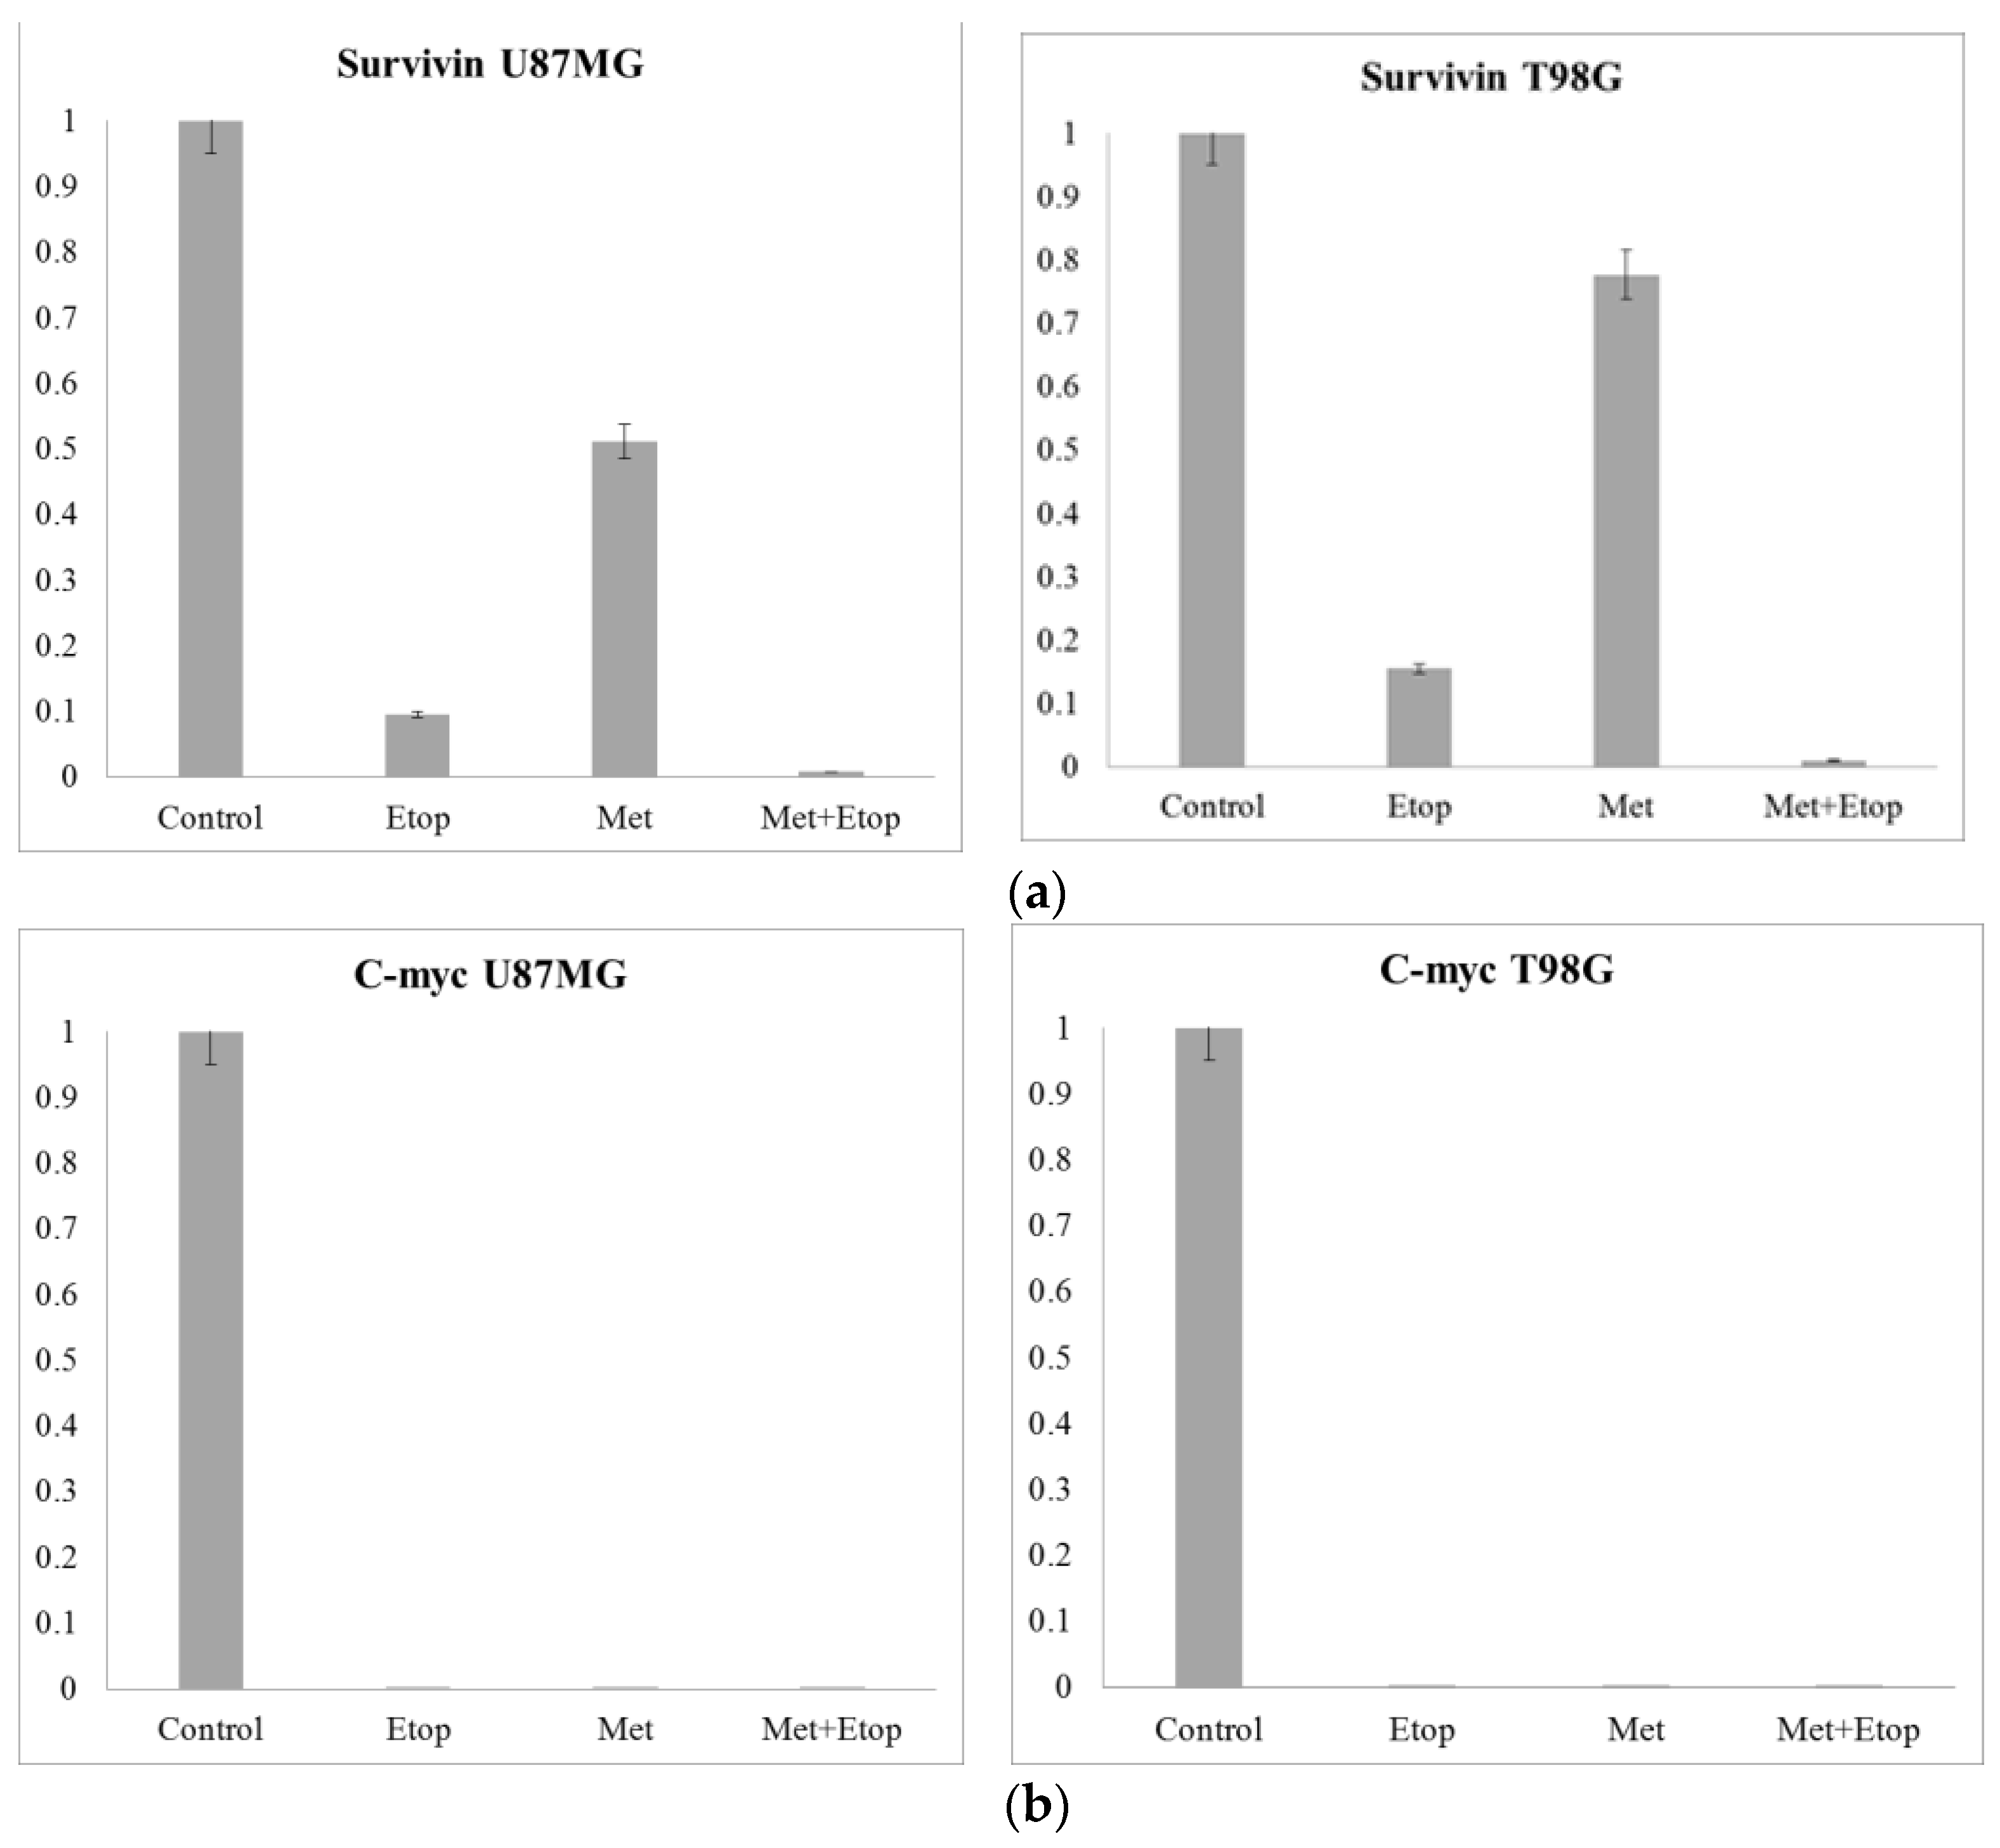
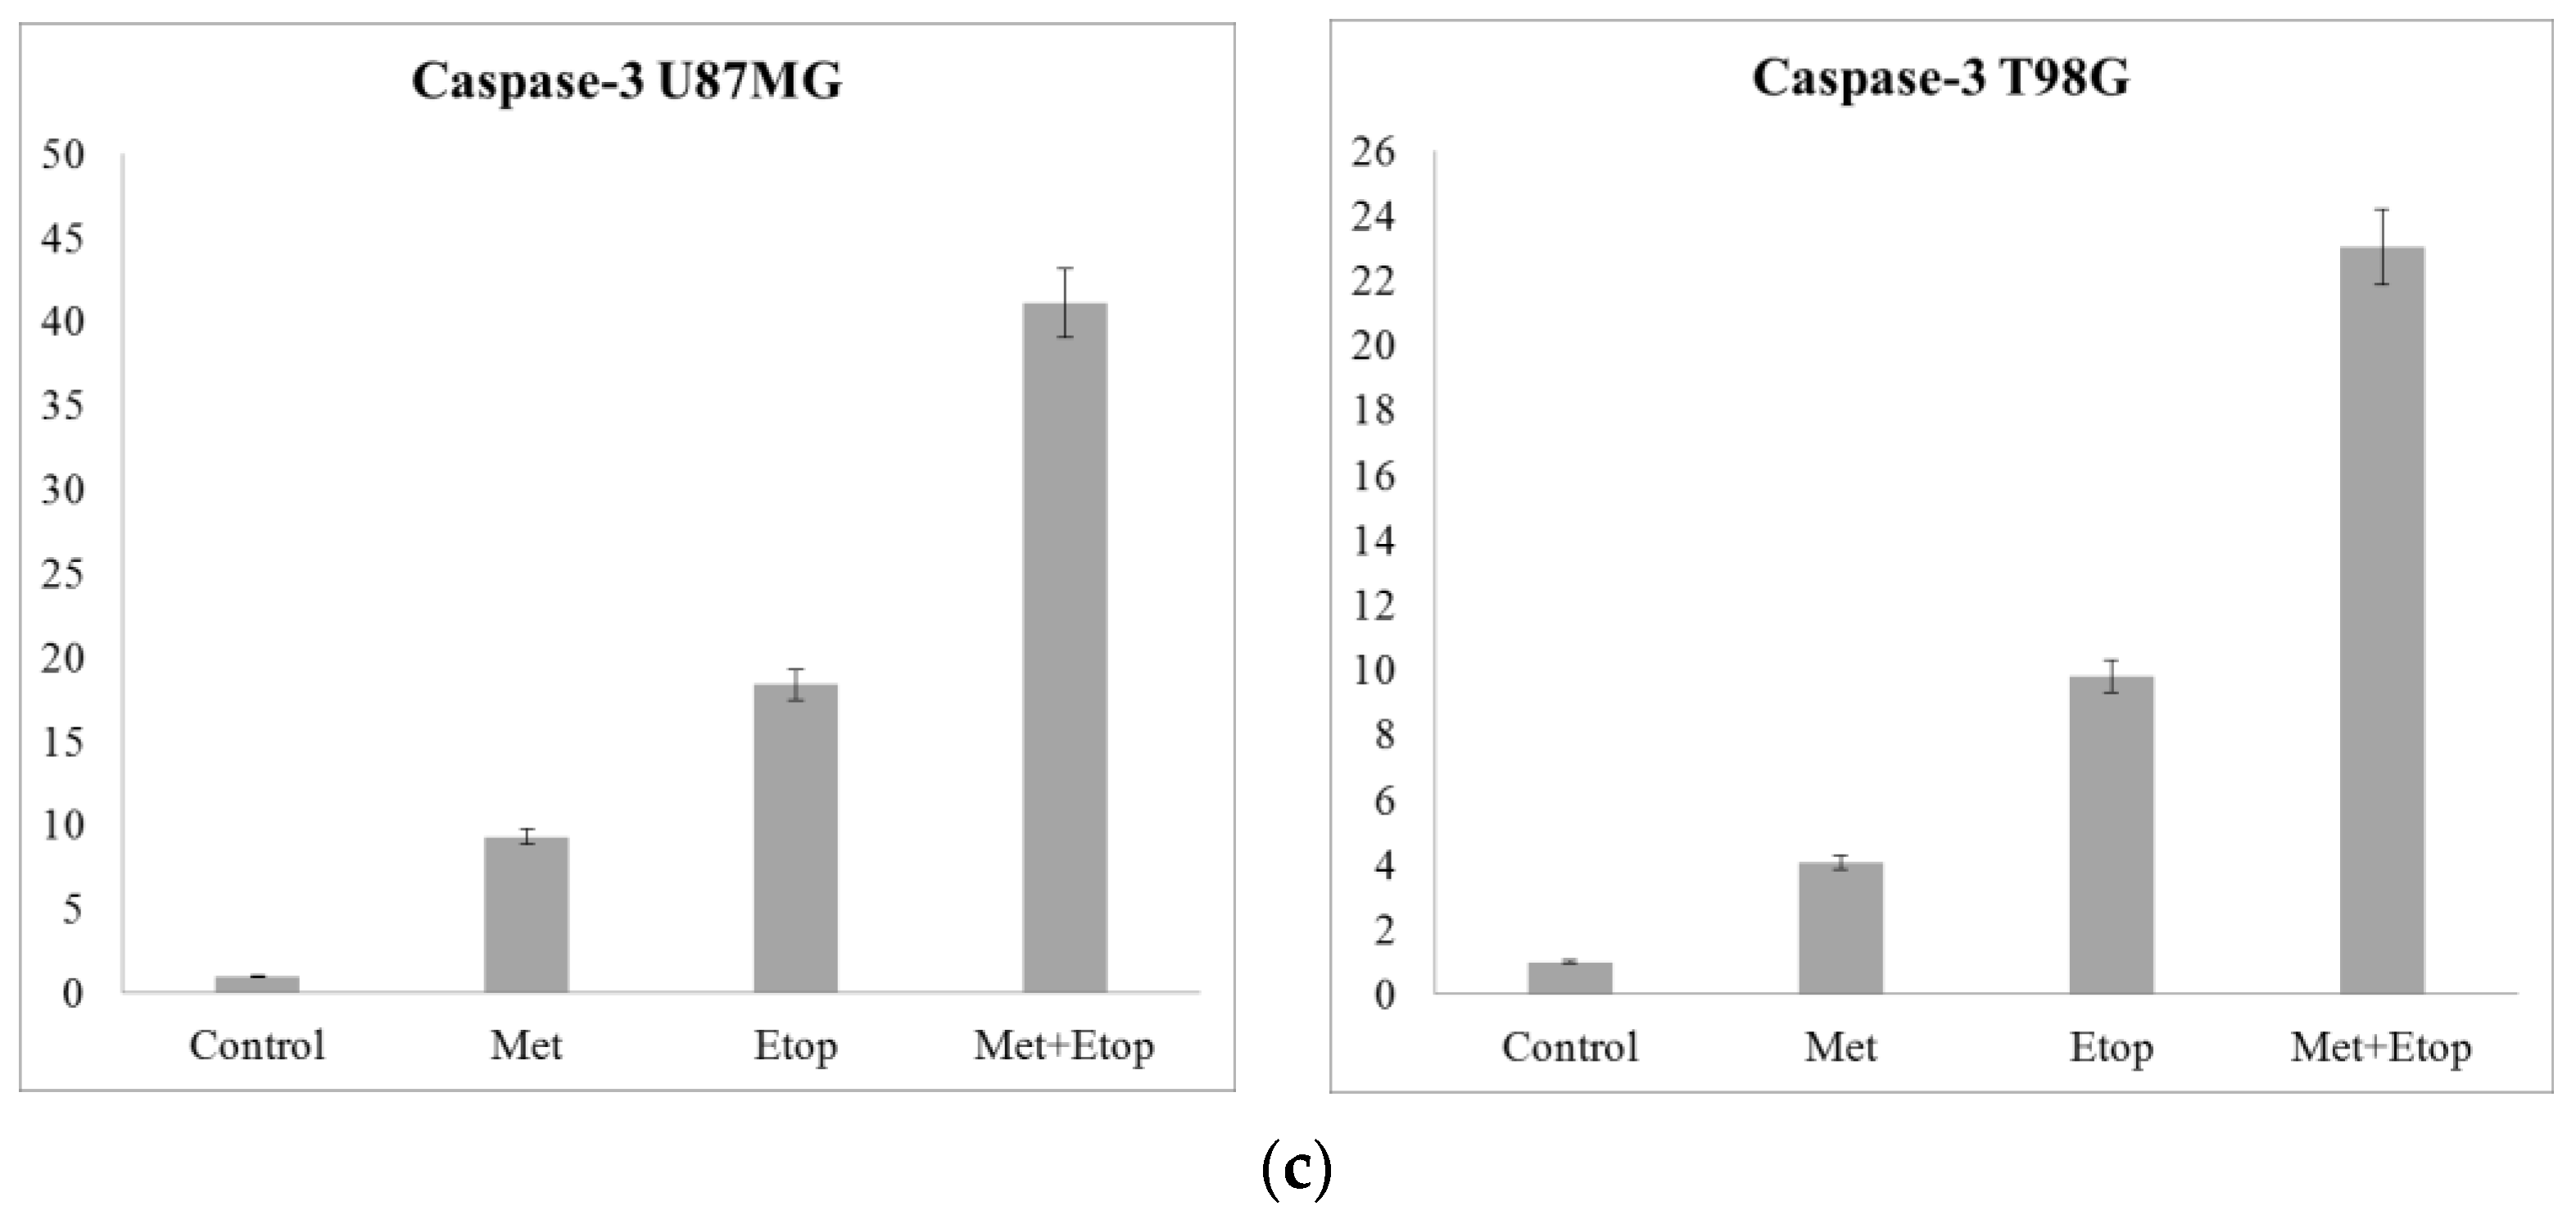
3.10. RT-qPCR Results

RT-qPCR was performed to analyze the expression levels of survivin, C-Myc, and Caspase 3 gene expression levels in U87MG and T98G cells treated with etoposide, L-methioninase, and their combination.
Survivin, also known as the baculoviral inhibitor of apoptosis repeat-containing 5 (BIRC5), is an anti-apoptotic protein that is highly expressed in cancer cells, including glioblastoma and contributes to their survival and resistance to cell death [36,37]. It regulates cell cycle progression, prevents apoptosis, and causes chromosomal instability [38,39]. Survivin plays an important role in apoptosis and cell division [40]. Survivin is an anti-apoptotic protein that is responsible for the inhibition of Caspase 3 and 7 [41,42], and the downregulation of survivin expression is associated with cytotoxic conditions [43,44,45]. The overexpression of survivin in cancer cells is a suitable target for cancer treatment [46]. Because of its importance in the regulation of apoptosis, the alteration in mRNA expression was assessed in U87MG and T98G cells subjected to a 24 h culture with L-methioninase and etoposide. The graph in Figure 23a clearly demonstrates a significant decrease in survivin’s expression when treated with L-methioninase, etoposide, and the combined treatment. The combination of L-methioninase and etoposide almost completely inhibited survivin’s expression. The decreased expression of Survivin mRNA following treatment suggests that these treatments successfully target the anti-apoptotic pathway, potentially leading to increased apoptosis and decreased cell survival.
c-Myc is an oncogene that regulates cell proliferation and is frequently overexpressed in various human carcinomas, including glioblastoma [47,48,49]. The dysregulation of processes such as transcription, translation, or protein stability is often attributed to the overexpression of c-Myc in these cancers [50,51]. A reduction in c-Myc expression can lead to apoptosis or the inhibition of cell growth [52]. In this study, it was observed that L-methioninase, etoposide, and its combined treatment resulted in the complete inhibition of c-Myc expression in U87MG and T98G cells after 1 d of culture (Figure 23b). c-Myc is a key regulator of cell proliferation, and its downregulation suggests that this treatment affects the pathways involved in cell growth and division. The inhibition of c-Myc expression can lead to cell cycle arrest and reduced proliferation rates [53].
Based on these findings, the combined treatment of L-methioninase and etoposide appears to have a synergistic effect on decreasing the expression levels of c-Myc and survivin, potentially leading to decreased cell proliferation and enhanced apoptosis in U87MG and T98G cells. This provides further evidence of the therapeutic potential of this combination in targeting the key molecular pathways involved in cancer cell survival and growth.
These findings are consistent with the literature, which reported that L-methioninase could downregulate survivin expression. Similar effects have been observed with the use of methylselenocysteine in prostate cancer cells [54].
Caspase-3 is an important protein involved in the execution phase of apoptosis and activates and cleaves various cellular substrates, leading to characteristic apoptotic changes, such as DNA fragmentation, cytoskeletal reorganization, and the formation of apoptotic bodies [55,56]. Evaluating the expression levels of Caspase-3 can provide insights into the apoptotic response and efficacy of apoptosis-inducing treatments. In this study, etoposide and L-methioninase induced the expression of Caspase-3. Furthermore, the combined treatment resulted in an increased expression compared to the individual treatments (Figure 23c). These findings are consistent with a recent study reporting that partially purified L-metihoninase from Methylobacterium sp. is concurrent with tamoxifen, which increased Caspase-3 expression levels in breast cancer in athymic nude mice [57]. In our findings, the down-regulation of survivin and C-myc expressions, along with the induction of Caspase-3 expression, suggest that combined treatment with L-methioninase and etoposide has the potential to induce apoptosis and inhibit the survival and proliferation of glioblastoma cells. These findings support the therapeutic potential of L-methioninase and the combination treatment approach in oncology.
Although L-methioninase shows promise as a targeted therapy, its effectiveness can be influenced by the complexity of glioblastoma tumors and the tumor microenvironment. Challenges include tumor heterogeneity leading to varied responses, limitations in delivering therapeutic agents due to the blood–brain barrier, and potential interference from the immune system, which could degrade or neutralize enzymes. To address these challenges, a comprehensive understanding of glioblastoma biology, its microenvironment, and the interactions between cancer cells and the surrounding cells is needed. This knowledge could lead to the development of combination therapies that target multiple aspects of tumor growth and resistance mechanisms. Additionally, advancements in drug delivery techniques can improve the delivery of L-methioninase or other therapeutics to the tumor site.

4. Conclusions

In this study, L-methioninase was partially purified from Brevibacterium linens BL2. This enzyme exhibited cytotoxic activity against glioblastoma U87MG and T98G cells, indicating its potential as an anticancer agent. However, it showed less cytotoxic activity against MEF and HaCaT cells, suggesting a relative selectivity in its action. Furthermore, L-methioninase reduced the cytotoxic effects of etoposide on MEF and HaCaT cells. When used in combination, etoposide, and L-methioninase exhibited enhanced cytotoxicity against glioblastoma U87MG and T98G cells compared with their individual effects. L-methioninase and etoposide, whether used individually or in combination, were found to downregulate the expression of c-Myc and survivin, which are known for their anti-apoptotic properties. Additionally, both L-methioninase and etoposide, whether used individually or in combination, increased the expression of Caspase-3, suggesting that combined treatment with L-methioninase and etoposide promotes apoptotic pathways in cancer cells. Migration assays and colonyogenic assays demonstrated that L-methioninase and etoposide could stop the migration of U87MG and T98G cells and the formation of colonies in U87MG cells. These findings highlight the effectiveness of L-methioninase isolated from Brevibacterium linens BL2 in combination with etoposide as a potential therapeutic option for glioblastoma treatment. However, more studies are needed to explore the cytotoxicity of L-methioninase from various sources in different cell lines in future studies.

Author Contributions

Visualization, S.L.İ., M.D.Ö. and D.G.; Investigation, S.L.İ., M.D.Ö. and D.G.; Project administration, D.G. Methodology, S.L.İ., M.D.Ö. and D.G.; Writing—original draft, S.L.İ. M.D.Ö. and D.G.; Data curation, D.G.; Writing—review and editing, S.L.İ., M.D.Ö. and D.G.; Funding acquisition, D.G.; Supervision, D.G.; Software, D.G. All authors have read and agreed to the published version of the manuscript.

Funding

This study was supported by the Adana Alparslan Türkeş Science and Technology University Scientific Research Projects Unit with 21103010 and 21803002 project numbers and the TUBITAK 2211-C Biotechnological Drugs Technology Priority Research Area Domestic Scholarship Program.

Institutional Review Board Statement

Not applicable.

Informed Consent Statement

Not applicable.

Data Availability Statement

Data reported in this study are available in this article.

Acknowledgments

The authors acknowledge TUBITAK and the ATU Scientific Research Projects unit for their financial assistance in this study. The authors acknowledge that Chr. Hansen Company donated the Brevibacterium linens BL2 strain for this study.

Conflicts of Interest

The authors declare no conflict of interest.

References

  1. Hoffman, R.M. Altered methionine metabolism, DNA methylation and oncogene expression in carcinogenesis: A review and synthesis. Biochim. Biophys. Acta Rev. Cancer 1984, 738, 49–87. [Google Scholar] [CrossRef] [PubMed]
  2. Mecham, J.O.; Rowitch, D.; Wallace, C.D.; Stern, P.H.; Hoffman, R.M. The metabolic defect of methionine dependence occurs frequently in human tumor cell lines. Biochem. Biophys. Res. Commun. 1983, 117, 429–434. [Google Scholar] [CrossRef] [PubMed]
  3. Hoffman, R.M. Development of recombinant methioninase to target the general cancer-specific metabolic defect of methionine dependence: A 40-year odyssey. Expert. Opin. Biol. Ther. 2015, 15, 21–31. [Google Scholar] [CrossRef] [PubMed]
  4. Kawaguchi, K.; Miyake, K.; Han, Q.; Li, S.; Tan, Y.; Igarashi, K.; Kiyuna, T.; Miyake, M.; Higuchi, T.; Oshiro, H.; et al. Oral recombinant methioninase (o-rMETase) is superior to injectable rMETase and overcomes acquired gemcitabine resistance in pancreatic cancer. Cancer Lett. 2018, 432, 251–259. [Google Scholar] [CrossRef] [PubMed]
  5. Epner, D.E.; Morrow, S.; Wilcox, M.; Houghton, J.L. Nutrient intake and nutritional indexes in adults with metastatic cancer on a phase I clinical trial of dietary methionine restriction. Nutr. Cancer 2002, 42, 158–166. [Google Scholar] [CrossRef]
  6. Lu, S.; Epner, D.E. Molecular mechanisms of cell cycle block by methionine restriction in human prostate cancer cells. Nutr. Cancer 2000, 38, 123–130. [Google Scholar] [CrossRef]
  7. Yoshioka, T.; Wada, T.; Uchida, N.; Maki, H.; Yoshida, H.; Ide, N.; Kasai, H.; Hojo, K.; Shono, K.; Maekawa, R.; et al. Anticancer efficacy in vivo and in vitro, synergy with 5-fluorouracil, and safety of recombinant methioninase. Cancer Res. 1998, 58, 2583–2587. [Google Scholar]
  8. Suganya, K.; Govindan, K.; Prabha, P.; Murugan, M. An extensive review on L-methioninase and its potential applications. Biocatal. Agric. Biotechnol. 2017, 12, 104–115. [Google Scholar] [CrossRef]
  9. Tan, Y.; Sun, X.; Xu, M.; An, Z.; Tan, X.; Han, Q.; Miljkovic, D.A.; Yang, M.; Hoffman, R.M. Polyethylene glycol conjugation of recombinant methioninase for cancer therapy. Protein Expr. Purif. 1998, 12, 45–52. [Google Scholar] [CrossRef]
  10. Tanaka, H.; Esaki, N.; Soda, K. Properties of L-methionine gamma-lyase from Pseudomonas ovalis. Biochemistry 1977, 16, 100–106. [Google Scholar] [CrossRef]
  11. Xin, L.; Yang, W.F.; Zhang, H.T.; Li, Y.F.; Liu, C. The mechanism study of lentiviral vector carrying methioninase enhances the sensitivity of drug-resistant gastric cancer cells to Cisplatin. Br. J. Cancer 2018, 118, 1189–1199. [Google Scholar] [CrossRef] [PubMed]
  12. Kreis, W.; Hession, C. Biological effects of enzymatic deprivation of L-methionine in cell culture and an experimental tumor. Cancer Res. 1973, 33, 1866–1869. [Google Scholar] [PubMed]
  13. Dias, B.; Weimer, B. Purification and Characterization ofl-Methionine γ-Lyase from Brevibacterium linens BL2. Appl. Environ. Microbiol. 1998, 64, 3327–3331. [Google Scholar] [CrossRef] [PubMed]
  14. Boyaval, P.; Desmazeaud, M.J. Le point des connaissances sur Brevibacterium linens. Le Lait 1983, 63, 187–216. [Google Scholar] [CrossRef]
  15. Ferchichi, M.; Hemme, D.; Nardi, M. Induction of methanethiol production by Brevibacterium linens CNRZ 918. Microbiology 1986, 132, 3075–3082. [Google Scholar] [CrossRef]
  16. Hemme, D. Microbial catabolism of amino acids during cheese ripening. Sci. Aliment. 1982, 2, 113–123. [Google Scholar]
  17. Sharpe, M.E.; Law, B.A.; Phillips, B.A.; Pitcher, D.G. Methanethiol production by coryneform bacteria: Strains from dairy and human skin sources and Brevibacterium linens. Microbiology 1977, 101, 345–349. [Google Scholar] [CrossRef]
  18. Machover, D.; Rossi, L.; Hamelin, J.; Desterke, C.; Goldschmidt, E.; Chadefaux-Vekemans, B.; Bonnarme, P.; Briozzo, P.; Kopečný, D.; Pierigè, F.; et al. Effects in cancer cells of the recombinant l-methionine gamma-lyase from Brevibacterium aurantiacum. Encapsulation in human erythrocytes for sustained l-methionine elimination. J. Pharmacol. Exp. Ther. 2019, 369, 489–502. [Google Scholar] [CrossRef]
  19. D’Alessio, A.; Proietti, G.; Sica, G.; Scicchitano, B.M. Pathological and molecular features of glioblastoma and its peritumoral tissue. Cancers 2019, 11, 469. [Google Scholar] [CrossRef]
  20. Stefano, A.; Leal, A.; Richiusa, S.; Trang, P.; Comelli, A.; Benfante, V.; Cosentino, S.; Sabini, M.G.; Tuttolomondo, A.; Roberto Altieri, R.; et al. Robustness of pet radiomics features: Impact of co-registration with MRI. Appl. Sci. 2021, 11, 10170. [Google Scholar] [CrossRef]
  21. Stefano, A.; Vitabile, S.; Russo, G.; Ippolito, M.; Sardina, D.; Sabini, M.G.; Gallivanone, F.; Castiglioni, I.; Gilardi, M.C. A graph-based method for PET image segmentation in radiotherapy planning: A pilot study. In Proceedings of the Image Analysis and Processing–ICIAP 2013: 17th International Conference, Naples, Italy, 9–13 September 2013; Springer: Berlin/Heidelberg, Germany; pp. 711–720. [Google Scholar]
  22. Montecucco, A.; Zanetta, F.; Biamonti, G. Molecular mechanisms of etoposide. EXCLI J. 2015, 14, 95. [Google Scholar]
  23. Onbasli, K.; Erkısa, M.; Demirci, G.; Muti, A.; Ulukaya, E.; Sennaroglu, A.; Acar, H.Y. The improved killing of both androgen-dependent and independent prostate cancer cells by etoposide loaded SPIONs coupled with NIR irradiation. Biomater. Sci. 2022, 10, 3951–3962. [Google Scholar] [CrossRef] [PubMed]
  24. Kluska, M.; Woźniak, K. Natural polyphenols as modulators of etoposide anti-cancer activity. Int. J. Mol. Sci. 2021, 22, 6602. [Google Scholar] [CrossRef]
  25. Laakso, S.; Nurmikko, V. A spectrophotometric assay for demethiolating activity. Anal. Biochem. 1976, 72, 600–605. [Google Scholar] [CrossRef] [PubMed]
  26. Bradford, M.M. A rapid and sensitive method for the quantitation of microgram quantities of protein utilizing the principle of protein-dye binding. Anal. Biochem. 1976, 72, 248–254. [Google Scholar] [CrossRef] [PubMed]
  27. Ulagesan, S.; Kim, H.J. Antibacterial and antifungal activities of proteins extracted from seven different snails. Appl. Sci. 2018, 8, 1362. [Google Scholar] [CrossRef]
  28. Laemmli, U.K. Cleavage of structural proteins during the assembly of the head of bacteriophage T4. Nature 1970, 227, 680–685. [Google Scholar] [CrossRef]
  29. Repetto, G.; Del Peso, A.; Zurita, J.L. Neutral red uptake assay for the estimation of cell viability/cytotoxicity. Nat. Protoc. 2008, 3, 1125–1131. [Google Scholar] [CrossRef]
  30. Al-Khedhairy, A.A.; Wahab, R. Size-dependent cytotoxic and molecular study of the use of gold nanoparticles against liver cancer cells. Appl. Sci. 2022, 12, 901. [Google Scholar] [CrossRef]
  31. Borenfreund, E.; Puerner, J.A. Toxicity determined in vitro by morphological alterations and neutral red absorption. Toxicol. Lett. 1985, 24, 119–124. [Google Scholar] [CrossRef]
  32. Ozdemir, M.D.; Gokturk, D. The effect of Rosmarinus officinalis and chemotherapeutic etoposide on glioblastoma (U87 MG) cell culture. Turk. Neurosurg. 2018, 28, 853–857. [Google Scholar] [CrossRef] [PubMed]
  33. Sevim, H.; Parkinson, J.F.; McDonald, K.L. Etoposide-mediated glioblastoma cell death: Dependent or independent on the expression of its target, topoisomerase II alpha? J. Cancer Res. Clin. Oncol. 2011, 137, 1705–1712. [Google Scholar] [CrossRef] [PubMed]
  34. Suarez-Arnedo, A.; Figueroa, F.T.; Clavijo, C.; Arbeláez, P.; Cruz, J.C.; Muñoz-Camargo, C. An image J plugin for the high throughput image analysis of in vitro scratch wound healing assays. PLoS ONE 2020, 15, e0232565. [Google Scholar] [CrossRef] [PubMed]
  35. Gao, J.; Azmi, A.S.; Aboukameel, A.; Kauffman, M.; Shacham, S.; Abou-Samra, A.B.; Mohammad, R.M. Nuclear retention of Fbw7 by specific inhibitors of nuclear export leads to Notch1 degradation in pancreatic cancer. Oncotarget 2014, 5, 3444. [Google Scholar] [CrossRef]
  36. Mobahat, M.; Narendran, A.; Riabowol, K. Survivin as a preferential target for cancer therapy. Int. J. Mol. Sci. 2014, 15, 2494–2516. [Google Scholar] [CrossRef] [PubMed]
  37. Tong, X.; Yang, P.; Wang, K.; Liu, Y.; Liu, X.; Shan, X.; Huang, R.; Zhang, K.; Wang, J. Survivin is a prognostic indicator in glioblastoma and may be a target of microRNA-218. Oncol. Lett. 2019, 18, 359–367. [Google Scholar] [CrossRef]
  38. Conde, M.; Michen, S.; Wiedemuth, R.; Klink, B.; Schröck, E.; Schackert, G.; Temme, A. Chromosomal instability induced by increased BIRC5/Survivin levels affects tumorigenicity of glioma cells. BMC Cancer 2017, 17, 889. [Google Scholar] [CrossRef]
  39. Sheng, L.; Wan, B.; Feng, P.; Sun, J.; Rigo, F.; Bennett, C.F.; Akerman, M.; Krainer, A.R.; Hua, Y. Downregulation of Survivin contributes to cell-cycle arrest during postnatal cardiac development in a severe spinal muscular atrophy mouse model. Hum. Mol. Genet. 2018, 27, 486–498. [Google Scholar] [CrossRef]
  40. Wang, L.; Huang, W.; Zhan, J. Grape seed proanthocyanidins induce autophagy and modulate survivin in HepG2 cells and inhibit xenograft tumor growth in vivo. Nutrients 2019, 11, 2983. [Google Scholar] [CrossRef]
  41. Chiou, S.K.; Jones, M.K.; Tarnawski, A.S. Survivin–An anti-apoptosis protein: Its biological roles and implications for cancer and beyond. Signature 2003, 9, 47. [Google Scholar]
  42. Shin, S.; Sung, B.J.; Cho, Y.S.; Kim, H.J.; Ha, N.C.; Hwang, J.I.; Chung, C.-W.; Jung, Y.K.; Oh, B.-H. An anti-apoptotic protein human survivin is a direct inhibitor of caspase-3 and -7. Biochemistry 2001, 40, 1117–1123. [Google Scholar] [CrossRef] [PubMed]
  43. Han, L.; Yuan, B.; Shimada, R.; Hayashi, H.; Si, N.; Zhao, H.Y.; Bian, B.; Takagi, N. Cytocidal effects of arenobufagin and hellebrigenin, two active bufadienolide compounds, against human glioblastoma cell line U-87. Int. J. Oncol. 2018, 53, 2488–2502. [Google Scholar] [CrossRef] [PubMed]
  44. Khaw, A.K.; Hande, M.P.; Kalthur, G.; Hande, M.P. Curcumin inhibits telomerase and induces telomere shortening and apoptosis in brain tumour cells. J. Cell. Biochem. 2013, 114, 1257–1270. [Google Scholar] [CrossRef] [PubMed]
  45. Ozdemir, M.D.; Göktürk, D. The concurrent effect of acyclovir and rosemary on glioblastoma cell culture. Cell. Mol. Biol. 2019, 65, 66–71. [Google Scholar] [CrossRef] [PubMed]
  46. Otevřelová, P.; Brodská, B. Chemotherapy-Induced Survivin Regulation in Acute Myeloid Leukemia Cells. Appl Sci 2021, 11, 460. [Google Scholar] [CrossRef]
  47. Cadoret, A.; Desbois-Mouthon, C.; Wendum, D.; Leneuve, P.; Perret, C.; Tronche, F.; Housset, C.; Holzenberger, M. c-myc-induced hepatocarcinogenesis in the absence of IGF-I receptor. Int. J. Cancer 2005, 114, 668–672. [Google Scholar] [CrossRef]
  48. Jamerson, M.H.; Johnson, M.D.; Dickson, R.B. Of mice and Myc: c-Myc and mammary tumorigenesis. J. Mammary Gland Biol. Neoplasia 2004, 9, 27–37. [Google Scholar] [CrossRef]
  49. Liu, S.Q.; Yu, J.P.; Yu, H.G.; Lv, P.; Chen, H.L. Activation of Akt and ERK signalling pathways induced by etoposide confer chemoresistance in gastric cancer cells. Dig. Liver Dis. 2006, 38, 310–318. [Google Scholar] [CrossRef]
  50. McEwan, M.V.; Eccles, M.R.; Horsfield, J.A. Cohesin is required for activation of MYC by estradiol. PLoS ONE 2012, 7, e49160. [Google Scholar] [CrossRef]
  51. Rehman, N.; Khan, S.; Manzoor, S.; Abubakar, M.; Sami, R.; Alharthy, S.A.; Baty, R.S.; Jafri, I.; Alsubhi, N.H.; Qari, S.H.; et al. Estrogen Induces c-myc Transcription by Binding to Upstream ERE Element in Promoter. Appl. Sci. 2022, 12, 6853. [Google Scholar] [CrossRef]
  52. Thompson, E.B. The many roles of c-Myc in apoptosis. Annu. Rev. Physiol. 1998, 60, 575–600. [Google Scholar] [CrossRef] [PubMed]
  53. Xu, J.; Chen, Y.; Olopade, O.I. MYC and breast cancer. Genes Cancer 2010, 1, 629–640. [Google Scholar] [CrossRef] [PubMed]
  54. Azrak, R.G.; Frank, C.L.; Ling, X.; Slocum, H.K.; Li, F.; Foster, B.A.; Rustum, Y.M. The mechanism of methylselenocysteine and docetaxel synergistic activity in prostate cancer cells. Mol. Cancer Ther. 2006, 5, 2540–2548. [Google Scholar] [CrossRef] [PubMed]
  55. Porter, A.G.; Jänicke, R.U. Emerging roles of caspase-3 in apoptosis. Cell. Death Differ. 1999, 6, 99–104. [Google Scholar] [CrossRef]
  56. Özdaş, S. Knockdown of SET Domain, Bifurcated 1 suppresses head and neck cancer cell viability and wound-healing ability in vitro. Turk. J. Biol. 2019, 43, 281–292. [Google Scholar] [CrossRef] [PubMed]
  57. Kavya, D.; Nadumane, V.K. A combination of semi-purified L-methioninase with tamoxifen citrate to ameliorate breast cancer in athymic nude mice. Mol. Biol. Rep. 2023, 50, 2925–2932. [Google Scholar] [CrossRef]
Figure 1. SDS-PAGE bands showing 1, Protein ladder; 2, Crude enzyme (which was obtained after ultrasonic treatment of bacteria); 3, L-methioninase with 55% Ammonium sulfate precipitation. The approximate location of L-methioninase band was shown with the arrow between 37 and 52 kDa bands.
Applsci 13 09382 g001
Figure 2. IC50 graph of L-methioninase on U87MG cell line (p < 0.001).
Applsci 13 09382 g002
Figure 3. IC50 graph of L-methioninase on T98G cell line (p < 0.001).
Applsci 13 09382 g003
Figure 4. The cytotoxicity of L-methioninase, etoposide and the combination of both agents on U87MG cells was evaluated after 24 and 48 h of incubation. (p < 0.001).
Applsci 13 09382 g004
Figure 5. The cytotoxicity of L-methioninase, etoposide and the combination of both agents on T98G cells was evaluated after 24 and 48 h of incubation. (p < 0.001).
Applsci 13 09382 g005
Figure 6. Cytotoxicity of L-methioninase, etoposide and combination of both on MEF, HaCat, U87MG and T98G cells for 24 h of incubation (p < 0.001).
Applsci 13 09382 g006
Figure 7. Wound closure status of U87MG cells over 24 h. L-methioninase and etoposide inhibited the wound closure with both sole and combined administration. In control plates, glioblastoma U97MG cells closed the wound in 24 h of incubation (p < 0.001).
Applsci 13 09382 g007
Figure 8. The wound closure status of T98G cells over 24 h. L-methioninase and etoposide inhibited the wound closure with both sole and combined administration. In control plates, glioblastoma T98G cells closed the wound in 24 h of incubation (p < 0.001).
Applsci 13 09382 g008
Figure 9. Wound area change in U87MG cells for 24 h incubation.
Applsci 13 09382 g009
Figure 10. Average wound width change in U87MG during 24 h incubation.
Applsci 13 09382 g010
Figure 11. Cell migration rate over 24 h of incubation in U87MG cells.
Applsci 13 09382 g011
Figure 12. Wound area change in T98G cells for 24 h incubation.
Applsci 13 09382 g012
Figure 13. Average wound width change in T98G during 24 h incubation.
Applsci 13 09382 g013
Figure 14. Cell migration rate in T98G cells during 24 h incubation.
Applsci 13 09382 g014
Figure 15. Giemsa staining of U87MG cells at the end of 24 h incubation in 20× magnification.
Applsci 13 09382 g015
Figure 16. Giemsa staining of T98G cells at the end of 24 h incubation in 20× magnification.
Applsci 13 09382 g016
Figure 17. Normal photos of U87MG cells at the end of 24 h incubation.
Applsci 13 09382 g017
Figure 18. Normal photos of T98G cells at the end of 24 h incubation.
Applsci 13 09382 g018
Figure 19. DAPI and F-actin staining of U87MG cells at the end of 24 h incubation. Nucleus and F-actin filament intensity significantly dropped after L-methioninase and etoposide administration. Star-shape formation of glioblastoma U87MG cells was seen to be more rounded, as shown by F-actin staining after cytotoxic activates occurred using L-methioninase and etoposide.
Applsci 13 09382 g019
Figure 20. DAPI and F-actin staining of T98G cells at the end of 24 h incubation. Nucleus and F-actin filament intensity and significantly dropped after L-methioninase and etoposide administration with the same for U87MG cells.
Applsci 13 09382 g020
Figure 21. Colonies of U87MG cells at the end of 21 days. The number of colonies declined with L-methioninase and etoposide administration. Colony numbers were significantly decreased with L-methioninase and etoposide administration. L-methioninase does not only show cytotoxicity but also inhibits their ability to form colonies of U87MG cells.
Applsci 13 09382 g021
Figure 22. Colony number of U87MG cells at the end of 21 days. Combined L-methioninase and Etoposide administration enabled the lowest number of colonies (p < 0.001). L-methioninase is abbreviated as L-meth. Additionally, etoposide is etop.
Applsci 13 09382 g022
Figure 23. The relative expression of Survivin (a), C-myc (b), Caspase-3 (c). Survivin and C-myc expressions were decreased by L-methioninase and Etoposide. The combination of both resulted in a maximum reduction in expression. On the contrary Caspase-3 expression increased likewise. The combination of L-methioninase and etoposide resulted in a maximum increase in Caspase-3 expression (p < 0.001).
Applsci 13 09382 g023aApplsci 13 09382 g023b
Disclaimer/Publisher’s Note: The statements, opinions and data contained in all publications are solely those of the individual author(s) and contributor(s) and not of MDPI and/or the editor(s). MDPI and/or the editor(s) disclaim responsibility for any injury to people or property resulting from any ideas, methods, instructions or products referred to in the content.

