1. Introduction
The optimization of process parameters is regarded as a crucial means to improve machining performance, the results of which are dependent on the optimization objectives and methods. In prior research, optimization objectives have mainly focused on technical requirements and production efficiency, while energy consumption and environmental degradation have often been neglected [
1]. Sustainable manufacturing technology presents new challenges for researchers in the context of carbon peaking and carbon neutrality.
As some of the main energy-consuming pieces of equipment in the manufacturing industry, the primary form of energy consumption for machine tools is electricity. There are approximately 8 million units of machine tools in China, indicating significant potential for energy saving. Therefore, balancing machining quality and efficiency while reducing the energy consumption of machine tools has gradually become a prominent research focus in the manufacturing industry [
2]. Hu et al. employed the simulated annealing algorithm to optimize the spindle speed and feed rate in the single-point turning process, focusing on machining energy consumption while considering cutting force, cutting power, and surface roughness as constraints. The optimized process parameters resulted in a 19.28% reduction in energy consumption [
3]. Feng et al. conducted simultaneous optimization of toolpaths and process parameters during the drilling process using NSGA-II, with energy consumption, machining time, and surface roughness as the optimization objectives. The experimental results demonstrated that this approach reduced the energy consumption and machining time by 57.7% and 66.4%, respectively, while significantly improving the surface quality [
4]. In order to achieve a balance between milling sustainability, production efficiency, and machining quality, Yan et al. employed the response surface methodology in combination with the grey relational analysis method to optimize the spindle speed, feed rate, cutting depth, and cutting width in the milling process. The optimized process parameters were found to enhance both the material removal rate and surface quality while reducing energy consumption by 18.1% [
5]. Zhang et al. conducted an optimization study on micro-milling process parameters, including spindle speed, feed per tooth, and cutting depth, with the objective of minimizing power consumption, extending tool life, improving surface roughness, and enhancing tool holder strength. The cuckoo search algorithm and grey wolf optimization algorithm were used to enhance global search capabilities. As a result, a 7.89% reduction in energy consumption was achieved [
6]. Wang et al. conducted optimizations of the energy consumption and machining time in milling processes. The results indicated that the optimization outcomes based on the improved ant colony algorithm surpassed those obtained with NSGA-II, yielding higher productivity at the same energy consumption level [
7]. Rational parameter selection can lead to comprehensive improvements in machinability and sustainability at lower costs. The current research has mostly focused on conventional machine tools, with limited studies on micro-milling.
The established energy consumption model is the basis for analyzing energy characteristics, improving energy efficiency, and minimizing energy consumption in machining. Currently, CNC machine tool energy consumption models can be generally categorized into three types: material-removal-rate-based models, specific process-parameter-based models, and cutting-force-based models [
8]. The power consumption model based on material removal rates is simple in form and has clear physical significance. However, research has shown that different combinations of process parameters can yield different energy consumption values at the same material removal rate [
9,
10,
11,
12]. The variation in process parameters is a significant factor influencing the energy consumption of machine tools [
13]. In addition to regression methods, artificial intelligence is also employed to establish the relationship between process parameters and machine tool power consumption [
14]. However, these models lack physical interpretability, and the energy consumption model based on artificial intelligence algorithms relies on extensive testing data [
15,
16]. Due to factors such as tool wear, tool deflection, and workpiece material properties, accurately modeling cutting forces presents challenges [
17]. Consequently, establishing a cutting power model based solely on cutting forces may deviate from actual results [
18,
19].
Micro-milling is a key technology for manufacturing precision components and finds widespread applications in various fields. Due to the influence of size effects, micro-milling has a higher specific energy consumption, which is particularly pronounced when processing difficult-to-machine materials such as Ti-6Al-4V [
20]. Although many researchers have analyzed the power consumption characteristics of cutting processes and established corresponding power consumption models using various methods, most of these models are focused on general-machining machine tools and still have certain limitations, particularly a lack of in-depth explanations of the power consumption mechanisms and unclear physical meanings [
21,
22,
23,
24]. Therefore, it is crucial to determine a more generalized process-parameter-based power consumption modeling approach for micro-milling processes.
To reduce the energy consumption in micro-milling processes, this paper carried out power consumption modeling using power flow analysis. Based on the established model, the optimization of process parameters was undertaken with the objective of reducing the specific energy consumption, considering constraints on machining quality and efficiency, thereby achieving comprehensive improvements in machinability and sustainability.
3. Results and Discussions
For the non-machining experiments, the power results corresponding to different feed rates are shown in
Figure 8. It can be observed that the power values exhibit an increasing trend with the increasing feed rate.
To determine the model coefficients, a quadratic fitting was performed, and the trend of the power variation with the feed rate was obtained, as depicted in
Figure 9.
The result of the quadratic fitting is shown in Equation (23).
The variance (R
2), adjusted variance (R
2-adj), and prediction variance (R
2-pre) of the proposed model all exceeded 90%, as shown in
Table 4, which indicates that the modeling method presented in this study demonstrates high prediction accuracy.
The variation trend of the spindle power at different speeds is shown in
Figure 10. It can be observed that, compared with the feed motion, the spindle rotational motion consumes higher power. Therefore, in the process of energy consumption optimization, special attention should be given to the spindle power.
The power consumption of the spindle demonstrates a well-fitted quadratic relationship with the rotational speed, as depicted in
Figure 11. The fitting result is presented in Equation (24). The variance (R
2), adjusted variance (R
2-adj), and prediction variance (R
2-pre) of the proposed fitting model all exceeded 98%, as shown in
Table 4, which indicates that the proposed modeling method demonstrates good prediction accuracy.
To facilitate the fitting of the relationships between the process parameters and material removal power, Equation (14) was further manipulated into Equation (25). A linear regression approach can be employed to obtain the coefficients for each term.
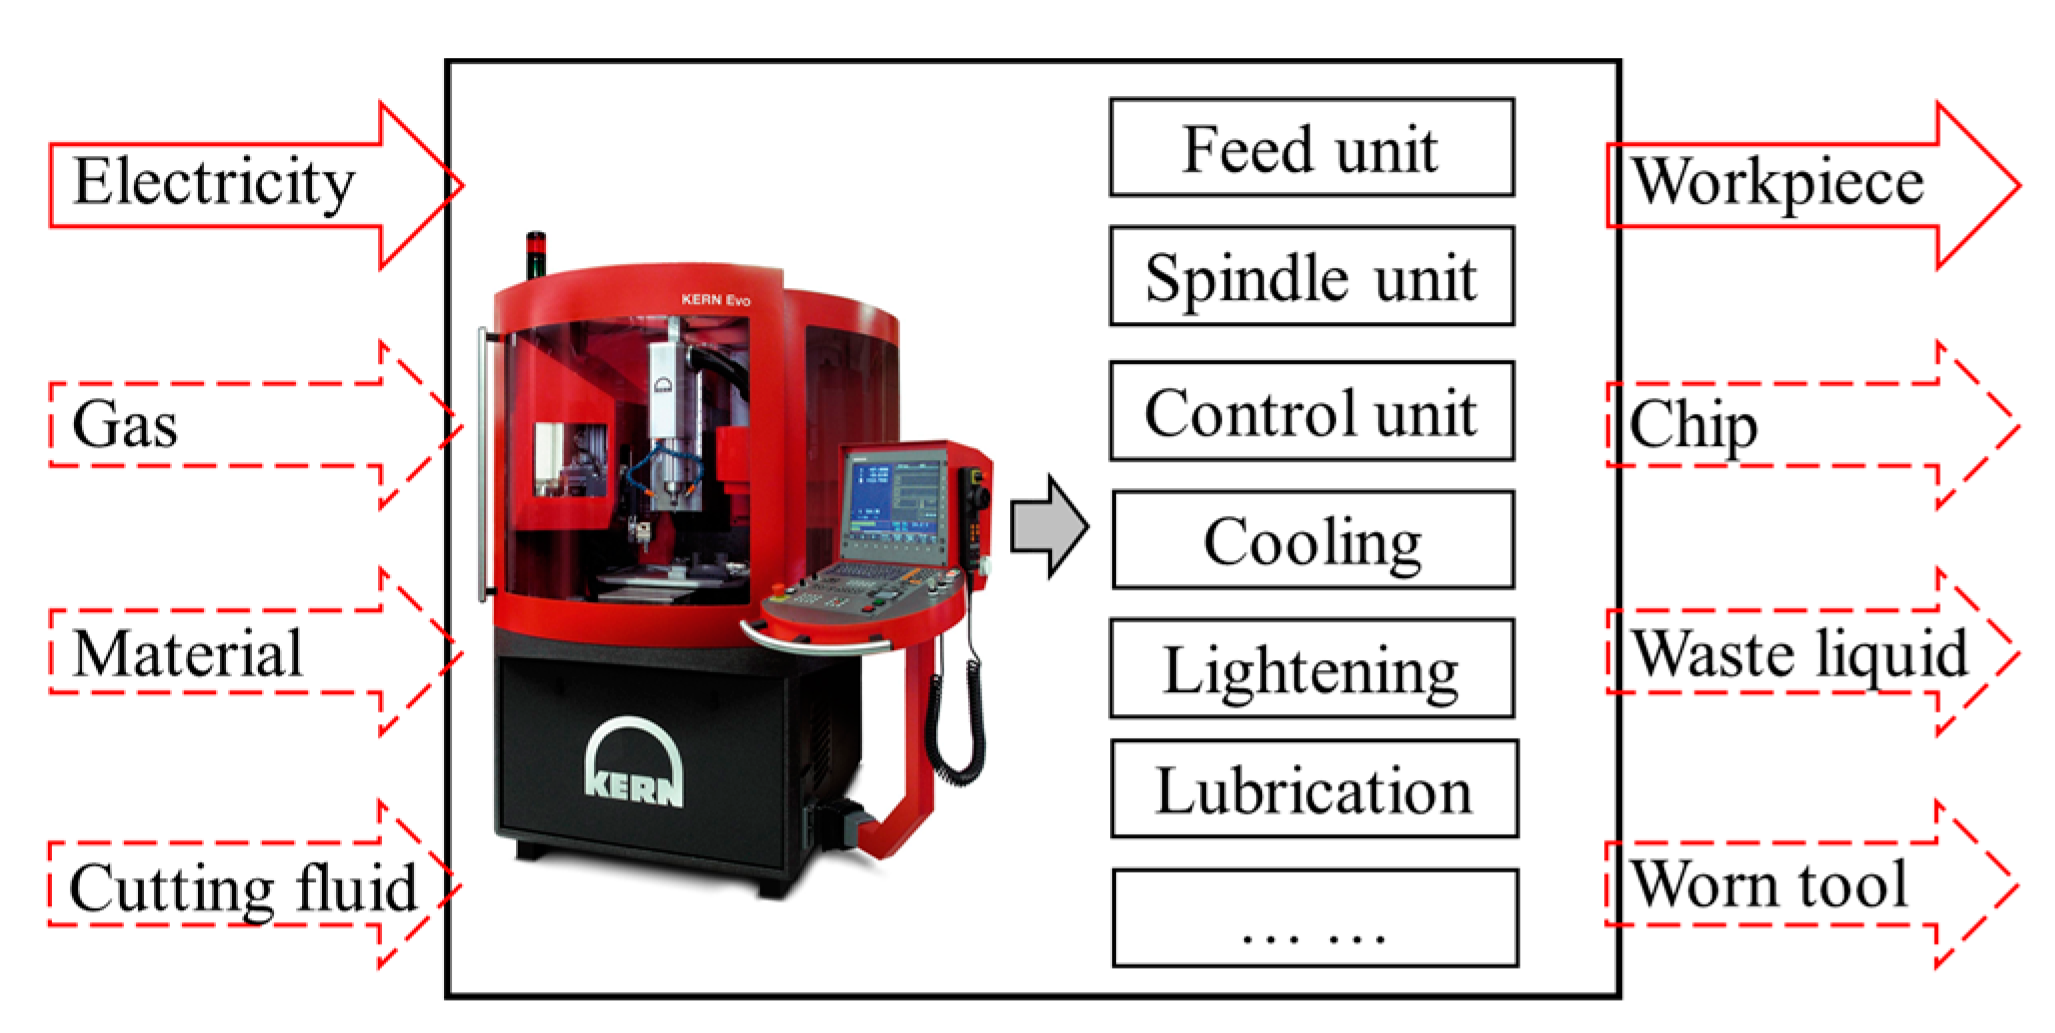
Under each set of process parameters, the total power
Ptatal can be measured when performing each experiment; the machine base power
Pb can be measured when the machine tool is powered on but without performing any movement or processing, as shown in
Figure 2; the spindle power
Ps and feed power
Pf can be calculated using Equations (23) and (24), respectively; and after determining the power component values above, the material removal power can be calculated using Equation (26). The corresponding values are presented in
Table 5.
To achieve the best predictive accuracy, a comparison between the exponential fitting and polynomial fitting models was performed. The results of the exponential and polynomial fittings are shown in Equation (27) and Equation (28), respectively.
To compare the goodness of fit and predictive accuracy of the two fitting models, the variance (R
2), adjusted variance (R
2-adj), predictive variance (R
2-pre), Akaike information criterion (AIC), and Bayesian information criterion (BIC) values were obtained, as shown in
Table 6.
It is evident that selecting different criteria as the goodness-of-fit measures leads to different conclusions. In comparison with the exponential model, the polynomial fitting model exhibits higher values for R2 and R2-adj but a lower value for R2-pre. However, the differences are not very significant. To better explain the selection rationale, the AIC and BIC values of both models were also compared. The AIC and BIC values of the exponential fitting model are both smaller than the polynomial fitting model, indicating that the exponential model is superior from both predictive and fitting perspectives.
After obtaining models for the spindle power, feed power, and material removal power, the variable power could be obtained using Equation (29).
From the range analysis, it can be observed that the order of the process parameters’ influences on the variable power is as follows: spindle speed, feed per tooth, and cutting depth. The range value of the spindle speed is significantly larger than the range values of the feed per tooth and cutting depth, which indicates that during micro-milling processes, the cutting energy consumed by the spindle unit is the highest, as shown in
Table 7. The main effects of the process parameters on the variable power also support this result, as shown in
Figure 12.
The surface topographies are shown in
Figure 13, which were measured with a white-light interferometer. The measurement range was 396 μm by 396 μm. The indicators characterizing the micro-milling quality, including
Sa,
Ds, and
De, are presented in
Table 3. The corresponding regression models are shown in Equation (30), and the respective goodness-of-fit indices are listed in
Table 8.
The main effects of the process parameters on the surface roughness, fractal dimension, and dimension error are shown in
Figure 14,
Figure 15 and
Figure 16. It can be observed that the surface roughness and fractal dimension exhibit distinct opposite trends because the fractal dimension characterizes the richness of details on the surface. The larger the fractal dimension, the more complex and intricate the structures are. Conversely, the smaller the fractal dimension, the fewer irregular structures there are, and the rougher the structure becomes.
The dimensional error shows an overall increasing trend with the enlargement of the process parameters. This is due to the fact that with the increase in the feed per tooth and cutting depth, the cutting forces exhibit an increasing trend. This leads to greater deformation of thin-walled micro-structures in the vertical feed direction, ultimately resulting in an increase in dimensional error. Conversely, as the spindle speed increases, the heat generated during cutting also increases, making the workpiece material prone to thermal deformation. Consequently, this leads to an augmentation in dimensional error. The reasons for small deformation errors are as follows: The micro-milling force is relatively small, and previous studies have shown that the average cutting force for the micro-milling of titanium alloys is within 5 N [
31]; the positioning accuracy of the KERN EVO machining center is 1 μm, with a repeatability accuracy of ± 0.5 μm, exhibiting excellent machining precision; and Ti-6Al-4V possesses high strength, and under the influence of relatively small cutting forces, noticeable deformation errors are not likely to occur.
The main effects of the process parameters on the SCE are shown in
Figure 17. It can be observed that the SCE significantly decreases with the increase in feed per tooth and cutting depth because their impacts on the material removal rate do not significantly affect power consumption. However, the multiplication of the spindle speed leads to a rapid increase in power consumption.
The relationship between the SCE and MRR is illustrated in
Figure 18, with a Pearson correlation coefficient of −0.793, which exceeds 0.7, indicating a significant negative correlation. This implies that enhancing the machining efficiency can reduce specific energy consumption.
In order to overcome the problem of intelligent optimization algorithms easily getting trapped in local optima, this paper investigated and compared the optimal combination of process parameters using three evolutionary algorithms. Since NSGA-II and MOPSO perform poorly when dealing with four or more optimization objectives, the optimization objectives were first compressed. To retain and interpret the original variable information as much as possible, principal component analysis (PCA) was applied to the three indicators representing the machining quality. First, the standardization of Sa, Ds, and De was performed according to Equation (31).
where
represents the
n-th sampled value of the
m-th objective function after normalization;
represents the
n-th sampled value of the
m-th objective function;
p represents the total number of samples; and
and
represent the mean and standard deviation, respectively.
The surface roughness, fractal dimension, and dimensional error correlation coefficients are shown in
Table 9. It can be observed that the surface quality indices,
Sa and
Ds, exhibit a strong negative correlation, while the correlation between surface quality and dimensional error is relatively weak.
Bartlett’s sphericity test and the Kaiser–Meyer–Olkin (KMO) sampling adequacy test were conducted to assess the suitability of PCA, as shown in
Table 10. The results indicate that Bartlett’s sphericity test was significant (
p = 0.000 < 0.05), and the KMO value was 0.681, which falls between 0.6 and 0.7. Therefore, PCA was appropriate.
Table 11 presents the common factor variance matrix, revealing that the
Sa and
Ds indicators for surface quality exhibit sufficient information extraction, and the information extraction content of
De is relatively small.
Higher eigenvalues indicate greater potential energy and are more crucial for the analysis. In
Figure 19, only the first eigenvalue is greater than one, which indicates only one factor is needed to extract from the original features.
The explained total variance is shown in
Table 12. The variance contribution of the first component is 78.851%, allowing for the extraction of original features with minimal information loss.
The factor loading matrix is shown in
Table 13, which illustrates the contributions of the principal components to each variable. According to the principal component matrix, the linear combinations of machining quality variables can be obtained as Equation (32). This principal component can be interpreted as the machining quality.
Therefore, the objective function optimized with NSGA-II and MOPSO can be expressed as Equation (33), and the objective function optimized with NSGA-III can be expressed as Equation (34).
The decision variables can be represented as X = [n, fz, ap] T. The ranges of the process parameters are as follows: 50 μm ≤ ap ≤ 150 μm, 15,000 rpm ≤ n ≤ 45,000 rpm, and 0.5 mm/t ≤ fz ≤ 3.5 mm/t. The initial population size and number of iterations for each optimization algorithm were set as 500 and 1500, respectively. A membership function was used to select results from the Pareto solution set, as shown in Equation (35).
where
fimax and
fimin represent the maximum and minimum values of the
i-th objective function, respectively, and
fi denotes the value of the
i-th objective function.
The optimal solution is selected by maximizing the average p-value, as shown in Equation (36).
The optimization results of process parameters with different methods are listed in
Table 14, and the corresponding experimental validations were performed, which can be observed in
Figure 20 and
Figure 21, respectively. The results obtained using NSGA-III demonstrate a better trade-off between machinability and sustainability compared with the results using NSGA-II and MOPSO. It can be observed that the specific energy consumption and processing efficiency of the three optimization algorithms are very close. However, optimization results based on NSGA-III can achieve better machining quality, including lower surface roughness, larger surface fractal dimensions, and smaller dimensional errors.


