Article

Dynamic Analysis and Safety Assessment of Ships and Cables during Salvage Operations

1
Department of Mechanical Engineering, Dalian Maritime University, Dalian 116026, China
2
Key Laboratory of Rescue and Salvage Engineering, Dalian Maritime University, Dalian 116026, China
3
National Engineering Laboratory for Test and Experiment Technology of Marine Engineering Equipment, Kunming 650051, China
*
Author to whom correspondence should be addressed.
Appl. Sci. 2023, 13(16), 9420; https://doi.org/10.3390/app13169420
Submission received: 20 July 2023 / Revised: 9 August 2023 / Accepted: 16 August 2023 / Published: 19 August 2023
(This article belongs to the Special Issue Ships and Offshore Structures: Design and Mechanical Behavior)

Abstract

:

Featured Application

This study is based on the successful salvage of the Korean “Sewol” ferry in 2017. The approach delineated in the manuscript—the arrangement of two lifting barges in symmetrical disposition to retrieve a large-tonnage shipwreck—is increasingly being employed. The manuscript expounds the dynamic response of the salvage system and the technique employed to assess the safety of the system. Moreover, the manuscript articulates technical details, such as selecting the appropriate wave direction interval before initiating the salvage operation, selecting suitable intership connecting cables, and analyzing potential risks arising after the failure of the lifting cables. These elucidations can proffer insights to salvage engineers for optimizing design schemes.

Abstract

The International Maritime Organization (IMO) emphasizes that shipwreck accidents frequently occur at sea and advocates for the safe recovery of shipwrecks. This paper examines the case of the Korean “Sewol” ferry salvage, where two lifting barges were symmetrically utilized to retrieve a substantial shipwreck. The dynamic analysis of the salvage operation is based on the computational fluid dynamics (CFD) approach. The main investigation covers two fundamental physical parameters: the motion response of the lifting barges and shipwreck and the tension response of the lifting cables. Using the parameters of the maximum absolute value (MA), root mean square (RMS), and coefficient of variation (CV), a unified criterion is established to quantitatively evaluate the safety of the salvage operation under different working conditions. The study demonstrates that by carefully considering the enhancement of safety and stability for the three vessels involved in the salvage process and by optimizing the safety performance of the lifting cables, suitable operating windows are determined at wave intervals of (115°, 155°) and (205°, 245°). Under most working conditions, curves illustrating the maximum tensions of lifting cables No. 1–15 and No. 16–30 show a distribution with a “middle part drooping” shape. The placement of connecting cables on the water’s surface at 1.1–1.2 times the salvage spacing between the two lifting barges or the arrangement of inclined lifting cables underwater proves advantageous in constraining the motion response of the three vessels. Reinforcing the lifting cables at the bow and stern ends is recommended. This study presents a methodology for salvaging a shipwreck using two lifting barges, which can be used as a reference for designing related salvage approaches.

1. Introduction

The recent Nairobi Wreck Removal Convention update by the International Maritime Organization (IMO) acknowledges frequent shipwreck incidents at sea. These incidents lead to challenges, including coastal environmental contamination, waterway blockages, and endangerment of crew members’ lives. The IMO collaborates closely with international organizations, such as the International Salvage Union (ISU), United Nations Environment Program (UNEP), and Coastal States to address these issues. They aim to enhance methods and tools for safely recovering sunken vessels, which will benefit coastal communities and marine ecosystems. The global count of shipwrecks is estimated to exceed 10,000, with significant economic and ecological impacts on marine and coastal ecosystems [1,2,3]. Various factors, such as adverse sea conditions and human error, can cause ship sinking. Notable historical incidents, such as the “Titanic”, “William Gustloff”, and “Dunabaz” sinkings, as well as recent events, such as the “Costa Concordia” and “Sewol” sinkings, have led to considerable financial losses and societal consequences. These events are particularly concerning owing to the potential presence of oil, ammunition, and chemicals in sunken vessels, which harms marine life [4,5]. Swiftly addressing shipwrecks is crucial to protect the aquatic environment and prevent the release of harmful substances from affecting human health [6,7]. Additionally, salvaging parts of shipwrecks can hold military significance, leading to political complexities and making their retrieval important [8].
Before designing a salvage operation, engineers must choose a shipwreck retrieval method, identify key physical quantities for study, and consider other relevant factors. Common salvage methods include buoyancy lifting, tidal lifting, and mechanical means for elevation [9]. Mechanical lifting is frequently employed, involving lifting cables and barges to gradually raise the shipwreck from the seabed. As the shipwreck’s weight increases, a reliable lifting solution becomes crucial, often using double barges on the water’s surface [10]. The subaqueous net weight of the shipwreck examined in this study exceeds 10,000 tons. Hence, the above hoisting scheme is embraced.
Similar to recovering a sunken ship, existing research focuses on sea-based lifting operations [11,12,13,14], which offer valuable points of reference. Using computational fluid dynamics (CFD) theory and conducting experiments, Nam et al. [15] investigated the coupled motion responses of a floating crane vessel and lifted subsea manifold during deep-water installation operations. They thoroughly analyzed the ships’ kinematic characteristics and assessed the dynamic tension of the hoisting wire under various wave conditions. Zhang et al. [16] highlighted the impact of waves on the motion dynamics of offshore crane vessels. Employing OrcaFlex software v. 10.0, which relies on potential flow theory, they constructed a model of an offshore crane vessel. Subsequently, they solved the system’s dynamic response by considering the influence of waves and optimized the hoisting operation design. Drawing upon CFD theory, Han et al. [17] developed a systematic process to design and evaluate the performance of an offshore platform (FPSO; Floating, Production, Storage, and Offloading) crane. Zhang et al. [18] devised a crane vessel–three-bucket jacket-foundation coupling hoisting system to simulate its kinematic response. They obtained the hydrodynamic characteristics of the crane vessel, the motion response of the coupling hoisting system, and variations in cable tension under different configurations and wave directions. Xiao et al. [19] formulated the dynamic equation of a boom using the Lagrangian equation, solved the system’s dynamic response through a numerical model, and analyzed the boom’s stability and dynamic characteristics when performing lifting operations. Kim et al. [20] conducted a hydrodynamic analysis of a DCM (deep cement mixing) vessel equipped with a lofty crane using HydroSTAR v. 7.3 and quantitatively assessed its stability. These studies on floating crane vessels provide a basis for research on recovering sunken ships. When salvaging a shipwreck, it is crucial to consider wave elements and diverse salvage setups comprehensively by simulating the system’s motion and tension responses.
The preceding investigations offer the following insights: (1) Developing a rational salvage plan is vital. Investigating vessels’ motion responses and cable tensions during salvage operations are fundamental aspects requiring examination. Wave elements and different salvage configurations must also be factored in to create a secure and stable strategy. (2) Furthermore, these investigations of ships’ motion responses and cables’ tension responses are conducted through experiments or other methodologies. Empirical inquiry is a conventional approach in shipbuilding and ocean engineering, albeit bearing relatively higher costs. Moreover, scholars have sought insights through analytical methods. For example, Julianto et al. [21] employed Savitsky’s mathematical model and Holtrop’s regression-based method for analysis and analyzed the fluid flow around a hull. A cadre of researchers has availed software based on potential flow theory, which encompasses both OrcaFlex and AQWA [22,23]. Although these methods may overlook fluid viscosity, they provide the advantage of swifter calculation speeds. A research model grounded in computational fluid dynamics (CFD) theory takes cognizance of fluid viscosity and attains heightened calculation precision. With the unabated progress in CFD and burgeoning supercomputer technology, their applications to ship hydrodynamics have become increasingly pervasive [24,25,26,27,28,29,30,31]. Given the protracted cycle of salvage operations and the fact that there is enough time for calculations, harnessing suitable CFD-based mature business software for numerical simulations presents a reasonable way to optimize accuracy and efficiency. (3) While analyzing ships’ dynamic and cable-tension responses, developing a quantitative method for evaluating safety and stability can aid salvage-scheme design.
Ship salvage is a controversial operation mode based on uncertain instruments formed with equipment by persons of doubtful reliability and questionable mentality [32]. The implementation of standardized technical guidelines is necessary for salvage operations. The development of criteria to assess safety and stability requires the consideration of various factors. Engineers in the salvage field aim to maximize operational safety, which prompts the key question of assessing the salvage system rationally and quantitatively. In shipbuilding and ocean engineering, evaluating safety based on physical principles is crucial for ensuring operational stability. With growing interest in salvaging shipwrecks, scholars such as Xin et al. [33,34] have recently proposed a method to evaluate salvage operation safety for the first time quantitatively. These two references are also important sources for this paper. In their research, a typical salvage operation was divided into three phases: a barge was connected with four lifting cables. The root mean square (RMS), coefficient of variation (CV), and extreme amplitude were used to estimate the safety and stability of motion modes and cable tensions. The salvage system is a complex multibody system involving various components (engineering vessel, cables, shipwreck, etc.) with multiple degrees of freedom (DOFs) and load types, which necessitates an assessment pattern that can encompass all the DOFs [33].
This safety assessment method offers a valuable approach for researching salvages, enhancing planning, and identifying suitable operating conditions. Expanding on the abovementioned methods, this paper combines a practical case study for salvaging the Korean Sewol ferry [10] to propose an assessment method suitable for the twin-barge salvage of a shipwreck. In contrast to scholars such as Xin, who used a single barge for salvaging shipwrecks, we position two barges on the water’s surface, offering a highly redundant lifting solution. However, the assessed operating conditions in this paper differ. Additionally, Xin et al. [34] suggested the possibility of more simulations under extreme sea conditions, including broken cables, which are explored in this paper. Finally, this paper deals with a heavier shipwreck and more lifting cables, which align more closely with the actual circumstances of salvaging the Korean Sewol.
Drawing upon the salvage of the Korean Sewol, this paper conducts a dynamic analysis of shipwreck retrieval using two lifting barges at a water depth of 280 m, based on the computational fluid dynamics (CFD) method. The main quantities under investigation include the motion response of the two lifting barges and the shipwreck, along with the tension response of the lifting cables. The primary objectives of this paper include the following aspects:
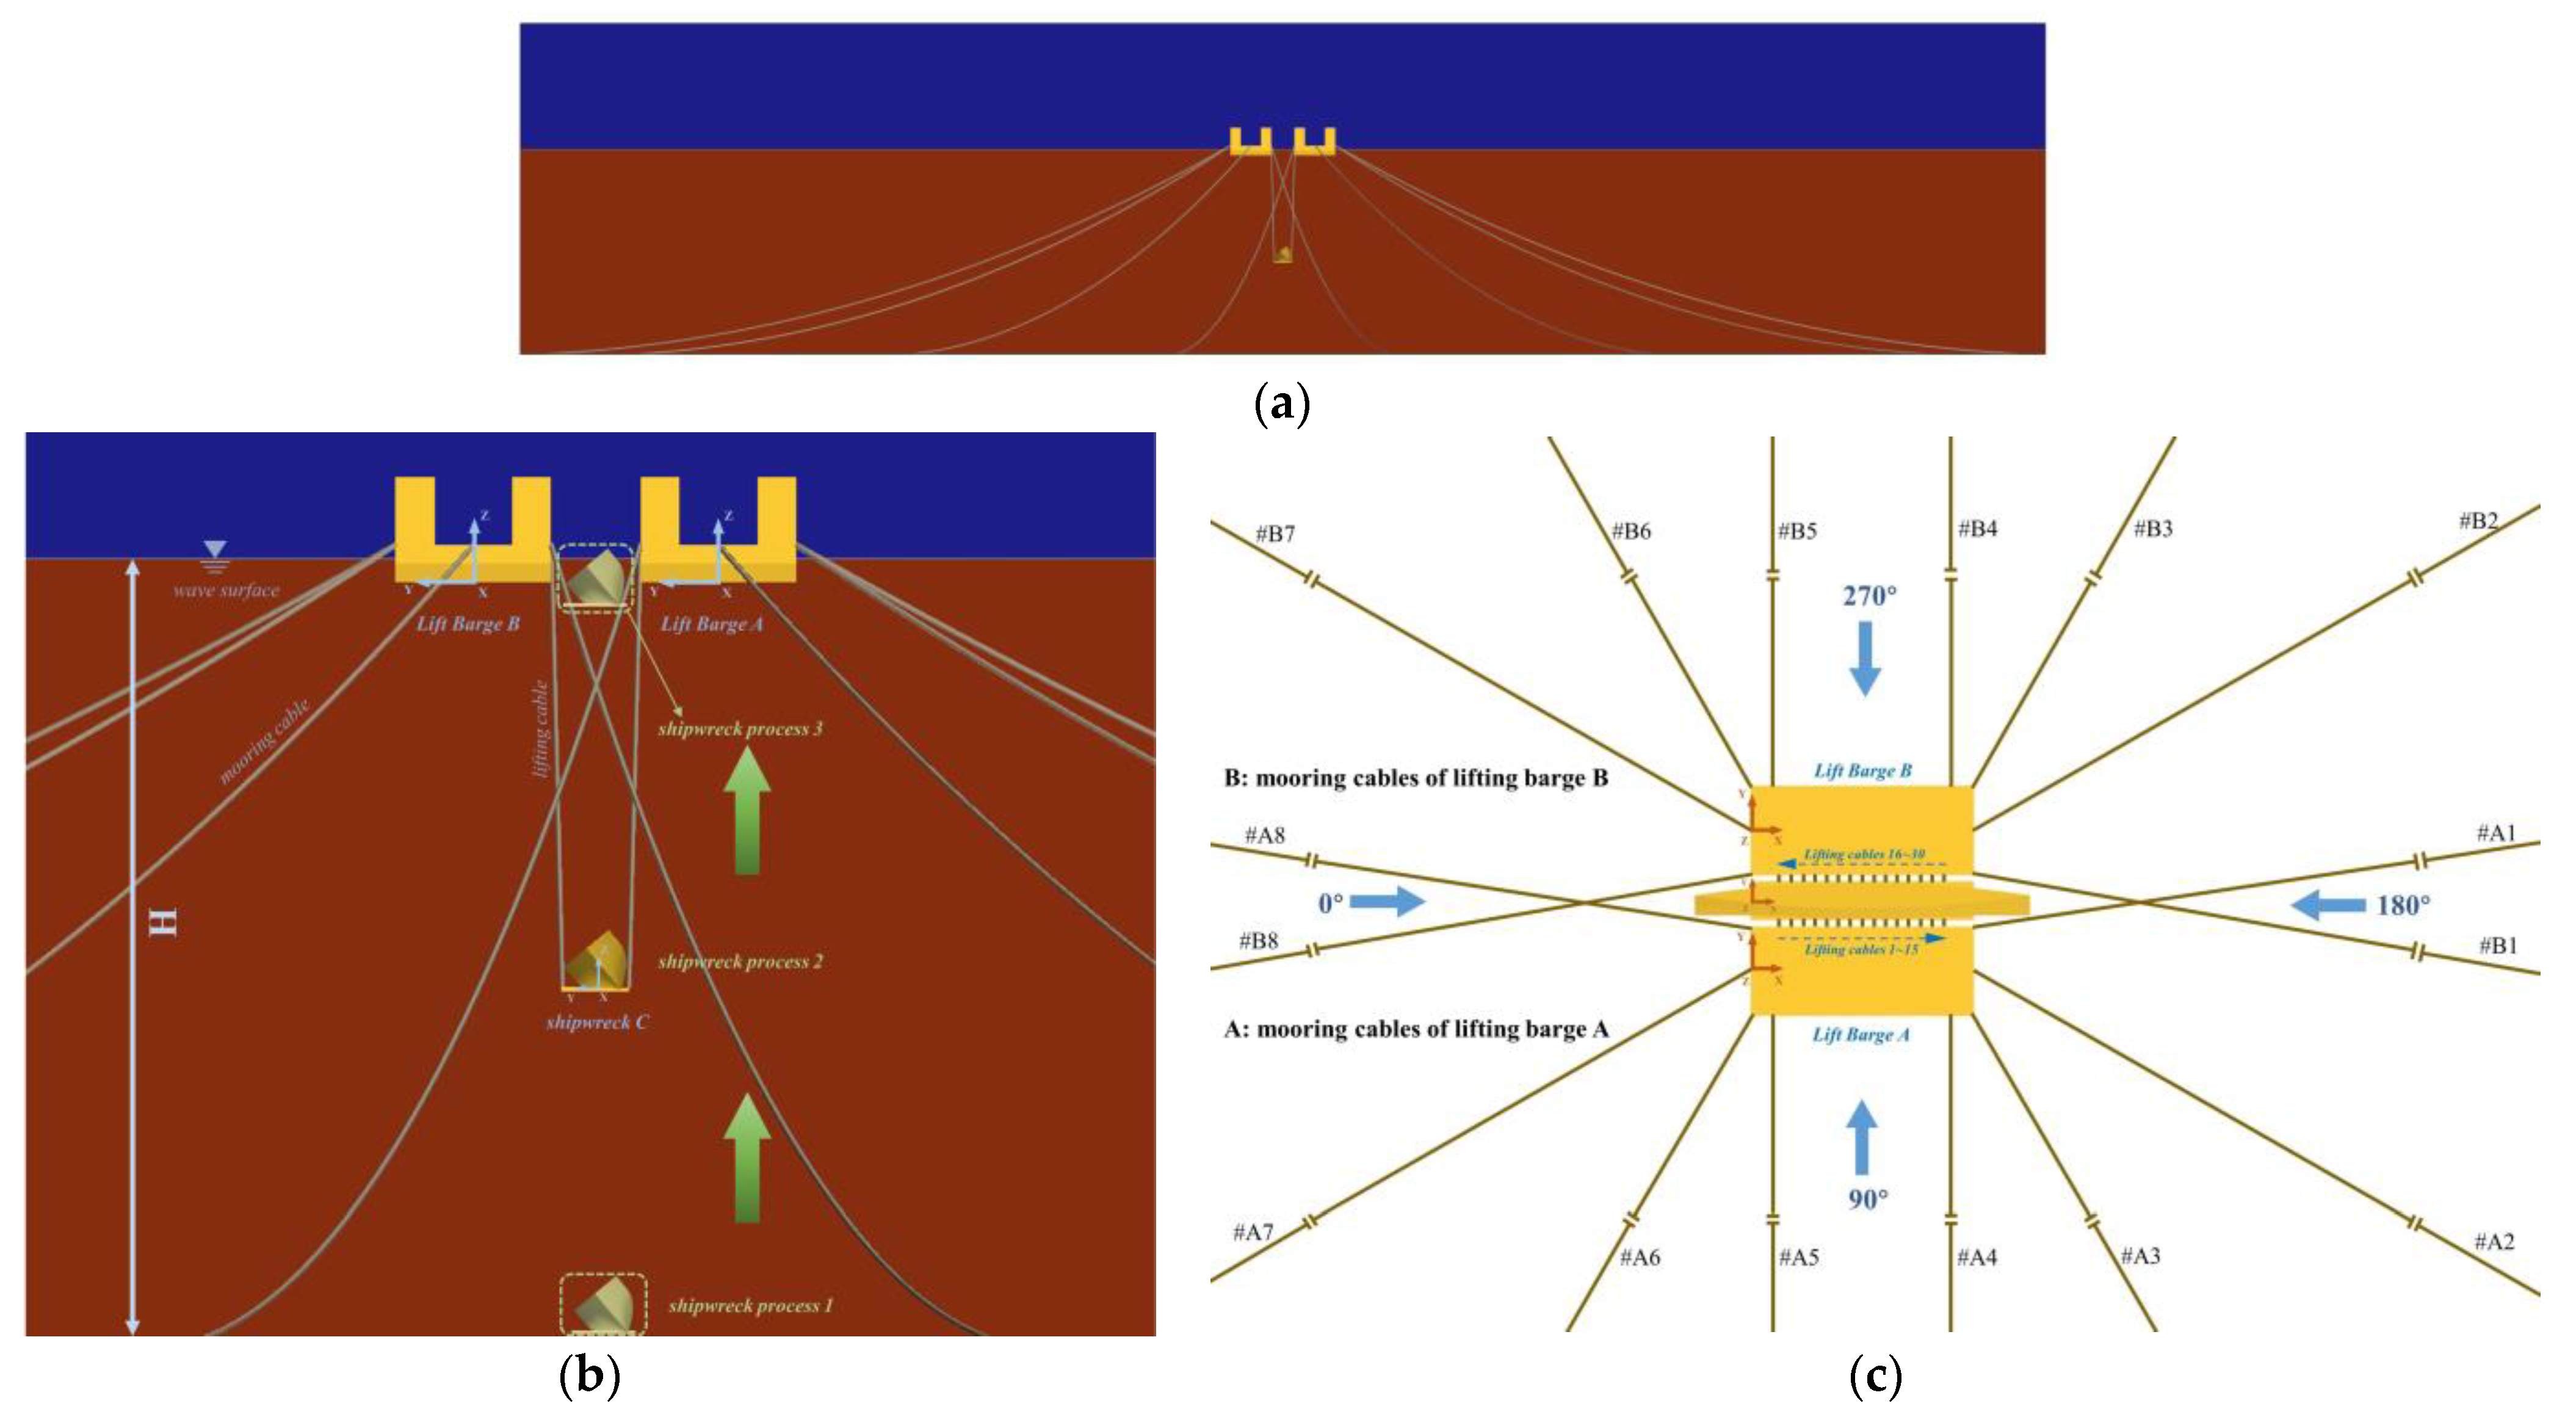
  • Dividing the shipwreck retrieval process into three stages (Processes 1–3), starting from disengagement from the seabed until a portion of the structure emerges above the water’s surface. A method is developed within this framework to assess the safety of twin-barge retrieval. The assessment involves two categories: primarily quantitative assessment, followed by qualitative assessment. First, in terms of qualitative assessment, the maximum absolute motion amplitude (computed as the difference between the maximum and minimum values) [34] of the six degrees of freedom (6DOFs) of the three vessels is calculated, providing an intuitive depiction of the motion characteristics of the three vessels in distinct situations. Second, in terms of quantitative evaluation, the safety of the salvage system can be quantified by considering the safety factor of the hoisting cables along with the maximum absolute value (MA), root mean square (RMS), and coefficient of variation (CV) of the 6DOFs for the three vessels.
  • Analyzing the impact of the wave direction on the salvage system to mitigate the difficulty of the salvage operation and enhance safety. A comprehensive evaluation of the three vessels’ motion responses and cables’ tension responses is conducted to determine the appropriate wave interval.
  • Confining the motion of the three vessels during the salvage process and optimizing cable safety by proposing five schemes to add cables between vessels. Analyzing the impact of these schemes on the salvage system and identifying the most suitable operating approach.
  • Analyzing the risk of the lifting-cable breakage, providing insights for managing unexpected situations during salvage operations, and deepening the understanding of the underlying physical principles governing the salvage process.

2. Theory

CFD simulations were conducted using STAR-CCM+ software (v. 2022.1, Siemens PLM Software, Plano, TX, USA). This section elucidates the salient theories and formulas underpinning numerical simulations. In light of the paper’s brevity, supplementary theories are presented within the confines of the Appendix A.
RANS (Reynolds-averaged Navier–Stokes) equations are used to model the flow around ships and are nearly identical to the original Navier–Stokes equations. Turbulence models provide closure relations for the RANS equations, which govern the transport of the mean-flow quantities, and the mean mass and momentum transport equations can be expressed as follows [35]:
ρ t + ( ρ v ¯ ) = 0
t ( ρ v ¯ ) + ( ρ v ¯ v ¯ ) = p ¯ I + T + T t + f b
where ρ is the density; v ¯ and p ¯ are, respectively, the mean velocity and pressure; I is the identity tensor; T is the viscous stress tensor; Tt is the Reynolds stress tensor; and fb is the resultant of the body forces (e.g., gravitational and centrifugal).
The RANS equations were discretized using the finite volume method (FVM). The turbulence model employed was the k-ε model. To handle the coupling between pressure and velocity, the Semi-Implicit Method for Pressure-Linked Equations (SIMPLE) algorithm was utilized. The segregated flow model solves the equation in a segregated manner, and the convection term is discretized using the second-order upwind scheme. Cables are introduced through coupling modules of multiple floating bodies. The volume of fluid (VOF) method was employed to accurately depict the evolution of the free surface in the two-phase flow. To account for ship motions, the dynamic fluid body interaction (DFBI) module, in conjunction with the overset mesh, was implemented.
The VOF wave model simulates surface gravity waves at the interface between light and heavy fluids. Typically, this model is used with the 6DOF model for marine applications. A convenient model involves a steadily progressing periodic wave train to describe fluid velocities, pressures, and surface elevations resulting from waves. This wave train can be defined and solved by considering three fundamental physical length scales: water depth, wavelength, and wave height. Stokes’s wave theory is one of the primary theories for addressing the steady wave problem. When using the Stokes’s wave theory to simulate waves, the horizontal wave velocity is determined as follows:
v h = a ω cos ( K x ω t ) e K z
The velocity of the wave in the vertical direction is as follows:
v v = a ω sin ( K x ω t ) e K z
The height of the wave surface is as follows:
η = a cos ( K x ω t )
The wave period (T) and wavelength (λ) are as follows:
T = 2 π ω ,   λ = 2 π K
The dispersion relation (between wave period T and wavelength λ) in finite water depth d is as follows:
T = g 2 π λ tanh 2 π d λ 1 / 2

3. Models and Assessment Methods

The salvage system predominantly comprises lifting barges, a shipwreck, and cables. Collectively, the gravitational force exerted by the wreck is transferred to the two lifting barges via the lifting cables. The shipwreck’s gravity plays an important role in the momentum balance of fluids and solids, and it is often added to the system as a source term. Under the force of gravity and the constraints imposed by the cables, the trio of vessels engenders displacement and rotation in three spatial dimensions, embodying the 6DOFs inherent to the ship. The process satisfies the conservation of mass, linear momentum, angular momentum, and energy. The salvage process is categorized into three stages to comprehensively consider the entire process for recovering a shipwreck. Figure 1 presents a schematic diagram of the double-lifting-barge salvage system investigated in this paper.

3.1. Ship and Cable Models

The lifting barges and shipwreck models used in this paper are based on the salvage of the Korean Sewol ferry. Owing to the Sewol’s significant underwater weight and insufficient structural strength, additional supports are necessary on the shipwreck’s underside. Two lifting barges are positioned side by side on the water’s surface. This configuration prevents the shipwreck from breaking owing to inadequate structural strength, thus avoiding secondary submergence into the seabed [10]. The ship models employed in this paper are shown in Table 1. The shipwreck rests at a depth of 280 m on the seabed. Common semisubmersible barges are chosen as the lifting barges, while the selected shipwreck model is the Wigley ship, commonly employed by many scholars who specialize in studying ships. The schematic diagram of the three vessels is depicted in Figure 1.
During numerical simulations, engineers assess sediment conditions within the shipwreck and evaluate the extent of the damage. After gathering this information, they determine the salvage weight of the shipwreck (shipwreck weight minus internal and external buoyancy) and its center of gravity. In Stage P1, when the shipwreck is on the seabed, salvage involves overcoming the shipwreck’s weight and adhesive force between the shipwreck and seabed sediment. The adhesive force depends on the shipwreck’s weight, hull–sediment contact area, and sediment material. This force is often included in the shipwreck’s weight during salvage by applying a coefficient. Typically, a coefficient of 10% is used, resulting in a salvage weight that is 1.1 times the usual weight of the shipwreck in Stage P1. In Stage P3, a part of the shipwreck structure appears at the water’s surface. Shipwreck structural buoyancy and airbag buoyancy decrease slightly, which increase the salvage weight. Notably, for large-tonnage shipwrecks, minimizing the water exposure is preferable to avoid strong coupling motion among the vessels owing to waves. In the Korean Sewol salvage, the heavy shipwreck made complete removal from the water challenging. Therefore, when the shipwreck was partially raised, engineers employed a semisubmersible barge to dive underwater and provide support, eventually enabling the complete removal of the shipwreck.
Mooring cables are arranged radially. Each lifting barge has eight mooring cables measuring 980 m long, resulting in a total of 16 cables. Fifteen lifting cables are evenly distributed on one side of the shipwreck, amounting to 30 lifting cables in total. The cable models are presented in Table 2. The cable parameters in Table 2 refer to the research of Song et al. [36,37]. Song and other relevant scholars have explored the topic of lowering the tunnel element from the water’s surface to the seabed using two lifting barges, which aligns with the research focus of this manuscript and can serve as a point of reference.

3.2. Assessment Methods

This study’s methodology for determining vessel and cable safety is based on Xin’s research [33], which builds upon recent work in wreck salvage. However, unlike the studies by the scholars mentioned above, this paper assesses a larger number of ships, increases the shipwreck’s weight, and incorporates more lifting cables. This makes it more applicable to the actual circumstances encountered during the salvage of the Korean Sewol. The assessments are primarily quantitative, with some qualitative appraisals. Regarding the qualitative evaluation, this paper calculates the MA of 6DOFs for the two lifting barges and shipwreck under various conditions [34]. Visualizing this augmentation in the figure provides a clear view of motion characteristics for the three ships in different scenarios, forming the basis for subsequent quantitative evaluations.

3.2.1. Assessment Elements

While salvaging a shipwreck, numerous uncertainties often arise concerning the shipwreck itself. Obtaining such information is challenging, thereby posing risks to the salvage operation. The challenge for evaluating the safety of the salvage system lies in integrating a multitude of physical indicators into a comprehensive evaluation approach. This manuscript selects MA, RMS, and CV as assessment factors, combined with some quantitative evaluation methods employed in the field of risk management [38]. In this study, MA must be considered first, followed by the consideration of RMS and CV, which are both process oriented. RMS is more suitable than the mean value for describing data fluctuations around zero, while CV measures the degree of data dispersion [33]. Additionally, CV allows for comparing physical quantities in different units by their normalization properties. By employing these three factors, a comprehensive assessment of the maximum tension in the lifting cables can be conducted. Furthermore, the maximum value, absolute motion amplitude, standard deviation, and mean of the 6DOFs exhibited by the three vessels can also be considered. The formulas for the three assessments of the above factors are as follows:
M A = M A X A B S M A X S i , A B S M I N S i ,   s : 1 ~ n
R M S = i = 1 n ( S i ) 2 n
C V = S D σ
where S represents the sample, SD represents the standard deviation, and σ represents the mean.

3.2.2. Assessment of Lifting Cables

The research presented in this article is based on the actual salvage operation of the Korean Sewol, which has an underwater weight exceeding 10,000 tons. Therefore, it suffices to focus on the safety evaluation of the lifting-cables’ MA. The ratio between the breaking force of the lifting cables and these values indicates the safety factor of the lifting cables. By calculating the safety factor, it becomes possible to determine whether the lifting cables meet the safety standards during the salvage operation [39].

3.2.3. Assessment of Three Vessels

The safety assessment of the motion exhibited by the three vessels is considerably intricate. Fluctuations in the motion responses of the two lifting barges and the shipwreck exhibit distinct characteristics. Therefore, when evaluating the motion response of the three vessels, it is crucial to consider not only the MA of the 6DOFs but also the RMS and CV. In other words, a relatively stable movement pattern can prevent damage to the shipwreck’s structure, thereby reducing the operational challenges faced by the two lifting barges and enhancing the safety of the salvage operation. This manuscript adopts two evaluation modes to assess the motion responses of the three vessels. The first mode involves scoring under the same working condition but in different stages, while the second mode involves scoring between other working conditions. Once the scoring under the first mode is completed, the second scoring mode can be initiated. Section 5.2.1 contains some examples of the assessment of the three vessels.
  • Mode 1: Assessment among different stages (intragroup scoring).
The assessment of Mode 1 involves three stages of salvaging a shipwreck: P1, P2, and P3. P1, P2, and P3 collectively represent the entirety of the shipwreck salvage process. By closely examining dynamic responses during these three phases, it becomes possible to ascertain the safety of the salvage operation. In the numerical simulation, P2 corresponds to most of the salvage duration and constitutes the most critical stage in the entire operation. Suppose the 6DOFs exhibited by the two lifting barges and shipwreck demonstrate better stability during the P2 stage than during the P1 and P3 stages. In that case, the safety and stability of the entire salvage operation are maximized. Specific evaluation rules are outlined in Table 3. The higher the score, the less safe it is to perform salvage operations.
  • Mode 2: Assessment among different working conditions (intergroup scoring).
Mode 1 describes scoring between stages (P1, P2, and P3) under the same working condition. As salvage operations involve numerous working conditions, Mode 2 encompasses scoring between different working conditions. In the numerical simulation presented in this manuscript, there are three vessels, denoted by letters “a”, “b”, and “c”, as illustrated in Figure 1b. Following the evaluation method of Mode 1, each vessel can calculate two scores: the safety score (SA) and the stability score (ST). SA and ST scores are 1, 2, or 3. Consequently, there are six possible scores: SAa, SAb, SAc, STa, STb, and STc. Considering the maximum MA and RMS of the three vessels during the P1, P2, and P3 stages as the evaluation elements, six new samples emerge: MAa, MAb, Mac, RMSa, RMSb, and RMSc. These samples are then ranked based on their magnitude, and the ranking score is recorded as RANi, where i ranges from 1 to 6. A higher ranking corresponds to a better score. For instance, Chapter 4.2 entails five waves emanating from different directions. Taking the RMS of the roll response of lifting-barge A (RMSa) as an example, under the influence of waves in the 180° direction, RMSa ranks fifth in magnitude with a ranking score of 1. Conversely, under the influence of waves in the 90° direction, RMSa ranks first in magnitude with a ranking score 5. The scoring formula for a single degree of freedom (DOF) is as follows:
S i n g l e   D O F   s c o r e = ( S A a + S A b + S A c + S T a + S T b + S T c ) R A N i 6 W
where W represents the weight of the 6DOFs, and Wroll is assigned a weight of 1.5; Wpitch and Wyaw are assigned a weight of 1.25 each; and Wsurge, Wsway, and Wheave are assigned a weight of 1 each. Considering the shipwreck salvage process, the gravitational load of the shipwreck primarily transfers to the barge on the water’s surface in the transverse direction. Consequently, the roll response assumes paramount importance among the DOFs and is, thus, assigned the highest weight. Additionally, DOFs about the vessel’s rotation in a specific direction are considered more critical than their movement in a particular direction [26]. Hence, the pitch and yaw responses are assigned a weight of 1.25, while the surge, sway, and heave responses are assigned a weight of 1 each. Finally, the score under a specific working condition is obtained by summing the scores of the 6DOFs in that case. A higher total score indicates more incredible operational difficulty and increased danger. The formula for calculating the total score of the 6DOFs is as follows:
T o t a l   D O F   s c o r e = i = 1 6 ( D O F   s c o r e ) i

4. Numerical Modelling and Validation

4.1. Numerical Modelling

In this paper, the dimensions of the two lifting barges amount to 140 m in length, 55.89 m in width, and 13.3 m in depth. Sixteen mooring cables, spanning 980 m, are arranged radially. The wave height is 1.6 m, and the wave period is 14.7 s. The mooring cables present a uniform and radial layout pattern, and the entire computational area necessitates comprehensive coverage of these mooring cables. Therefore, the calculation domain’s length and width are set at 2100 m, while the water depth is 280 m. As per the recommendation of the International Towed Tank Conference (ITTC), it is optimal to maintain a scale range of 60–80 for conducting scaled-down studies of large offshore structures. For the numerical simulation in this study, the chosen scale is 70. Consequently, the numerical model in this paper assigns a value of 30 m for the length and width of the calculation domain, 4 m for the water depth (h2), and 2.5 m for the upper height (h1). A frequently employed approach for boundary condition selection [40] involves velocity inlets for the computational domain’s front, upper, and back boundaries; pressure outlets for the back boundary; symmetry planes for the side boundaries; and a no-slip wall condition for the hull’s surface boundary. The computational domain and boundary conditions are illustrated in Figure 2.
Considering the length of this paper, Figure 3 presents an illustrative representation of the grid during the classical P2 stage. To optimize computational resources and achieve more precise wave simulations, meshes neighboring the interface exhibit augmented density compared to other regions. The grid size is suitably adjusted, with larger grids positioned farther from the vessels and smaller grids closer to them. The central overset mesh area models ships’ motions. The present study employs a fully structured overset mesh, divisible into two components before overlapping: the background and overset mesh. Typically, the computational domain comprises a background grid and one or multiple minor overlapping grid regions [41,42]. The overset mesh classifies mesh cells as active, inactive, or acceptor mesh cells. In active mesh cells, discrete governing equations are solved. In inactive mesh cells, no equations are solved; nevertheless, if regions of the overset mesh move, these mesh cells become active. The relative movement between subdomains does not necessitate mesh deformation or regeneration—the motion laws within the subdomain need to be defined. The primary advantage of this method lies in its capacity to handle intricate geometries and relative movements of objects in dynamic simulations. Owing to its convenience in mesh generation, the overset mesh is widely adopted and is efficacious in managing intricate mesh layouts [43].
With the advancement of supercomputer technology, the entire computational process is executed on a platform with a full capacity of 1280 cores and a single node equipped with 64 cores. Table 4 exhibits the grid independence analysis, encompassing three grid types: coarse, medium, and fine. In the salvage of sunken ships, it is imperative to consider the tension and 6DOFs of the largest lifting cables among the three vessels. The parameters examined in Table 4 include the MA of the roll response and the maximum tension of three representative lifting cables, namely, Nos. 1, 5, and 10. The table shows that the disparity between the calculation results of the coarse grid and fine grid exceeds that between the calculation results of the medium grid and fine grid. Generally, variation between the coarse and fine grids’ calculation results ranges from 4% to 5%. In the numerical simulation of the salvage operation, the system composed of the three ships and the cables is relatively stable, so this difference is relatively large. Moreover, the salvage operation necessitates a high level of system security, as any errors could result in severe consequences. The tension difference in the No. 1 cable reached 5.2%, which is higher than those in the other cables. This discrepancy could be attributed to the positioning of the No. 1 lifting cable at the ship’s bow, where it encounters waves first, leading to an intense response. If this difference interferes with the engineer’s design plan, it could fail the lifting cables. In comparison, the difference between the calculation results of the medium grid and fine grid is smaller, typically around 2%, and the tension disparity of the lifting cables at the bow is considerable but falls within an acceptable range. Regarding the time aspect, the numerical simulation time for each stage (P1–P3) amounts to 25 s. These numerical simulations are executed on a supercomputer platform. Owing to the dynamic characteristics of parallel computing, difference in the number of computing nodes and cores dynamically allocated by the platform, specific algorithm used in STAR-CCM+ software, and other factors, the computing time is different under each working condition. By comprehensively considering the computation time for various working conditions in this paper, the computation time is reduced by about 43% for the coarse mesh and about 27% for the medium mesh compared to that of the fine mesh. The calculation time of the medium grid is reduced by around 27%. Fine grids impose higher demands on computing resources. Considering the calculation efficiency, the medium grid was chosen for the numerical simulation.

4.2. Basin Test and Validation

A numerical-simulation-based scale experiment was conducted on the vessel, with the scale dimensions set at 70. The wave tank, which is the primary facility for conducting experiments on oceanic structures, was utilized. Within the wave tank, the target object typically assumed the shape of a scaled-down model. Spherical structures were used for wave generation, and the wave tank itself measured 50 m in length, 30 m in width, and had a depth of 4 m. Froude’s similarity theory was applied to craft the ship model. The lifting barges had dimensions of 2 × 0.8 × 0.19 m, with a draft of 0.123 m. The shipwreck had dimensions of 3 × 0.33 × 0.3 m. The experimental arrangement and equipment are depicted in Figure 4.
Figure 4 displays various components: Figure 4a showcases the wave-making pool. Two symmetrically arranged spherical structures create waves. Upon rotation of the eccentric wheel, the stay ropes connected to the base of the spherical structures extended and contracted, causing vertical movement and creating waves. The termination point of the pool was equipped with a wave-absorbing structure, allowing for a realistic simulation of sea waves. Figure 4b portrays the salvage scene of a shipwreck. In Figure 4c, a capsized Wigley boat represented the shipwreck, featuring pallets on its underside. Thirty-four lifting rings were affixed to the pallet, with thirty connected to the barge via cables and four linked to a circle of steel pipes. The steel pipe was connected to a hook. Thirty lifting cables connected the shipwreck and barge as the hook gradually descended. Custom-made lifting cables were employed, consisting of lightweight cables and custom springs, meeting the gravitational similarity and elastic similarity criteria. The formula used to calculate the tension deformation of the lifting cables [36] was as follows:
T m = C p d p 2 ( Δ S / S ) n λ 3
where Tm denotes the tension of the model, Cp represents the modulus of elasticity, ΔS/S corresponds to the relative elongation, and n assumes a value of 1.5. Figure 4d showcases the equipment used to adjust the center of gravity and moment of inertia. Figure 4e depicts the lifting barge, which possesses fifteen connecting rings linked to the shipwreck via pulleys and cables. Additionally, Figure 4f showcases a sensor employed for tension measurement. By dividing the lifting cables into two segments and attaching the sensor to both ends, the force exerted during the lifting of the shipwreck can be measured. Lastly, Figure 4g portrays an instrument for measuring the ship’s attitude, placed within the barge’s cabin, to enable the determination of 6DOFs.
Figure 5 portrays the Response Amplitude Operator (RAO). Considering the limited space of the manuscript, the MA of the 6DOFs is demonstrated for the lifting barge during stages P1, P2, and P3 under wave action in 90° and 180° directions. The RAO in this illustration is defined as the ratio of the MA of the 6DOFS [34] to the wave height. Overall, the numerical simulation values exhibit conformity with the experimental values, which reflects the ship’s motion characteristics. Notably, their fluctuation trends remain generally consistent as the wave direction varies. However, it is noteworthy that, overall, the experimental values of the ship’s 6DOFs slightly surpass those in the numerical simulations. This divergence can be attributed to the arrangement of the lifting cables. Although the numerical simulation involves ideally setting 30 lifting cables with identical initial states, experimental salvage operations present a far more intricate scenario. Lifting cables do not exhibit complete uniformity in their initial states. Some cables possess larger initial stretches, resulting in a larger pulling force, while others exhibit smaller initial stretches, yielding less pulling force. Such disparate pulling force responses impact the ship’s motion, resulting in larger experimental values of the ship’s 6DOFs. The ship’s motion notably demonstrates enhanced stability when confronted with waves propagating in the 180° direction, as observed in both experimental and numerically simulated values. Specifically, the RAO values of the roll response and heave response, which warrant heightened attention in salvage operations, diminish under the influence of waves propagating in the 180° direction. Moreover, in general, the RAO value of the P3 stage tends to be higher than those of the P1 and P2 stages. Concerning the heave response at the P3 stage, the force exerted by waves counters some of the downward force, thus reducing the vertical motion of the ship. Other DOFs are comparatively less influenced by this phenomenon, leading to larger experimental and numerical simulation values at P3. In summary, as the direction of the waves changes, the values obtained by the experiment and numerical simulation are close, and the changing trend of the values is similar, contributing to a more comprehensive understanding of its behavior.
In Xin’s research [34], certain intuitive conclusions can be deduced by investigating the increase in the maximum tension of the lifting cables. Hence, Figure 6 illustrates the augmentation of the lifting cables’ maximum tension in numerical simulations and experiments under the influence of waves in the 90° direction. The selected tension values stem from the maximum value during P1–P3 stages. These values are comparable to the maximum tension of the hoisting cable under the impact of waves in the 180° direction. The figure reveals that, as the wave direction shifts from 180° to 90°, the numerical simulation and experimental values increase at the bow and stern and exhibit close agreement. However, disparities arise for the cables situated in the middle of the ship, namely, cables 7–9 and 22–24. In the experiment, the tension values of these cables slightly exceed the numerical simulation values. This phenomenon stems from the fact that when the ship encounters waves in the 90° direction, the middle cables bear the brunt of the impact. The cables in the experiment hardly maintain the same initial state as their numerical simulation counterparts. Some experimental cables undergo larger initial stretching, leading to relatively high tension generation, while others experience less stretching and, correspondingly, generate less pull. This inconsistency engenders tension fluctuations, which become more pronounced for the middle cables under the influence of waves in the 90° direction. The conclusions drawn from the experiment and numerical simulation are consistent. Specifically, under the influence of waves in the 90° direction, the tension response of the cable is lower than that under waves in the 180° direction. If the aim is to enhance the safety of the lifting cables during shipwreck salvage, a salvage operation with waves in the 90° direction is preferred. In summary, the values obtained from the experiment and numerical simulation are approximately the same, with the conclusions derived from the numerical trends aligning, thereby accurately reflecting the tension response of the lifting cables.

5. Results

5.1. Dynamic Response Characteristics of the Salvage Operation

At the start of the salvage operation, the shipwreck generates a significant gravitational load owing to its net weight exceeding 10,000 tons. During this phase, the lifting barges encounter reactive forces from the lifting cables, causing the barges to move from their initial positions. As a result, the tension in the lifting cables increases drastically. As the lifting barges descend, the mooring cables slightly relax, leading to a minor reduction in cable tension. Subsequently, influenced by waves, the lifting barges rise again. These occurrences lead to complex variations in the movement of the three vessels and the cable tension during the shipwreck salvage process. The representative operational condition of the shipwreck in the P2 stage, subjected to waves in the 135° direction, has been chosen to clarify these phenomena. The schematic diagram illustrating the salvage operation under waves in the 135° direction is shown in Figure 7.
Figure 8 illustrates the MA of the 6DOFs in the P2 stage under wave action in the 135° direction. The MA vividly demonstrates the distinct characteristics of the three vessels. A and B denote the lifting barges, while C represents the shipwreck. Before the commencement of the salvage operation, engineers inflate the shipwreck’s interior with airbags to increase buoyancy and adjust the ship’s attitude and center of gravity. To better simulate the actual scenario, in our numerical simulation, the center of gravity of shipwreck C is not at the midpoint and is close to barge A. In general, lifting-barge A exhibits greater MA than lifting-barge B. Because shipwreck C is submerged, it is less influenced by waves, resulting in a relatively lower MA than lifting-barges A and B. In addition, the distance between the two lifting barges is small owing to the shipwreck’s substantial weight. Wave action in the 135° direction leads to a shadowing effect on the roll, sway, and heave responses. Notably, the roll amplitude of lifting-barge A is 1.58 times higher than that of lifting-barge B. This phenomenon is attributable to the fact that the wave first passes to A and then to B and to the unstable transmission of the shipwreck’s gravitational load in the transverse and vertical directions. The pitch, surge, and other response amplitudes fall within the permissible engineering range.
Based on the analysis above, it becomes evident that the movements of the three vessels are not synchronized during the shipwreck salvage process. This lack of synchronization results in varying tensions among the 30 lifting and 16 mooring cables, resulting in localized peaks. Figure 9 shows the maximum tension of the 16 mooring cables under wave action in the 135° direction. Lifting-barge A faces the impact of the wave, and lifting-barge B faces away from the impact of the wave. A1–A8 represent the maximum tension of the eight mooring cables of lifting-barge A, while B1–B8 denote the maximum tension of the eight mooring cables of lifting-barge B. Owing to the waves’ influence, lifting-barges A and B move in opposite directions to the wave motion, causing the cable facing the wave to become taut and the cable facing away from the wave to become slack. The elongation of the cables leads to changes in tension. From Figure 6, it is evident that the five mooring cables (B1, A1, A2, A3, and A4), corresponding to areas that are the most affected by waves, exhibit peak values ranging from 368.8 to 424.8 kN, surpassing the tensions of the other cables. Based on the parameters of the mooring cables provided in Table 2, it can be ascertained that all mooring cables comfortably meet the safety factor requirements with significant safety margins.
Given the satisfactory safety performance of the mooring cables and considering the shipwreck’s net weight surpasses 10,000 tons, this paper primarily focuses on examining the safety performance of the lifting cables. Figure 10 shows the maximum tension and safety factor of the 30 lifting cables (ratio of braking force to maximum tension value). Cables 1–15 belong to lifting-barge A, while cables 16–30 correspond to lifting-barge B. Owing to the asynchronous movements of the three vessels, the tension assigned to the 30 lifting cables varies. As shown in Figure 9, both the No. 1–15 cables on the shipwreck side and the No. 16–30 cables on the opposite side exhibit a “middle part drooping” distribution of maximum tension values, necessitating strengthened connections at the head and tail of the barges. Furthermore, because the transverse center of gravity of the shipwreck is biased toward lifting-barge A, the tension values of the corresponding cables in lifting-barge A are higher than those of the corresponding cables in lifting-barge B. Similarly, as the longitudinal center of gravity of the shipwreck tilts toward the bow, the tension in the cables near the bow is relatively high. Additionally, from a safety factor perspective, the highest tension value among the No. 15 cables reaches 7.312 × 10⁷ N, corresponding to a safety factor of 1.892. During shipwreck salvage, Liu [40] defined the minimum safety factor for lifting cables as 1.67.

5.2. The Effect of Directions of Waves on the Salvage System

5.2.1. The Effect of Directions of Waves on the Ship’s Motion Response

During the preparatory stage of the salvage operation, engineers must reasonably arrange the site based on existing conditions. An important consideration in site layout is the direction of the waves. For this study, we have chosen waves in five classical directions ranging from 90° to 180°. The research involves three phases, namely P1, P2, and P3, encompassing 15 working conditions. To gain intuitive insights into the distinct characteristics of the three vessels during the three stages under waves from different directions, we analyze the MA of the 6DOFs. Furthermore, we quantitatively evaluate the safety and stability of the vessels during the motion process by considering three parameters: MA, RMS, and CV. Figure 11 illustrates the MA of the 6DOFs of the three vessels under waves from different directions.
Figure 11 shows the amplitudes of the 6DOFs at P1, P2, and P3 using distinct colors and geometric shapes. The figure provides an overview of the varying responses of the 6DOFs as the wave incident angle increases from 90° to 180°. The roll and heave responses have reduced amplitudes, while both the pitch and surge responses show significant increases in magnitude. Notably, the reduction in the roll response is particularly significant. Taking the P3 stage as an example, the average roll amplitude of the three vessels facing 90°waves measures 2.66 degrees, whereas it measures 1.47 degrees for the three vessels facing 180° waves. This phenomenon is due to the change in wave direction and unstable transmission of the shipwreck’s gravity load in the transverse direction. Generally, the amplitude response in the P3 stage is more significant, except for the heave response. This is due to the partial exposure of the shipwreck structure on the water’s surface during the P3 stage. Compared with the state where the shipwreck is completely submerged in the water, the constraint performance of the lifting cables at this time is better, so the movement of the shipwreck along the Z direction is reduced. Moreover, it is evident that for the heave and roll responses, because the transverse center of gravity of the sunken ship is biased toward lifting-barge A, the response amplitude of lifting-barge A is greater than that of lifting-barge B in stages P1, P2, and P3. However, the conclusions differ when examining other DOF amplitudes, which emphasizes the salvage system’s uniqueness and complexity.
Analyzing the MA of the 6DOFs of the three vessels under waves from different directions provides initial insights. However, rather than solely relying on visual interpretation, it is crucial to establish a unified evaluation criterion that enables comprehensive analysis of the motion responses of the vessels under various working conditions and stages. This paper introduces three parameters: MA, RMS, and CV as evaluation criteria. For detailed information, please refer to Section 3.2.3 of this article. Figure 12 summarizes the three evaluation elements of the 6DOFs under different wave directions. Additionally, Table 5 presents the safety evaluation scores of the three vessels under waves from different directions based on these three parameters.
First, the results are analyzed based on the evaluation criteria of Mode 1. The higher the score, the less safe it is to perform salvage operations. It is evident from the table that the scores of the 6DOFs differ under waves from different directions. When facing waves in the 90° direction, the sway motion of all three vessels receives a stability score of 3, and their roll motion obtains scores of 3, 2, and 3. This indicates that the CVs of the sway responses of all three vessels reach their maximum values under the P2 condition, and the CVs of the roll responses of all three vessels are the highest overall under the P2 condition. Consequently, the translational and rotational movements of the three vessels become highly unstable during the P2 stage in transverse directions under waves from the 90° direction. Under waves from the 155° direction, the safety and stability scores of the pitch responses for all three vessels are 3. This suggests that for the pitch responses of the three vessels, CV reaches its maximum value during the P2 phase, while either RMS or MA achieves its maximum value in the P2 phase. Thus, the pitch response becomes unsafe. This situation requires heightened attention because, for shipwrecks, shaking in longitudinal directions determines the tension distribution of the lifting cables. Excessive shaking in the longitudinal direction can result in excessively high tension in lifting cables at the start and end of the lifting barges. Finally, the total scores of the 6DOFs are analyzed for waves in different directions. Under waves from the 155° direction, the scores of the three vessels reach 70 points, indicating that the motion responses of the three vessels during the P2 stage are the most unsafe under waves from this direction. As the P2 stage represents a significant portion of the shipwreck salvage process, avoiding waves from this direction is crucial during the operation.
Next, the results are analyzed based on the evaluation criteria of Mode 2. Although Mode 1 scores under different stages of the same working conditions, Mode 2 scores under other working conditions. The higher the score, the less safe it is to perform salvage operations. Both modes need to be considered together. For instance, the Mode 1 score under waves from the 90° direction for the 6DOFs is 61 points, which may not appear significant. However, compared to the motion response under waves from other directions, the motion amplitude of the 6DOFs under waves from the 90° direction is substantial and, thus, poses considerable danger. Therefore, we consider the maximum MA and RMS of the three vessels in the P1, P2, and P3 stages as evaluation elements. The six new samples: MAa, MAb, Mac, RMSa, RMSb, and RMSc were ranked by size, and the higher the ranking, the greater the score. The ranking scores in Table 5 represent the average scores of these six samples. Recognizing that the importance of each DOF varies in the salvage process of sunken ships and that rotational movements in the x-, y-, and z-directions warrant greater attention than translational movements, the weights of the 6DOFs are 1.5, 1.25, 1.25, 1, 1, and 1. In Table 5, the Single Degree of Freedom (SDOF) score can refer to Formula (11). For instance, considering the roll response influenced by 90° waves, the SDOF score is 97.5. In this scenario, the Safety score encompasses the summation of corresponding values for the two lifting barges, denoted as A and B, and shipwreck C. This summation equates to 1 + 1 + 3. Similarly, the Stability score is calculated as 3 + 2 + 3. Consequently, the resulting Ranking Score stands at 5, while the Weight factor assumes a value of 1.5. Accordingly, the cumulative sum of the Safety and Stability scores yields 13, culminating in a final score of 97.5 after factoring in the Ranking Score and Weight. Figure 13 displays each DOF’s safety scores under waves from different directions, while Figure 14 represents the total safety score of the 6DOFs under waves from different directions.
The numerical simulations in this paper investigate wave behavior from 90° to 180°. Drawing upon the research conducted by Xin [33], the arrangement of the salvage system exhibits a symmetrical configuration. As a result, the analysis encompassing the quadrant ranging from 90° to 180° can be extrapolated to the remaining three quadrants, considering both the symmetry inherent in the salvage system and the optimization of computational resources.
Different score thresholds are set for the scores of various DOFs and the total score of the 6DOFs. These thresholds are depicted in Figure 12 and Figure 13. For each degree of freedom (DOF), the Safety and Stability scores of the thresholds are set at 11 points, referring to the sum of SAa, SAb, SAc, STa, STb, and STc in Formula (11). In Formula (11), RANi refers to the ranking score. Under different working conditions, the highest-ranking score receives 5 points, the lowest-ranking score receives 1 point, and the middlemost-ranking score is 3 points. The value of 3 points corresponds to the threshold of RANi in Formula (11). Each RANi has a threshold of 3 points, which means that RANi/6 is also 3 points. Therefore, the score threshold for a single DOF, without considering weight multiplication, is 33 points. In Table 5, the weights assigned to the 6DOFs are 1.5, 1.25, 1.25, 1, 1, and 1. After accounting for these weights, the score thresholds for the 6DOFs become 49.5, 41.25, 41.25, 33, 33, and 33 points.
Consequently, based on the Formula (12) information, the total score threshold for the 6DOFs is 231 points. All the thresholds are indicated by red dotted lines in the figures. In Figure 12, areas exceeding the thresholds are depicted in gray, while light green represents areas within the thresholds. In Figure 13, areas surpassing the thresholds are displayed in red, while dark green indicates areas within the thresholds.
An examination of Figure 13 indicates that the roll response achieves its highest score under waves from the 90° and 270° directions and reaches 97.5 points, which significantly surpasses the score threshold. In contrast, the lowest score occurs under waves from the 180° and 0° directions, registering only 18 points, which is well below the score threshold. However, the situation differs for the pitch responses. The lowest score is recorded under waves from the 90° and 270° directions, totaling only 16.88 points, which is significantly below the score threshold. Conversely, the highest score is observed under waves from the 180° and 0° directions, amounting to 67.71 points, which is well above the score threshold. Although the results for roll and pitch responses under varying wave directions differ substantially, the yaw response remains safe in almost all directions. Regarding the surge response, safety is demonstrated for wave intervals of (45°, 135°) and (225°, 315°). The adjacent regions of 0° and 180° also show safety for the sway response, though within a narrow range. Regarding the heave response, apart from the adjacent 90° and 180° areas, waves in other intervals mostly satisfy safety criteria. Considering all the provided information, Figure 13 reveals that the adjacent regions of 0° and 180° directions, as well as the two wave intervals of (115°, 155°) and (205°, 245°), are suitable operating windows. The above analysis offers insights for designing the preparation phase of the salvage operation and assists in mitigating operational challenges.

5.2.2. The Effect of Directions of Waves on the Tension of Lifting Cables

The preceding discussion pertains to examining the motion responses of the three vessels during the salvage operation of a shipwreck. Apart from assessing the motion response, it is necessary to evaluate cables’ tension responses by calculating the safety factor. In the salvage process, Liu [39] defined the minimum safety factor for lifting cables as 1.67. Figure 15 illustrates the lifting cables’ maximum tensions and safety factors under the influence of waves from different directions.
Figure 15 illustrates the distribution, with the x-axis depicting various wave directions and the y-axis indicating the number of lifting cables. Cables 1–15 correspond to lifting-barge A, while cables 16–30 represent lifting-barge B. The three stages of the shipwreck’s ascending process are denoted as P1, P2, and P3. The graph’s lowest layer displays the safety factor, which represents the minimum safety factor of the lifting cables during stages P1, P2, and P3 under the influence of waves from the same direction. The maximum tension of the lifting cables reaches 7.72 × 10⁶ N, resulting in a safety factor 1.79, which satisfies safety standards. In the P1 stage, lifting the shipwreck from the seabed requires overcoming both its weight and the resistance posed by the seabed sediment. Consequently, the cable tension in the P1 stage surpasses those in the P2 and P3 stages. Additionally, examining the tension distribution reveals that because the shipwreck’s center of gravity favors lifting-barge A, cables 1–15 are under higher tension than cables 16–30. The tension in both cable groups displays a “middle drooping” pattern. For a more comprehensive tension analysis, Figure 16 illustrates the maximum cable tension values in all three stages under waves from diverse directions.
In Figure 16, different colors distinguish stages P1, P2, and P3, and the maximum tension values during these stages are plotted in the background. The light-red curve represents this mapping. As shown in Figure 16, most curves depicting the maximum tension of cables 1–15 and 16–30 exhibit a “middle drooping” pattern. Furthermore, the sagging of the curves slows as the cable numbers approach the middle range (7–9, 22–24). For example, comparing cable No. 15 in the 180° P1 stage with cable No. 7, the maximum tension of cable No. 15 is 7.04 × 10⁶, whereas cable No. 7 has a maximum tension of 4.45 × 10⁶. The maximum tension of cable No. 15 is 1.45 times higher than that of cable No. 7, indicating that cables at the bow and stern ends of the lifting barge have higher tension values and fluctuations than those in the middle. This highlights the need for reinforcement at these cable points. The numerical simulation in this paper encompasses the P1, P2, and P3 stages with waves from five different directions, totaling 15 working conditions. Under nearly all the conditions, the maximum tension values of cables 1–15 and 16–30 exhibit a “middle drooping” distribution. However, the maximum tension of lifting cables 1–15 in the P1 stage under waves from the 90° direction is an exception. As the cable number increases, the tension gradually increases, deviating from the “middle drooping” distribution. This phenomenon is attributed to various factors. First, as is evident from Figure 16, as the wave direction decreases from 180° to 90°, the cable tension significantly decreases. Under waves from the 90° direction, the cable tension is reduced, which minimizes differences among cable tensions. Moreover, the sunken ship’s center of gravity is closer to lifting-barge A in the transverse direction and to the bow longitudinally. Additionally, the gravity on the shipwreck in the P1 stage is substantial, contributing to the nearly linear increase in cable tension values for cables 1–15 under waves from the 90° direction. To quantitatively analyze the cable tension for various wave directions, the increase in the maximum cable tension in the three stages was compared to the maximum tension for waves from the 180° direction. Figure 17 illustrates the increase in the maximum cable tension.
In Figure 17, stages P1–P3 maximum tension values are highlighted, with the red dotted line representing a 0% increase. Aside from a positive increase of around 5% in cables 10–15 under waves from the 135° and 155° directions, the overall increase is negative. Generally, cable tension responses are the most severe under waves from the 180° direction. Additionally, under the same conditions, the absolute value of the tension increase for cables in lifting-barge A is smaller than that of the tension increase for cables in lifting-barge B (with a negative increase rate). This is because the shipwreck’s center of gravity favors lifting-barge A, resulting in less fluctuation in the cable tension increase on that side. Under waves from the 90° direction, the increase in the maximum tension for each cable typically ranges from −10% to −30%, indicating significant tension reduction. Thus, salvaging a shipwreck under waves from the 90° direction is best for enhancing the cable safety performance.

5.2.3. Summaries

In this section, a comprehensive study examined the motion responses of two lifting barges and a shipwreck and the tension responses of lifting cables under the influence of waves from different directions to evaluate safety.
(1) By analyzing the MA of the three ships’ 6DOFs under waves from different directions, this paper draws the following conclusions: As the wave direction increases from 90° to 180°, the roll and heave responses show decreasing amplitudes. In contrast, the pitch and surge responses exhibit significant increases. Generally, except for the heave response, the response amplitude is more pronounced in the P3 stage. Under various wave directions, the MA of lifting-barge A’s 6DOFs is greater than that of lifting-barge B’s 6DOFs. This disparity is particularly noticeable in the heave and roll responses. The reason for this phenomenon is that, on the one hand, the transverse center of gravity of the sunken ship is biased toward lifting-barge A; on the other hand, it shields against waves.
(2) In the investigation of the motion responses of the three ships, this section formulated evaluation criteria based on three parameters: MA, RMS, and CV. These criteria quantitatively assess the safety of the three ships during the salvage operation. The results indicate that two operating windows are relatively safe. Specifically, the suitable operating windows for the salvage operation are the adjacent areas of waves in the 0° and 180° directions, as well as in wave intervals of (115°, 155°) and (205°, 245°). These operating windows help to reduce operational challenges and enhance the safety of the salvage system.
(3) This section examined the maximum tension, safety factor, and relative increase rate of lifting cables at different positions to study the tension responses of the cables. The results revealed that curves depicting the maximum tensions of cables 1 –15 and 16–30 exhibited a “middle drooping” shape distribution under almost all the working conditions. The sagging of the curves becomes slower as the cable numbers approach the middle range (7–9, 22–24). The tension values of the lifting cables in the P1 stage are higher than those of the lifting cables in the other two stages. The tension response was the most severe under wave action in the 180° direction. Under the influence of waves in the 90° direction, the tension of the lifting cables showed the smallest response and the best safety performance.
(4) General conclusions can be derived by combining the above findings and conducting a comprehensive study of the motion responses of the three ships and the tension responses of the lifting cables. Waves in the 90° and 180° directions exhibit distinct characteristics. This uniqueness is particularly evident in the roll and pitch responses depicted in Figure 12. Regarding the tension response of the lifting cables, the response is the smallest when waves act in the 90° direction, while it is the most severe under the wave action in the 180° direction. Additionally, only the heave response amplitude decreases in the P3 phase, while the amplitudes of the other 5DOFs increase. Hence, we can tentatively conclude that the heave response determines the total value of the lifting-cables’ tension, and the roll and pitch responses determine the discrete degree of tension distribution in the lifting cables.
(5) To enhance the safety of the three ships in salvage operations, the adjacent areas of waves at 0° and 180° can be selected as operating windows. Similarly, the wave intervals of (115°, 155°) and (205°, 245°) are viable options. It is worth noting that the former offers narrower operating windows, whereas the latter provides broader operating windows. Considering the safety performance optimization of the lifting cables, waves in the 90° and 270° directions are suitable for salvage operations. In comparison, operations under the influence of waves in the 0° and 180° directions should be avoided. Taking all aspects into comprehensive consideration, the wave range covering (115°, 155°) and (205°, 245°) represents the most suitable operating window for salvage operations.

5.3. The Effect of Cables among Three Ships on the Salvage System

Taking the P1 stage as an example, the sinking depth of the ship reached 280 m. When salvaging a shipwreck from this depth, the two lifting barges and shipwreck display significant transverse and longitudinal motions reminiscent of a “pendulum effect”. To address these challenges, this manuscript proposes two optimization strategies. The first strategy involves positioning a connecting cable on the water’s surface between the two lifting barges, with cable lengths of 1d, 1.1d, 1.2d, and 1.3d, where “d” represents the requisite distance between the two lifting barges for the salvage operation. The second concept entails installing inclined lifting cables at the bow and stern of the lifting barges. In total, five proposed schemes are presented. Figure 18 shows schematic diagrams of these five schemes, where the mooring cables are concealed so that the schemes can be shown clearly. Implementing these schemes can limit the three vessels’ motions during salvage operations in deep water regions and enhance the safety performance of the lifting cables.

5.3.1. The Effect of Cables among Three Ships on Ships’ Motion Responses

Figure 18 illustrates the shipwreck in the P1 stage, with the wave direction set at the classical 180°. Four connecting cables are positioned on the water’s surface, sharing the same connection points as the lifting barges but differing in slack lengths. The inclined lifting cable is installed underwater, and the connection points between it and the lifting barges are the same as those in the previous four schemes. There are five schemes in total. To assess these schemes, the increase in the MA of the 6DOFs serves as an evaluative metric. This assessment visually showcases the motion response of the salvage system after the addition of cables among the ships, with the pre-cable addition working condition serving as the reference. Figure 19 presents the increases in all the DOFs.
In Figure 19, the changes in the motion responses of lifting-barge A, lifting-barge B, and shipwreck C are depicted in light red, light yellow, and light blue, respectively. The black dotted line represents a 0% increase. Adding the inclined lifting cable results in negative changes for the 6DOFs, with greater reductions observed compared to the four schemes involving connecting cables between the two lifting barges. Regarding the roll motion, the lifting-barge B and shipwreck C changes are predominantly negative and are particularly pronounced after including the inclined lifting cable. Except for the case of adding 1d connecting cable between the lifting barges, the changes for lifting-barge A in the other four cases are positive. The introduction of connecting cables among the three ships primarily aims to mitigate the significant translational movement of the vessels, resembling a “pendulum effect”, in the transverse and longitudinal directions during the salvage of shipwrecks in deep water. This constraint is achieved by alternating the tension and slackness of the cables. Although the three ships are constrained, there may be an increase in the turning angle in specific directions. However, such cases are infrequent. In most instances, the growth rate of the 6DOFs is negative. Concerning the pitch response, apart from a positive increase of 3–10% observed when the inclined lifting cable is added, the changes in the other four solutions range from approximately −30% to −5%. Consequently, adding cables among the three boats effectively restrains the pitch motion. Similar conclusions can be drawn for the surge and sway responses, which exhibit negative changes for the three ships—notably, lifting-barge A shows the most significant decrease, ranging from approximately −30% to −20%. However, the yaw response is distinct, with negative changes observed only when the inclined lifting cable is added, while the changes in the other four schemes are all positive. This reaffirms the particularity of the salvage system. Similar conclusions can be made for the sway and heave responses. A quantitative evaluation is warranted, given the distinct characteristics of each 6DOF among the five schemes. Figure 20 illustrates the individual DOF scores for the five schemes, while Figure 21 presents the total score of the 6DOFs for the five schemes.
The evaluation of the three ships is based on the MA and RMS. Six new samples (MAa, MAb, Mac, RMSa, RMSb, and RMSc) are ranked in ascending order based on their magnitudes, with higher rankings indicating higher scores. The score of a single DOF is the sum of these six parameters. With a total of five schemes, each sample is assigned a rank from 1 to 5, resulting in ranking scores ranging from 5 to 1. Considering that the highest score among the five schemes is 5 points and the lowest is 1 point, the middle 3 points serve as the threshold. With six samples, the score threshold for a single DOF is 18 points without accounting for weighting. The weights of the 6DOFs are as follows: 1.5, 1.25, 1.25, 1, 1, and 1. After applying the weights, the score thresholds of the 6DOFs become 27, 22.5, 22.5, 18, 18, and 18. Hence, the total score threshold of the 6DOFs is 126 points. From Figure 19, it is apparent that the length of the connecting cable between the two lifting barges should be, at most, a certain limit. When the slack length of the cable exceeds this limit, it can adversely affect the safety and stability of the salvage system. For instance, adding connecting cables that are 1.3 times longer than the salvage spacing between the two lifting barges yields the highest scores for the roll, yaw, and sway responses. Figure 20 shows that the total score for the inclined lifting cable is 107.25, which is the lowest among the five schemes and significantly below the score threshold for the 6DOFs. This scheme is reasonable and effective for restraining the movement of the three ships. The total score for 1.3d is 144, which far exceeds the score threshold, making it an unreasonable solution. The total scores for 1d and 1.1d are 125.5 and 125 points below the score threshold, respectively. The total score for 1.2d is 128.25, which is slightly higher than the score threshold but still within an acceptable range. Hence, from the perspective of restraining the motion responses of the three ships, the most optimal solution is to deploy inclined lifting cables underwater. Simultaneously, it is also reasonable to employ connecting cables with lengths ranging from 1d to 1.2d between the two lifting barges.

5.3.2. The Effect of Cables among the Three Ships on the Tension of the Lifting Cables

Figure 22 illustrates the maximum tension values of all the lifting cables after incorporating inclined cables. Light red represents the maximum tension value of the 30 vertically arranged lifting cables without additional cables. On the other hand, light blue indicates the maximum tension of all the lifting cables after including the inclined lifting cable. It is evident from the figure that the addition of the inclined lifting cables significantly reduces the maximum tension value of the original 30 vertically arranged lifting cables. This improvement greatly enhances the safety performance of the lifting cables. The maximum tension of the four additional inclined lifting cables is 7.6 × 10⁶ N, which is slightly higher than the original maximum of 7.04 × 10⁶ N. At this point, the safety factor is 1.82, which meets the requirements. Therefore, the installation of underwater inclined lifting cables not only effectively reduces the motion responses of the three ships but also improves the safety performance of the lifting cables.

5.3.3. Summaries

In this section, to address the issue of the significant movement encountered by the three ships while lifting the shipwreck in deep water, five proposals were set forth for the addition of connecting cables among the three ships. Incorporating cables of varying lengths ranging from 1 to 1.3 times that of the salvage spacing is recommended between the two lifting barges on the water’s surface. Additionally, inclined lifting cables are introduced beneath the water. From the standpoint of constraining the motion responses of the three ships, the optimal solution involves including inclined lifting cables underwater, and it is also reasonable to incorporate connecting cables measuring 1–1.2 times the salvage spacing between the two lifting barges. When a connecting cable is added, it may fluctuate between slackness and tension. The tension of the cables fluctuates significantly when connecting cables measuring 1–1.1 times the salvage spacing constrain the movements of the three ships. Hence, the most reasonable operational range for the connecting cables lies between 1.1 and 1.2 times the salvage spacing. Furthermore, inclined lifting cables yield positive outcomes for enhancing the safety performance of the lifting cables. To summarize, the optimal approach for restricting the motion responses of shipwrecks in deep water and enhancing the safety performance of lifting cables involves arranging inclined lifting cables underwater. It is also reasonable to include connecting cables measuring 1.1–1.2 times the salvage spacing between the two lifting barges.

5.4. The Effect of Lifting-Cable Breakage on the Salvage System

Lifting cables are subject to corrosion and fatigue damage during the salvage process, which can result in cable breakage. The breakage of lifting cables is very dangerous, and the rupture of cables at certain positions may trigger the breakage of other cables simultaneously. This scenario can lead to the shipwreck sinking back into the ocean, causing severe damage. Therefore, studying the specific conditions associated with cable breakage is important. During the salvage of a shipwreck, Liu [39] defined the minimum safety factor of lifting cables as 1.67. To comprehensively evaluate the situation following cable breakage at various positions, Table 6 presents six cable breakage modes. In this section, the shipwreck is in the P2 stage, and the wave directions are 135° and 180°.
This section primarily investigates the occurrence of cable breakage at different positions, assessing whether the remaining lifting cables will break and if their safety factor is met. Figure 23 depicts the moment of cable breakage at different locations, the increase in the maximum tension value of the remaining lifting cables, and the safety factor.
In Figure 23, the histogram illustrates the increase in the maximum tensile magnitude of the remaining lifting cables when cables at different positions rupture. Pale yellow represents the increase induced by waves in the 180° direction, while light green indicates the increase caused by waves in the 135° direction. The safety factors of the lifting cables are depicted by red and blue curves. Generally, cables 16–30 show a higher growth rate than cables 1–15. Consequently, lifting cables situated farther from the transverse center of gravity of the wreck have more significant increments and greater fluctuations. From a safety factor perspective, lifting cables subjected to waves in the 135° direction typically have a higher safety factor than those under waves in the 180° direction. The safety factor curves of cables 1–15 and 16–30 in most modes exhibit a distribution characterized by a rising middle portion. However, the shape of the increase in tension for cables 1–15 and 16–30 may vary. Some cases present a “middle part drooping” shape distribution, such as in Modes 1 and 5. In other cases, the distribution shows a “middle part uplifting” shape, such as Mode 2, Mode 3, and Mode 4. This phenomenon arises because adjacent cables experience significant fluctuations when lifting cables at different positions rupture, while those located farther away encounter less fluctuation. Fractured lifting cables gradually approach the vessel’s center from Modes 1–4 and Modes 5–6, leading to a diminished augmentation rate of the remaining cables, thus ensuring gradual cable safety enhancement. In Modes 5–6, the minimum safety factors for lifting cables under 180°-wave action are 1.14 and 1.21, while the corresponding minimum safety factors under 135°-wave action are 1.29 and 1.33, respectively. The data reveal that the breakage of lifting cables is more hazardous under waves in the 180° direction. Therefore, extra attention should be paid to the dynamic responses of lifting cables when performing salvage operations under waves in the 180° direction. It also indicates that exceeding four broken lifting cables on one side of the shipwreck may fracture the remaining cables.
In general, regardless of whether the lifting cables rupture owing to waves in the 135° or 180° direction, the safety factor curves of the remaining lifting cables (numbers 1–15 constitute one group, while numbers 16–30 form another) typically exhibit a distribution characterized by an uplifting middle portion. However, the tension increase pattern of the remaining lifting cables varies, presenting either a drooping or uplifting middle portion shape distribution. When lifting cables at different locations rupture, the adjacent cables experience the most substantial fluctuations, while those farther away exhibit minimal fluctuations. Hence, it is necessary to reinforce lifting cables at the bow and stern ends to prevent breakage. Additionally, it is more hazardous for lifting cables to rupture under the influence of waves in the 180° direction. The number of broken lifting cables on one side of the shipwreck must not exceed four, as surpassing this limit may lead to the fracture of other lifting cables, causing unforeseeable dangers.

6. Conclusions

This study is based on an authentic salvage case involving coordinated efforts of two lifting barges to salvage a shipwreck. The process of shipwreck salvage, from disengaging from the seabed to partially surfacing, is divided into three stages. A unified criterion is established by incorporating the three parameters of MA, RMS, and CV to enable a quantitative evaluation of safety under various working conditions. The manuscript explores the ship’s motion responses and the tension responses of lifting cables. The conclusions drawn in this manuscript are as follows:
1.
Effects of waves in different directions:
(1) In most scenarios, curves representing the maximum tension values of cables numbered 1–15 and 16–30 exhibit a “middle part drooping” shape distribution. The closer cables are to the ship’s midsection (cables 7–9, cables 22–24), the slower the curve sags. The tension of the lifting cables responds most strongly to waves in the 180° direction, while the tension response is minimal under waves in the 90° direction, indicating better safety performance.
(2) A comprehensive analysis of motion response and tension response reveals that the heave response determines the total tension value of the lifting cables. Additionally, the roll and pitch responses determine the discrete degree of tension distribution in the lifting cables.
(3) Based on quantitative assessment criteria, recommended operational windows for salvage operations to enhance the three ships’ safety include adjacent wave areas in the 0° and 180° directions. Additionally, wave intervals in the (115°, 155°) and (205°, 245°) directions can be selected. For improving the safety performance of lifting cables, wave directions of 90° and 270° are preferable, while salvage operations under waves in the 0° and 180° directions should be avoided. Taking all these factors into account, wave intervals in the (115°, 155°) and (205°, 245°) directions are considered as the most suitable operational window for salvage operations.
2.
Effects of connection cables among the three ships:
(1) To constrain the motion responses of the three ships, arranging inclined lifting cables underwater is the optimal solution. Arranging connecting cables that are 1–1.2 times longer than the salvage spacing between the two lifting barges on the water’s surface is reasonable. However, the tension in the connecting cables that are 1–1.1 times longer than the salvage spacing fluctuates significantly. Thus, connecting cables that are 1.1–1.2 times longer than the salvage spacing is more suitable.
(2) In terms of enhancing the safety performance of lifting cables, inclined lifting cables also yield positive results.
3.
Effects of lifting cable breakage:
(1) Whether lifting cables break under the action of waves in the direction of 135° or 180°, the safety factor curves of the rest of the lifting cables (1–15 as a group, 16–30 as a group) generally present a “middle part drooping” shape distribution. The shape of the tension increase in the remaining lifting cables differs, presenting a “middle part drooping” or a “middle part uplifting” shape distribution. It is more dangerous for lifting cables to break under the action of waves in the direction of 180°.
(2) After lifting cables break, the cables next to them have the most significant fluctuation. The lifting cables at the bow and stern ends should be strengthened to prevent breakage.
Salvaging a shipwreck constitutes a unique operational mode. To delve deeper into the underlying physical principles and to refine the salvage plan’s design, forthcoming endeavors are poised to commence from the following subsequent facets:
(1) Synthesizing CFD theory, potential flow theory, and other analytical methods for numerical simulation: This amalgamation promises to comprehensively comprehend fluid dynamics, interactions of waves, and forces acting on both the vessel and lifting structures.
(2) Addressing exigent and complex marine conditions: The sudden onset of robust winds and tumultuous waves can potentially jeopardize the integrity of hoisting cables. Hence, paramount attention must be directed toward assuring that hoisting cables and their associated components are robust, capable of enduring the most exacting circumstances. Concurrently, the investigation of diverse marine environmental conditions across the globe necessitates implementation. By employing different theories of waves and winds, salvage strategies are formulated to enhance adaptability to a spectrum of sea conditions.
(3) Further study of the hydrodynamic forces model: when the system’s dynamics are more intricate or less stable, we plan to delve deeper into the intricate hydrodynamic forces affecting hoisting cables owing to their interaction with the enveloping fluid environment. A comprehensive evaluation of these variables is essential to minimize the inherent risk of cable deformation and potential failure.
(4) Scrutinizing diverse subaqueous cable configurations: The intricacies in underwater cable arrangements necessitate meticulous examination, encompassing inclinations and vertical configurations.

Author Contributions

Conceptualization: H.Z. and S.C.; methodology: S.C., H.Z. and G.S.; software: H.Z., S.C. and G.S.; validation: H.Z., S.C. and G.S.; formal analysis: H.Z., G.S. and S.C.; resources: S.C. and Y.G.; data curation: G.S., H.Z. and S.C.; writing—original draft preparation: H.Z., S.C. and Y.G.; writing—review and editing: S.C. and H.Z. All authors have read and agreed to the published version of the manuscript.

Funding

(1) The Opening Research Fund of the National Engineering Laboratory for Test and Experiment Technology of Marine Engineering Equipment, grant number 750NEL-2023-01; (2) National Natural Science Foundation of China: U1908228.

Institutional Review Board Statement

Not applicable.

Informed Consent Statement

Not applicable.

Data Availability Statement

Not applicable.

Conflicts of Interest

The authors declare no conflict of interest. The funders played no role in the design of the study; in the collection, analyses, or interpretation of the data; in the writing of the manuscript; or in the decision to publish the results.

Abbreviations

6DOFsroll, pitch, yaw, surge, sway, and heave
MAmaximum absolute value
RMSroot mean square
CVcoefficient of variation
RANSReynolds-averaged Navier–Stokes equations

Appendix A

In light of the paper’s brevity, the important theories are presented in the second section, and supplementary theories are presented within the confines of the Appendix A.
This manuscript employs a viscous fluid model based on the RANS equation. The volume of the fluid domain (VOF) and k-ε turbulence models are utilized. The numerical simulations are conducted using a coupled approach for pressure and velocity.
The free-liquid surface is tracked using the VOF method, where α i represents the phase volume fraction, Vi denotes the volume of phase i in the grid cell, and V represents the volume of the grid cell.
α i = V i V ,   i = 1 N α i = 1
where N is the total number of phases, α i = 0 means no phase i at all, and α i = 1 means completely phase i. Moreover, 0 < α i < 1 means that there is an interface between the phases.
The movement of multiple floating bodies results in relative translation and rotation. This dynamic behavior is elucidated by equations of motion and constraint equations of multifloating bodies:
M q = f
M = M 1 0 0 M n
where q is the vector of generalized coordinates, f is a generalized force, and M is the block-diagonal matrix of the inertia matrices of the rigid bodies.
Combining equations of motion with constraints:
ϕ ( q , t ) = 0
Constraints are expressed as linear conditions of body acceleration. Taking the second derivative of Equation (A4):
J q = Q
Among them, J is the Jacobian matrix of ϕ, q is the acceleration of the bodies, and Q is an inhomogeneity. A constraint force is added to the system. By introducing the Lagrangian multiplier (λ) of all the constraints, the workless constraint force is given by:
f c = J T λ
A vector (λ) is sought such that the constraint force ( f c ) in combination with any external force ( f e x t ) produces a motion that satisfies the constraints, as given by Equation (A5). According to Equation (A6), Equation (A2) can be written as follows:
M q = J T λ + f e x t
q = M 1 J T λ + M 1 f e x t
Generate the following system of linear equations:
A λ = b
where
A = J M 1 J T
b = J M 1 f e x t + Q
λ is obtained through Equation (A9). When λ is known, Equation (A8) is integrated twice to yield the generalized coordinate vector.
Salvaging sunken ships is a special mode of operation. Within this context, the entire salvage mechanism assumes a state of relative equilibrium. Hence, the cable module embedded within the framework of STAR-CCM+ chiefly encompasses elements of greater consequence to the steadiness of maritime undertakings, notably, cable rigidity and submerged mass. Additional variables, including hydrodynamic resistance, and fluid pressure, adhere to the default parameters designated for ordinary sea circumstances. For multifloating body coupled motions, the parameter equations of connecting cables between multifloating bodies are:
x = a u + b sinh ( u ) + α
y = a cosh ( u ) + b 2 s i n h 2 u + β ,   for   u 1 u u
where
a = c λ 0 g b = c a D L e q c = λ 0 L e q g sinh u 2 sinh u 1
Among them, g is the gravitational acceleration and λ0 and Leq are the mass per unit length and slack length of the cable, respectively. The stiffness of the cable is represented by D, and the integral constants α and β depend on the cable’s initial and final connection points as well as its total mass.
Forces f1 and f2 at the first and last ends of the cable are:
f 1 , x = c f 1 , y = c sinh u 1
f 2 , x = c f 2 , y = c sinh u 2
Parameters u1 and u2 indicate the positions of the first and last ends of the cable in space.

References

  1. Pu, H.; Liu, Y.; Luo, J.; Xie, S.; Peng, Y.; Yang, Y.; Yang, Y.; Li, X.; Su, Z.; Gao, S.; et al. Development of an Unmanned Surface Vehicle for the Emergency Response Mission of the ‘Sanchi’ Oil Tanker Collision and Explosion Accident. Appl. Sci. 2020, 10, 2704. [Google Scholar] [CrossRef]
  2. Frodella, W.; Rossi, G.; Tanteri, L.; Rosi, A.; Lombardi, L.; Mugnai, F.; Fanti, R.; Casagli, N. A Decade from the Costa Concordia Shipwreck: Lesson Learned on the Contribution of Infrared Thermography during the Maritime Salvage Operations. Remote Sens. 2023, 15, 1347. [Google Scholar] [CrossRef]
  3. Gray, W. Raising titans: How do you salvage a mega-ship? New Sci. 2013, 220, 48–51. [Google Scholar] [CrossRef]
  4. Rogowska, J.; Wolska, L.; Namieśnik, J. Impacts of pollution derived from ship wrecks on the marine environment on the basis of s/s “Stuttgart” (Polish coast, Europe). Sci. Total Environ. 2010, 408, 5775–5783. [Google Scholar] [CrossRef]
  5. Henkel, L.A.; Nevins, H.; Martin, M.; Sugarman, S.; Harvey, J.T.; Ziccardi, M.H. Chronic oiling of marine birds in California by natural petroleum seeps, shipwrecks, and other sources. Mar. Pollut. Bull. 2014, 79, 155–163. [Google Scholar] [CrossRef]
  6. Zhang, F.; Ning, D.; Hou, J.; Du, H.; Tian, H.; Zhang, K.; Gong, Y. Semi-Active Heave Compensation for a 600-Meter Hydraulic Salvaging Claw System with Ship Motion Prediction via LSTM Neural Networks. J. Mar. Sci. Eng. 2023, 11, 998. [Google Scholar] [CrossRef]
  7. Hahladakis, J.N.; Stylianos, M.; Gidarakos, E. Assessment of released heavy metals from electrical and electronic equipment (EEE) existing in shipwrecks through laboratory-scale simulation reactor. J. Hazard. Mater. 2013, 250–251, 256–264. [Google Scholar] [CrossRef]
  8. Pehlivanides, G.; Monastiridis, K.; Tourtas, A.; Karyati, E.; Ioannidis, G.; Bejelou, K.; Antoniou, V.; Nomikou, P. The VIRTUALDiver Project. Making Greece’s Underwater Cultural Heritage Accessible to the Public. Appl. Sci. 2020, 10, 8172. [Google Scholar] [CrossRef]
  9. Lee, C.; Yoon, H.; Kim, D.; Na, W. Lifting forces required to salvage a sunken vessel and caisson and their response to bottom friction, buoyancy release, surface tension, water capture and water release. Ocean Eng. 2016, 125, 82–89. [Google Scholar] [CrossRef]
  10. Yao, Z.; Wang, W.; Jiang, Y.; Chen, S. Coupled Responses of Sewol, Twin Barges and Slings During Salvage. China Ocean Eng. 2018, 32, 226–235. [Google Scholar] [CrossRef]
  11. Liu, S.; Guo, Q.; Zhao, W. Research on active heave compensation for offshore crane. In Proceedings of the 26th Chinese Control and Decision Conference (2014 CCDC), Changsha, China, 31 May–2 June 2014; IEEE: Piscataway, NJ, USA, 2014; pp. 1768–1772. [Google Scholar]
  12. Raja Ismail, R.M.T.; That, N.D.; Ha, Q.P. Modelling and robust trajectory following for offshore container crane systems. Autom. Constr. 2015, 59, 179–187. [Google Scholar] [CrossRef]
  13. Kang, H.; Wu, Y.; Quen, L.K.; Tang, C.H.; Siow, C. Underwater target tracking of offshore crane system in subsea operations. In Proceedings of the 17th Asian Simulation Conference, Melaka, Malaysia, 27–29 August 2017; Springer: Singapore, 2017; pp. 126–137. [Google Scholar]
  14. Lee, D.; Kim, T.; Park, H.; Kim, Y. A study on the modeling and dynamic analysis of the offshore crane and payload. J. Korean Soc. Fish. Ocean. Technol. 2020, 56, 61–70. [Google Scholar] [CrossRef]
  15. Nam, B.W.; Kim, N.W.; Hong, S.Y. Experimental and numerical study on coupled motion responses of a floating crane vessel and a lifted subsea manifold in deep water. Int. J. Nav. Archit. Ocean Eng. 2017, 9, 552–567. [Google Scholar] [CrossRef]
  16. Zhang, D.; Zhao, B.; Zhu, K.; Jiang, H. Dynamic Analysis of Full-Circle Swinging Hoisting Operation of a Large Revolving Offshore Crane Vessel under Different Wave Directions. J. Mar. Sci. Eng. 2023, 11, 197. [Google Scholar] [CrossRef]
  17. Han, D.; Yoo, S.; Yoon, H.; Kim, M.; Kim, S.; Lee, J. Coupling analysis of finite element and finite volume method for the design and construction of FPSO crane. Autom. Constr. 2011, 20, 368–379. [Google Scholar] [CrossRef]
  18. Zhang, P.; Zhang, S.; Wei, Y.; Le, C.; Ding, H. Hydrodynamic characteristics of the crane vessel-three-bucket jacket foundation coupling hoisting system during the process of lowering. Ocean Eng. 2022, 250, 111034. [Google Scholar] [CrossRef]
  19. Xiao, W.; Li, C.; Fan, L.; Li, Q.; Tan, L. Dynamic Analysis of the Lifting Arm System in the Integrated Offshore Platform Decommissioning Equipment in Complicated Sea States. Processes 2023, 11, 645. [Google Scholar] [CrossRef]
  20. Kim, J.; Chung, W.; Park, S.; Jung, K.; Lee, J. Failure analysis for safety evaluation of capsizing accident of deep cement mixing vessel. Eng. Fail. Anal. 2020, 117, 104795. [Google Scholar] [CrossRef]
  21. Julianto, R.I.; Prabowo, A.R.; Muhayat, N.; Putranto, T.; Adiputra, R. Investigation of hull design to quantify resistance criteria using holtrop’s regression-based method and savitsky’s mathematical model: A study case of fishing vesse. J. Eng. Sci. Technol. 2021, 16, 1426–1443. [Google Scholar]
  22. Thomsen, J.B.; Bergua, R.; Jonkman, J.; Robertson, A.; Mendoza, N.; Brown, C.; Galinos, C.; Stiesdal, H. Modeling the TetraSpar Floating Offshore Wind Turbine Foundation as a Flexible Structure in OrcaFlex and OpenFAST. Energies 2021, 14, 7866. [Google Scholar] [CrossRef]
  23. Chen, M.; Yuan, G.; Li, C.B.; Zhang, X.; Li, L. Dynamic Analysis and Extreme Response Evaluation of Lifting Operation of the Offshore Wind Turbine Jacket Foundation Using a Floating Crane Vessel. J. Mar. Sci. Eng. 2022, 10, 2023. [Google Scholar] [CrossRef]
  24. Song, S.; Demirel, Y.K.; Atlar, M. An investigation into the effect of biofouling on the ship hydrodynamic characteristics using CFD. Ocean Eng. 2019, 175, 122–137. [Google Scholar] [CrossRef]
  25. Jiao, J.; Huang, S.; Soares, C.G. Numerical investigation of ship motions in cross waves using CFD. Ocean Eng. 2021, 223, 108711. [Google Scholar] [CrossRef]
  26. Jasak, H.; Vukčević, V.; Gatin, I.; Lalovi’c, I. CFD validation and grid sensitivity studies of full scale ship self propulsion. Int. J. Nav. Arch. Ocean Eng. 2019, 11, 33–43. [Google Scholar] [CrossRef]
  27. Islam, H.; Ventura, M.; Soares, C.G.; Tadros, M.; Abdelwahab, H.S. Comparison between empirical and CFD based methods for ship resistance and power prediction. Trends Mar. Technol. Eng. 2022, 1, 347–357. [Google Scholar]
  28. Kim, D.; Tezdogan, T. CFD-based hydrodynamic analyses of ship course keeping control and turning performance in irregular waves. Ocean Eng. 2022, 248, 110808. [Google Scholar] [CrossRef]
  29. Wang, J.; Wan, D. CFD study of ship stopping maneuver by overset grid technique. Ocean Eng. 2020, 197, 106895. [Google Scholar] [CrossRef]
  30. Andersson, J.; Shiri, A.A.; Bensow, R.E.; Yixing, J.; Chengsheng, W.; Gengyao, Q.; Deng, G.; Queutey, P.; Xing-Kaeding, Y.; Horn, P. Ship-scale CFD benchmark study of a pre-swirl duct on KVLCC2. Appl. Ocean Res. 2022, 123, 103134. [Google Scholar] [CrossRef]
  31. Huang, S.; Jiao, J.; Soares, C.G. Uncertainty analyses on the CFD–FEA co-simulations of ship wave loads and whipping responses. Mar. Struct. 2022, 82, 103129. [Google Scholar] [CrossRef]
  32. Dean, M.S. Springer Handbook of Ocean Engineering, 1st ed.; Springer: Cham, Switzerland, 2016; pp. 985–1066. [Google Scholar]
  33. Xin, S.; Wang, Y.; Wang, L.; Wang, X. A safety assessment approach of the salvage based on salvor–cable–wreck coupled simulations. Ocean Eng. 2023, 269, 113537. [Google Scholar] [CrossRef]
  34. Xin, S.; Wang, Y.; Wang, L.; Zhu, X.; Chen, S.; Zhou, D. Dynamic analysis of the mooring system of a salvage barge: A coupled time-domain method considering seabed resistance during the off-bottom stage. Ocean Eng. 2023, 275, 114078. [Google Scholar] [CrossRef]
  35. Guo, C.; Wang, X.; Chen, C.; Li, Y.; Hu, J. Numerical Investigation of Self-Propulsion Performance and Noise Level of DARPA Suboff Model. J. Mar. Sci. Eng. 2023, 11, 1206. [Google Scholar] [CrossRef]
  36. Song, Y.; Zhang, N.; Huang, G.; Sun, Z. Experimental study on motions of tunnel element during immersion standby stage in long wave regime. Ocean Eng. 2018, 161, 29–46. [Google Scholar] [CrossRef]
  37. Song, Y.; Sun, Z.; Huang, G.; Chen, N.; Gao, X. An experimental investigation on the effect of the ballasting on the coupled dynamics of the tunnel immersion system. Ocean Eng. 2019, 190, 106412. [Google Scholar] [CrossRef]
  38. Flaus, J.M. Risk Analysis: Socio-Technical and Industrial Systems, 1st ed.; Wiley: New York, NY, USA, 2013; pp. 151–178. [Google Scholar]
  39. Liu, Y. Analysis of Coupled Dynamic Response Characteristics of Large Tonnage Shipwreck Salvage Multibody System in Complex Environment. Master’s Thesis, Jiangsu University of Science and Technology, Zhenjiang, China, 2020. [Google Scholar]
  40. Wheeler, M.P.; Matveev, K.I.; Xing, T. Numerical Study of Hydrodynamics of Heavily Loaded Hard-Chine Hulls in Calm Water. J. Mar. Sci. Eng. 2021, 9, 184. [Google Scholar] [CrossRef]
  41. Clark, C.G.; Lyons, D.G.; Neu, W.L. Comparison of single and overset grid techniques for CFD simulations of a surface effect ship. In Proceedings of the International Conference on Offshore Mechanics and Arctic Engineering, San Francisco, CA, USA, 8–13 June 2014; American Society of Mechanical Engineers: New York, NY, USA, 2014; pp. V2T–V8T. [Google Scholar]
  42. Gu, M.; Bu, S.X.; Qiu, G.; Zeng, K.; Wu, C.; Lu, J. Validation of CFD simulation for ship roll damping using one pure car Carrier and one standard model. In Proceedings of the 15th International Ship Stability Workshop, Stockholm, Sweden, 13–15 June 2016. [Google Scholar]
  43. Zhao, B.; Jiang, H.; Sun, J.; Zhang, D. Research on the Hydrodynamic Performance of a Pentamaran in Calm Water and Regular Waves. Appl. Sci. 2023, 13, 4461. [Google Scholar] [CrossRef]
Figure 1. Schematic diagram of a twin-barge salvage system: (a) overall; (b) partial; (c) top view. Process 1 (P1) represents the initial state of the shipwreck recovery, during which the shipwreck starts to detach from the seabed. Process 2 (P2) indicates that half of the salvage operation has been accomplished. Process 3 (P3) signifies the stage where a portion of the shipwreck structure becomes visible at the water’s surface.
Applsci 13 09420 g001
Figure 2. The computational domain and boundary conditions.
Applsci 13 09420 g002
Figure 3. The schematic diagram of the grid.
Applsci 13 09420 g003
Figure 4. Experimental layout and equipment: (a) Wave-making pool; (b) The salvage scene of a shipwreck; (c) Shipwreck; (d) The equipment used to adjust the center of gravity and moment of inertia; (e) Lifting barge; (f) Tension sensor; (g) The instrument for measuring the ship’s attitude.
Applsci 13 09420 g004
Figure 5. RAOs of 6DOFs: (a) Roll; (b) Pitch; (c) Yaw; (d) Surge; (e) Sway; (f) Heave.
Applsci 13 09420 g005aApplsci 13 09420 g005b
Figure 6. Increments in the maximum tension value of the lifting cables.
Applsci 13 09420 g006
Figure 7. Schematic diagram of the salvage of a sunken ship under the action of waves in the direction of 135°.
Applsci 13 09420 g007
Figure 8. Maximum absolute motion amplitude of 6DOFs under wave action in 135° direction: (a) roll, pitch, and yaw amplitudes; (b) surge, sway, and heave amplitudes.
Applsci 13 09420 g008
Figure 9. Maximum tension values of mooring cables under wave action in the 135° direction.
Applsci 13 09420 g009
Figure 10. Maximum tension and safety factor of lifting cables.
Applsci 13 09420 g010
Figure 11. Maximum absolute motion amplitude of 6DOFs under waves in different directions: (a) Roll amplitude; (b) Pitch amplitude; (c) Yaw amplitude; (d) Surge amplitude; (e) Sway amplitude; (f) heave amplitude.
Applsci 13 09420 g011aApplsci 13 09420 g011bApplsci 13 09420 g011c
Figure 12. Summary diagrams of three assessment elements (RMS, MA, and CV) of 6DOFs in different wave directions: (a) roll response; (b) pitch response; (c) yaw response; (d) surge response; (e) sway response; (f) heave response.
Applsci 13 09420 g012aApplsci 13 09420 g012bApplsci 13 09420 g012c
Figure 13. Scores of SDOF under the action of waves in different directions: (a) Roll; (b) Pitch; (c) Yaw; (d) Surge; (e) Sway; (f) Heave.
Applsci 13 09420 g013aApplsci 13 09420 g013b
Figure 14. Total scores of Safety and Stability of 6DOFs under the action of waves in different directions.
Applsci 13 09420 g014
Figure 15. Maximum tensions and safety factors of lifting cables under the action of waves from different directions.
Applsci 13 09420 g015
Figure 16. Maximum values of cable tension in P1, P2, P3 stages under the action of waves in different directions: (a) 180°; (b) 155°; (c) 135°; (d) 115°; (e) 90°.
Applsci 13 09420 g016aApplsci 13 09420 g016b
Figure 17. Increases in the maximum tension values of lifting cables under the action of waves from different directions: (a) 155°; (b) 135°; (c) 115°; (d) 90°.
Applsci 13 09420 g017
Figure 18. Schematic diagram of salvaging a shipwreck in deep water: (a) Schemes 1–4 and (b) Scheme 5.
Applsci 13 09420 g018
Figure 19. Increases in the maximum absolute motion amplitudes of 6DOFs after adding connecting cables among the three ships.
Applsci 13 09420 g019
Figure 20. Scores of single DOFs for five schemes.
Applsci 13 09420 g020
Figure 21. Total scores of 6DOFs for the five schemes.
Applsci 13 09420 g021
Figure 22. Maximum tension value of all the lifting cables under the action of inclined lifting cables.
Applsci 13 09420 g022
Figure 23. Transient increase in safety factor of the remaining lifting cables after the lifting cables at different positions are broken: (a) Mode 1; (b) Mode 2; (c) Mode 3; (d) Mode 4; (e) Mode 5; (f) Mode 6.
Applsci 13 09420 g023aApplsci 13 09420 g023b
Table 1. Parameters of the ship model.
ParameterLifting Barge ALifting Barge BShipwreck
(Fully Submerged/Partially Out of Water)
Length (m)140140210
Width (m)55.8955.8922.81
Depth (m)13.313.320.85
Draught (m)8.68.6280/140/15.9
Displacement (kg)6.39 × 1076.39 × 1074.83 × 107/4.45 × 107
Center of
gravity (m)
x = 71.26,
y = −3.55, z = 7.04
x = 71.26,
y = 2.45, z = 7.04
x = 70.56, y = −0.833,
z = 6.53/6.36/6.05
Salvage weight (kg)1.17 × 10⁷/1.06 × 107/1.09 × 107
Ixx2.18 × 10102.13 × 10103.52 × 109/3.31 × 109/3.13 × 109
Iyy1.24 × 10111.24 × 10111.33 × 1011/1.31 × 1011/1.22 × 1011
Izz1.41 × 10111.40 × 10111.33 × 1011/1.31 × 1011/1.21 × 1011
Table 2. Parameters of the cable model.
ParameterMooring CableLifting Cable
Diameter (m)0.060.124
Wet weight (kg/m)15.7867.4
Axial rigidity (N)3.19 × 1081.36 × 109
Breaking force (N)3.24 × 1061.38 × 107
Table 3. Assessment Rules for Mode 1.
CategoryElementsRuleScore
(SA or ST)
Remark
Safety The MA and RMS of the 6DOFs of the three vessels are chosen as the two assessment elements.Both assessment elements in P2 are lower than the average of the corresponding assessment elements in P1 and P3.1Safe
One of the assessment elements in P2 exceeds the average of the corresponding assessment elements in P1 and P3, but it is not the maximum value among P1, P2, and P3.2Medium
One of the assessment elements in P2 represents the maximum value among corresponding assessment elements in P1, P2, and P3.3Unsafe
StabilityThe CV of the 6DOFs of the three vessels is selected as the assessment element.The assessment elements in P2 are lower than the average of the corresponding assessment elements in P1 and P3.1Stable
The assessment elements in P2 exceed the average value of the corresponding assessment elements in P1 and P3, but it is not the maximum value among P1, P2, and P3.2Medium
The assessment elements in P2 represent the maximum values among corresponding assessment elements in P1, P2, and P3.3Unstable
Table 4. Analysis of three grids.
GroupCells (Millions)Roll (Deg)L1 (F/106 N)L5 (F/106 N)L7 (F/106 N)
Coarse271.846 6.442 5.218 5.046
Medium331.894 6.277 5.110 4.969
Fine391.929 6.129 5.024 4.901
Table 5. The safety assessment scores of the three ships under the action of waves in different directions.
Working
Conditions
6DOFsSafety ScoreStability ScoreMode 1
Score
Ranking
Score
WeightSingle DOF
Score
Mode 2
Score
ABCABC
90°Roll113323615.000 1.597.500 256.833
Pitch1211311.500 1.2516.875
Yaw2111114.167 1.2536.458
Surge3231111.000 111.000
Sway1113334.167 150.000
Heave3112115.000 145.000
115°Roll113333653.667 1.577.000 212.458
Pitch2121331.833 1.2527.500
Yaw2311131.500 1.2520.625
Surge1112223.000 127.000
Sway1111333.333 133.333
Heave3112113.000 127.000
135°Roll112331623.333 1.555.000 209.292
Pitch2331332.833 1.2553.125
Yaw1311113.167 1.2531.667
Surge1331112.333 123.333
Sway1233112.500 127.500
Heave2111112.667 118.667
155°Roll111331701.667 1.525.000 252.583
Pitch3333334.667 1.25105.000
Yaw1113131.500 1.2518.750
Surge2323223.667 151.333
Sway1111233.500 131.500
Heave2212112.333 121.000
180°Roll112311571.333 1.518.000 198.875
Pitch2222324.167 1.2567.708
Yaw1111314.667 1.2546.667
Surge1111115.000 130.000
Sway1213131.500 116.500
Heave2213112.000 120.000
Table 6. Modes for breakage of lifting cables.
ModeBroken Cable Number for
Lifting-Barge A
Broken Cable Number for
Lifting-Barge B
Mode 1#1, #15#16, #30
Mode 2#3, #13#18, #28
Mode 3#5, #11#20, #26
Mode 4#7, #8#22, #23
Mode 5#1, #2, #14, #15#16, #17, #29, #30
Mode 6#2, #3, #13, #14#17, #18, #28, #29
Disclaimer/Publisher’s Note: The statements, opinions and data contained in all publications are solely those of the individual author(s) and contributor(s) and not of MDPI and/or the editor(s). MDPI and/or the editor(s) disclaim responsibility for any injury to people or property resulting from any ideas, methods, instructions or products referred to in the content.

