Article

Fatigue Crack Growth Studies under Mixed-Mode Loading in AISI 316 Stainless Steel

by
Abdulnaser M. Alshoaibi
* and
Abdullateef H. Bashiri
Mechanical Engineering Department, College of Engineering, Jazan University, P.O. Box 114, Jazan 45142, Saudi Arabia
*
Author to whom correspondence should be addressed.
Appl. Sci. 2023, 13(16), 9446; https://doi.org/10.3390/app13169446
Submission received: 17 July 2023 / Revised: 4 August 2023 / Accepted: 17 August 2023 / Published: 21 August 2023
(This article belongs to the Special Issue Focus on Fatigue and Fracture of Engineering Materials, Volume II)

Abstract

:
The objective of this study is to examine the behavior of fatigue crack growth (FCG) in the mixed mode (I/II) of the AISI 316 austenitic stainless steel alloy, considering mode mixity angles of 30°, 45°, and 60°. This particular alloy is widely used in the marine industry and various structural components because of its exceptional properties, such as high corrosion resistance, good formability, weldability, and high-temperature strength. By investigating the crack growth behavior, the study seeks to provide insights into the material’s durability and potential for long-term use in demanding applications. To analyze fatigue crack growth behavior using linear elastic fracture mechanics (LEFM), this study utilizes compact tension shear (CTS) specimens with varying loading angles. The CTS specimens provide an accurate simulation of real-world loading conditions by allowing for the application of various loading configurations, resulting in mixed-mode loading. The ANSYS Mechanical APDL 19.2 software, which includes advanced features such as separating, morphing, and adaptive remeshing technologies (SMART), was utilized in this study to precisely model the path of crack propagation, evaluate the associated fatigue life, and determine stress intensity factors. Through comparison with experimental data, it was confirmed that the loading angle had a significant impact on both the fatigue crack growth paths and the fatigue life cycles. The stress-intensity factor predictions from numerical models were compared to analytical data. Interestingly, it was observed that the maximum shear stress and von Mises stresses occurred when the loading angle was 45 degrees, which is considered a pure shear loading condition. The comparison shows consistent results, indicating that the simulation accurately captures the behavior of the AISI 316 austenitic stainless steel alloy under mixed-mode loading conditions.

1. Introduction

Studying the behavior of fatigue crack growth under mixed-mode loading conditions at different angles is a crucial research area with significant implications for the safety and design of various engineering structures. It entails examining how cracks respond to cyclic loading when subjected to a combination of different modes of loading, such as tensile, shear, or bending modes, at varying angles relative to the crack plane. The understanding of this behavior is essential in predicting the remaining useful life of structures and ensuring their safe and reliable operation. Therefore, investigating fatigue crack growth under mixed-mode loading conditions at various angles is a critical aspect of structural analysis and design, particularly in fields such as aerospace, aircraft wings, automotive components, and turbine blades [1,2]. The safe and reliable operation of structures and components that are subjected to cyclic loading over time is heavily reliant on the accurate prediction of fatigue crack growth behavior. Structures designed without taking the effects of mixed-mode loading and loading angles into account can experience premature failure, which can result in catastrophic consequences such as loss of life and property damage. Therefore, it is crucial to consider the effects of mixed-mode loading and loading angles when designing structures, to predict their fatigue life accurately. Many real-world structures are subjected to mixed-mode loading and differing loading angles, and failure due to fatigue crack growth is a common problem [3,4,5]. Understanding the behavior of cracks under these loading conditions, engineers can design more reliable and durable structures [6,7,8,9].
There are various methods available for demonstrating the analysis of fatigue in materials, but three methods are most commonly used. The first one is the stress-life (S-N) method, which was proposed by Wöhler [10]. This approach involves plotting the stress amplitude against the number of cycles until failure, represented in an S-N curve. It is mostly utilized for metallic materials and assumes that the material’s failure is related to its stress level and the number of cycles it undergoes. The second method is the strain-life (ε-N) method, introduced by Coffin [11]. This technique involves plotting the strain amplitude against the number of cycles until failure, represented in an ε-N curve. It is primarily used for non-metallic materials, such as composites and polymers, as they exhibit strain-based failure mechanisms. Lastly, Paris and Erdogan [12] developed the fracture mechanics method, which correlates the rate of crack propagation with the stress-intensity factor range. This technique monitors the growth of a pre-existing crack under cyclic loading conditions until it reaches a critical size and leads to catastrophic failure. It is commonly used for predicting the fatigue life of materials that contain pre-existing cracks or defects, such as castings or welded structures. For a more comprehensive understanding of mixed-mode fracture behavior, researchers recommend using different loading devices and specimen types in experimental studies. In this study, the third method was utilized to predict the fatigue life of materials. This approach involves describing the crack tip separately by using stress-intensity factors (SIFs). Research on fatigue crack growth under mixed-mode loading has been ongoing for several decades. Many studies have investigated the effects of different loading conditions on the growth rate and direction of fatigue cracks, as well as the corresponding SIFs [13,14,15,16]. Researchers have conducted significant studies to create reliable and effective models for accurately predicting the propagation of fatigue cracks and the corresponding fatigue life in order to prevent fatigue failure. Although various experimental models have been suggested, conducting such experiments can often be a costly and time-consuming process. The CTS specimen, which was first proposed by Richard [17,18], is the predominant specimen utilized in planar mixed-mode I/II experimental tests [1,13,14,15,16,17,19,20,21,22].
Currently, there are numerous software options available to address the issue of fatigue crack growth, such as ABAQUS [23,24], FRANC3D [25,26,27], ZENCRACK [28,29], ANSYS [30,31,32,33,34], and BEASY [35]. Therefore, utilizing numerical simulation with the finite element method (FEM) is a viable method for reducing the time and cost associated with experimental work. Sajith et al. [36] conducted a numerical study on the CTS specimen using an older version of ANSYS, which lacked the SMART crack growth feature used in the present study. The SMART crack growth feature in ANSYS APDL 19.2 enables a more efficient and precise simulation of fatigue crack growth by automating the crack creation and growth process and employing advanced algorithms to predict the crack growth path. In contrast, older versions of ANSYS APDL require more manual intervention, leading to a more time-consuming and less accurate modeling and crack growth process. The current state of using numerical simulations to model mixed-mode fatigue crack growth in CTS specimens involves advanced techniques and tools such as the SMART crack growth feature in ANSYS APDL 19.2. This feature allows for more efficient and accurate simulation of fatigue crack growth by automating the process of creating and growing cracks and employing advanced algorithms to predict the crack growth path. This study aims to investigate the use of ANSYS APDL 19.2 software as an effective tool for accurately predicting the crack growth trajectories, stress-intensity factors (SIFs), and associated fatigue life of the compact tension shear specimen, which has been widely used in numerous studies on mixed-mode (I/II) fatigue crack growth. The limitations of utilizing ANSYS smart crack growth include its capability to solely simulate fatigue crack growth for materials exhibiting linear-elastic fracture mechanics and the requirement for significant expertise and experience to use it effectively, which may restrict its accessibility to certain users.

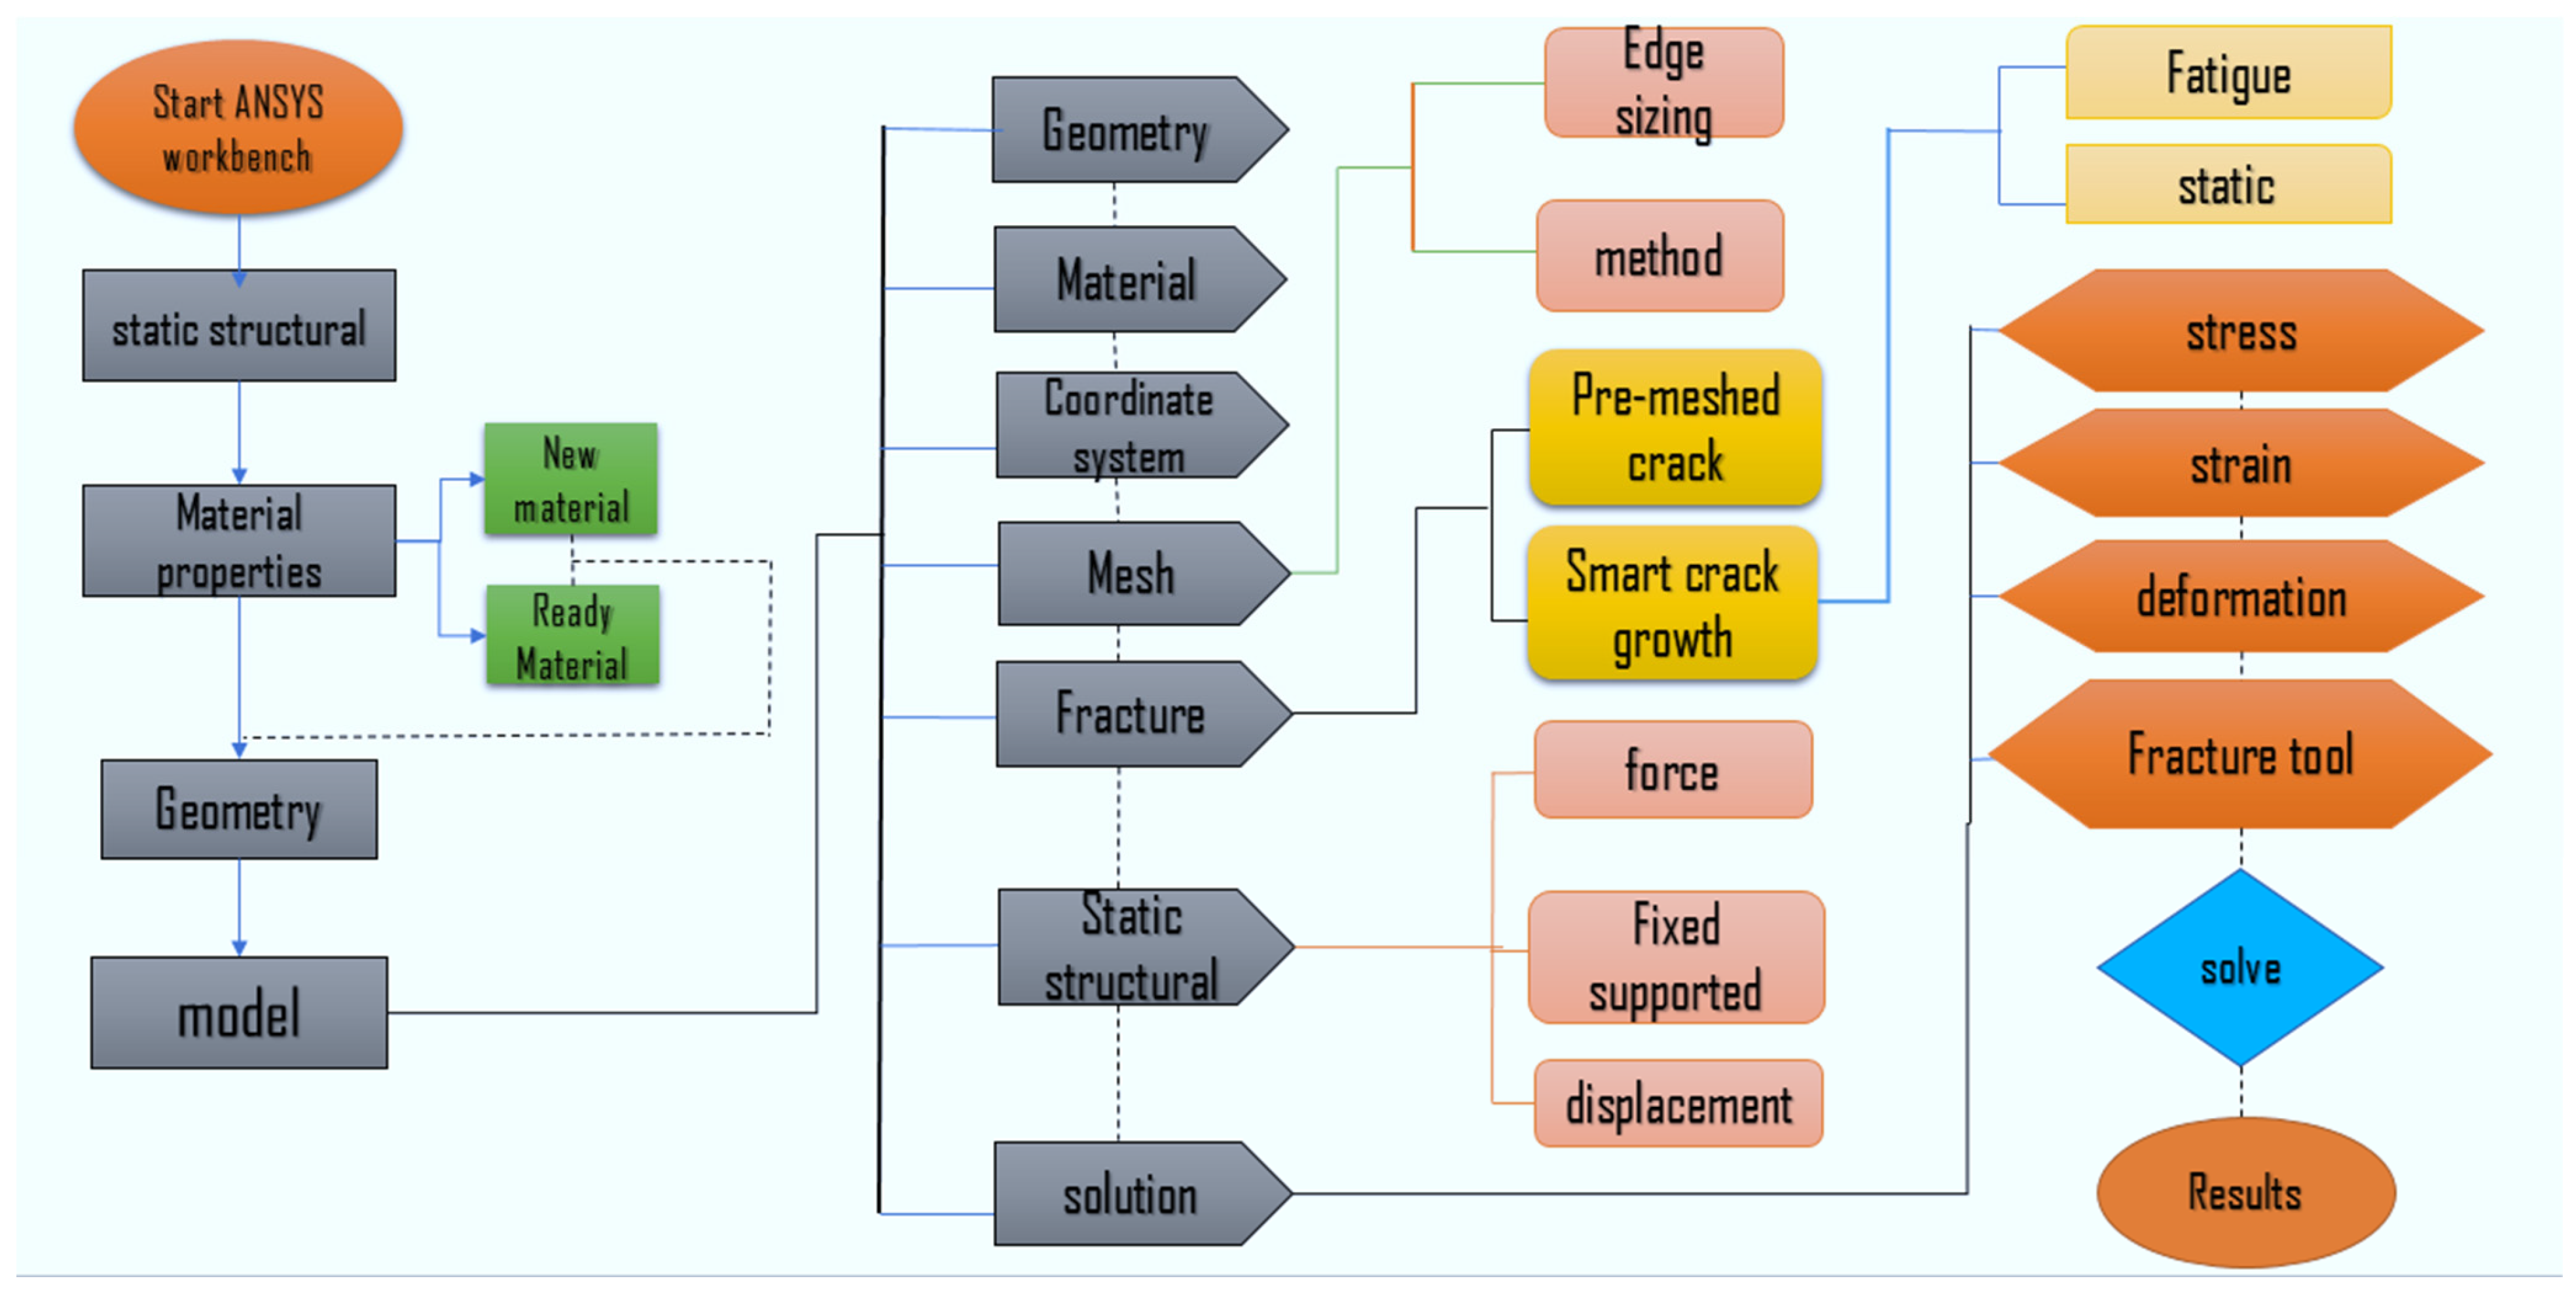
2. ANSYS Procedure for Fatigue Analysis

Mixed-mode fatigue life evaluation is an essential process for predicting the durability of materials that undergo cyclic loading conditions with different loading modes. ANSYS is a powerful software package commonly used in engineering applications, including fatigue life evaluation. ANSYS has the capability to model three types of cracks: arbitrary, semi-elliptical, and pre-meshed cracks. Among these, the pre-meshed crack approach is used in the “Smart Crack Growth” analysis tool. This tool utilizes the crack front to calculate the stress-intensity factor, which is the failure criterion. The “Smart Crack Growth” simulation tool uses this approach to simulate the propagation of cracks. The separating, morphing, and adaptive remeshing technologies (SMART) is a set of advanced capabilities in ANSYS that enable the simulation of complex and large deformations in structural mechanics problems. SMART technology includes three main features:
  • Separating technology: this feature allows for the separation of different components within a model, making it possible to simulate the deformation of individual parts separately. This is particularly useful when simulating complex structures that have many moving parts.
  • Morphing technology: this feature enables the morphing of a mesh to match the deformation of the structure during simulation. This is achieved by updating the nodal positions of the mesh based on the deformation of the structure.
  • Adaptive remeshing technology: this feature enables the automatic refinement of the mesh in regions where high deformation gradients are present, improving the accuracy of the simulation. This feature is especially useful in simulating crack propagation, where accurate stress gradient capture necessitates mesh refinement around the crack tip.
The variation in crack initiation angle under different mixed-mode loading conditions is a well-established phenomenon. To address this issue, several researchers have proposed various fracture criteria. Within linear elastic fracture mechanics (LEFM), fracture criteria are typically categorized into three groups: stress-based, strain-based, and energy-based. The stress-based group includes the maximum tangential stress (MTS) criterion [37], the strain-based group includes the maximum tangential strain (MTSN) criterion [38], and the energy-based group includes the strain energy density (SED) criterion [39] and the maximum energy release rate (MERR) criterion [40]. The maximum circumferential stress criterion is one of the criteria that ANSYS uses to evaluate the crack growth under mixed-mode loading conditions which was used in the present study. This criterion is based on the assumption that the crack growth occurs in the direction of maximum circumferential stress. The criterion involves calculating the stress-intensity factors for each mode of loading and combining them to obtain the total stress-intensity factor. The crack growth direction is then determined based on the direction of the maximum circumferential stress, which is perpendicular to the direction of the total stress-intensity factor. The ratio of modes of stress-intensity factors (SIFs) at the crack tip can be used to estimate the angle θ, which defines the path of crack propagation [41,42,43]. The formula used in this criterion to determine the direction of crack propagation is [44,45]:
θ = cos 1 3 K I I 2 + K I K I 2 + 8 K I I 2 K I 2 + 9 K I I 2
where:
KI and KII correspond to the opening and in-plane shear modes, respectively.
The ANSYS simulation performed in this study is limited to region II of a typical cyclic-loading-induced crack growth pattern. In this region, the crack growth rate (da/dN) is proportional to the maximum SIFs and can be evaluated as the following modified formula of the Paris law:
d a d N = C ( Δ K e q ) m
where:
Δ K e q is the equivalent SIF and C and m are the Paris law’s coefficient and the Paris law’s exponent, respectively.
In ANSYS, the equation that expresses the equivalent range for the stress-intensity factor formula can be written as follows [46]:
Δ K e q = 1 2 cos ( θ 2 ) Δ K I ( 1 + cos θ ) 3 Δ K I I s i n θ
Equation (2) can be used to calculate the fatigue life cycles (N) corresponding to a certain crack increment, Δ a as:
0 Δ a d a C ( Δ K e q ) m = 0 Δ N d N = Δ N
Figure 1 represents a schematic of the step-by-step process for performing a fatigue crack growth simulation using ANSYS.

3. Numerical Results and Discussions

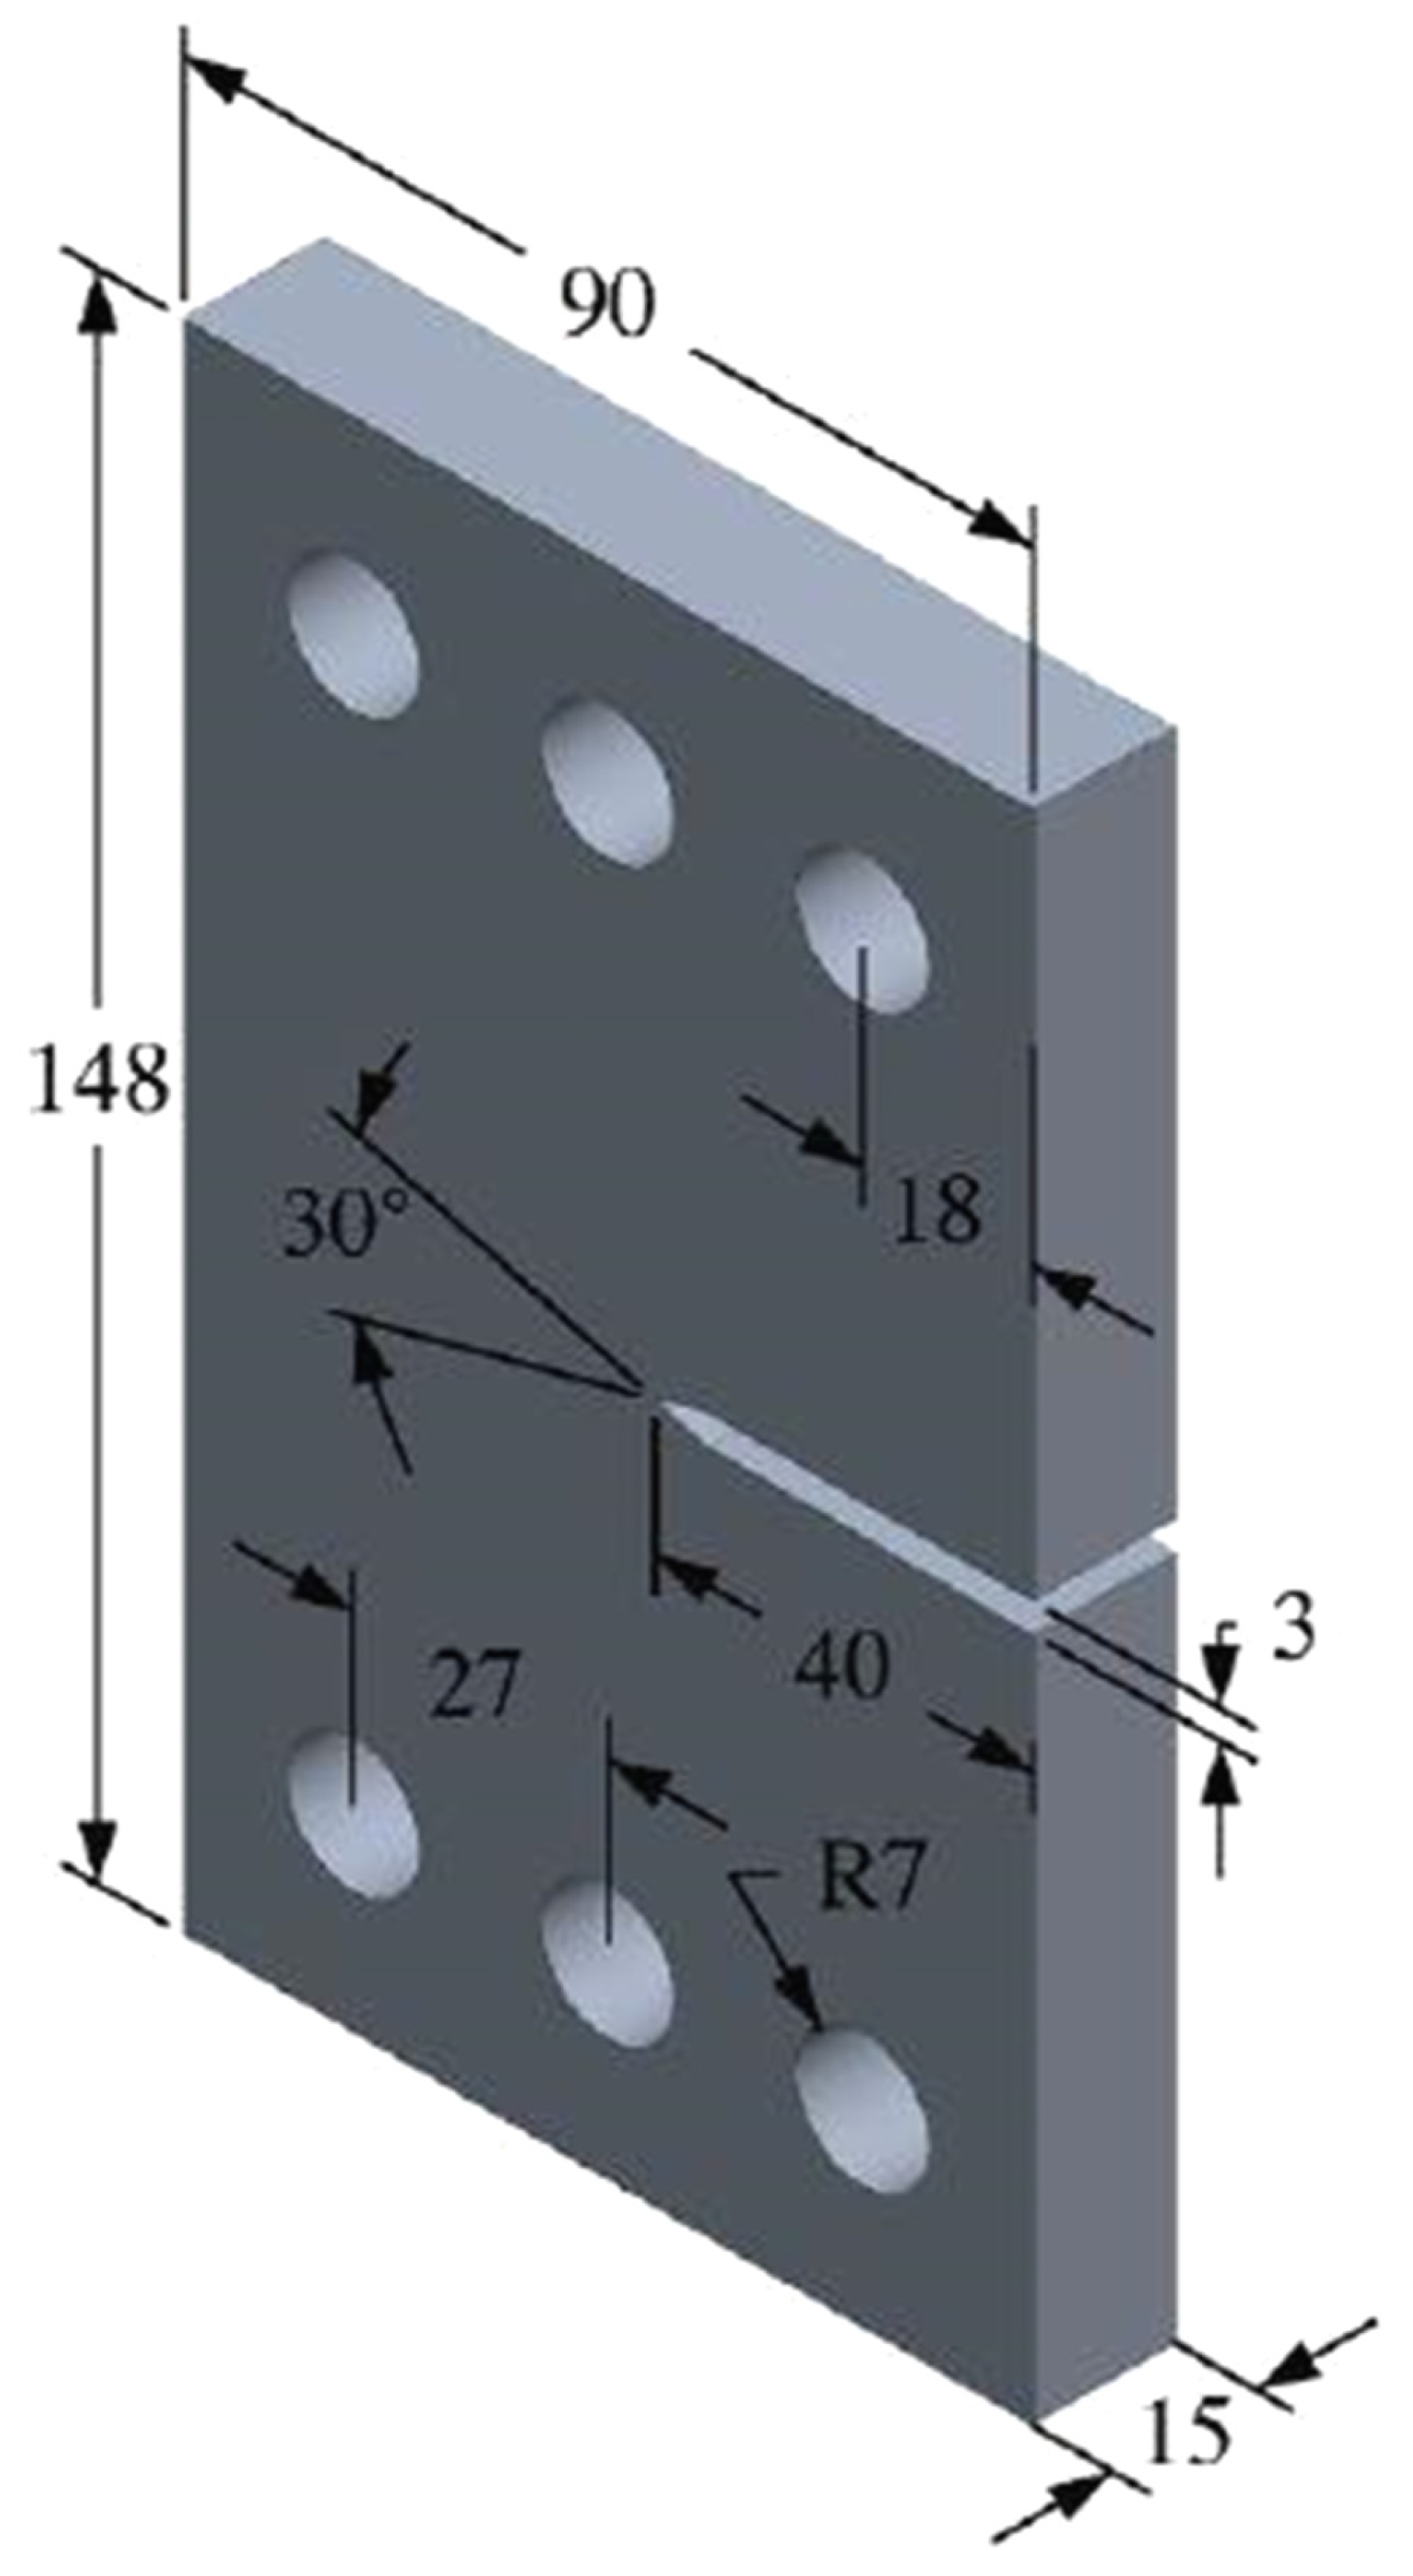
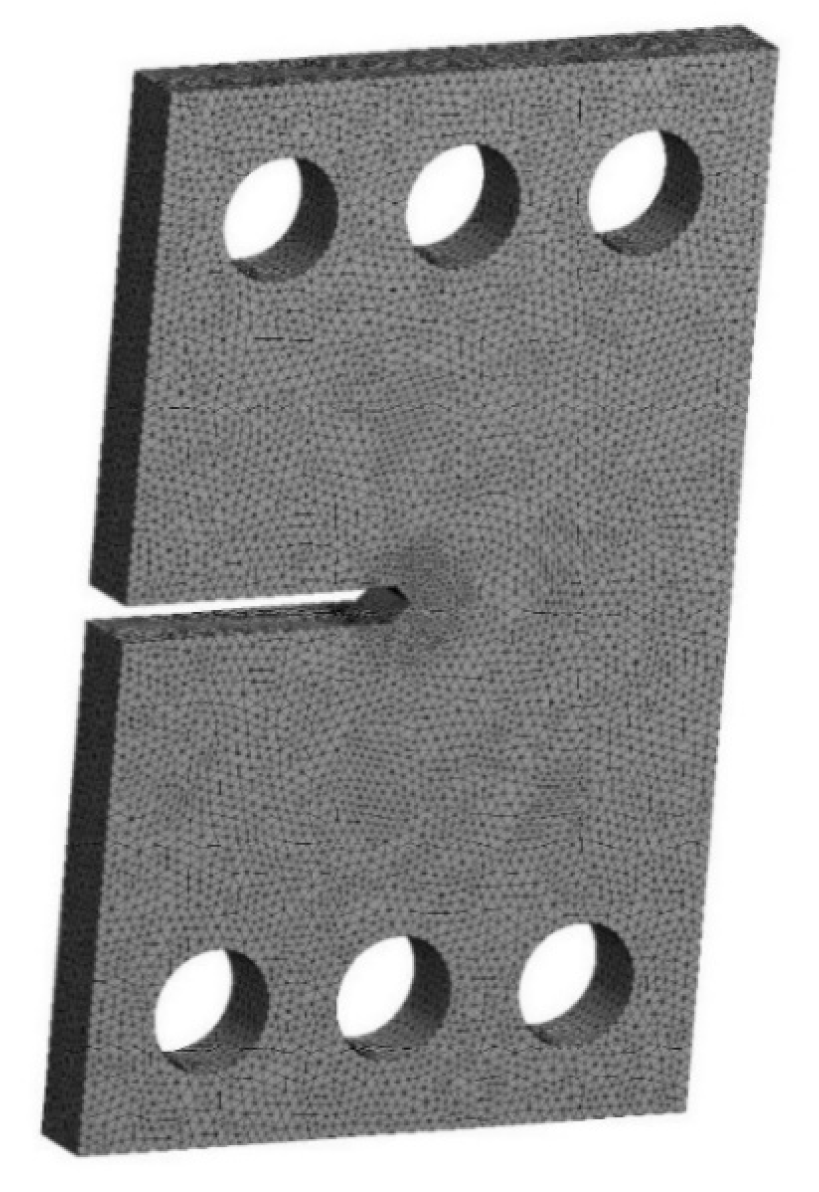
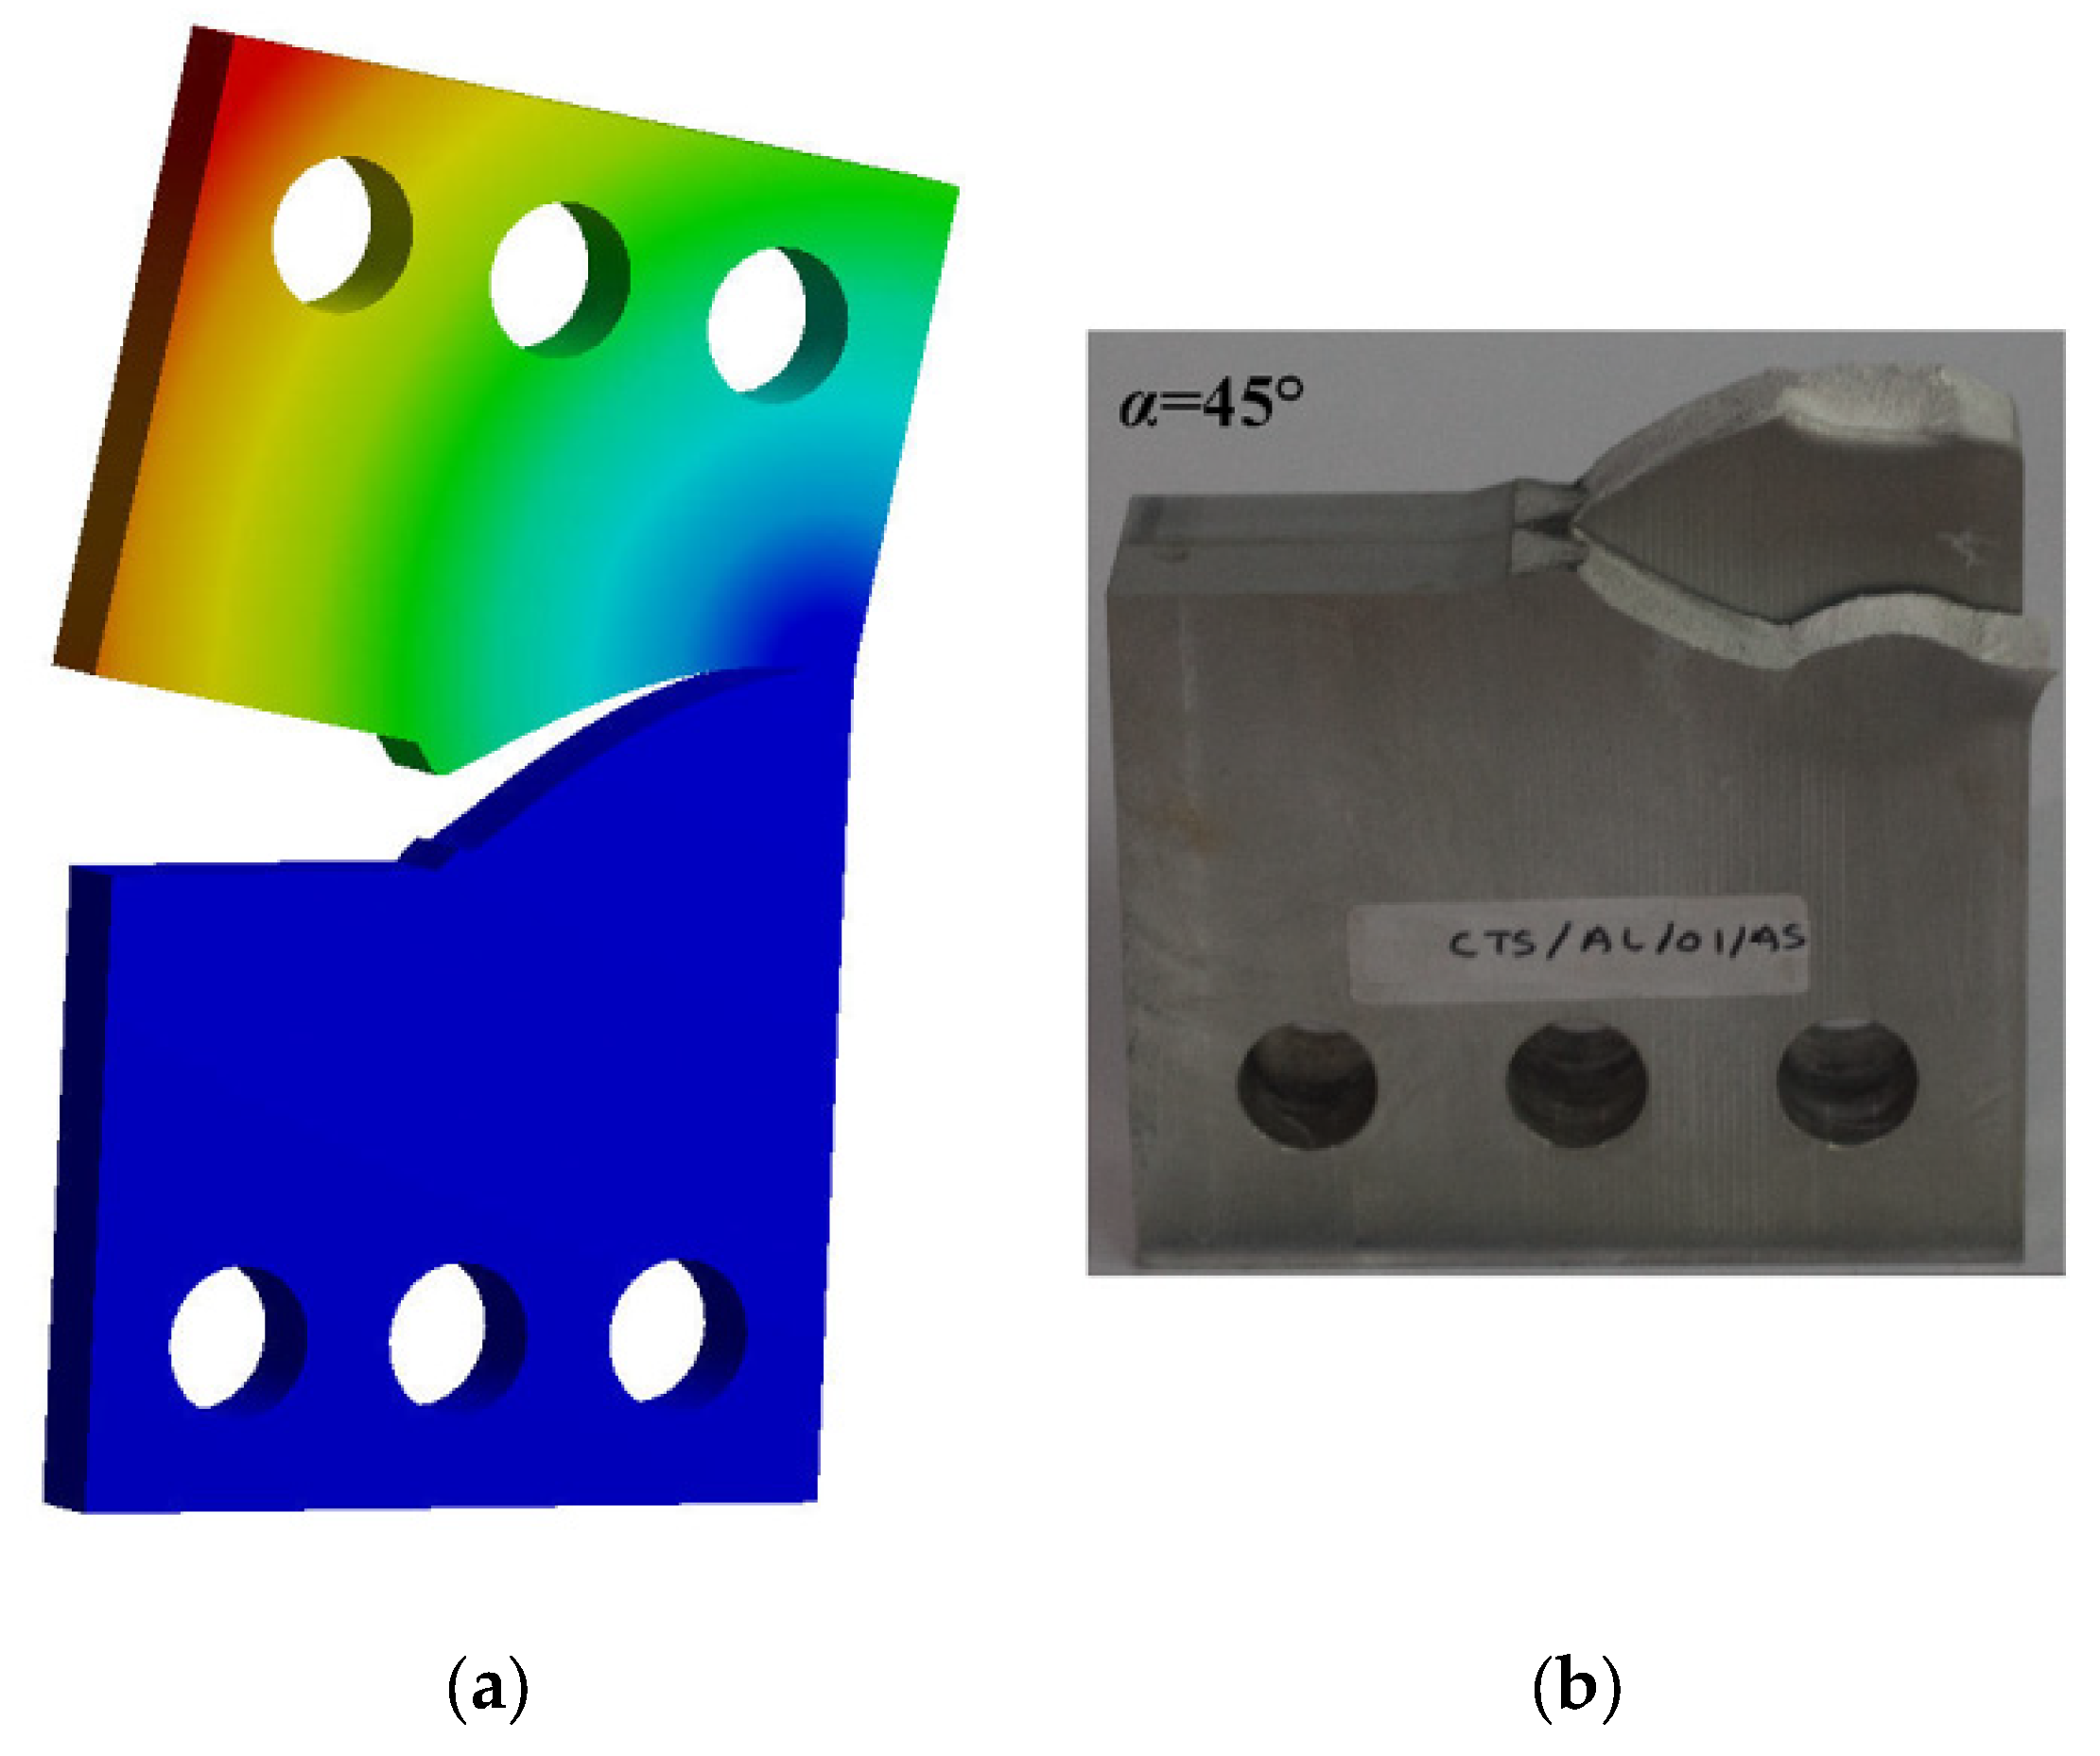
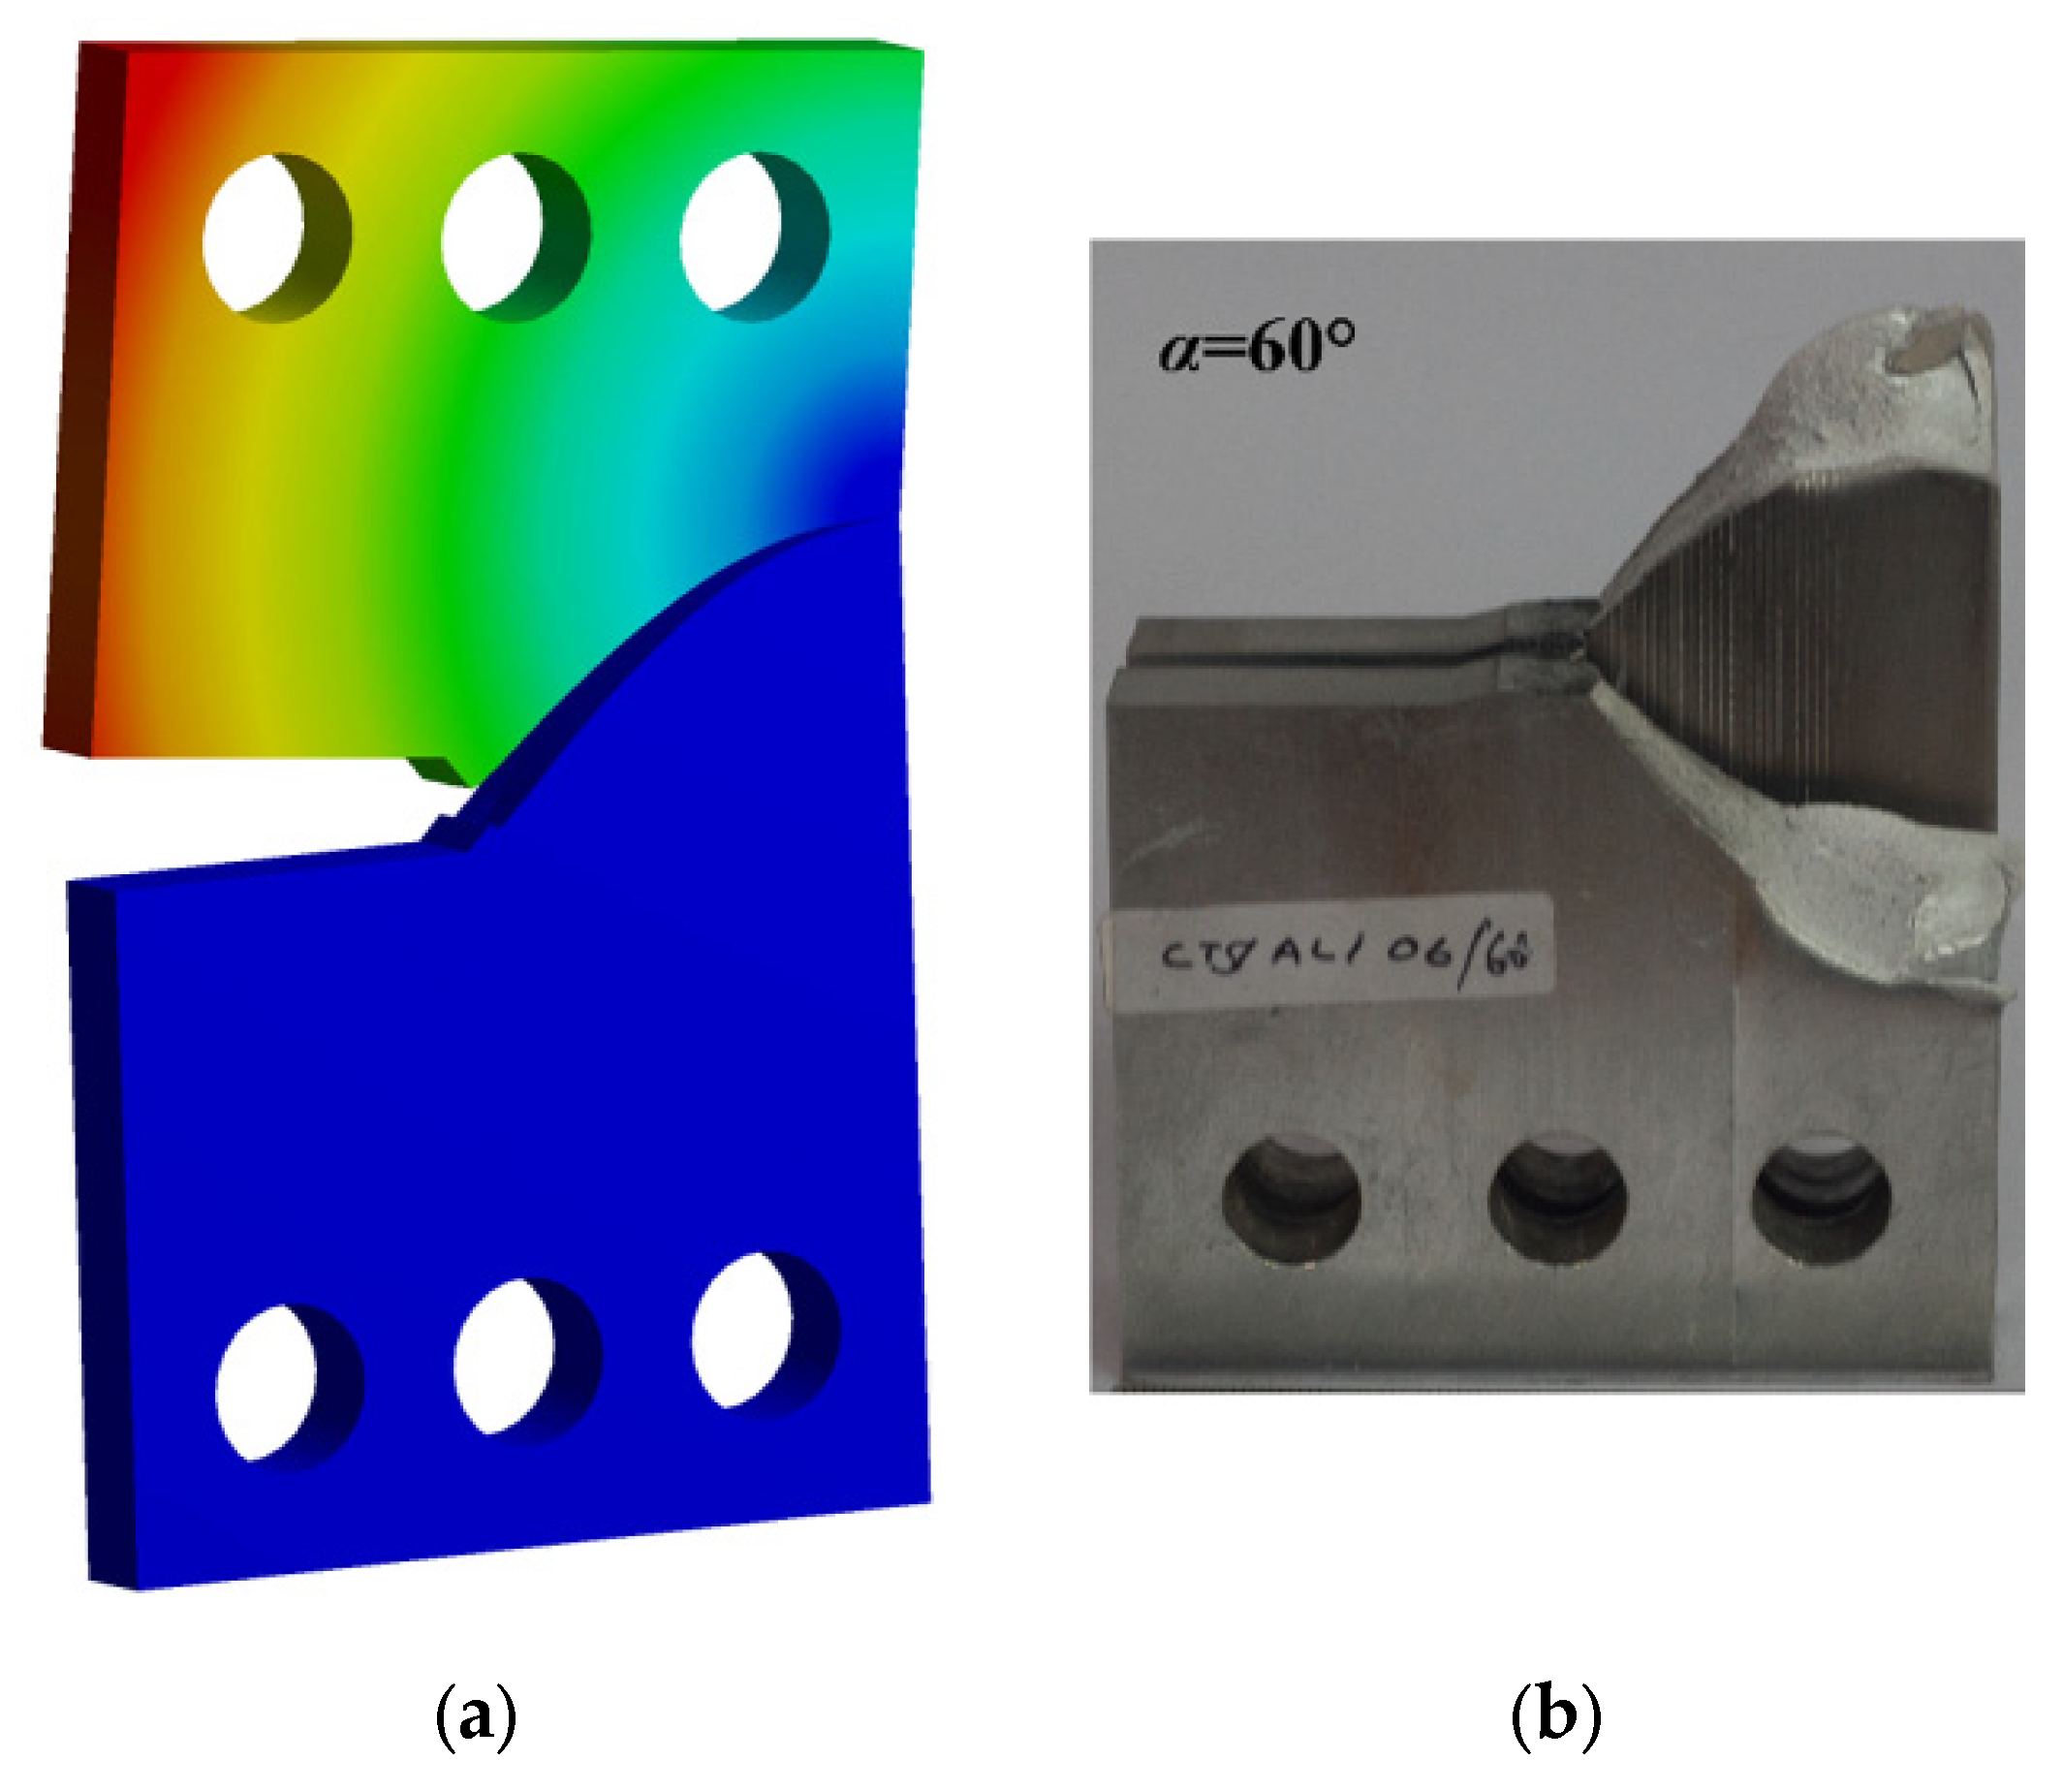
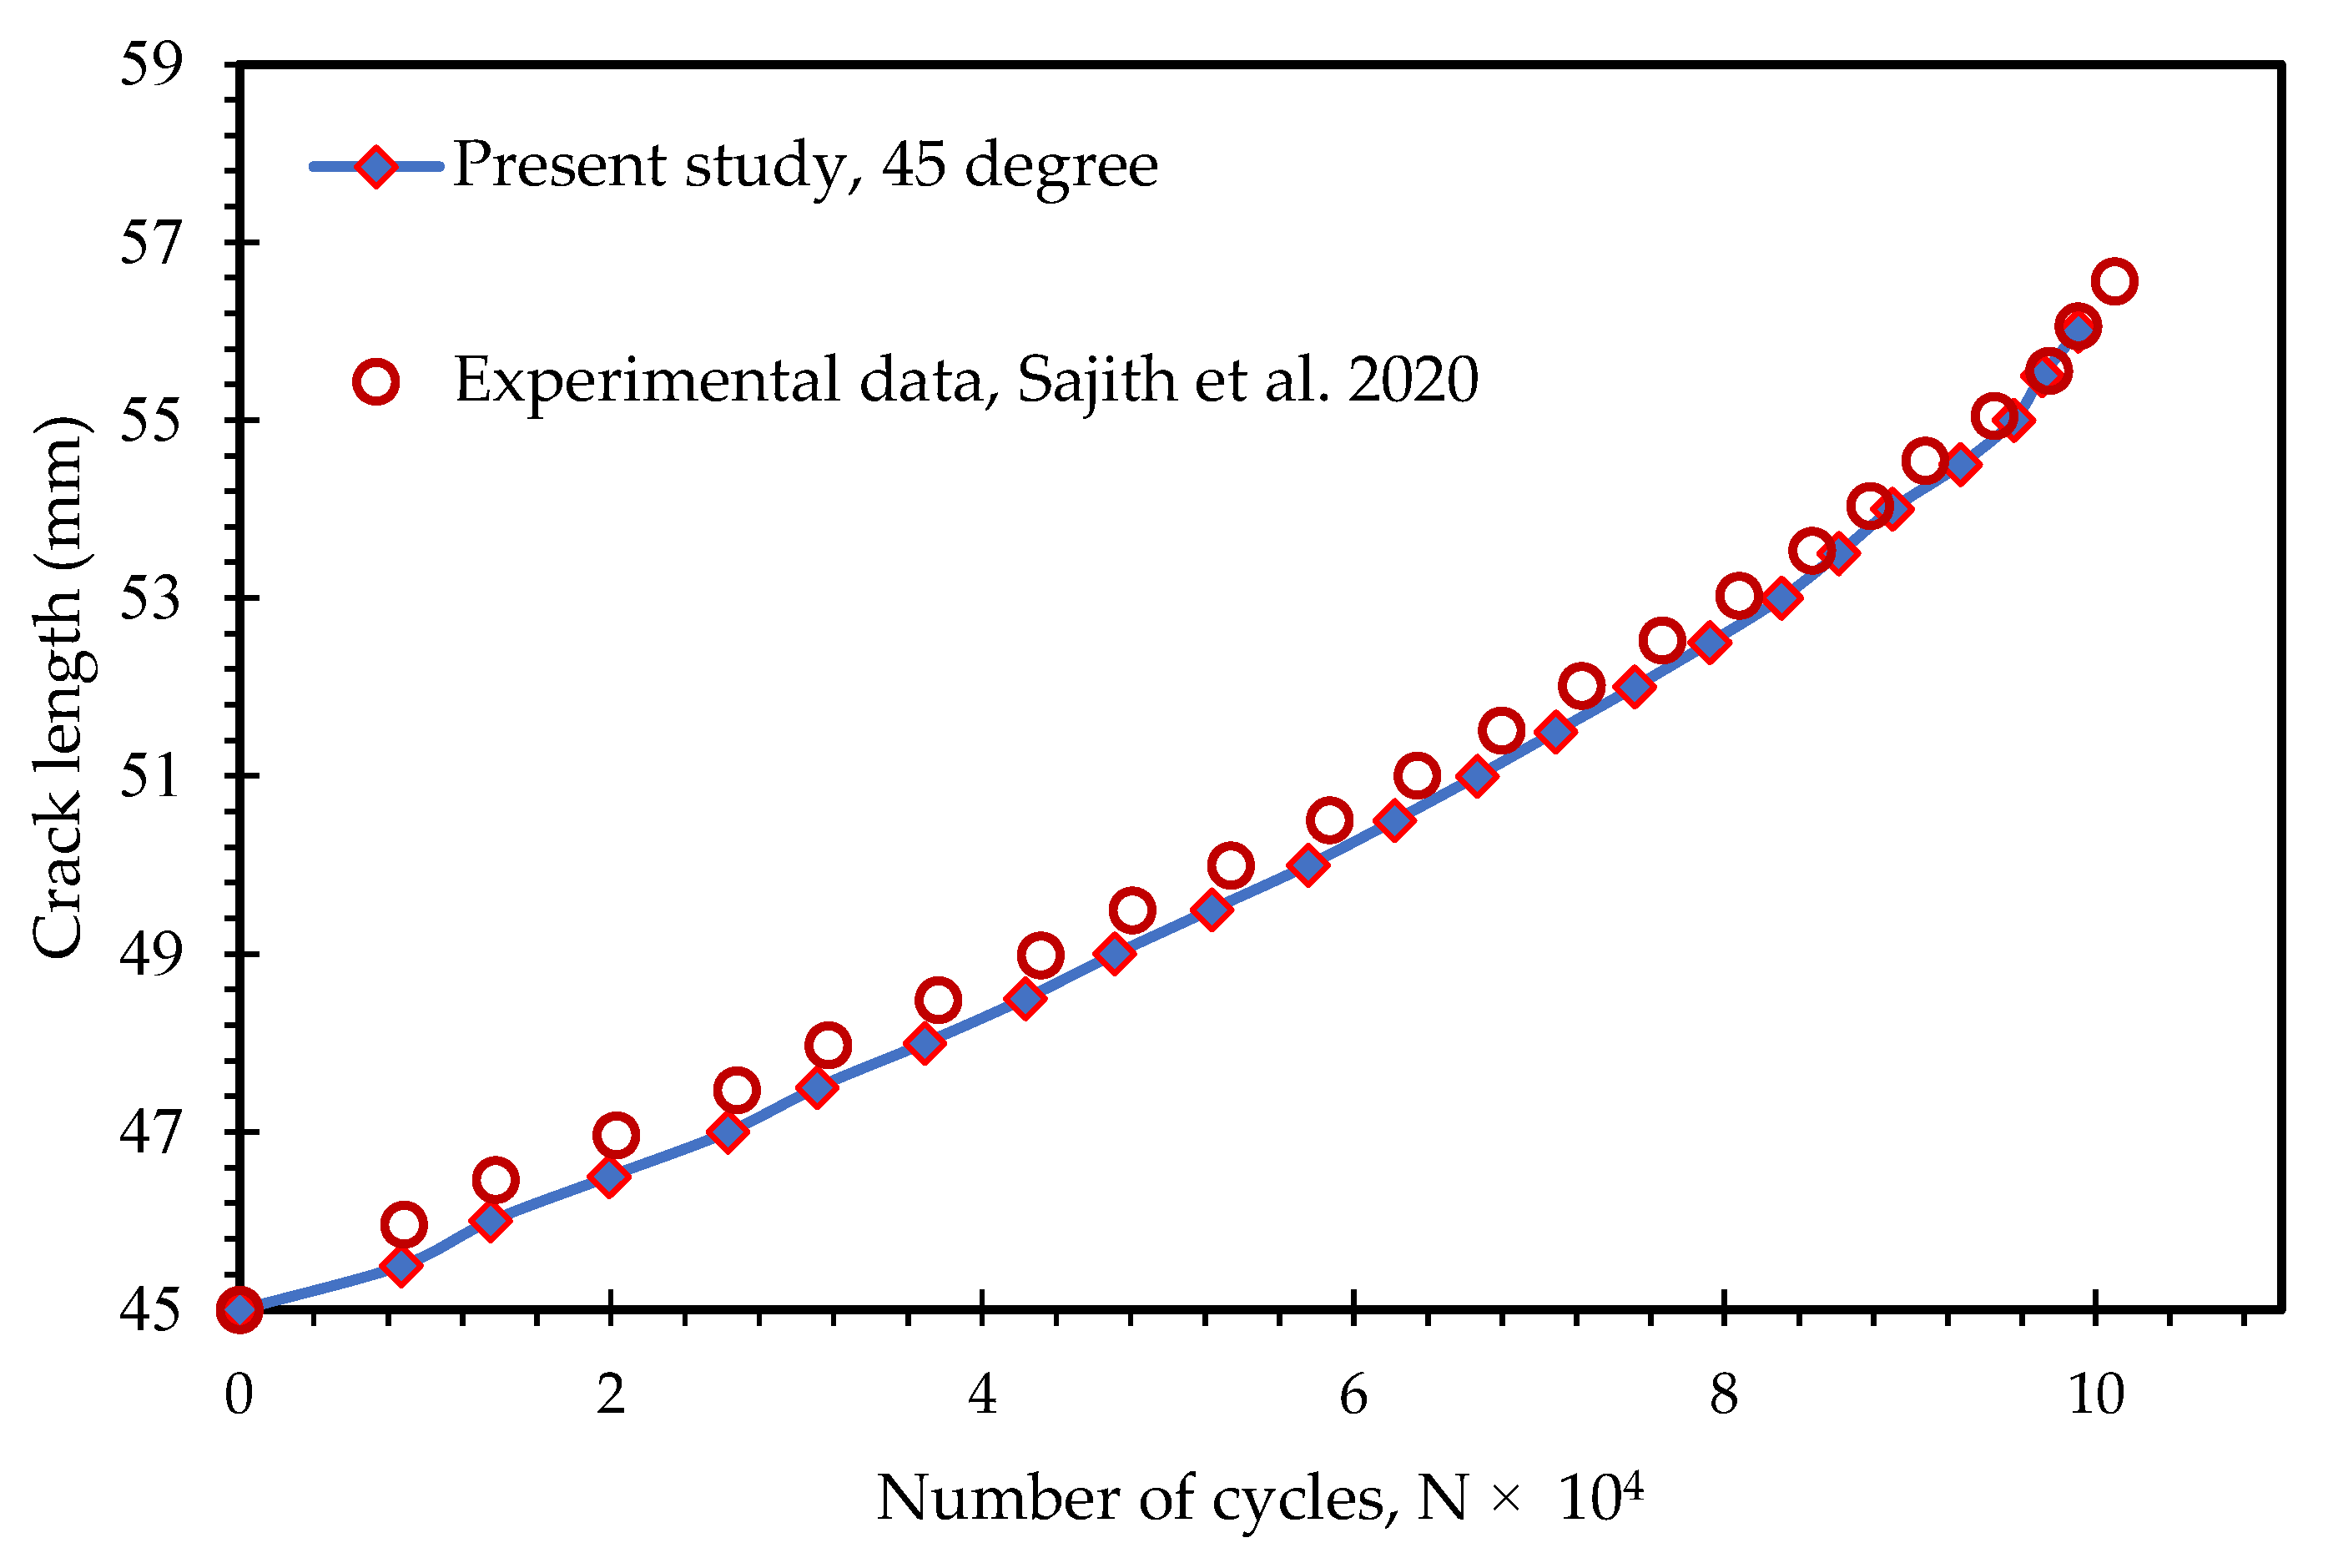
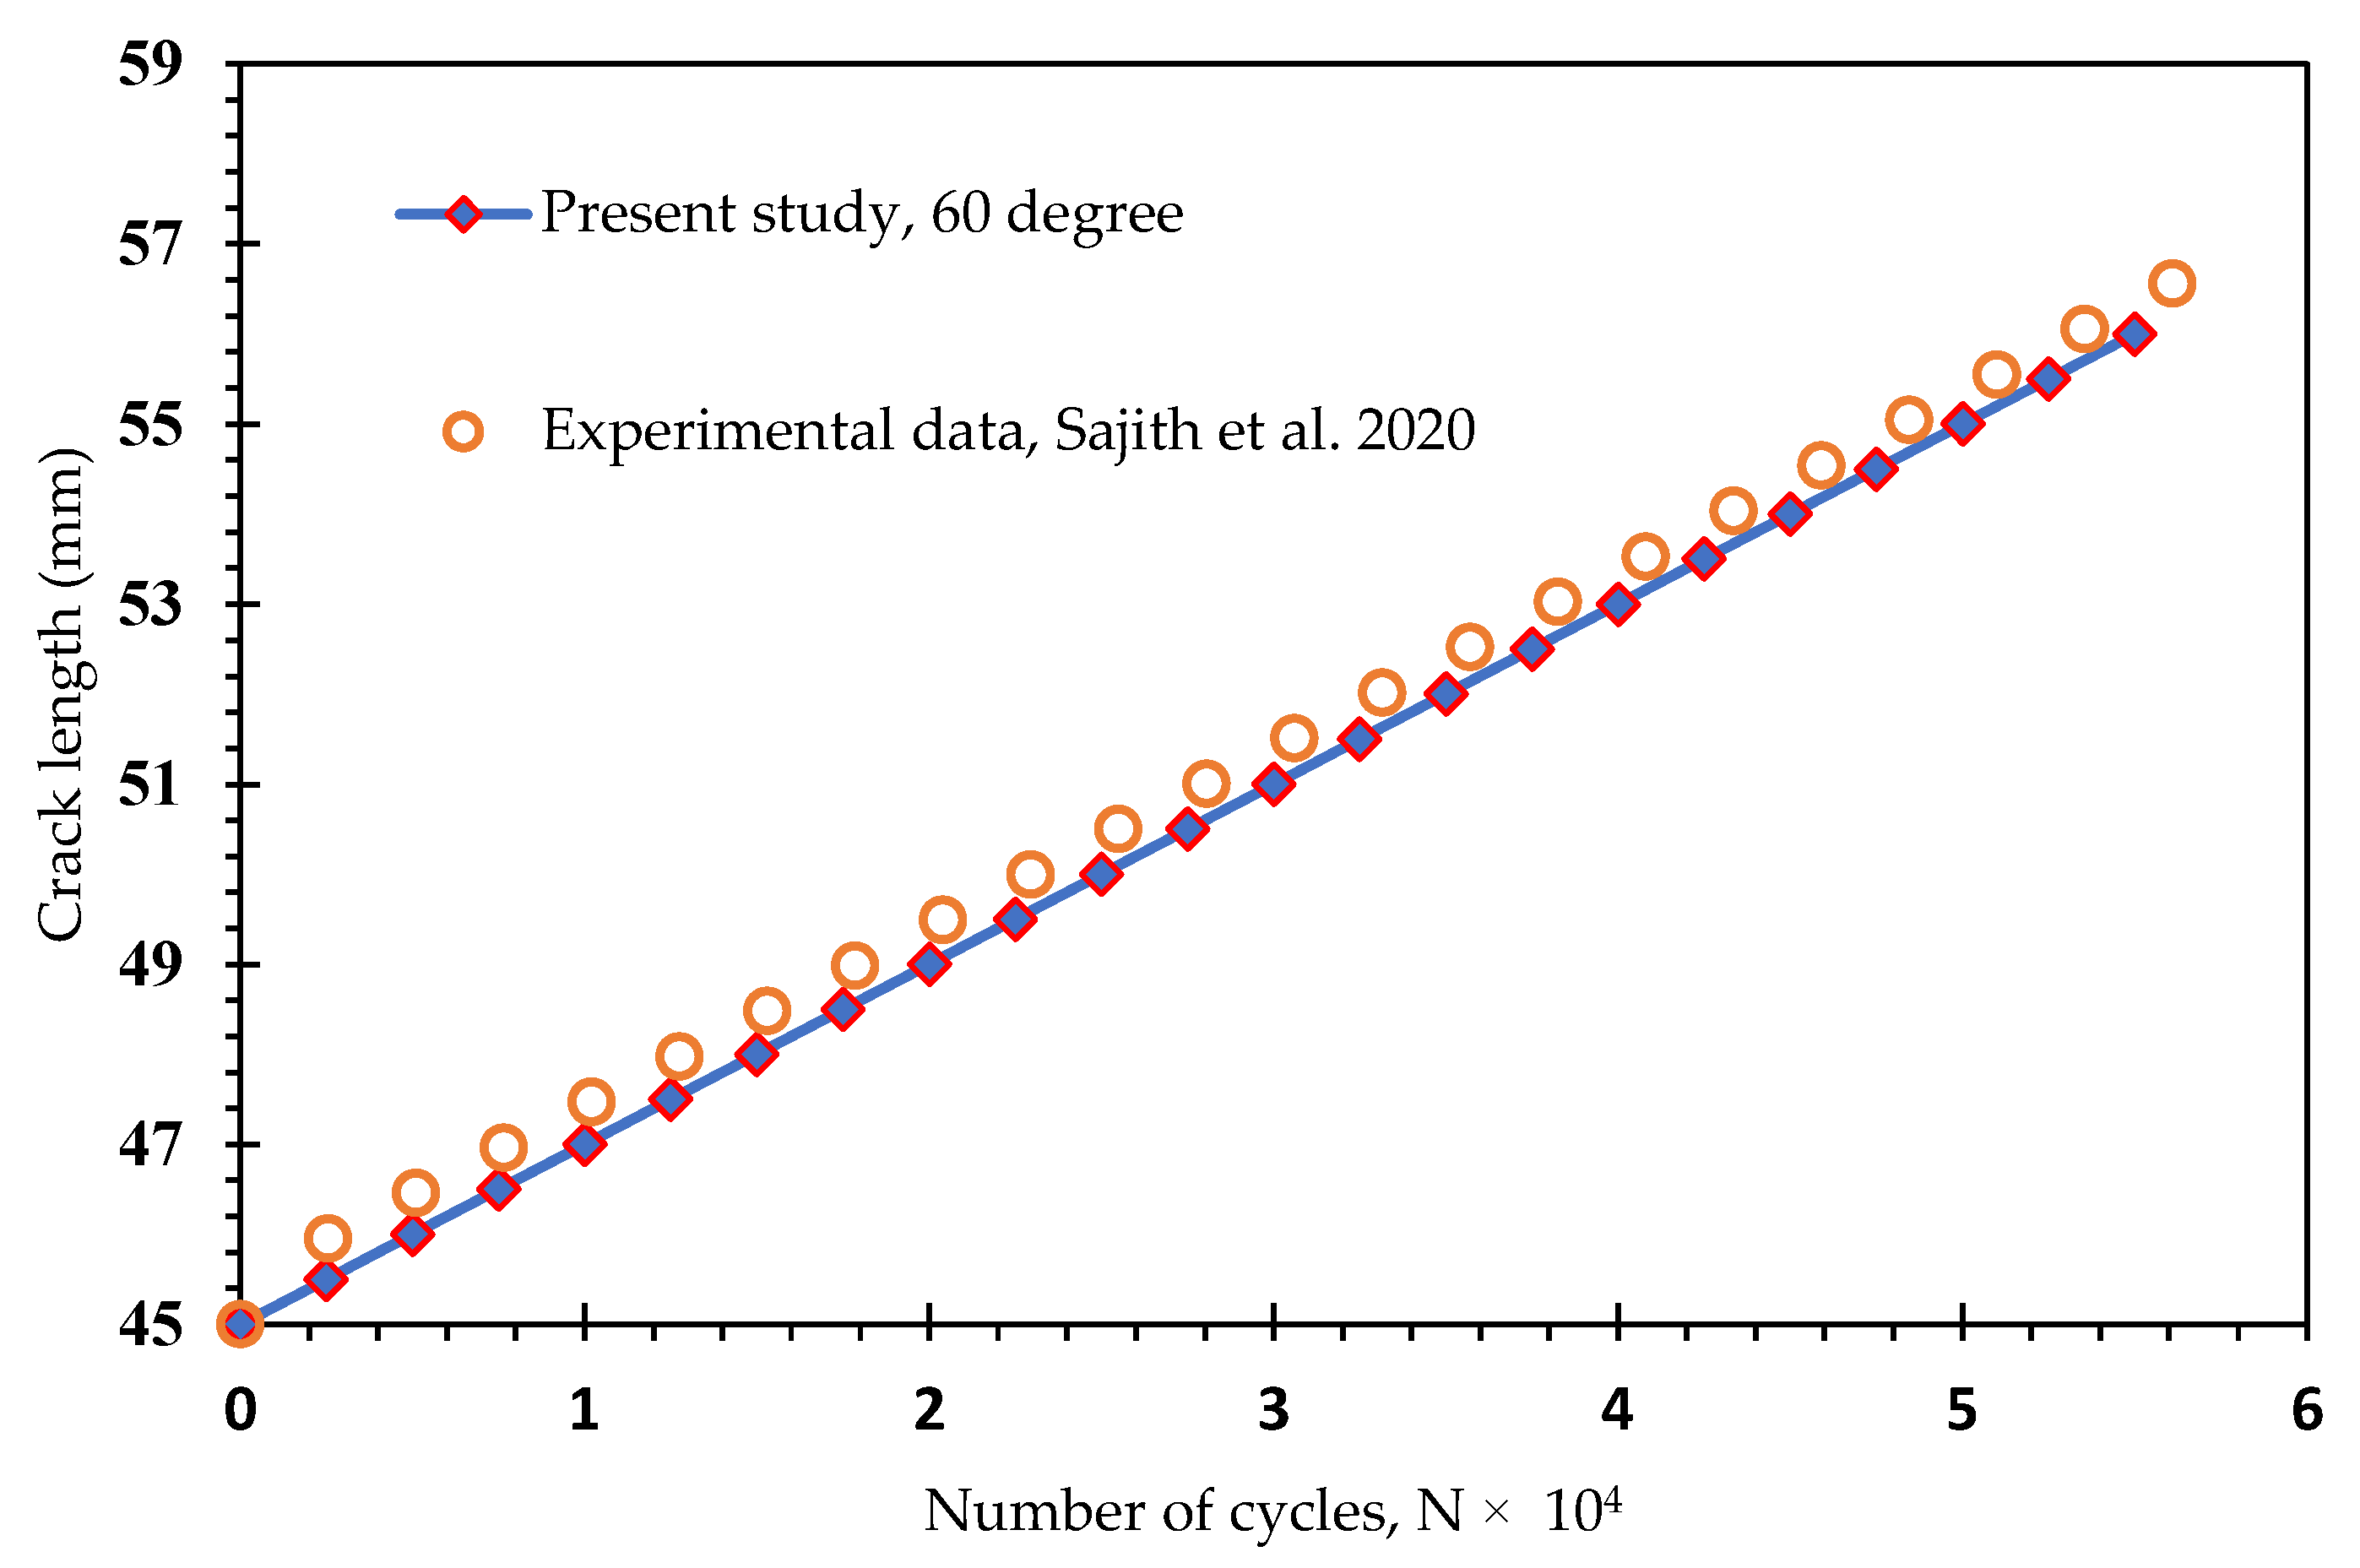
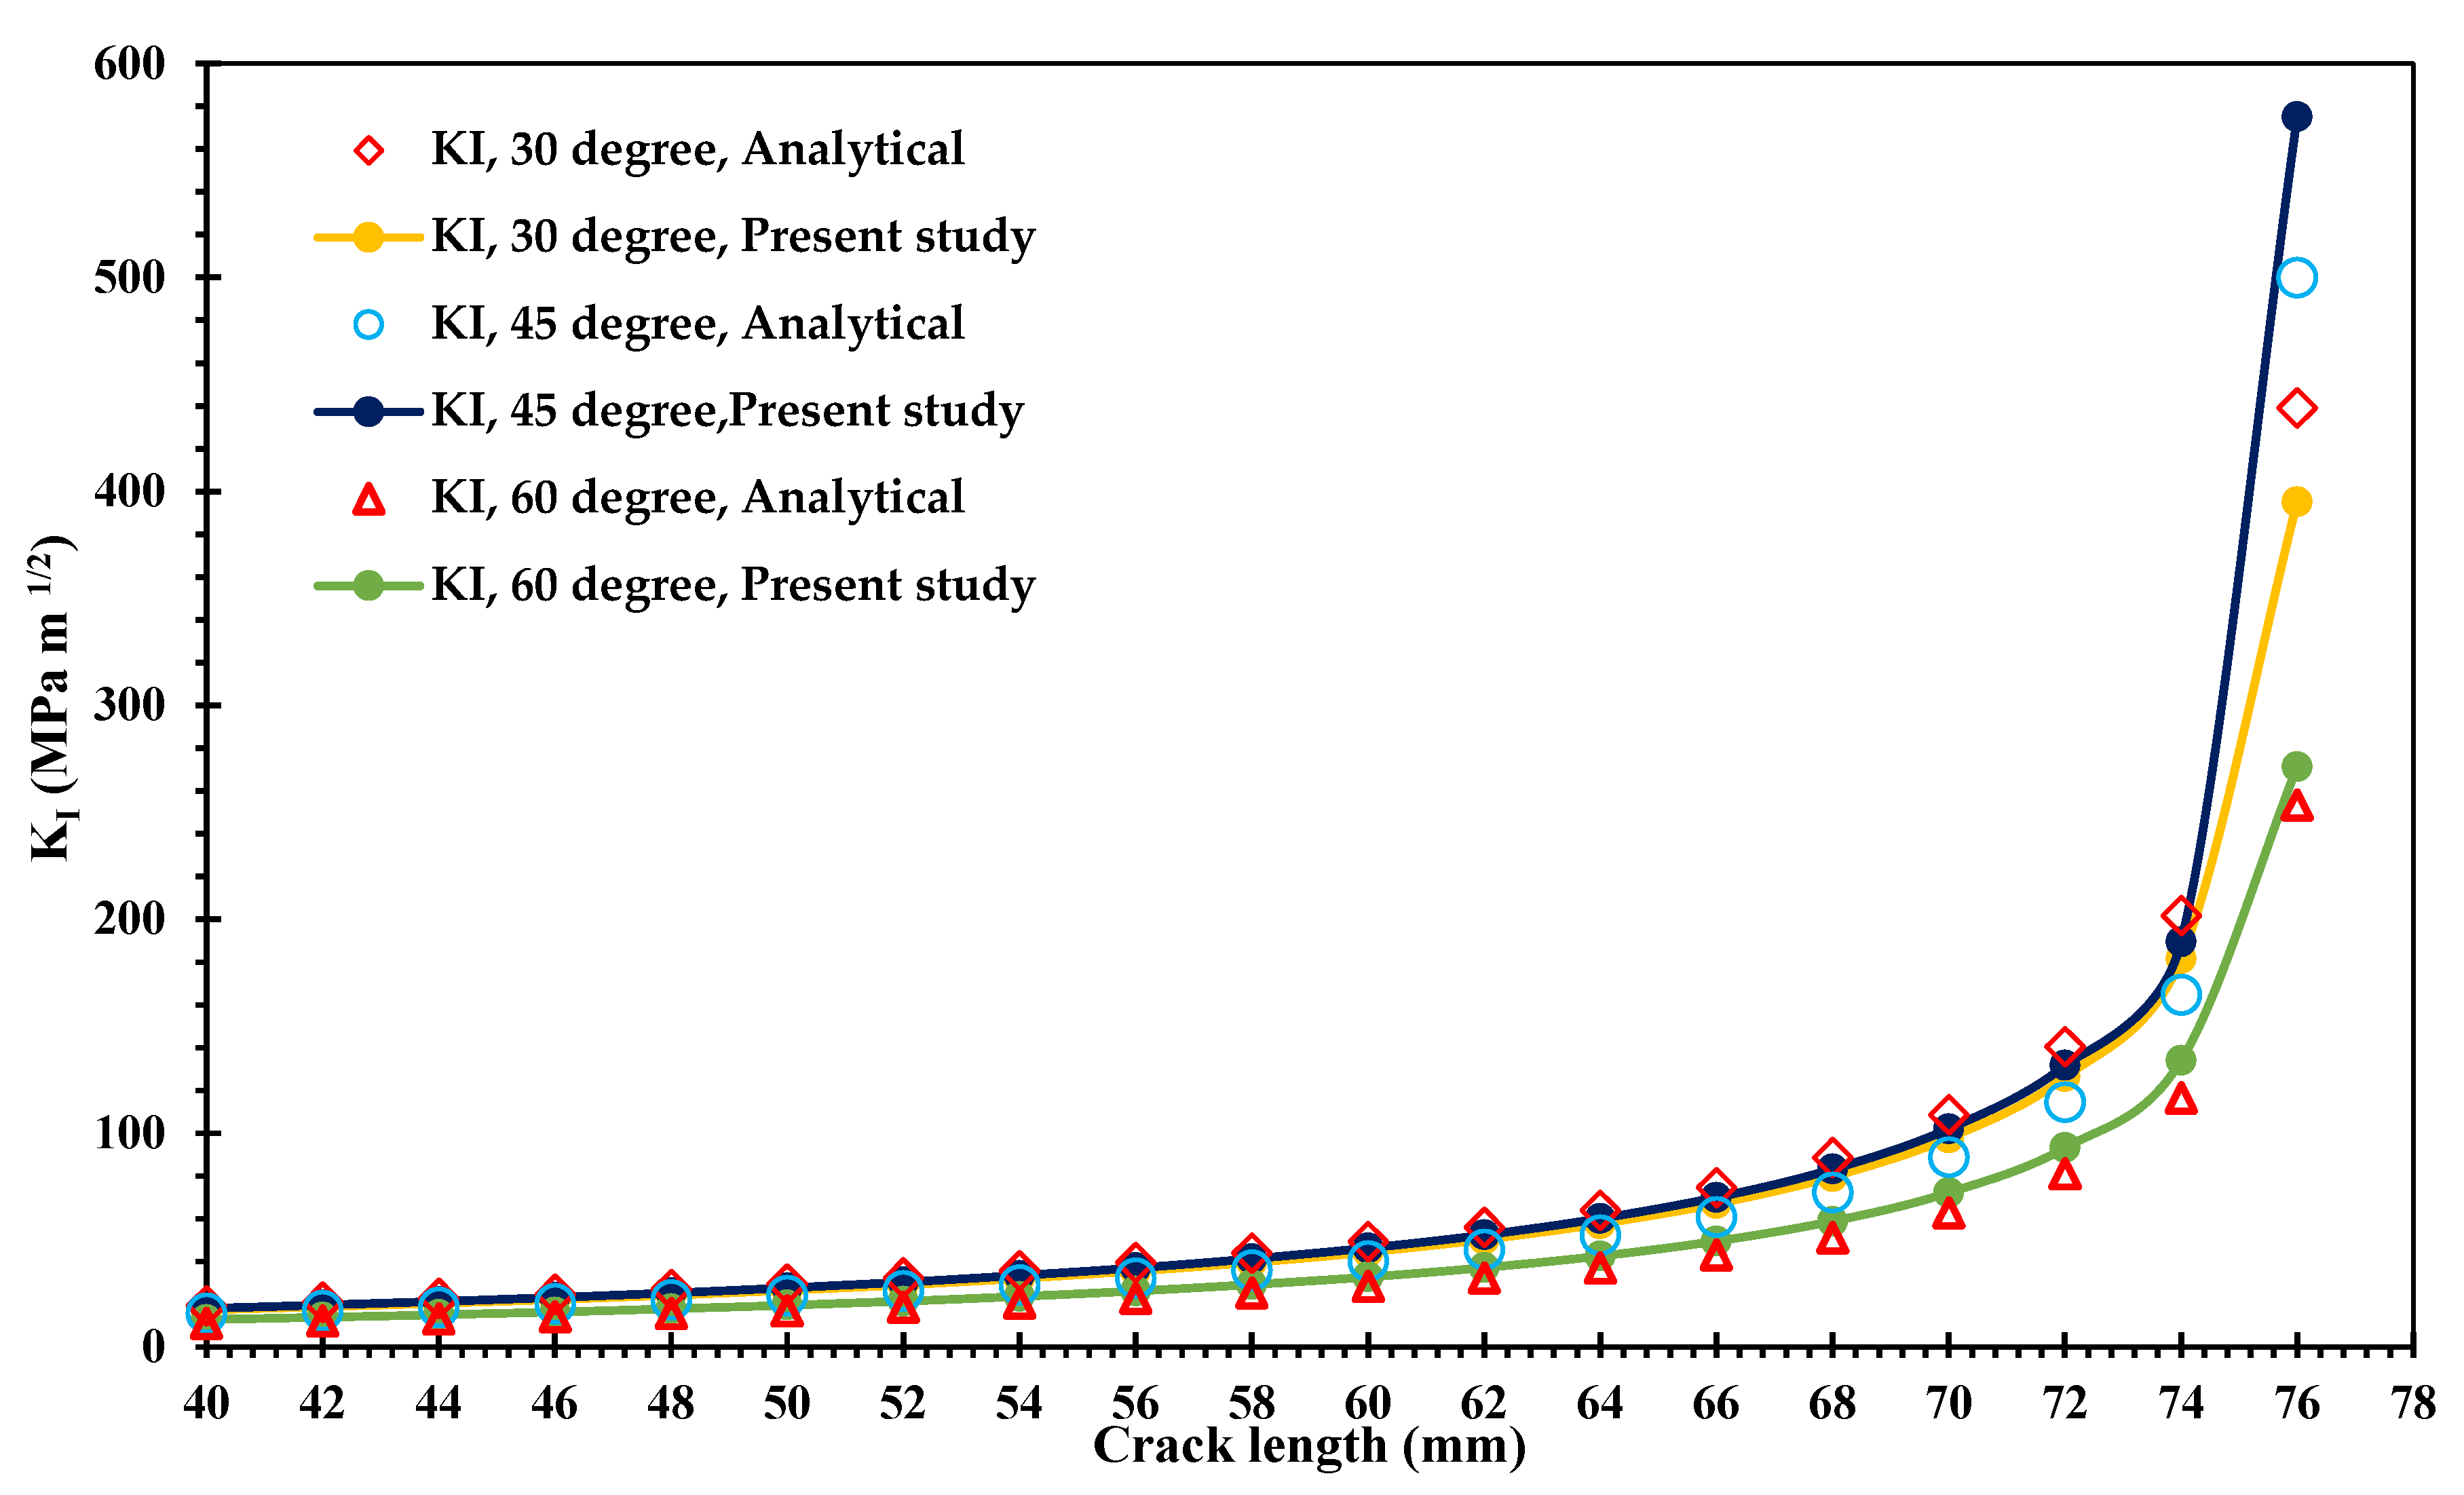
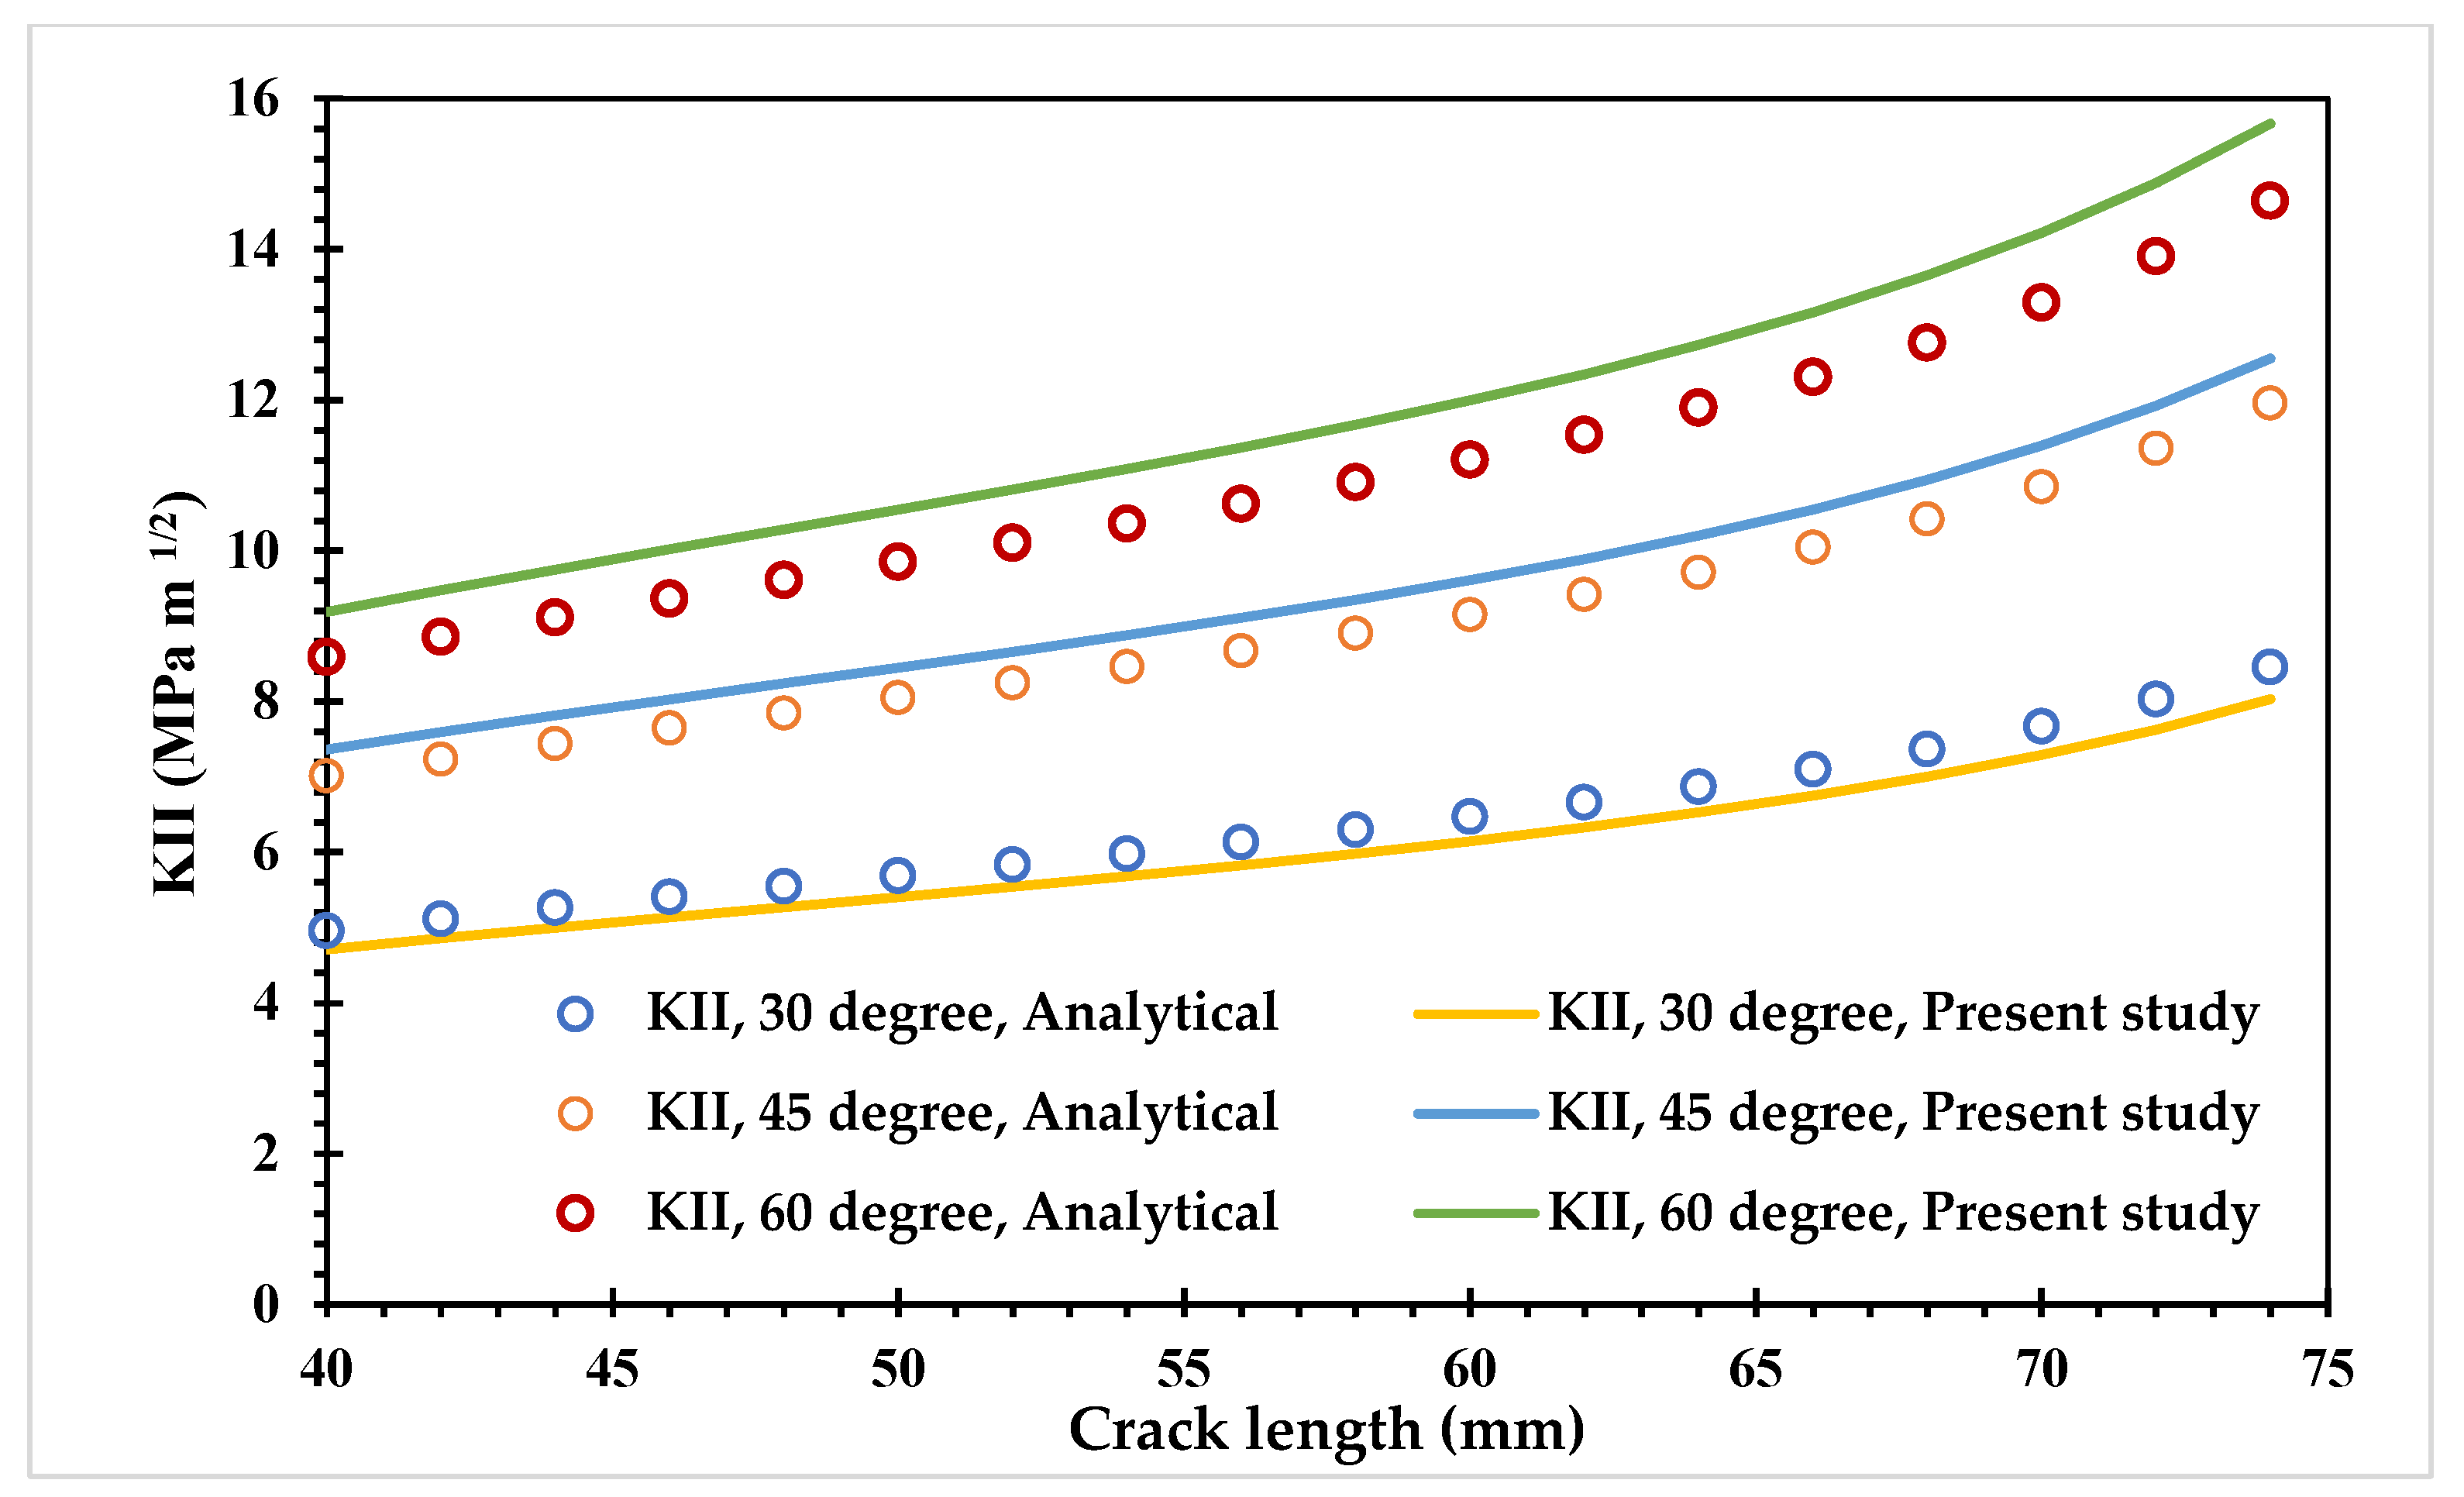
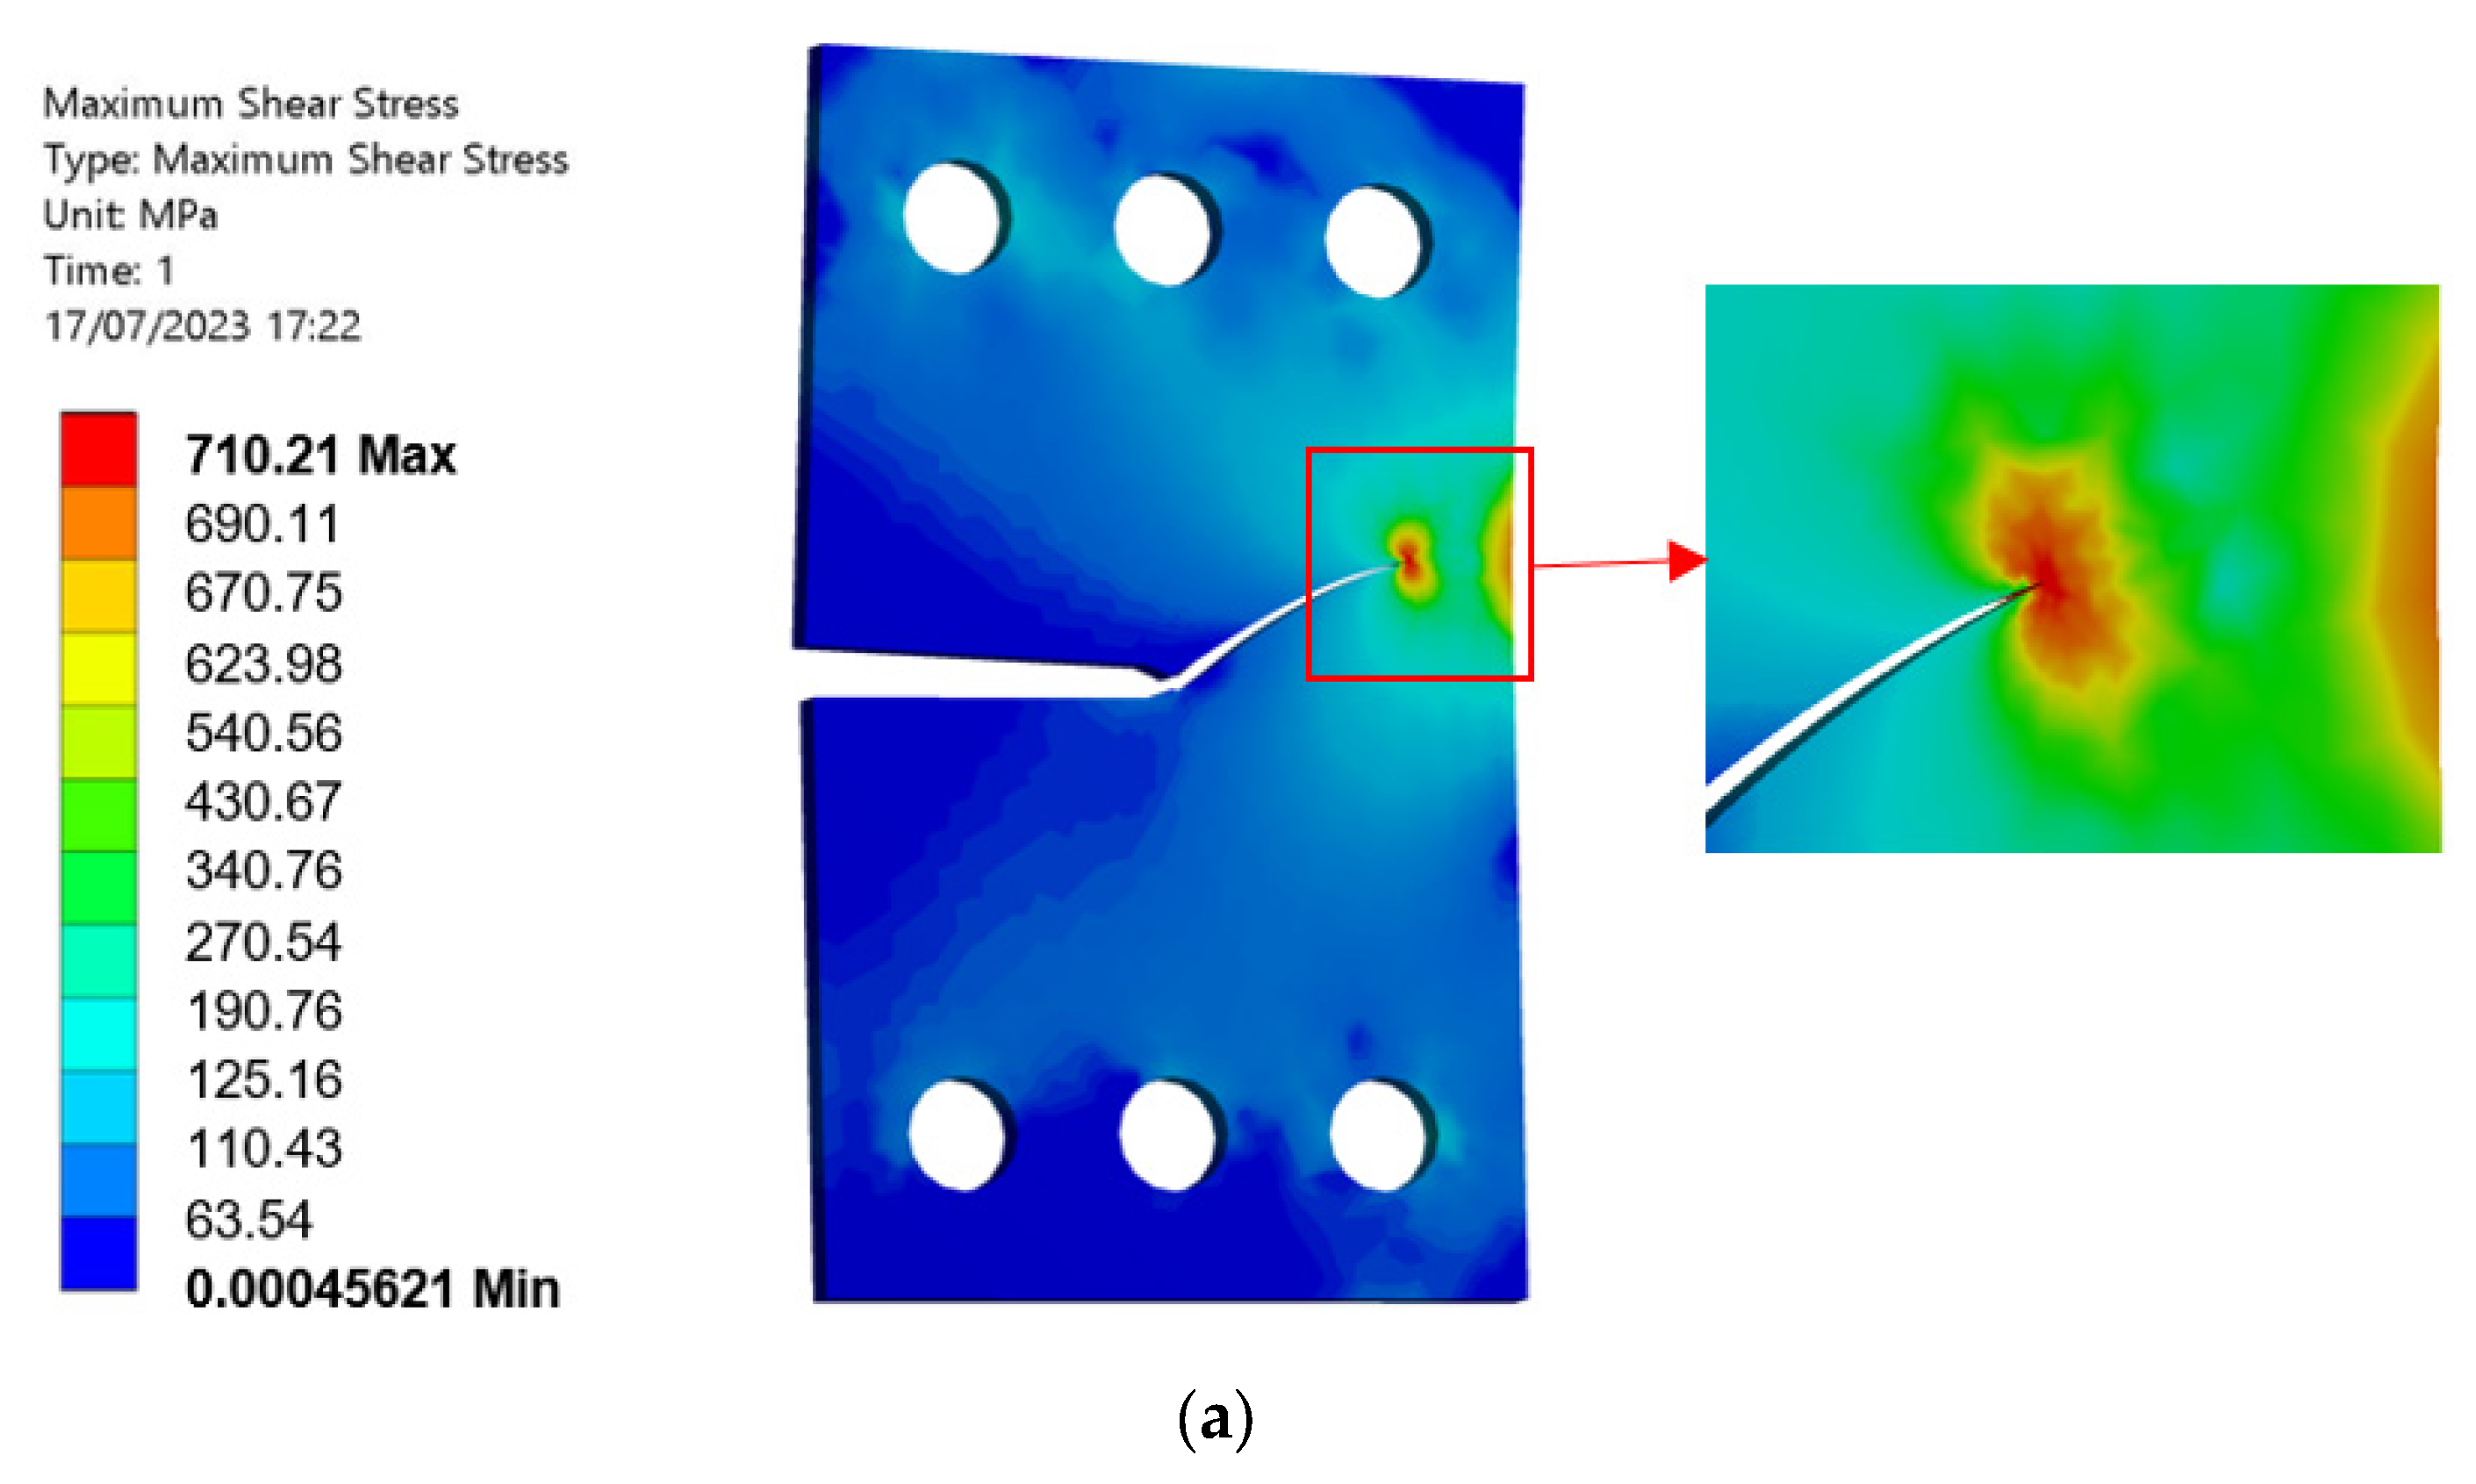
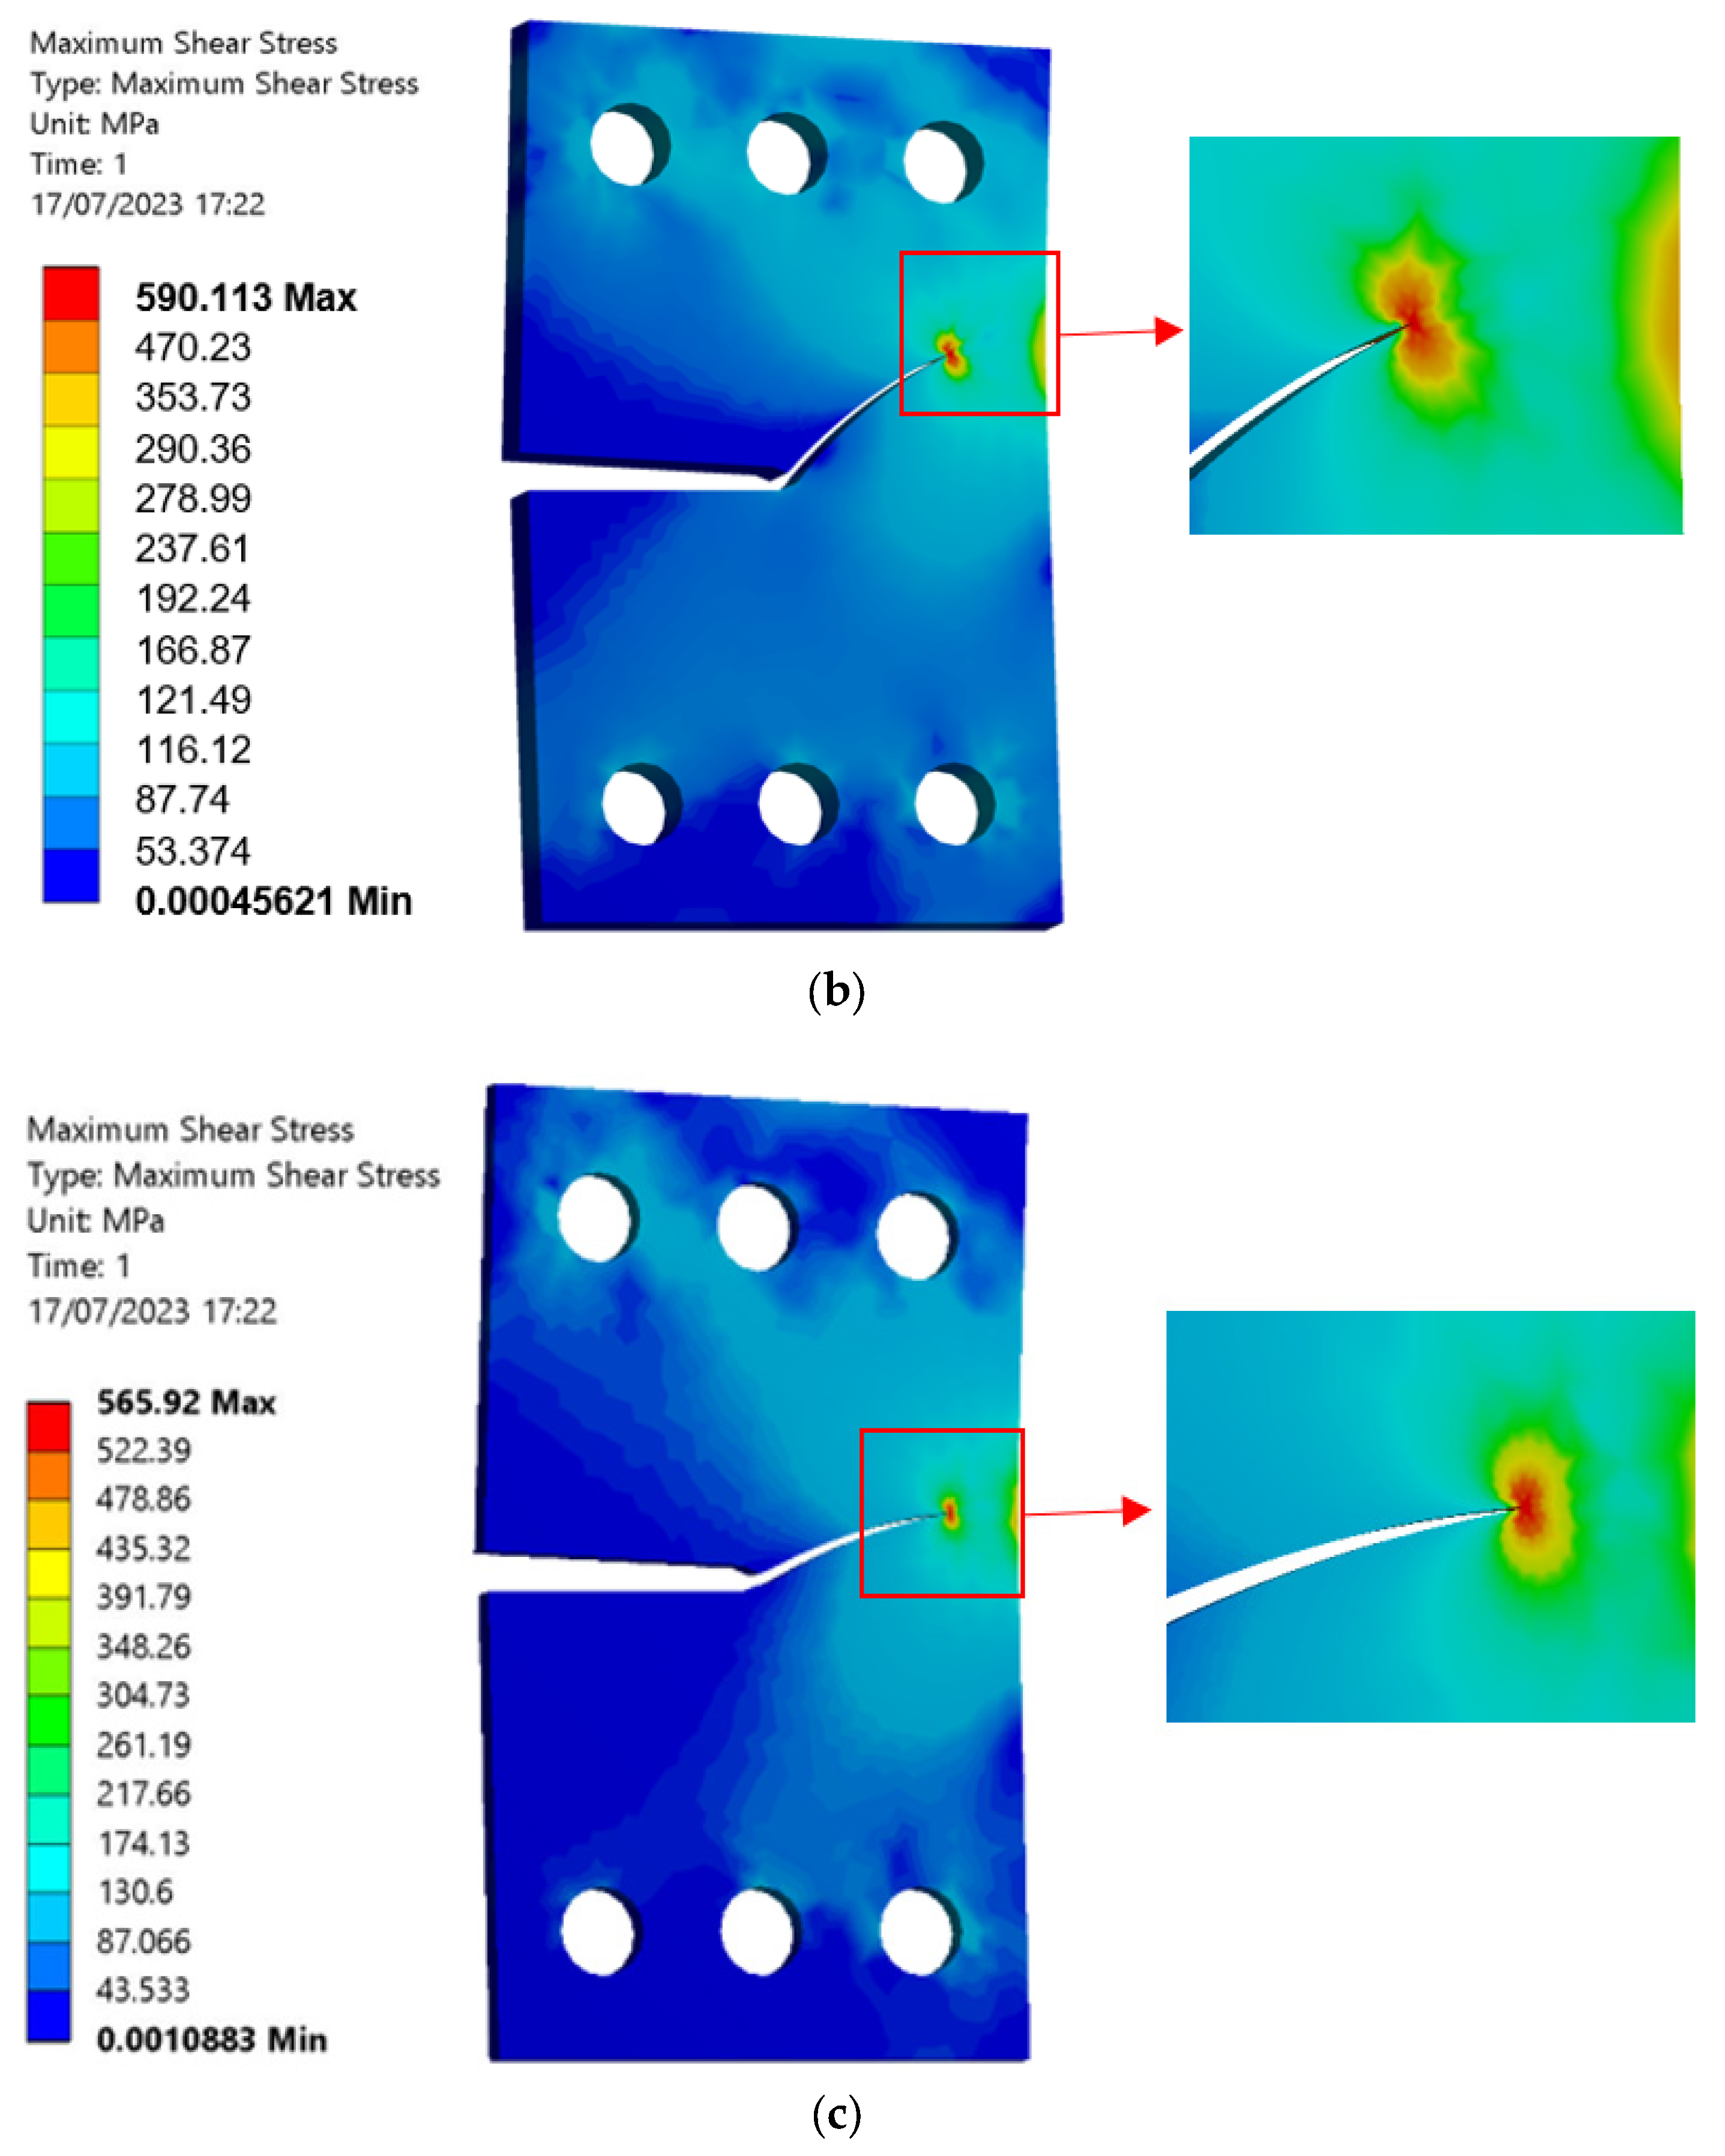
Compact Tensile Shear (CTS) Specimen

The experimental studies by [13,15] utilizing a mixed-mode (I/II) compact tensile shear (CTS) specimen provided the basis for the present numerical simulation for the modelled geometry shown in Figure 2. The CTS material was AISI 316 austenitic stainless steel alloy with the material properties shown in Table 1, and of 15 mm thickness. The CTS geometries are loaded in the original direction of cracking at various angles of 30°, 45°, and 60° at a constant load Fmax = 36 kN and fatigue-loading ratio of R = 0.1 (R = Fmin/Fmax) with constant amplitude under a plane stress assumption. Figure 3 illustrates the loading and boundary conditions used in the present analyses. The holes located at the bottom are restricted from moving in both the x and y directions. The applied force F is distributed among three punctual loads, namely F1, F2, and F3, which are applied at their corresponding holes. These loads are applied at different loading angles, and their respective values are determined by the following formulas [18,47,48]:
F 1 = F ( 0.5 cos α + c b sin α )
F 2 = F sin α
F 3 = F ( 0.5 cos α ( c / b ) sin α )
where α is the load angle, c and b are a specified length defined in Figure 3 (c = b = 54 mm). The evaluated forces at the three loading angles are displayed in Table 2.
The initial mesh for the CTS geometry, generated by Ansys, is shown in Figure 4. It has a higher-order SOLID187 tetrahedral element with 276,446 nodes and 183,009 elements.
The relationship between the crack growth path and loading angles in the compact tension shear (CTS) specimen is influenced by the specific loading configuration and material properties. Therefore, the loading angle can have a significant influence on the crack growth path in the CTS specimen, with shear-dominated fracture modes becoming more prominent with increasing loading angles. Figure 5 shows a comparison between the crack growth direction obtained from the present study and the experimental crack growth directions predicted by Sajith et al. [36] for all three loading angles (30°, 45°, and 60°) with an average error of less than 0.5%. The results presented in the figure reveal a high level of agreement between the simulated and experimental crack growth paths. The study’s findings revealed that under mode I loading, cracks had a tendency to propagate in a direction that was nearly perpendicular to the loading direction. This observation provides valuable insights into the failure mechanisms of the material under investigation, which can aid in the development of more precise predictive models for crack propagation in similar materials. By understanding how cracks propagate under specific loading conditions, engineers and researchers can design more reliable and durable materials and structures that are less prone to failure.
Figure 6, Figure 7 and Figure 8 illustrate a comparison between the predicted crack growth trajectories for the various loading angles 30°, 45°, and 60° and the experimental results obtained by [15]. The comparison between the predicted and experimental results is a crucial step in determining the reliability of the predictive models used in the present study. By performing this comparison, the present study aimed to gain important insights into the behavior of cracks under different loading conditions, which can aid in the development of more accurate predictive models for designing materials and structures that are less susceptible to failure. The three figures demonstrated that the predicted paths of crack extension were similar to the experimental trajectories.
The comparison of the estimated fatigue life cycles for mixed-mode loading (I/II) at different loading angles (30°, 45°, and 60°) between the present study and the experimental results provided by Sajith et al. [36] is illustrated in Figure 9, Figure 10 and Figure 11. The results obtained from these figures provide an insight into the accuracy of the present study’s predictions for the fatigue life cycles of materials under mixed-mode loading conditions.
These figures illustrate the remarkable consistency between the fatigue life cycles estimated by the present and the experimental data obtained in mixed-mode loading conditions with an average error of less than 0.5%. It is worth noting that the relationship between the fatigue lifetime and loading angle can depend on various factors, such as the material properties, loading conditions, and crack morphology. The R-squared value, also known as the coefficient of determination, is a widely used statistical measure to assess the quality of the fit between the experimental data and the results obtained by modeling. In the current study, the R-squared values for the crack growth path and fatigue life were determined to be 0.996 and 0.993, respectively.
Richard et al. [49] proposed an analytical solution for determining the mixed-mode stress-intensity factors in the compact tension shear specimen. This solution involves a set of equations that can be used to calculate the stress-intensity factors for both mode I and mode II loading conditions as follows:
K I = F W t π a cos α ( 1 a / W ) 0.26 + 2.65 a / ( W a ) 1 + 0.55 a / ( W a ) 0.08 ( a / ( W a ) ) 2
K I I = F W t π a sin α ( 1 a / W ) 0.23 + 1.40 a / ( W a ) 1 0.67 a / ( W a ) + 2.08 ( a / ( W a ) ) 2
where F represents the uniaxial load, while a denotes the length of a crack, and W and t denote the width and thickness, respectively. The approach outlined in this solution is based on the assumption of linear elastic fracture mechanics and is applicable to CTS specimens with different loading configurations and material properties. Figure 12 and Figure 13 depict an excellent agreement between the predicted values and analytical solutions given by Equations (8) and (9) for the opening and in-plane shear mode SIFs at loading angles of 30°, 45°, and 60°. The behavior of crack growth in the compact tension shear specimens is influenced by the SIFs, KI and KII, which are related to the magnitude and direction of the applied load. The SIFs are used to quantify the intensity of the stress fields near the crack tip and are critical in predicting the onset and propagation of cracks in materials. At a loading angle of 30°, KI is the dominant factor, and KII is relatively small. This means that the crack tends to propagate perpendicular to the crack surface. As the loading angle increases to 45 degrees, the ratio of KI to KII decreases, and both modes become more comparable. This change in the KI-to-KII ratio can significantly affect the crack growth direction. At a loading angle of 60 degrees, the ratio of KI to KII is smaller compared to the previous angles of 30 and 45 degrees. This means that KII becomes the dominant factor. As a result, the crack tends to propagate parallel to the crack surface, rather than perpendicular to it, as in the case of KI dominance. Therefore, the choice of loading angle for a CTS specimen is critical in determining the fracture behavior of a material, and it is important to consider the expected loading conditions when selecting the appropriate angle for testing. By choosing the appropriate loading angle, we can ensure that the stress-intensity factors are accurately captured, and the fracture toughness of the material is adequately measured.
The von Mises stress in a CTS specimen is calculated based on the normal and shear stresses acting on the specimen. In CTS specimens, the normal stress is typically oriented perpendicular to the crack plane and can cause the specimen to deform in tension or compression. On the other hand, the shear stress is typically oriented parallel to the crack plane and can cause the specimen to deform in shear. When a CTS specimen is subjected to a load at an angle to the crack plane, it experiences both normal and shear stresses. The normal stress component is highest when the load is applied perpendicular to the crack plane (i.e., when the loading angle is 0° or 90°), while the shear stress component is highest when the load is applied parallel to the crack plane (i.e., when the loading angle is 45°). As depicted in Figure 14, the von Mises stress in a compact tension shear (CTS) specimen is highest when the load is applied at a 45° angle. This is due to the fact that this loading angle maximizes the combined effect of both normal and shear stresses acting on the specimen. The von Mises stress is lower for loading angles of 30 and 60 degrees, as these angles result in less combined stress on the specimen. It is important to note that the relationship between the von Mises stress and the loading angle can be affected by various factors, including the material properties of the specimen, the size and shape of the crack, and the magnitude and direction of the applied load. The von Mises stress can also provide insights into the failure mechanisms of CTS specimens under different loading angles. By analyzing the von Mises stress distribution, researchers can identify the critical points where the material will start to deform and eventually fail. This information can help improve the understanding of the fracture behavior of the material.
According to Figure 15, an increase in the corresponding shear stress component was observed at loading angles of 30 and 60 degrees, indicating a higher degree of shear loading in the compact tension shear specimen. This result is consistent with the general trend of an increased shear stress component with increasing loading angles. In contrast, at a loading angle of 45 degrees in the compact tension shear specimen, the shear stress component is typically at its maximum value. The 45-degree angle is considered a pure shear loading condition because the tensile and compressive stress components are equal in magnitude and direction, canceling each other out and leaving only the shear stress component. Nevertheless, the correlation between the loading angle and shear stress is subject to various factors, such as the specific loading configuration and material properties. Therefore, further analysis and experimentation may be necessary to determine the exact relationship between the loading angle and shear stress in the compact tension shear specimen.

4. Conclusions

This study investigated the mixed-mode fatigue crack growth in CTS specimens using finite element analyses with ANSYS Mechanical APDL. Upon conducting finite element analyses, the crack growth results were compared with experimental data for different loading angles. The results showed that the predicted stress-intensity factors obtained from the analytical solutions were in good agreement with the findings of this study. The mixed-mode fatigue life was predicted and compared with experimental data for loading angles of 30°, 45°, and 60°. This study validated the accuracy of its simulation by comparing the predicted fatigue crack propagation paths, stress-intensity factors, and fatigue life cycles with analytical and experimental results from other researchers.
Several significant findings were obtained as a result of the investigation presented in this study.
  • Investigating the in-plane mixed-mode I/II fatigue crack growth behavior of the AISI 316 austenitic stainless steel alloy is crucial for ensuring the safety and reliability of marine structures and various structural components subjected to mixed-mode loading.
  • The 45-degree loading angle in a compact tension shear specimen corresponds to the maximum shear stress and maximum von Mises stress components, indicating a pure shear loading condition where the tensile and compressive stress components are balanced and cancel each other out.
  • Advanced numerical simulation techniques such as the SMART crack growth feature in ANSYS APDL 19.2 have enabled more efficient and accurate modeling of mixed-mode fatigue crack growth in CTS specimens. This feature automates the process of crack creation and growth and uses advanced algorithms to predict the crack growth path.
  • The findings may be useful for improving the design and optimization of materials for marine applications and structural components subjected to mixed-mode loading.

Author Contributions

Conceptualization, A.M.A.; Methodology, A.M.A.; Software, A.M.A.; Validation, A.M.A. and A.H.B.; Formal analysis, A.M.A.; Investigation, A.M.A.; Resources, A.M.A. and A.H.B.; Data curation, A.M.A.; Writing—original draft, A.M.A.; Writing—review & editing, A.M.A. and A.H.B.; Visualization, A.M.A. and A.H.B.; Supervision, A.M.A. and A.H.B.; Project administration, A.M.A. and A.H.B.; Funding acquisition, A.M.A. and A.H.B. All authors have read and agreed to the published version of the manuscript.

Funding

This research received no external funding.

Institutional Review Board Statement

Not applicable.

Informed Consent Statement

Not applicable.

Data Availability Statement

All relevant data are contained in the present manuscript.

Conflicts of Interest

The author declares no conflict of interest.

References

  1. Rozumek, D.; Marciniak, Z.; Lesiuk, G.; Correia, J.A.; de Jesus, A.M. Experimental and numerical investigation of mixed mode I + II and I + III fatigue crack growth in S355J0 steel. Int. J. Fatigue 2018, 113, 160–170. [Google Scholar] [CrossRef]
  2. Chen, Q.; Guo, H.; Avery, K.; Kang, H.; Su, X. Mixed-mode fatigue crack growth and life prediction of an automotive adhesive bonding system. Eng. Fract. Mech. 2018, 189, 439–450. [Google Scholar] [CrossRef]
  3. Biner, S. Fatigue crack growth studies under mixed-mode loading. Int. J. Fatigue 2001, 23, 259–263. [Google Scholar] [CrossRef]
  4. Lesiuk, G.; Smolnicki, M.; Mech, R.; Zięty, A.; Fragassa, C. Analysis of fatigue crack growth under mixed mode (I + II) loading conditions in rail steel using CTS specimen. Eng. Fail. Anal. 2020, 109, 104354. [Google Scholar] [CrossRef]
  5. Qian, J.; Fatemi, A. Fatigue crack growth under mixed-mode I and II loading. Fatigue Fract. Eng. Mater. Struct. 1996, 19, 1277–1284. [Google Scholar] [CrossRef]
  6. Schijve, J. Fatigue of Structures and Materials, 2nd ed.; Springer Science & Business Media: Berlin/Heidelberg, Germany, 2008. [Google Scholar]
  7. Stephens, R.I.; Fatemi, A.; Stephens, R.R.; Fuchs, H.O. Metal Fatigue in Engineering; John Wiley & Sons: Hoboken, NJ, USA, 2000. [Google Scholar]
  8. Allen, R.; Booth, G.; Jutla, T. A review of fatigue crack growth characterisation by linear elastic fracture mechanics (LEFM). Part I—Principles and methods of data generation. Fatigue Fract. Eng. Mater. Struct. 1988, 11, 45–69. [Google Scholar] [CrossRef]
  9. Allen, R.; Booth, G.; Jutla, T. A review of fatigue crack growth characterisation by linear elastic fracture mechanics (LEFM). Part II—Advisory documents and applications within national standards. Fatigue Fract. Eng. Mater. Struct. 1988, 11, 71–108. [Google Scholar] [CrossRef]
  10. Wöhler, A. Versuche zur Ermittlung der auf die Eisenbahnwagenachsen einwirkenden Kräfte und die Widerstandsfähigkeit der Wagen-Achsen. Z. Für Bauwes. 1860, 10, 583–614. [Google Scholar]
  11. Coffin, L. Cyclic deformation and fatigue of metals. In Fatigue and Endurance of Metals [Russian Translation]; Elsevier: Amsterdam, The Netherlands, 1963; pp. 257–272. [Google Scholar]
  12. Paris, P.; Erdogan, F. A critical analysis of crack propagation laws. J. Basic Eng. 1963, 85, 528–533. [Google Scholar] [CrossRef]
  13. Alshoaibi, A.M. Fatigue crack growth analysis under constant amplitude loading using finite element method. Materials 2022, 15, 2937. [Google Scholar] [CrossRef]
  14. Demir, O.; Ayhan, A.O.; Sedat, I.; Lekesiz, H. Evaluation of mixed mode-I/II criteria for fatigue crack propagation using experiments and modeling. Chin. J. Aeronaut. 2018, 31, 1525–1534. [Google Scholar] [CrossRef]
  15. Fageehi, Y.A.; Alshoaibi, A.M. Numerical Simulation of Mixed-Mode Fatigue Crack Growth for Compact Tension Shear Specimen. Adv. Mater. Sci. Eng. 2020, 2020, 5426831. [Google Scholar] [CrossRef]
  16. Demir, O.; Ayhan, A.O.; İriç, S. A new specimen for mixed mode-I/II fracture tests: Modeling, experiments and criteria development. Eng. Fract. Mech. 2017, 178, 457–476. [Google Scholar] [CrossRef]
  17. Richard, H.; Benitz, K. A loading device for the creation of mixed mode in fracture mechanics. Int. J. Fract. 1983, 22, R55–R58. [Google Scholar] [CrossRef]
  18. Sander, M.; Richard, H. Experimental and numerical investigations on the influence of the loading direction on the fatigue crack growth. Int. J. Fatigue 2006, 28, 583–591. [Google Scholar] [CrossRef]
  19. Husaini, K.K.; Hanji, M.; Notomi, M. Investigations of the mixed mode crack growth behavior of an aluminum alloy. J. Eng. Appl. Sci 2016, 11, 885–890. [Google Scholar]
  20. Ayhan, A.O.; Demir, O. Computational modeling of three-dimensional mixed mode-I/II/III fatigue crack growth problems and experiments. Comput. Struct. 2021, 243, 106399. [Google Scholar] [CrossRef]
  21. Rozumek, D.; Marciniak, Z.; Lesiuk, G.; Correia, J. Mixed mode I/II/III fatigue crack growth in S355 steel. Procedia Struct. Integr. 2017, 5, 896–903. [Google Scholar] [CrossRef]
  22. Miao, X.-T.; Yu, Q.; Zhou, C.-Y.; Li, J.; Wang, Y.-Z.; He, X.-H. Experimental and numerical investigation on fracture behavior of CTS specimen under I-II mixed mode loading. Eur. J. Mech.-A/Solids 2018, 72, 235–244. [Google Scholar] [CrossRef]
  23. Malekan, M.; Khosravi, A.; St-Pierre, L. An Abaqus plug-in to simulate fatigue crack growth. Eng. Comput. 2021, 38, 2991–3005. [Google Scholar] [CrossRef]
  24. Rocha, A.; Akhavan-Safar, A.; Carbas, R.; Marques, E.; Goyal, R.; El-zein, M.; da Silva, L. Numerical analysis of mixed-mode fatigue crack growth of adhesive joints using CZM. Theor. Appl. Fract. Mech. 2020, 106, 102493. [Google Scholar] [CrossRef]
  25. Carter, B.; Wawrzynek, P.; Ingraffea, A. Automated 3-D crack growth simulation. Int. J. Numer. Methods Eng. 2000, 47, 229–253. [Google Scholar] [CrossRef]
  26. Nagarajappa, N.; Malipatil, S.G.; Majila, A.N.; Fernando, D.C.; Manjuprasad, M.; Manjunatha, C. Fatigue Crack Growth Prediction in a Nickel-Base Superalloy Under Spectrum Loads Using FRANC3D. Trans. Indian Natl. Acad. Eng. 2022, 7, 533–540. [Google Scholar] [CrossRef]
  27. Kuang, Y.; Wang, Y.; Xiang, P.; Tao, L.; Wang, K.; Fan, F.; Yang, J. Experimental and Theoretical Study on the Fatigue Crack Propagation in Stud Shear Connectors. Materials 2023, 16, 701. [Google Scholar] [CrossRef] [PubMed]
  28. Hou, J.; Goldstraw, M.; Maan, S.; Knop, M. An Evaluation of 3D Crack Growth Using ZENCRACK; Defence Science and Technology Organisation Victoria: Melbourne, Australia, 2001.
  29. Shahani, A.; Farrahi, A. Experimental investigation and numerical modeling of the fatigue crack growth in friction stir spot welding of lap-shear specimen. Int. J. Fatigue 2019, 125, 520–529. [Google Scholar] [CrossRef]
  30. Alshoaibi, A.M.; Fageehi, Y.A. 3D modelling of fatigue crack growth and life predictions using ANSYS. Ain Shams Eng. J. 2022, 13, 101636. [Google Scholar] [CrossRef]
  31. Alshoaibi, A.M.; Fageehi, Y.A. Numerical Analysis on Fatigue Crack Growth at Negative and Positive Stress Ratios. Materials 2023, 16, 3669. [Google Scholar] [CrossRef] [PubMed]
  32. Alshoaibi, A.M.; Fageehi, Y.A. Finite Element Simulation of a Crack Growth in the Presence of a Hole in the Vicinity of the Crack Trajectory. Materials 2022, 15, 363. [Google Scholar] [CrossRef]
  33. Alshoaibi, A.M.; Fageehi, Y.A. Numerical Analysis of Fatigue Crack Growth Path and Life Predictions for Linear Elastic Material. Materials 2020, 13, 3380. [Google Scholar] [CrossRef]
  34. Alshoaibi, A.M. Comprehensive comparisons of two and three dimensional numerical estimation of stress intensity factors and crack propagation in linear elastic analysis. Int. J. Integr. Eng. 2019, 11, 45–52. [Google Scholar] [CrossRef]
  35. Teh, S.; Andriyana, A.; Ramesh, S.; Putra, I.; Kadarno, P.; Purbolaksono, J. Tetrahedral meshing for a slanted semi-elliptical surface crack at a solid cylinder. Eng. Fract. Mech. 2021, 241, 107400. [Google Scholar] [CrossRef]
  36. Sajith, S.; Shukla, S.; Murthy, K.; Robi, P. Mixed mode fatigue crack growth studies in AISI 316 stainless steel. Eur. J. Mech.-A/Solids 2020, 80, 103898. [Google Scholar] [CrossRef]
  37. Erdogan, F.; Sih, G. On the crack extension in plates under plane loading and transverse shear. J. Basic Eng. 1963, 85, 519–525. [Google Scholar] [CrossRef]
  38. Chang, K.J. On the maximum strain criterion—A new approach to the angled crack problem. Eng. Fract. Mech. 1981, 14, 107–124. [Google Scholar] [CrossRef]
  39. Sih, G.C. Strain-energy-density factor applied to mixed mode crack problems. Int. J. Fract. 1974, 10, 305–321. [Google Scholar] [CrossRef]
  40. Palaniswamy, K.; Knauss, W. Propagation of a crack under general, in-plane tension. Int. J. Fract. Mech. 1972, 8, 114–117. [Google Scholar] [CrossRef]
  41. Wawrzynek, P.; Carter, B.; Banks-Sills, L. The M-Integral for Computing Stress Intensity Factors in Generally Anisotropic Materials; National Aeronautics and Space Administration, Marshall Space Flight Center: Huntsville, AL, USA, 2005.
  42. Citarella, R.; Giannella, V.; Lepore, M.; Dhondt, G. Dual boundary element method and finite element method for mixed-mode crack propagation simulations in a cracked hollow shaft. Fatigue Fract. Eng. Mater. Struct. 2018, 41, 84–98. [Google Scholar] [CrossRef]
  43. Dhondt, G.; Hackenberg, H.-P. Use of a rotation-invariant linear strain measure for linear elastic crack propagation calculations. Eng. Fract. Mech. 2021, 247, 107634. [Google Scholar] [CrossRef]
  44. Bjørheim, F. Practical Comparison of Crack Meshing in ANSYS Mechanical APDL 19.2. Master’s Thesis, University of Stavanger, Stavanger, Norway, 2019. [Google Scholar]
  45. ANSYS. Academic Research Mechanical, Release 19.2, Help System. In Coupled Field Analysis Guide; ANSYS, Inc.: Canonsburg, PA, USA, 2020. [Google Scholar]
  46. Xiangqiao, Y.; Shanyi, D.; Zehua, Z. Mixed-mode fatigue crack growth prediction in biaxially stretched sheets. Eng. Fract. Mech. 1992, 43, 471–475. [Google Scholar] [CrossRef]
  47. Richard, H. Fracture Predictions for Cracks Exposed to Superimposed Normal and Shear Stresses; International Nuclear Information System: Vienna, Austria, 1985. [Google Scholar]
  48. Sajjadi, S.; Ostad Ahmad Ghorabi, M.; Salimi-Majd, D. A novel mixed-mode brittle fracture criterion for crack growth path prediction under static and fatigue loading. Fatigue Fract. Eng. Mater. Struct. 2015, 38, 1372–1382. [Google Scholar] [CrossRef]
  49. Richard, H.; Sander, M.; Fulland, M.; Kullmer, G. Development of fatigue crack growth in real structures. Eng. Fract. Mech. 2008, 75, 331–340. [Google Scholar] [CrossRef]
Figure 1. Flowchart for the ANSYS SMART crack growth procedures.
Applsci 13 09446 g001
Figure 2. Geometrical representation of CTS specimen.
Applsci 13 09446 g002
Figure 3. (a) Force division; (b) loading angles.
Applsci 13 09446 g003
Figure 4. The initial mesh for the compact tension shear specimen.
Applsci 13 09446 g004
Figure 5. Predicted crack growth paths compared to experimental data by [36].
Applsci 13 09446 g005
Figure 6. Comparison of predicted and experimental crack propagation trajectories for a 30° loading angle: (a) present study and (b) experimental [15].
Applsci 13 09446 g006
Figure 7. Comparison of predicted and experimental crack propagation trajectories for a 45° loading angle: (a) present study and (b) experimental [15].
Applsci 13 09446 g007
Figure 8. Comparison of predicted and experimental crack propagation trajectories for a 60° loading angle: (a) present study and (b) experimental [15].
Applsci 13 09446 g008
Figure 9. A comparison of fatigue life for a loading angle 30°, experimental [36] versus simulated results.
Applsci 13 09446 g009
Figure 10. A comparison of fatigue life for a loading angle 45°, experimental [36] versus simulated results.
Applsci 13 09446 g010
Figure 11. A comparison of fatigue life for loading angle 60°, experimental [36] versus simulated results.
Applsci 13 09446 g011
Figure 12. Comparison of the opening mode of SIF (KI) for different loading angles.
Applsci 13 09446 g012
Figure 13. Comparison of the in-plane shear mode of stress-intensity factor (KII) for different loading angles.
Applsci 13 09446 g013
Figure 14. Von Mises stress distribution (MPa) (a) 30°, (b) 45°, and (c) 60°.
Applsci 13 09446 g014
Figure 15. Maximum shear stress distribution (MPa) (a) 30°, (b) 45°, and (c) 60°.
Applsci 13 09446 g015aApplsci 13 09446 g015b
Table 1. Mechanical properties of the CTS specimen.
PropertiesMetric Units Value
Elasticity Modulus, E192 GPa
Poisson’s ratio, υ0.27
Yield strength, σy295 MPa
Ultimate strength, σu582 MPa
Paris law coefficient, C4.051 × 10−8
Paris law exponent, m2.348
Table 2. Forces for different loading angles.
αF2F1F3
300.5 F0.933 F−0.067 F
450.707 F1.061 F−0.354 F
600.866 F1.116 F−0.616 F
Disclaimer/Publisher’s Note: The statements, opinions and data contained in all publications are solely those of the individual author(s) and contributor(s) and not of MDPI and/or the editor(s). MDPI and/or the editor(s) disclaim responsibility for any injury to people or property resulting from any ideas, methods, instructions or products referred to in the content.

