Article

Using Public Landslide Inventories for Landslide Susceptibility Assessment at the Basin Scale: Application to the Torto River Basin (Central-Northern Sicily, Italy)

1
Department of Earth and Marine Sciences, University of Palermo, 90123 Palermo, Italy
2
School of Science and Technology, Geology Division, University of Camerino, 62032 Camerino, Italy
*
Author to whom correspondence should be addressed.
Appl. Sci. 2023, 13(16), 9449; https://doi.org/10.3390/app13169449
Submission received: 20 July 2023 / Revised: 10 August 2023 / Accepted: 18 August 2023 / Published: 21 August 2023
(This article belongs to the Special Issue Advancing Complexity Research in Earth Sciences and Geography)

Abstract

:
In statistical landslide susceptibility evaluation, the quality of the model and its prediction image heavily depends on the quality of the landslide inventories used for calibration. However, regional-scale inventories made available by public territorial administrations are typically affected by an unknown grade of incompleteness and mapping inaccuracy. In this research, a procedure is proposed for verifying and solving such limits by applying a two-step susceptibility modeling procedure. In the Torto River basin (central-northern Sicily, Italy), using an available regional landslide inventory (267 slide and 78 flow cases), two SUFRA_1 models were first prepared and used to assign a landslide susceptibility level to each slope unit (SLU) in which the study area was partitioned. For each of the four susceptibility classes that were obtained, 30% of the mapping units were randomly selected and their stable/unstable status was checked by remote analysis. The new, increased inventories were finally used to recalibrate two SUFRA_2 models. The prediction skills of the SUFRA_1 and SUFRA_2 models were then compared by testing their accuracy in matching landslide distribution in a test sub-basin where a high-resolution systematic inventory had been prepared. According to the results, the strong limits of the SUFRA_1 models (sensitivity: 0.67 and 0.57 for slide and flow, respectively) were largely solved by the SUFRA_2 model (sensitivity: 1 for both slide and flow), suggesting the proposed procedure as a possibly suitable modeling strategy for regional susceptibility studies.

1. Introduction

Landslide susceptibility assessment can be performed by applying statistical methods to model the dependence between a set of predictors and an outcome expressing the stable/unstable status of a mapping unit [1,2,3,4]. The reliability of a predictive model strongly relies on the completeness and representativeness of the landslide inventory that is used for calibration [5,6,7,8,9]. In particular, regional landslide susceptibility studies require the use of landslide inventories, which are typically available only from public administrations. In fact, such a big database is typically the result of long-term cumulative reported cases that are mapped following warnings from local municipality offices, transportation companies, or even citizens. As a matter of fact, the reported landslide cases are clustered around urban areas and the infrastructural axis. For this reason, this kind of inventory suffers from an unknown grade of incompleteness and inaccuracy. The number of cases is also too large for an accurate check to be performed by regional authorities. Both multiple typologies and landslide polygons are frequently corrected. These limits are obviously much more marked in agricultural and pastoral areas [10,11], where the potential interest for urban development is not infrequent. On the other hand, regional landslide databases allow the available landslide inventories to be immediately obtained, thereby saving time and resources from mapping [12].
Thus, defining a useful way to increase the quality of regional landslide inventories is a goal of research focused on landslide susceptibility evaluation but also of public administrations. In fact, the latter, generally determine landslide risk by crossing the inventoried phenomena (and their typological/geometrical characteristics) and the exposed vulnerable areas (e.g., urbanized sectors or communication routes). In addition, support for territory management, planning, and safety measures is mainly defined based on geo-hydrological hazards. In this sense, public administrations have made various efforts to obtain more correct and complete landslide inventories [13,14].
In light of the abovementioned issues, a need arises to find possible modeling procedures for regional landslide susceptibility assessment that are capable of both detecting and solving the potential limits induced by poor calibration inventories. However, studies aimed at evaluating the effects of incomplete inventories are nowadays focused on the models’ performance [7] or the variables’ importance [5,10]. In this research, a procedure for using regional landslide inventories to prepare reliable and accurate susceptibility models is proposed. By applying the approach suggested by Martinello et al. [7], the potential limits of a susceptibility model calibrated with the source inventory were first identified. By systematically checking a portion of the study area, an enrichment of the original calibration landslide inventory was then obtained. A new model was then recalibrated and its accuracy evaluated and compared with that of the source model.
The research was carried out in the context of the SUFRA project, a challenging project that involves the analysis and evaluation of all types of landslide susceptibilities (slide, flow, rapid flow, fall-topple, and lateral spread) for the whole regional territory of Sicily (~26,000 km2). It is the first project focused on landslide susceptibility evaluation at the regional scale, and it will be used by the public administration for territorial planning and civil protection aims. Considering the short duration of the project (only two years), we were forced to base our analysis on the landslide inventories already available with the Sicilian public administration. At the same time, in the context of the PNRR project GeoSciences IR, the research was focused on defining strategies to increase the overall quality of public landslide inventories, thus optimizing costs, resources, and time.

2. Materials and Methods
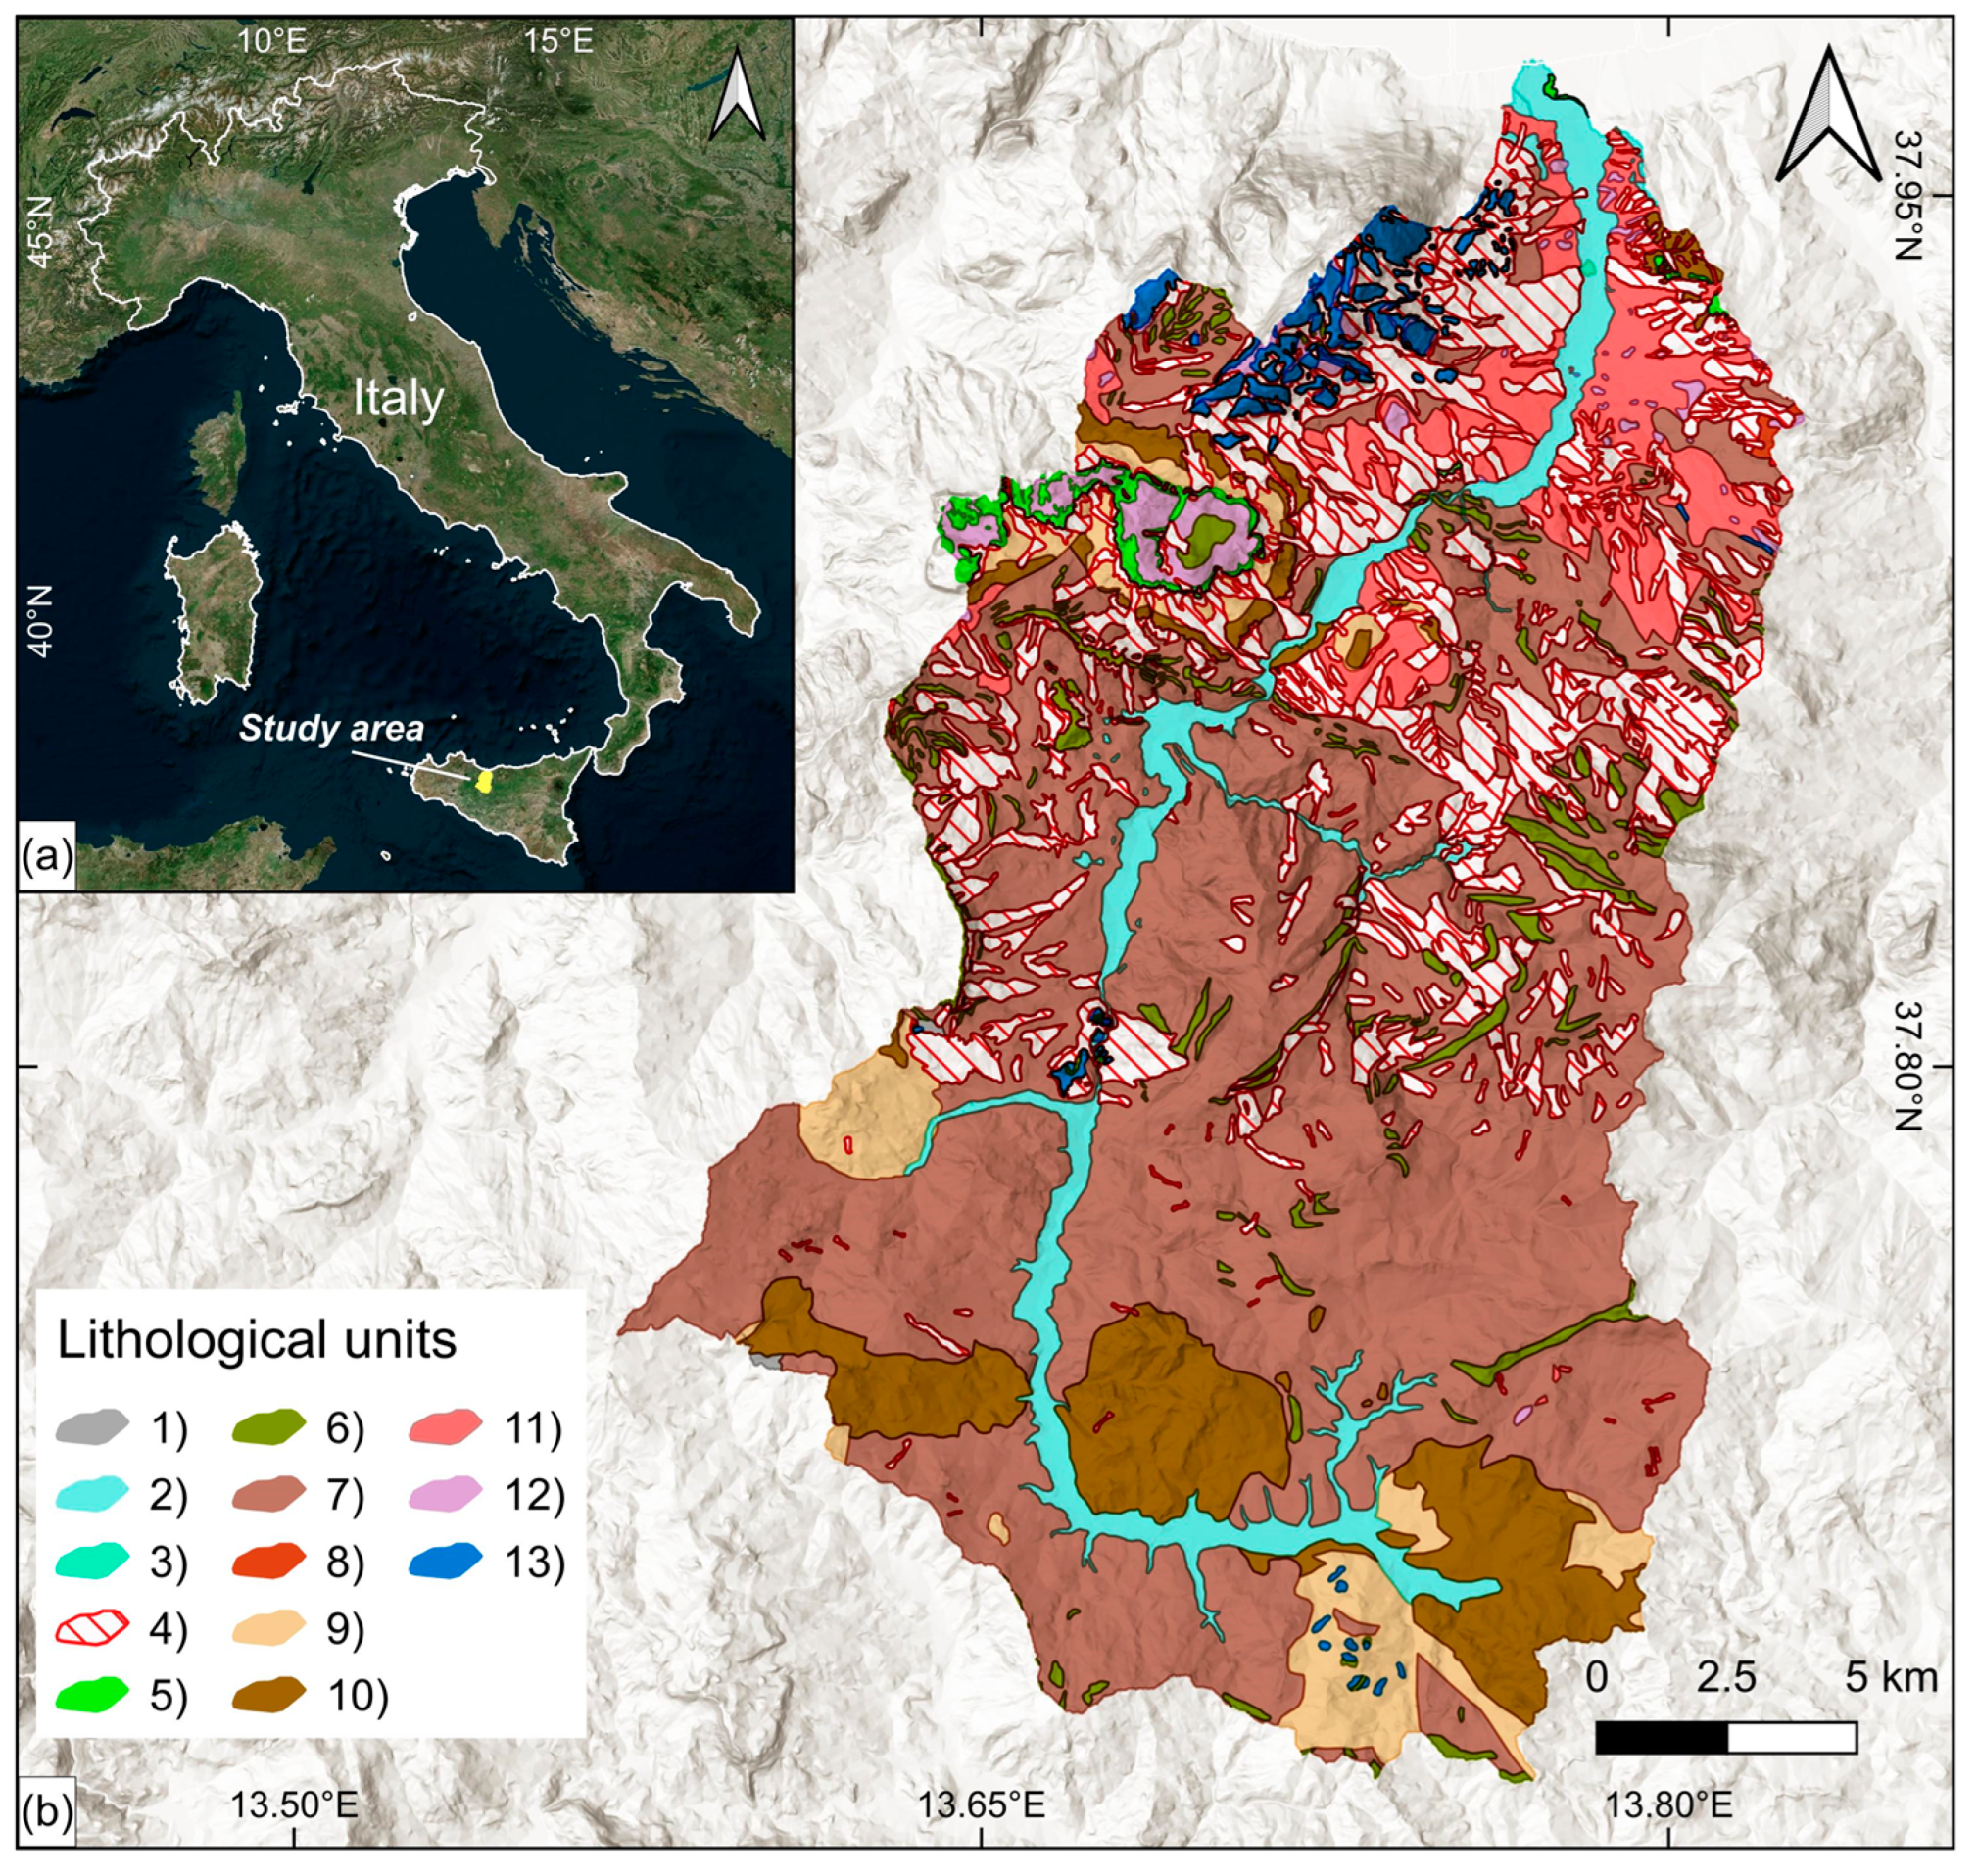
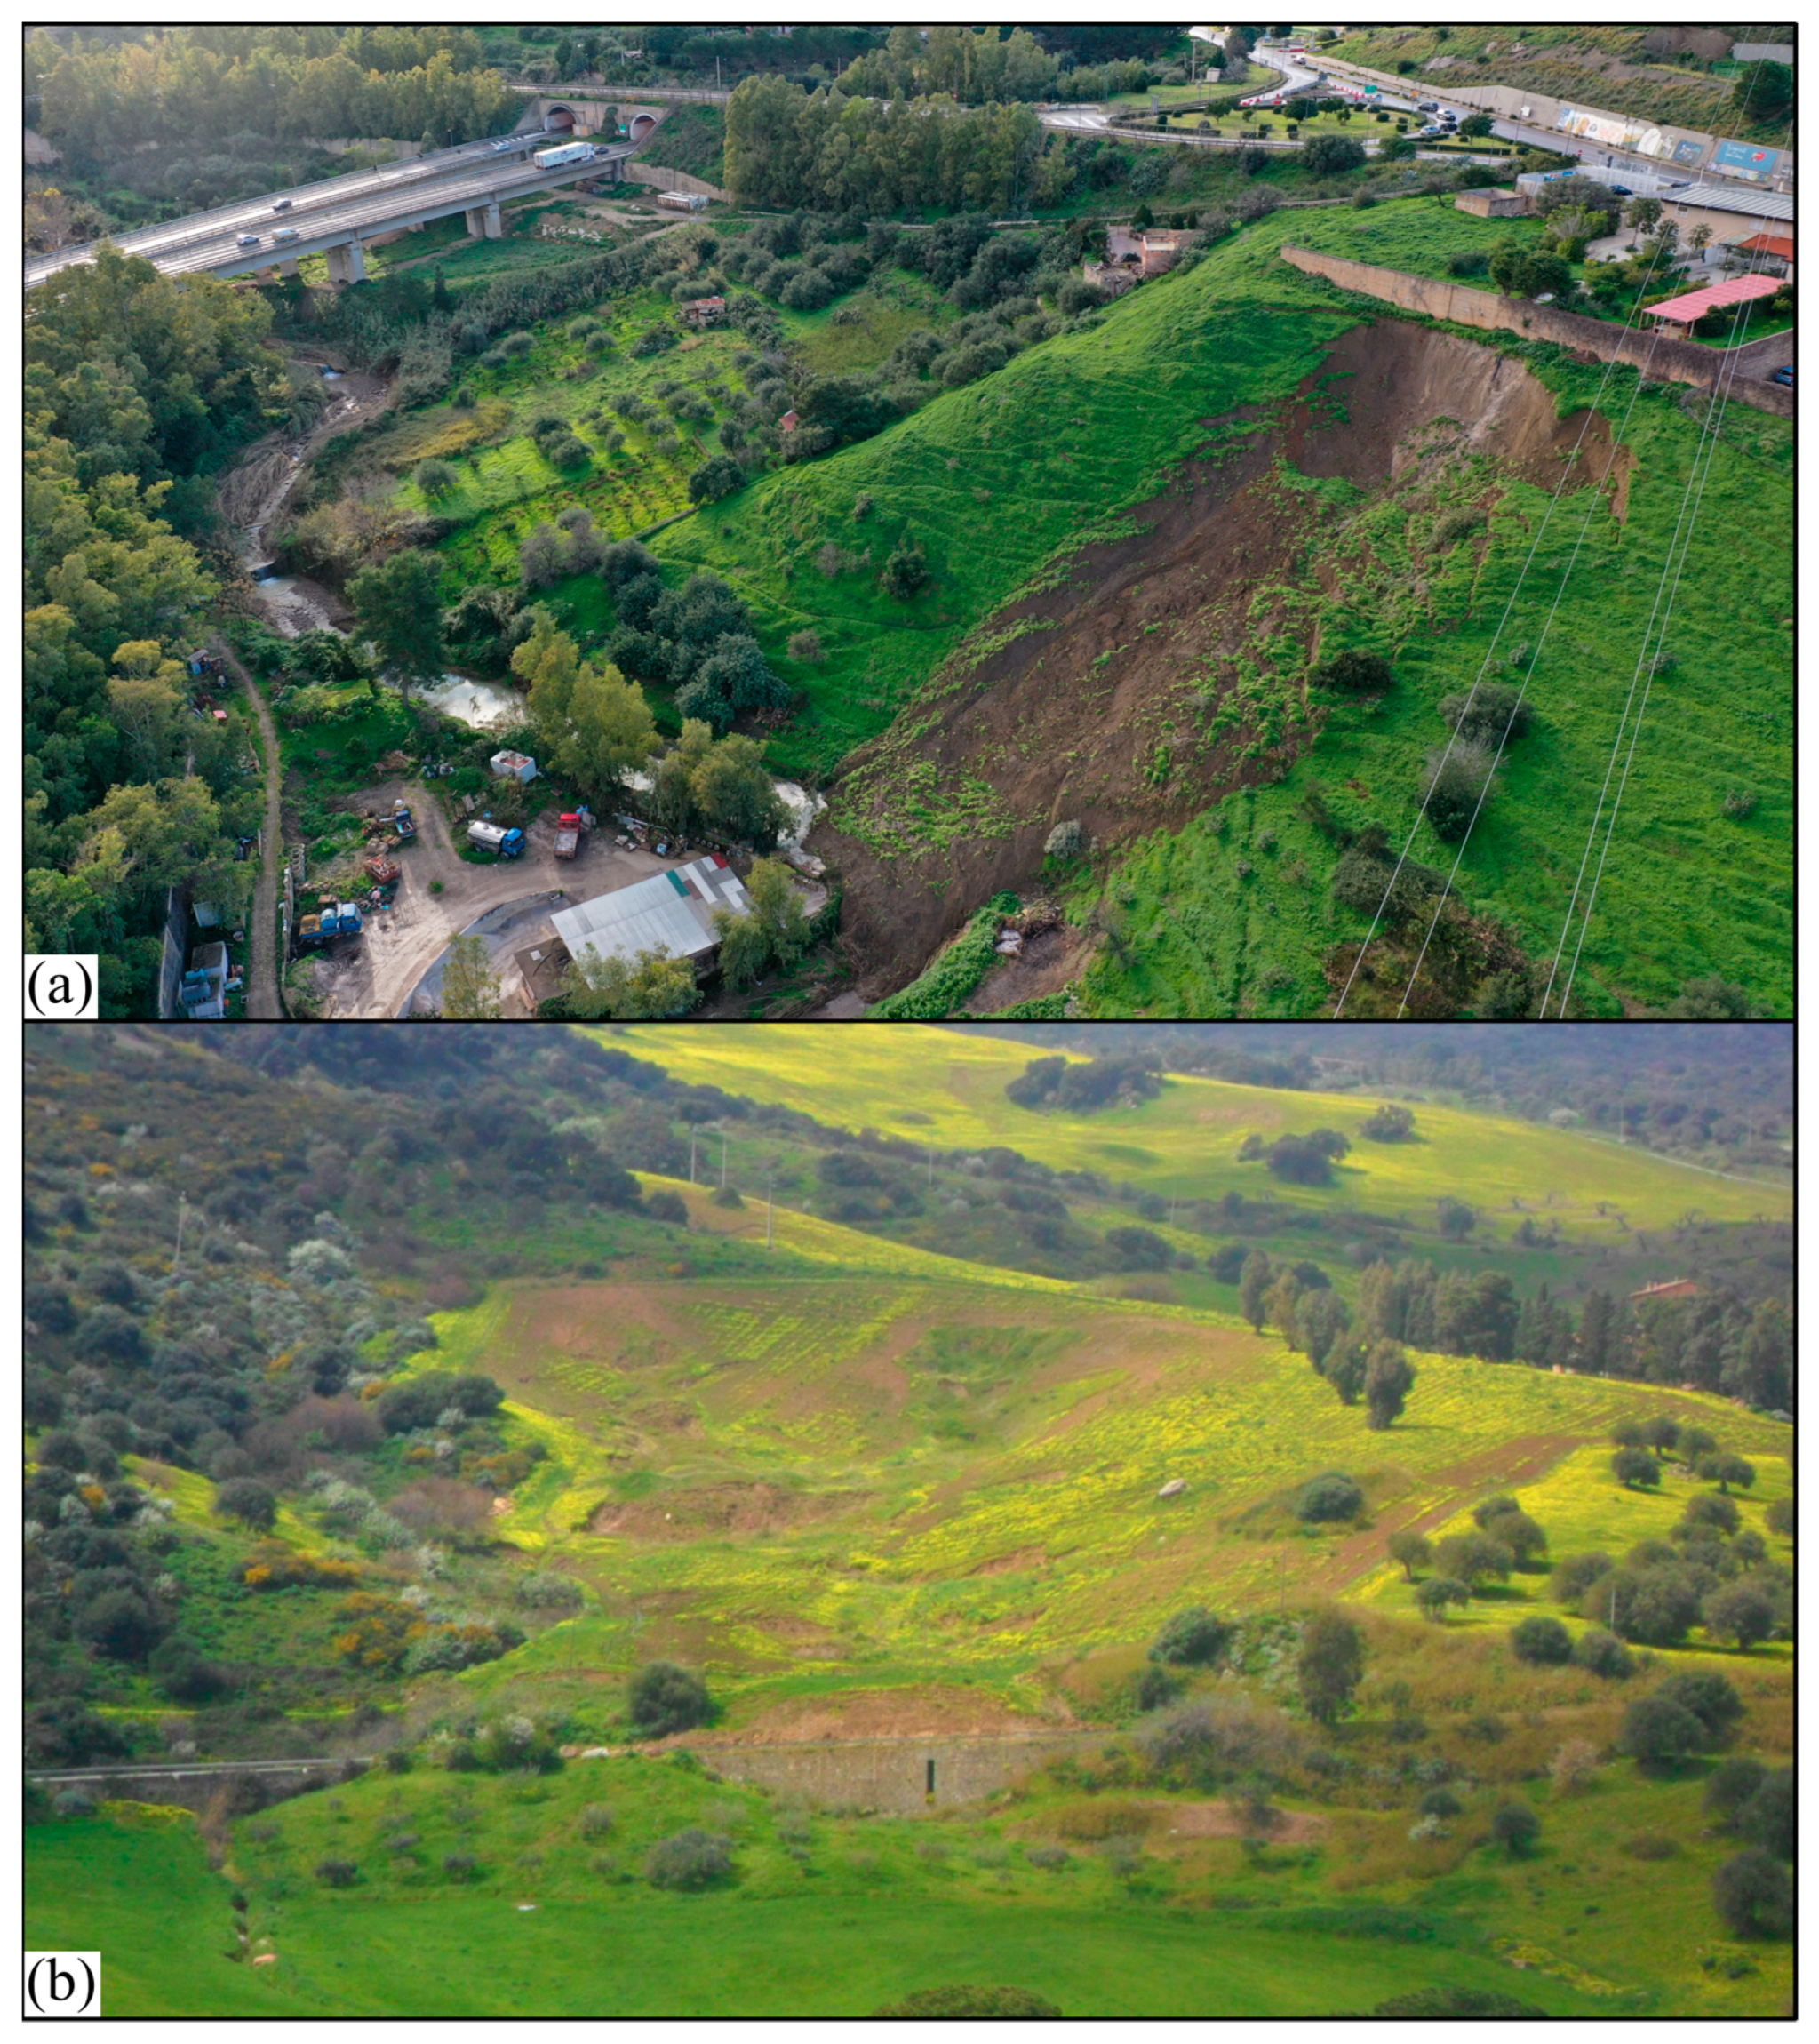
The available slide and flow inventories of the Torto River basin (420 km2, central-northern Sicily), which were prepared by the “Dipartimento Regionale dell’Autorità di Bacino del Distretto Idrografico Sicilia” (the so-named P.A.I. inventories), and a set of twelve geo-environmental predictors were used to produce two basin-scale susceptibility models (for slides and flows, respectively) by applying multivariate adaptive regression splines (MARS). The obtained first-level landslide susceptibility maps were used for checking 30% of mapping units in which no landslides of P.A.I. were present and defining their stable/unstable status with respect to flow and slide movements. The checked archives were used for integrating the main inventories (the P.A.I. inventories) in order to obtain second-level landslide susceptibility maps. Once all landslide susceptibility maps were produced (first level and second level), the accuracy of the obtained maps was verified by validating high-resolution flow/slide archives detected for a small sub-basin (Sciara) of the Torto catchment.
The research was implemented using open-source geographical information system software (GIS; Quantum GIS [15], GRASS GIS [16], and SAGA GIS [17]) and the Rstudio statistical platform [18].

2.1. Study Area

The Torto River extends for 423 km2 in the northern section of Sicily (Italy, Figure 1a) between two mountain ranges, namely, the Madonie Mountains at the east and the Termini Mountains at the west, and the Tyrrhenian Sea. The geomorphological setting of the study area is the result of tectonic and selective erosion, karstification, and deep-seated gravitation slope deformation [19,20].
In fact, the study area falls within the central-western section of the Sicilian fold and thrust belt, which is the result of the retreat of the subduction hinge of the Ionian oceanic lithosphere and the postcollisional convergence between Africa and Europe [21,22,23,24]. This complex structural setting results in a multiduplex system where the basin tectonic units overthrust platform tectonic units across subhorizontal surfaces with prevalent S–SW transport direction and components of northward back-thrusting. In the area, Sicilide units and the Numidian Flysch are widely outcropped, while Imerese basin units mainly represent the basal body. However, Plio-Quaternary high-angle faults create new contacts between the carbonatic Imerese successions and Cenozoic clayey rocks belonging to the Numidian Flysch, which are sometimes overthrust by the Sicilide units [19,20] (Figure 1b).
According to the geological setting, the study area is characterized by a hilly landscape modeled by gravitational movements and water erosion, whilst carbonate reliefs [20,25] are affected by gravitational (mainly falls) and karstic processes. Mount San Calogero is the highest relief of the area (1370 m s.l.m).
The climate of the Torto River basin is classified as the Mediterranean type, with rainfall concentrated mainly in the winter semester, while the summer period is characterized by almost drought conditions. The mean annual rainfall is around 600 mm, while the mean temperature value is about 15 °C.

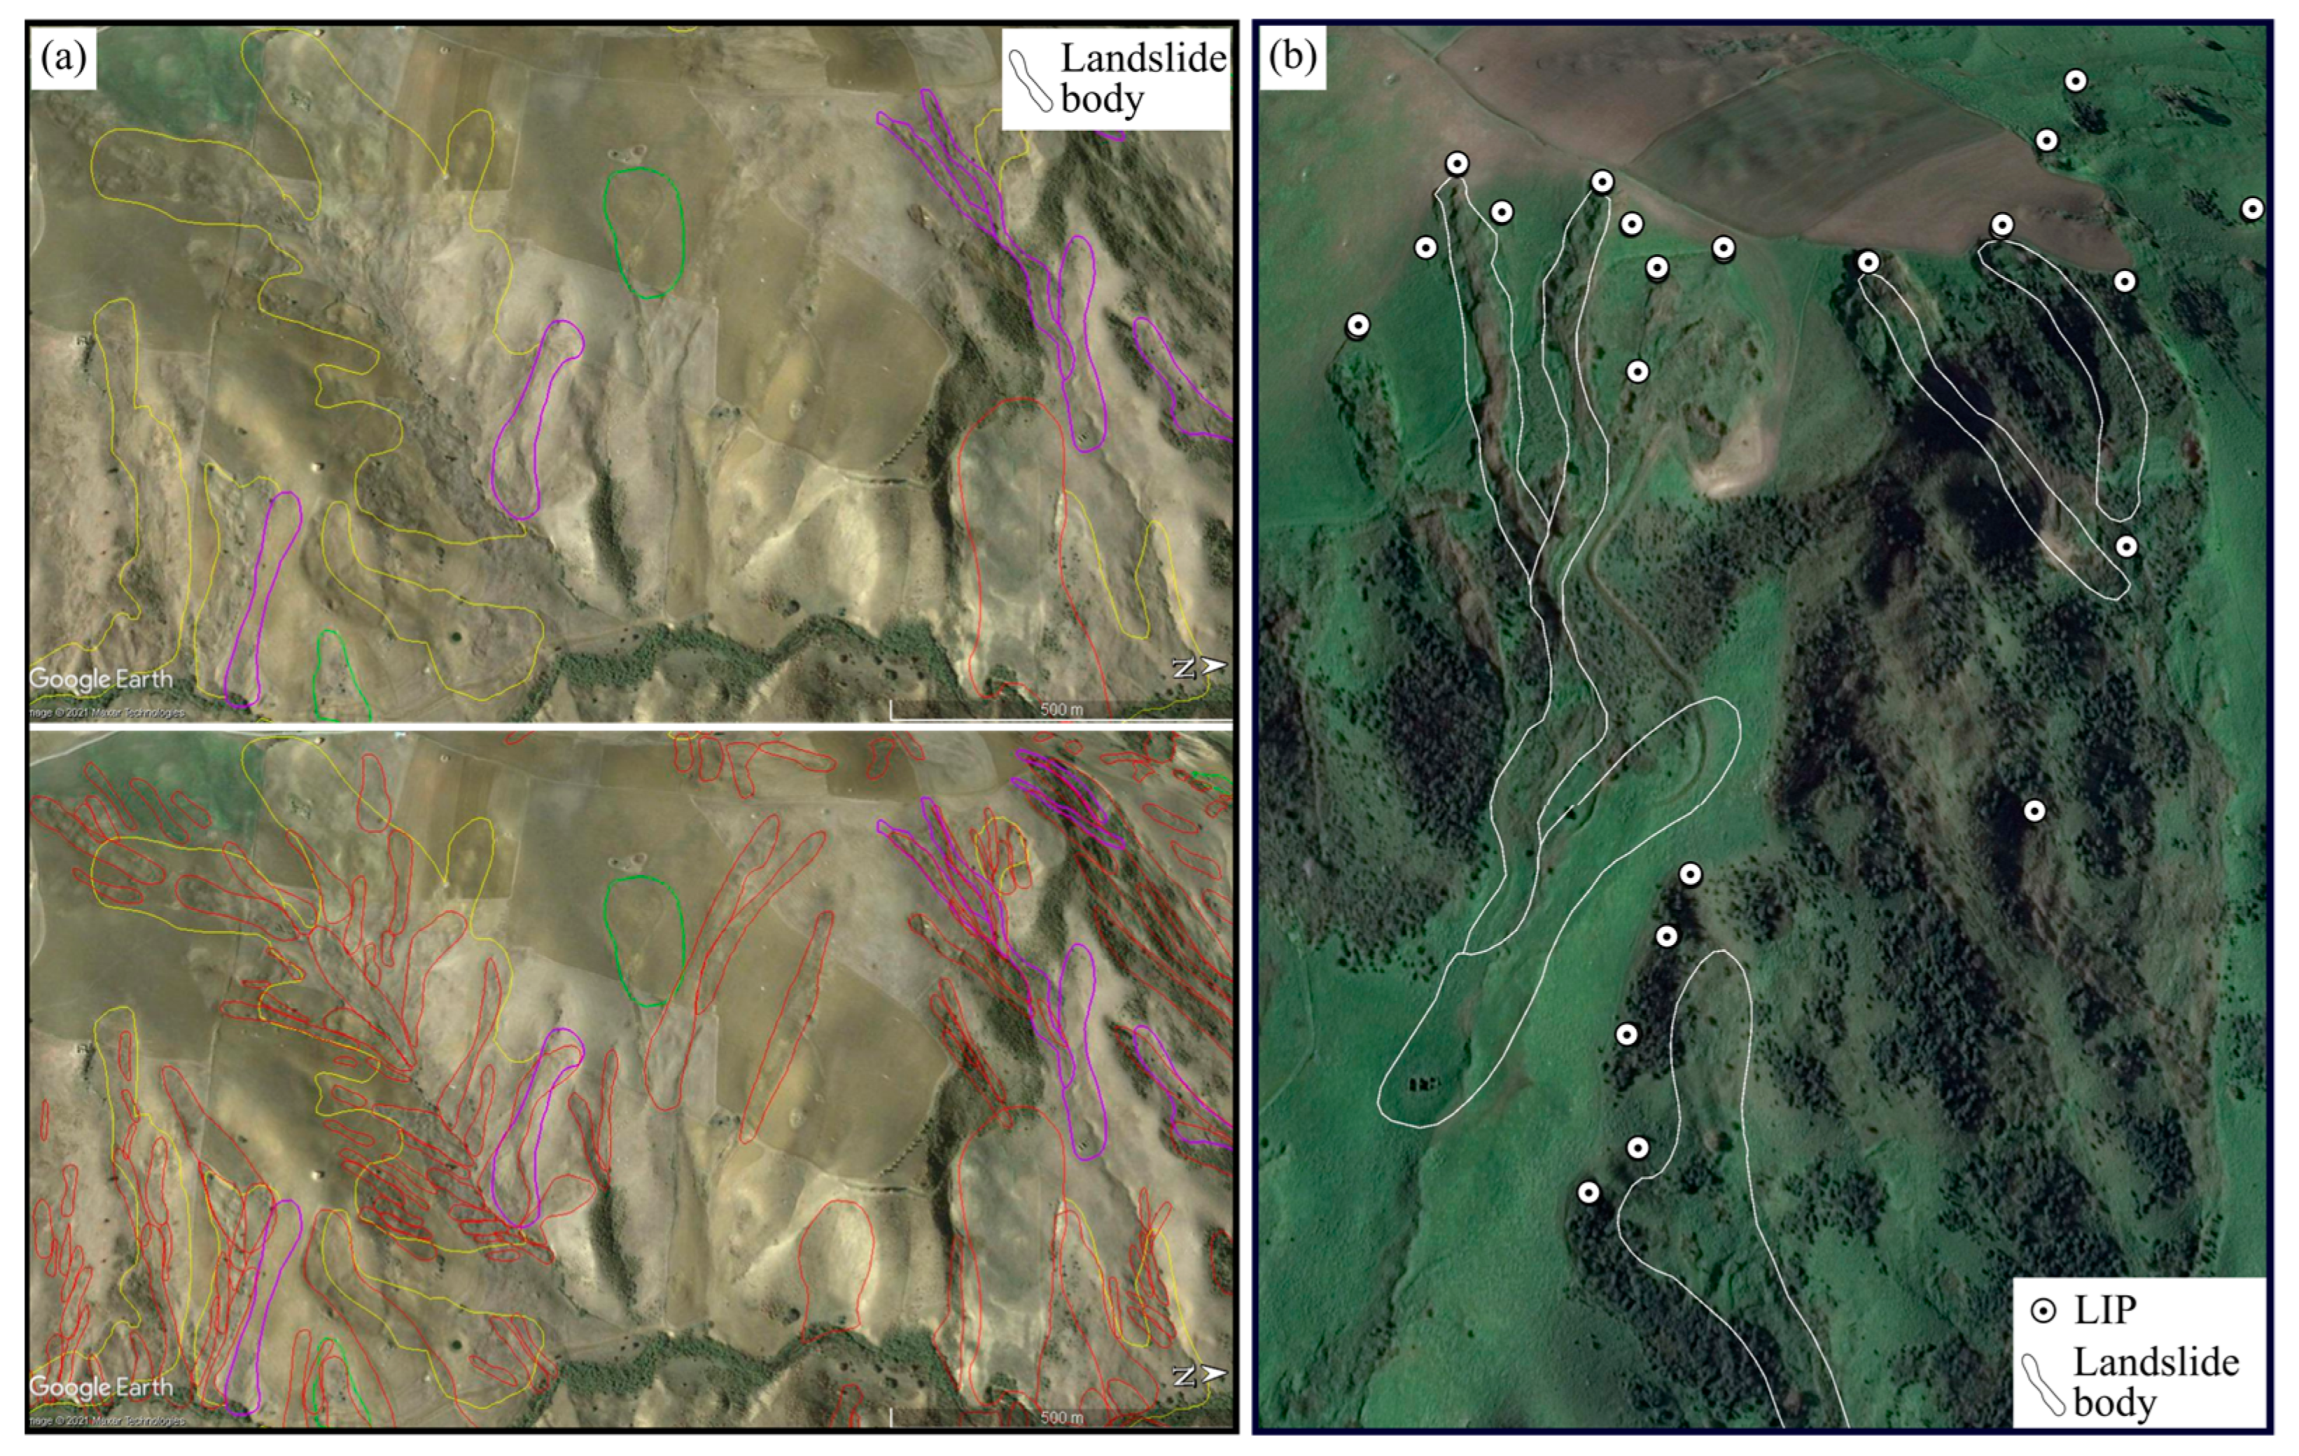
2.2. Landslide Inventory

Starting from the available P.A.I. (Piano stralcio di bacino per l’Assetto Idrogeologico) landslide archives prepared by the “Dipartimento Regionale dell’Autorità di Bacino del Distretto Idrografico Sicilia”, slide, flow, and complex inventories were distinct and submitted to remote checking. In fact, frequently, single phenomena are typically grouped into large polygons in these inventories, and, moreover, their boundaries are not so accurate (Figure 2a).
In order to propose a landslide susceptibility evaluation technique with statistical methods, it is necessary to discriminate every individual landslide and, when needed, reinterpret the type of movement [26,27]. It is worth noting that the single phenomena were checked only inside the P.A.I. landslide polygons. This means that instead of a systematic (and complete) inventory, P.A.I.-driven mapping was produced (Figure 2b). The reason for this choice lies in the aim of the research, i.e., testing a good practice where available regional public landslide inventory can be used to obtain basin-scale susceptibility maps. In this way, according to Hungr et al. [26], for complex landslides, each component of the phenomenon was defined so that only two different inventories were obtained at the end of the mapping: the slide (78 cases) and the flow (267 cases) archives. In fact, it was assumed here that rotational and translational slides share their slope susceptibility conditions to a large extent. With regard to checking the P.A.I. inventory, the more frequently observed flaws (12 cases) concerned large earth-flows, which were misclassified as (rotational) slides.
Two examples of these very diffused landslide types are given in Figure 3. The landslide identification point (LIP), which corresponds to the highest point along the crown of the landslide area, was assumed as diagnostic in potentially marking unstable slope conditions [27,28,29,30,31].

2.3. Mapping Units and Landslide Conditioning Factors

Considering the type of phenomena analyzed and the scale of the landslide susceptibility evaluation, we decided to employ slope units as mapping units (SLU). In fact, for the purpose of the project, we needed to detect the activation area but also include the potential area of propagation and arrest of the phenomena. According to the literature [6,9,32], SLUs have been demonstrated to be more geomorphologically adequate to represent all landslide phases (for the flow and slide phenomena) as it is assumed the complete landslide kinematic (initiation, propagation, and accumulation) occurs inside. For this research, SLUs were delimited by applying the r.watershed [33,34] GRASS GIS module using the 2000 contributing area threshold. By overlapping the SLUs with the landslide inventories, the stable/unstable status with respect to the slide and flow phenomena was defined for each slope unit depending on whether it hosts at least one LIP.
Geo-environmental predictors were selected on the basis of the expected direct or proxied role in landslides [7,27,35] (Table 1): outcropping lithology (LITO), land use (obtained by the Corine Land Cover 2018-USE), elevation (ELE—10 m), landform classification (LCL), steepness (SLO), aspect (expressed as northerness and easterness), plan (PLN), and profile (PRF) curvatures, topographic wetness index (TWI), and stream power index (SPI). For the continuous variables, a multicollinearity analysis was carried out using the variance inflation factor (VIF) obtained by applying the “usdm” R-package [36]. No multicollinearity emerged between the selected predictors. However, considering that specific modeling procedures were implemented separately for flow and slide, the SPI predictor was excluded for the slide model, while the TWI variable was excluded from the flow model.
Each variable was then characterized inside the SLUs by zonal statistics as deciles for the continuous variables and as relative frequencies for the categorical ones.

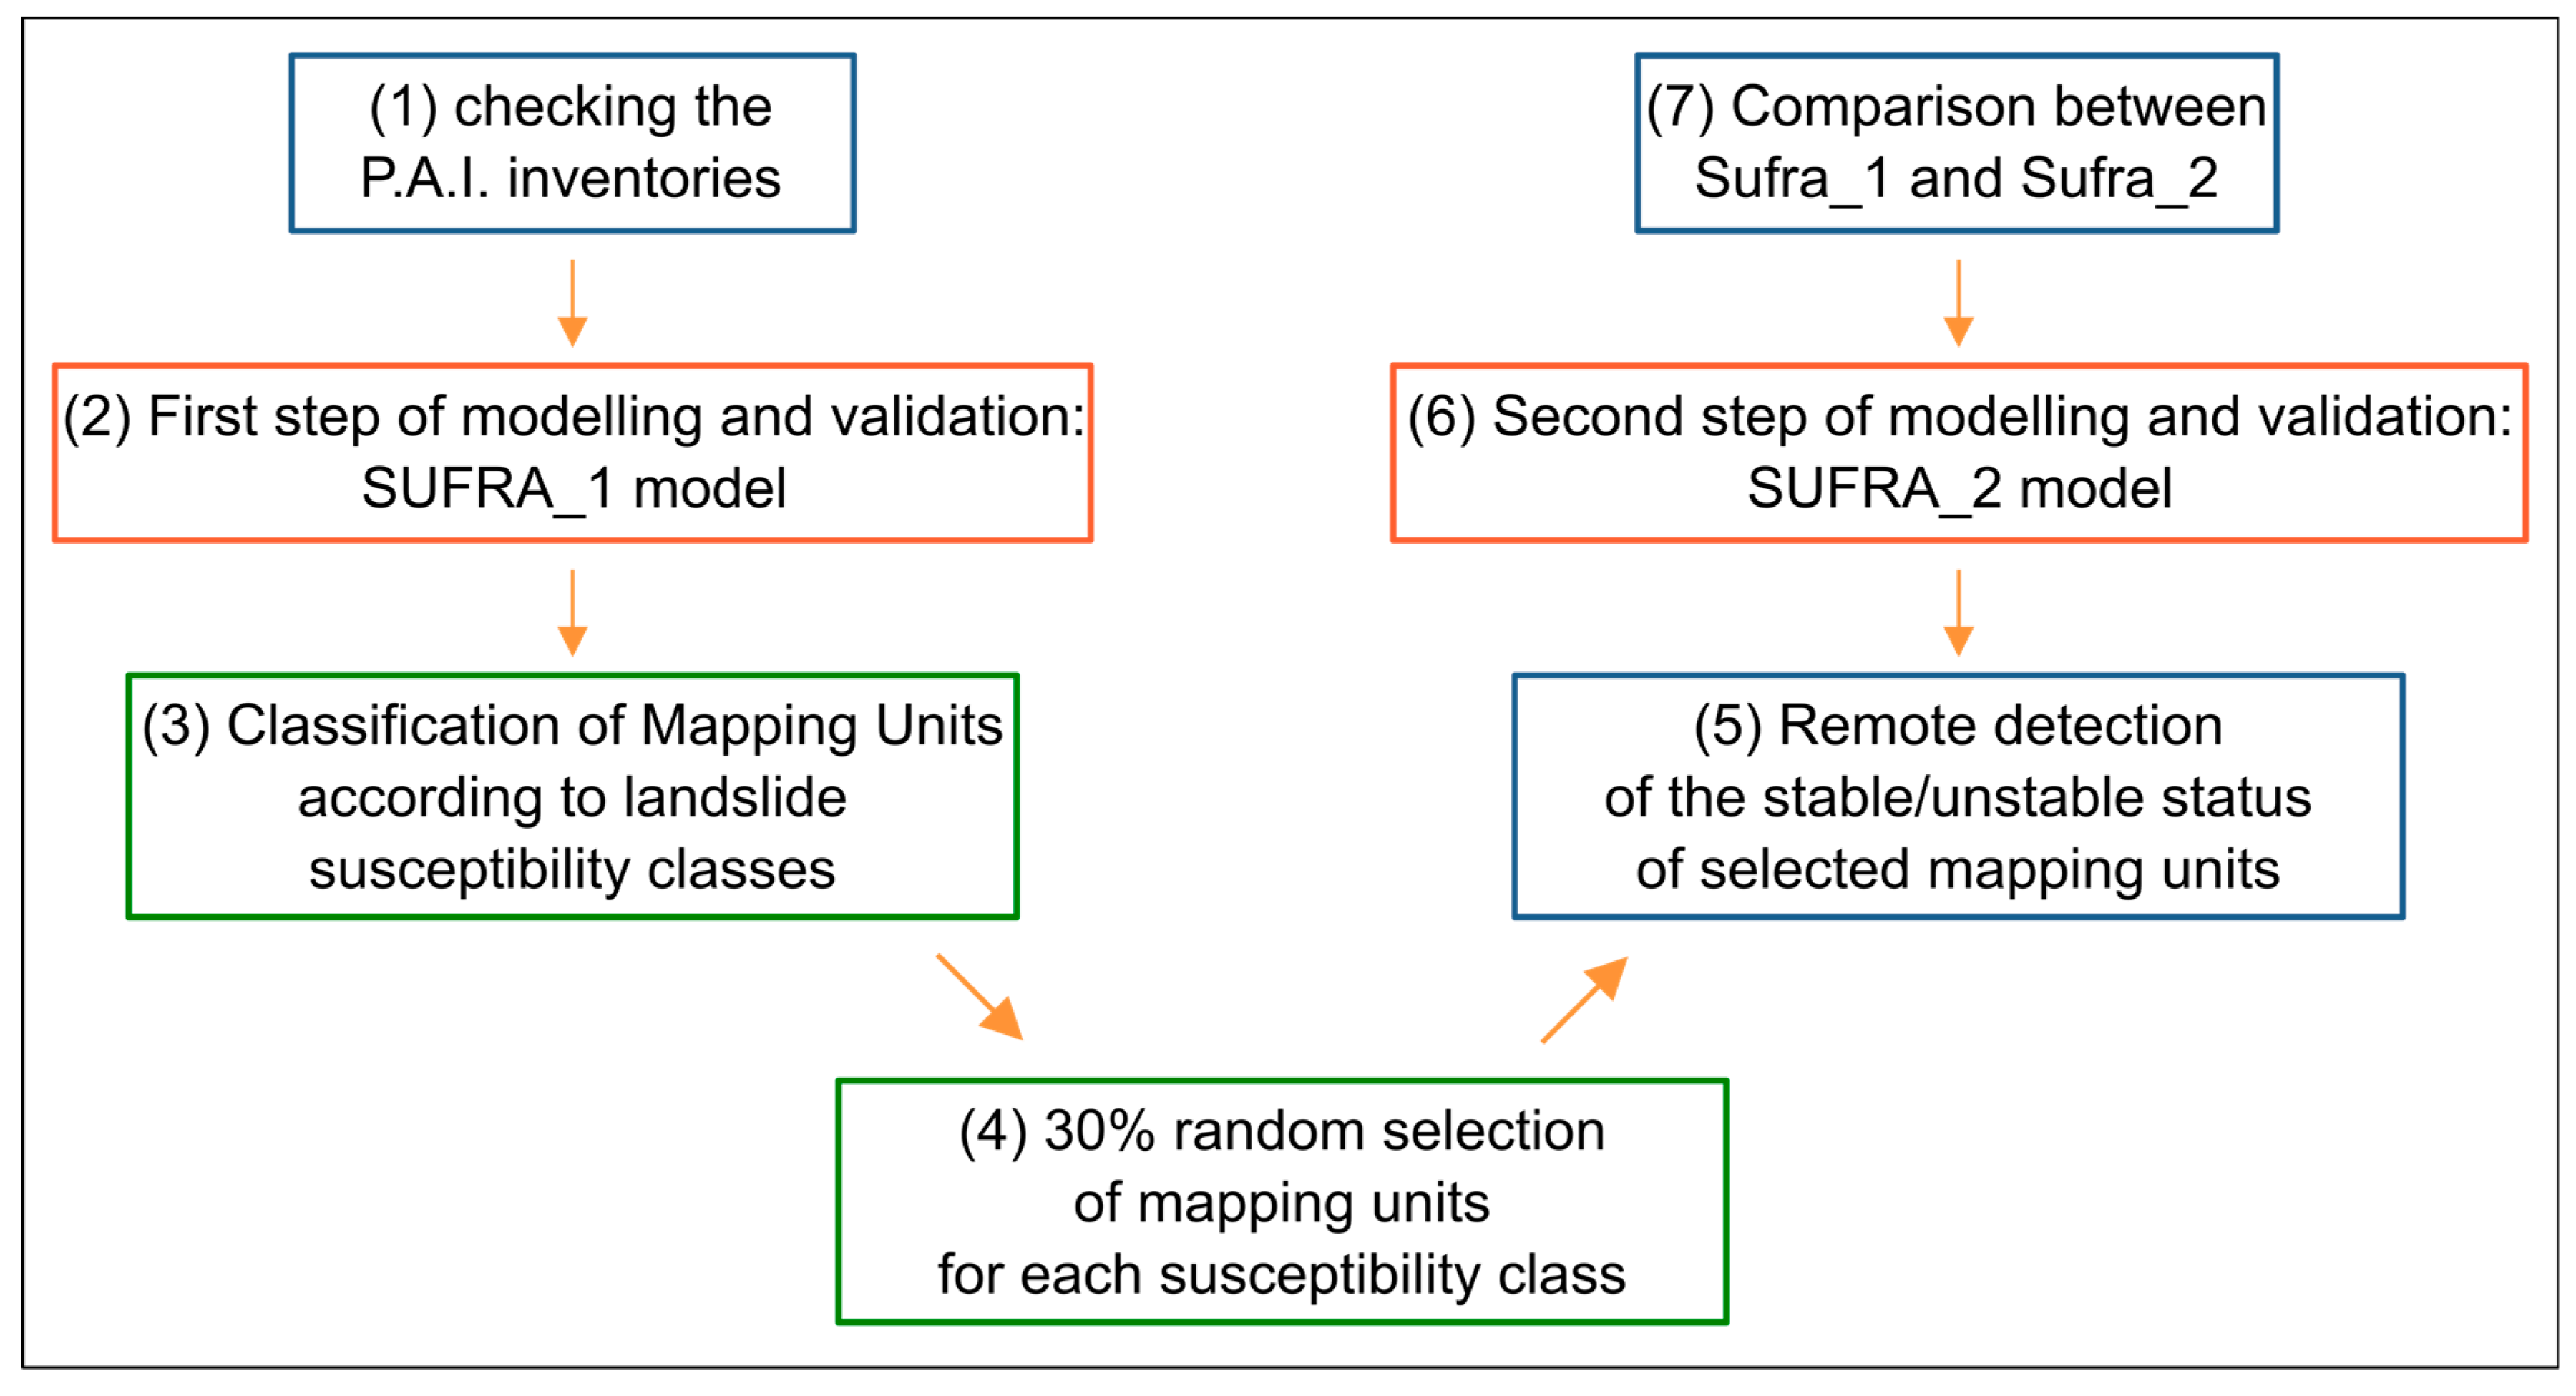
2.4. Statistical Model, Validation Tools, and Model-Building Strategies

The multivariate adaptive regression splines (MARS; [45]) method was used for all modeling procedures as it has been confirmed to be very effective in modeling nonlinear components of the relationship between landslides and their causative factors [6,46].
MARS is a nonparametric regression method that splits each independent variable into branches (optimizing their number based on the characteristics of the variable itself and the correlation with the distribution of other predictors). Each branch is defined by a hinge function (a function used for defining a nonlinear relationship between y and x) and the relative knot. The derived structures (hinge function and knots) identify a basis function that can take the shape of a simple linear regression (when the basis function corresponds to the model intercept, set to a constant value of 1) or more complex geometry (when the basis function is the product of one or more hinge functions associated with different covariates).
In this way, hinge functions boost the maximum-likelihood-based adaptation skill of the logistic regression method, according to
y = f x = α + i = 1 N β i h i x
where y is the dependent variable (the outcome) predicted by the function f(x), α is the model intercept, and βi is the coefficient of the hi basis functions given the N number of base functions. For other information about the method, please refer to [6,27,35,47,48,49]. For this research, MARS analysis was performed using the “earth” R-package [50].
Due to the fact that the MARS method is based on a presence–absence approach, a random extraction of negative cases in the same number as the positive cases was carried out. The random selection of negative cases and the subsequent modeling was replicated one-hundred times to evaluate the independence of the results (resolution and precision) from the specific choice of the negative cases [6,27]. On the other hand, to verify the prediction skill of the models, each balanced dataset was randomly split using 75% for calibration and the remaining 25% for validation [51].
AUC value (area under the curve) in the ROC (receiver operating characteristics) [52,53,54] was employed to evaluate the prediction skill of the model according to Hosmer and Lemeshow [55]. At the same time, the Youden index optimized score cut-off [56] was obtained from the ROC plots to set confusion matrices and calculate the related validation indices (sensitivity, specificity, and accuracy). Nested applications of the Youden index cut-off were employed to define the different cut-offs of four susceptibility levels in an objective way: S1 (low), S2 (moderate), S3 (high), and S4 (very high).
In Figure 4, the model-building strategy employed in this research is synthetically shown. Once the P.A.I. inventory was checked and the relative LIPs extracted, a first model named SUFRA_1 was obtained and validated, both for slide and flow landslides. Thus, each SLU was classified according to the resulting susceptibility score classes.
To test the quality of the prediction images in predicting a high-resolution unknown landslide inventory, a second validation was performed in the small Sciara sub-basin (~21 km2), where a new systematic inventory for flow and slide was prepared using remote surveys. The Sciara sub-basin was selected because, in light of its geomorphological setting, it is largely representative of the landslide susceptibility in the whole Torto basin area. Then, 30% of unrecognized P.A.I. SLUs were randomly extracted for each susceptibility class and submitted to remote detection of stable/unstable status with respect to flow and slide movements. Thus, using both the checked P.A.I inventory and the 30% systematically mapped one, two new (slides/flows) SUFRA_2 models were prepared. Finally, the performance of the models was evaluated both with respect to the whole Torto basin (P.A.I. checked inventories) and the Sciara basin.

3. Results

In Figure 5, the ROC plots for the SUFRA_1 models, both for the validation in the whole Torto basin and the Sciara sub-basin, are shown. The AUC values for SUFRA_1 models were outstanding for validation in the Torto basin (Figure 5a,b). However, the values decreased when the validation was focused on the Sciara sub-basin with respect to the systematic inventories (Figure 5c,d). This lowering was more marked for the flow model whose performance went from outstanding to good (0.77).
Confusion matrices (Table 2) confirmed these behaviors, with very high values of sensitivity (Sens. values of 1 and 0.98 for slide and flow model, respectively). However, a limited specificity (Spec. values of 0.69 and 0.67 for slide and flow model, respectively) resulted due to the high number of false positives (FPs) produced. These very low values of specificity also affected the accuracy (Acc.), which showed just sufficient values (~0.7).
On the other hand, the validation in the Sciara sub-basin revealed that the sensitivity suffered in the prediction images produced for both the slide and flow models when a systematic high-resolution archive was detected. This limit was more evident for the flow model for which the sensitivity was markedly insufficient (<0.6).
The ROC plots relative to the validation of the SUFRA_2 models for slide and flow movements are shown in Figure 6. In this case, outstanding AUC values (>0.9) were achieved for both the whole Torto basin (Figure 6a,b) and the Sciara sub-basin (Figure 6c,d).
Confusion matrices (Table 3) confirmed the high performance in validation within a coeval/homogeneous inventory of calibration with sensitivity values of 1 for slide and 0.95 for flow. Again, the specificity was just over 0.7 due to the high number of FPs produced. However, the validation in the Sciara sub-basin confirmed the better performance of the prediction images produced: the sensitivity was 1 for both flows and slides and, at the same time, the specificity was 0.75 for slides and 0.8 for flows; better values of accuracy (0.77 and 0.82 for slides and flows, respectively) were consequently obtained.

4. Discussion

The validation results of the SUFRA_1 models in the whole Torto River basin showed outstanding AUC values but with limited specificity compared to the very high values of sensitivity. Considering that the false positives are not only errors but also future positives, these results gave us a warning about the accuracy of the predicted landslide scenario. The validation in the Sciara sub-basin, where new systematic inventories for flow and slide were detected, showed that the quality of the prediction images produced was inaccurate. In fact, the sensitivity dramatically decreased here, especially for the flow model, clearly reflecting the limited skill of the models to detect new unknown phenomena. Considering the geomorphological setting of the Sciara sub-basin is representative of a very large part of the Torto River catchment, the limits of SUFRA_1 were considered relevant. On the other hand, the SUFRA_2 models maintained outstanding AUC values with very high sensitivity and good specificity and, differently from SUFRA_1, the new models still showed outstanding AUC values in the Sciara basin. More importantly, the sensitivity reached the maximum performance with good to excellent specificity. The false-positive rates still suggest the basin is characterized by relevant proneness to both flow- and slide-type slope failures. The same high-model performance was observed for both the landslide typologies, confirming that the goodness of this model procedure is independent of the landslide typology and number of cases (provided the inventory is representative).
According to our test, the proposed two-step approach is suitable for optimizing landslide susceptibility evaluation when the source inventory is affected by incompleteness or mapping inaccuracy. In fact, the second step of mapping (the susceptibility level-driven checking) permitted us to increase the quality of the calibration inventory and to cost-effectively correct the potential misleading results of the SUFRA_1 models. Obviously, the percentage of slope units checked (30% in this test) is not a standard but needs to be tuned case by case. At the same time, the selection of a single test sub-basin could be insufficient in the case of a more articulated geomorphological setting of the whole study area, and criteria for selecting the number and extension of such sectors need to be optimized (see [7] for a deeper inside of this issue). Indeed, different criteria for selecting the checking areas to improve the original inventory could be also explored. In our study, we precautionarily decided to maintain the same percentage of random extraction for each SUFRA_1 susceptibility class.

5. Conclusions

The research we conducted was focused on detecting a useful way to use public landslide regional inventory in statistical landslide susceptibility evaluation at a basin scale. In the Torto River basin, the original P.A.I. inventories of slide and flow movements were submitted to remote checking to produce more accurate archives that are suitable for statistical modeling. The proposed procedure seems to be robust in strengthening weak inventories, maximizing cost-effectiveness in regional landslide susceptibility studies. In fact, the proposed procedure simply requires, together with a first susceptibility model, a status slope unit check for a small percentage of the study area and systematic mapping in one or more smaller subareas. The study was focused on slide and flow landslide typologies, but the strategies of analysis can also be helpful for increasing landslide archives and related resolution of landslide susceptibility maps for any other type of landslide (such as falls, topples, and deep-seated typologies) with the aim of identifying areas to be analyzed at a larger scale through the application of empirical or analytical models for rockfalls (e.g., [57,58,59]) or to assess the magnitude and deformations rate for other slower and more complex landslides (e.g., [60,61]).

Author Contributions

Conceptualization, C.M. (Chiara Martinello), C.C. and E.R.; methodology, C.M. (Chiara Martinello), C.C. and E.R.; software, C.M. (Chiara Martinello), C.M. (Claudio Mercurio), V.B., A.C., G.M., G.A., G.D.F. and M.B.; validation, C.M. (Chiara Martinello), C.M. (Claudio Mercurio), C.C. and E.R.; formal analysis, C.M. (Chiara Martinello); software, C.M. (Chiara Martinello), C.M. (Claudio Mercurio), V.B., A.C., G.M., G.A. and G.D.F.; investigation, C.M. (Claudio Mercurio), V.B., A.C., G.M., G.A., G.D.F. and M.B.; resources, C.M. (Claudio Mercurio), V.B., A.C., G.M., G.A. and G.D.F.; data curation, C.M. (Chiara Martinello) and C.C.; writing—original draft preparation, C.M. (Chiara Martinello), C.C. and E.R.; writing—review and editing, C.M. (Chiara Martinello), C.C., M.M. and E.R.; visualization, C.M. (Chiara Martinello), C.C., M.M. and E.R.; supervision, C.M. (Chiara Martinello), C.C., M.M. and E.R; project administration, E.R.; funding acquisition, E.R. All authors have read and agreed to the published version of the manuscript.

Funding

This research received no external funding.

Institutional Review Board Statement

Not applicable.

Informed Consent Statement

Not applicable.

Data Availability Statement

The landslide inventory, digital terrain model, soil use, and geologic layers adopted for this study can be requested from any of the authors. In addition, the DTM can be visualized and downloaded using the WCS server of the SITR webgis with the following link (accessed on 15 June 2023): https://map.sitr.regione.sicilia.it/gis/services/modelli_digitali/mdt_2013/ImageServer/WCSServer. The adopted soil use map is the one available from the Corine coverage; it can be downloaded from the following link (accessed on 15 June 2023): https://land.copernicus.eu/paneuropean/corine-land-cover/clc2018?tab=download.

Acknowledgments

The authors are very grateful to Geol. Ignazio Giuffré for giving strong support for the drone surveys. The research whose results are presented and discussed here was carried out in the framework of the SUFRA (SUscetibilità da FRAna) project, funded by the Basin Authority of the Hydrographic District of Sicily (E. Rotigliano) and the PNRR project GeoSciences IR, funded by the Ministry for University and Research with Next-Generation EU funds (M4C2—Investment 3.1 Fund for construction of an integrated system of research and innovation infrastructures). At the same time, this research is also the result of a collaboration between different universities (the University of Palermo and the University of Camerino) in light of the Work Group of AIGeO (Italian Association of Physical Geography and Geomorphology) “Environmental and Applied Geomorphology”.

Conflicts of Interest

The authors declare no conflict of interest.

References

  1. Carrara, A.; Cardinali, M.; Guzzetti, F.; Reichenbach, P. Gis Technology in Mapping Landslide Hazard. In Geographical Information Systems in Assessing Natural Hazards; Springer: Dordrecht, The Netherlands, 1995; pp. 135–175. [Google Scholar] [CrossRef]
  2. Crozier, M.J.; Glade, T. A Review of Scale Dependency in Landslide Hazard and Risk Analysis; Wiley: Hoboken, NJ, USA, 2012; ISBN 9780471486633. [Google Scholar]
  3. Fell, R.; Whitt, G.; Miner, T.; Flentje, P. Guidelines for Landslide Susceptibility, Hazard and Risk Zoning for Land Use Planning. Eng. Geol. 2008, 102, 83–84. [Google Scholar] [CrossRef]
  4. Brabb, E.E. Innovative Approaches to Landslide Hazard and Risk Mapping. In Proceedings of the 4th International Symposium on Landslides, Toronto, ON, Canada, 16–21 September 1984; pp. 307–324. [Google Scholar]
  5. Steger, S.; Mair, V.; Kofler, C.; Pittore, M.; Zebisch, M.; Schneiderbauer, S. Correlation Does Not Imply Geomorphic Causation in Data-Driven Landslide Susceptibility Modelling–Benefits of Exploring Landslide Data Collection Effects. Sci. Total Environ. 2021, 776, 145935. [Google Scholar] [CrossRef] [PubMed]
  6. Martinello, C.; Cappadonia, C.; Conoscenti, C.; Rotigliano, E. Landform Classification: A High-Performing Mapping Unit Partitioning Tool for Landslide Susceptibility Assessment—A Test in the Imera River Basin (Northern Sicily, Italy). Landslides 2022, 19, 539–553. [Google Scholar] [CrossRef]
  7. Martinello, C.; Mercurio, C.; Cappadonia, C.; Hernández Martínez, M.Á.; Reyes Martínez, M.E.; Rivera Ayala, J.Y.; Conoscenti, C.; Rotigliano, E. Investigating Limits in Exploiting Assembled Landslide Inventories for Calibrating Regional Susceptibility Models: A Test in Volcanic Areas of El Salvador. Appl. Sci. 2022, 12, 6151. [Google Scholar] [CrossRef]
  8. Harp, E.L.; Keefer, D.K.; Sato, H.P.; Yagi, H. Landslide Inventories: The Essential Part of Seismic Landslide Hazard Analyses. Eng. Geol. 2011, 122, 9–21. [Google Scholar] [CrossRef]
  9. Lima, P.; Steger, S.; Glade, T. Counteracting Flawed Landslide Data in Statistically Based Landslide Susceptibility Modelling for Very Large Areas: A National-Scale Assessment for Austria. Landslides 2021, 18, 3531–3546. [Google Scholar] [CrossRef]
  10. Steger, S.; Brenning, A.; Bell, R.; Glade, T. The Influence of Systematically Incomplete Shallow Landslide Inventories on Statistical Susceptibility Models and Suggestions for Improvements. Landslides 2017, 14, 1767–1781. [Google Scholar] [CrossRef]
  11. Petschko, H.; Bell, R.; Glade, T. Effectiveness of Visually Analyzing LiDAR DTM Derivatives for Earth and Debris Slide Inventory Mapping for Statistical Susceptibility Modeling. Landslides 2016, 13, 857–872. [Google Scholar] [CrossRef]
  12. Bufalini, M.; Materazzi, M.; De Amicis, M.; Pambianchi, G. From Traditional to Modern ‘Full Coverage’ Geomorphological Mapping: A Study Case in the Chienti River Basin (Marche Region, Central Italy). J. Maps 2021, 17, 17–28. [Google Scholar] [CrossRef]
  13. Restele, L.O.; Hidayat, A.; Saleh, F.; Iradat Salihin, L.M. Landslide Hazard Assessments and Their Application in Land Management in Kendari, Southeast Sulawesi Province, Indonesia. J. Degrad. Min. Lands Manag. 2023, 10, 4349–4356. [Google Scholar] [CrossRef]
  14. Martinello, C.; Bufalini, M.; Cappadonia, C.; Rotigliano, E.; Materazzi, M. Combining Multi-Typologies Landslide Susceptibility Maps: A Case Study for the Visso Area (Central Italy). J. Maps 2023, 19, 1–10. [Google Scholar] [CrossRef]
  15. QGIS Association. QGIS.org QGIS Geographic Information System 2022. Available online: http://www.qgis.org (accessed on 20 August 2023).
  16. GRASS Development Team Geographic Resources Analysis Support System (GRASS) Software; Version 8.0; Open Source Geospatial Foundation: Chicago, IL, USA, 2022.
  17. Conrad, O.; Bechtel, B.; Bock, M.; Dietrich, H.; Fischer, E.; Gerlitz, L.; Wehberg, J.; Wichmann, V.; Böhner, J. System for Automated Geoscientific Analyses (SAGA) v. 2.1.4. Geosci. Model Dev. 2015, 8, 1991–2007. [Google Scholar] [CrossRef]
  18. RStudio Team RStudio: Integrated Development for R. 2020. RStudio: Integrated Development for R. RStudio, PBC, Boston, MA. Available online: http://www.rstudio.com/ (accessed on 20 August 2023).
  19. Cappadonia, C.; Confuorto, P.; Sepe, C.; Di Martire, D. Preliminary Results of a Geomorphological and DInSAR Characterization of a Recently Identified Deep-Seated Gravitational Slope Deformation in Sicily (Southern Italy). Rend. Online Soc. Geol. Ital. 2019, 49, 149–156. [Google Scholar] [CrossRef]
  20. Catalano, R.; Avellone, G.; Basilone, L.; Contino, A.; Agate, M. Note Illustrative Della Carta Geologica d’Italia Alla Scala 1: 50.000 Del Foglio 609 “Termini Imerese”, Con Allegata Carta Geologica in Scala 1: 50.000. 2011. Available online: https://www.isprambiente.gov.it/Media/carg/note_illustrative/596_609_CapoPlaia_Termini.pdf (accessed on 20 August 2023).
  21. Faccenna, C.; Piromallo, C.; Crespo-Blanc, A.; Jolivet, L.; Rossetti, F. Lateral Slab Deformation and the Origin of the Western Mediterranean Arcs. Tectonics 2004, 23, 1–21. [Google Scholar] [CrossRef]
  22. Parrino, N.; Pepe, F.; Burrato, P.; Dardanelli, G.; Corradino, M.; Pipitone, C.; Morticelli, M.G.; Sulli, A.; Di Maggio, C. Elusive Active Faults in a Low Strain Rate Region (Sicily, Italy): Hints from a Multidisciplinary Land-to-Sea Approach. Tectonophysics 2022, 839, 229520. [Google Scholar] [CrossRef]
  23. Sulli, A.; Gasparo Morticelli, M.; Agate, M.; Zizzo, E. Active North-Vergent Thrusting in the Northern Sicily Continental Margin in the Frame of the Quaternary Evolution of the Sicilian Collisional System. Tectonophysics 2021, 802, 228717. [Google Scholar] [CrossRef]
  24. Parrino, N.; Burrato, P.; Sulli, A.; Gasparo Morticelli, M.; Agate, M.; Srivastava, E.; Malik, J.N.; Di Maggio, C. Plio-Quaternary Coastal Landscape Evolution of North-Western Sicily (Italy). J. Maps 2023, 19, 2158889. [Google Scholar] [CrossRef]
  25. Agnesi, V.; De Cristofaro, D.; Di Maggio, C.; Macaluso, T.; Madonia, G.; Messana, V. Morphotectonic Setting of the Madonie Area (Central Northern Sicily). Mem. Soc. Geol. Ital. 2000, 55, 373–379. [Google Scholar]
  26. Hungr, O.; Leroueil, S.; Picarelli, L. The Varnes Classification of Landslide Types, an Update. Landslides 2014, 11, 167–194. [Google Scholar] [CrossRef]
  27. Martinello, C.; Cappadonia, C.; Rotigliano, E. Investigating the Effects of Cell Size in Statistical Landslide Susceptibility Modelling for Different Landslide Typologies: A Test in Central–Northern Sicily. Appl. Sci. 2023, 13, 1145. [Google Scholar] [CrossRef]
  28. Mokhtari, M.; Abedian, S. Spatial Prediction of Landslide Susceptibility in Taleghan Basin, Iran. Stoch. Environ. Res. Risk Assess. 2019, 33, 1297–1325. [Google Scholar] [CrossRef]
  29. Nicu, I.C.; Asăndulesei, A. GIS-Based Evaluation of Diagnostic Areas in Landslide Susceptibility Analysis of Bahluieț River Basin (Moldavian Plateau, NE Romania). Are Neolithic Sites in Danger? Geomorphology 2018, 314, 27–41. [Google Scholar] [CrossRef]
  30. Sameen, M.I.; Pradhan, B.; Bui, D.T.; Alamri, A.M. Systematic Sample Subdividing Strategy for Training Landslide Susceptibility Models. Catena 2020, 187, 104358. [Google Scholar] [CrossRef]
  31. Erener, A.; Düzgün, H.S.B. Landslide Susceptibility Assessment: What Are the Effects of Mapping Unit and Mapping Method? Environ. Earth Sci. 2012, 66, 859–877. [Google Scholar] [CrossRef]
  32. Chung, C.-C.; Li, Z.-Y. Rapid Landslide Risk Zoning toward Multi-Slope Units of the Neikuihui Tribe for Preliminary Disaster Management. Nat. Hazards Earth Syst. Sci. 2022, 22, 1777–1794. [Google Scholar] [CrossRef]
  33. Ehlschlaeger, C. Using the AT Search Algorithm to Develop Hydrologic Models from Digital Elevation Data. In Proceedings of the International Geographic Information System (IGIS) Symposium, Baltimore, MD, USA; 1989; pp. 275–281. [Google Scholar]
  34. Metz, M.; Mitasova, H.; Harmon, R.S. Efficient Extraction of Drainage Networks from Massive, Radar-Based Elevation Models with Least Cost Path Search. Hydrol. Earth Syst. Sci. 2011, 15, 667–678. [Google Scholar] [CrossRef]
  35. Mercurio, C.; Martinello, C.; Rotigliano, E.; Argueta-Platero, A.A.; Reyes-Martínez, M.E.; Rivera-Ayala, J.Y.; Conoscenti, C. Mapping Susceptibility to Debris Flows Triggered by Tropical Storms: A Case Study of the San Vicente Volcano Area (El Salvador, CA). Earth 2021, 2, 66–85. [Google Scholar] [CrossRef]
  36. Naimi, B. Package “Usdm”. Uncertainty Analysis for Species Distribution Models. R-Cran 2017, 18, 1–19. [Google Scholar]
  37. Guisan, A.; Weiss, S.B.; Weiss, A.D. GLM versus CCA Spatial Modeling of Plant Species Distribution. Plant Ecol. 1999, 143, 107–122. [Google Scholar] [CrossRef]
  38. Burrough, P.A.; McDonnell, R.A. Principle of Geographic Information Systems; Oxford University Press Inc.: New York, NY, USA, 1998; ISBN 0-19-823366-3. [Google Scholar]
  39. Wilson, J.P.; Gallant, J.C. Primary Topographic Attributes. In Terrain Analysis: Principles and Applications; Wilson, J.P., Gallant, J.C., Eds.; John Wiley & Sons: Hoboken, NJ, USA, 2000. [Google Scholar]
  40. Auslander, M.; Nevo, E.; Inbar, M. The Effects of Slope Orientation on Plant Growth, Developmental Instability and Susceptibility to Herbivores. J. Arid Environ. 2003, 55, 405–416. [Google Scholar] [CrossRef]
  41. Zevenbergen, L.W.; Thorne, C.R. Quantitative Analysis of Land Surface Topography. Earth Surf. Process Landf. 1987, 12, 47–56. [Google Scholar] [CrossRef]
  42. Ohlmacher, G.C. Plan Curvature and Landslide Probability in Regions Dominated by Earth Flows and Earth Slides. Eng. Geol. 2007, 91, 117–134. [Google Scholar] [CrossRef]
  43. Beven, K.J.; Kirkby, M.J. A Physically Based, Variable Contributing Area Model of Basin Hydrology. Hydrol. Sci. Bull. 1979, 24, 43–69. [Google Scholar] [CrossRef]
  44. Florinsky, I.V. Digital Terrain Analysis in Soil Science and Geology; Academic Press: Cambridge, MA, USA, 2012. [Google Scholar]
  45. Friedman, J.H. Multivariate Adaptive Regression Splines. Ann. Stat. 1991, 19, 1–67. [Google Scholar] [CrossRef]
  46. Mercurio, C.; Calderón-Cucunuba, L.P.; Argueta-Platero, A.A.; Azzara, G.; Cappadonia, C.; Martinello, C.; Rotigliano, E.; Conoscenti, C. Predicting Earthquake-Induced Landslides by Using a Stochastic Modeling Approach: A Case Study of the 2001 El Salvador Coseismic Landslides. ISPRS Int. J. Geoinf. 2023, 12, 178. [Google Scholar] [CrossRef]
  47. Felicísimo, Á.M.; Cuartero, A.; Remondo, J.; Quirós, E. Mapping Landslide Susceptibility with Logistic Regression, Multiple Adaptive Regression Splines, Classification and Regression Trees, and Maximum Entropy Methods: A Comparative Study. Landslides 2013, 10, 175–189. [Google Scholar] [CrossRef]
  48. Mohammed, S.; Jouhra, A.; Enaruvbe, G.O.; Bashir, B.; Barakat, M.; Alsilibe, F.; Cimusa Kulimushi, L.; Alsalman, A.; Szabó, S. Performance Evaluation of Machine Learning Algorithms to Assess Soil Erosion in Mediterranean Farmland: A Case-Study in Syria. Land Degrad Dev. 2023, 34, 2896–2911. [Google Scholar] [CrossRef]
  49. Tian, M.; Li, L.; Xiong, Z. A Data-Driven Method for Predicting Debris-Flow Runout Zones by Integrating Multivariate Adaptive Regression Splines and Akaike Information Criterion. Bull. Eng. Geol. Environ. 2022, 81, 222. [Google Scholar] [CrossRef]
  50. Milborrow, S. Notes on the Earth Package. Retrieved Oct. 2014, 31, 2017. [Google Scholar]
  51. Chung, C.J.F.; Fabbri, A.G. Validation of Spatial Prediction Models for Landslide Hazard Mapping. Nat. Hazards 2003, 30, 451–472. [Google Scholar] [CrossRef]
  52. Fawcett, T. An Introduction to ROC Analysis. Pattern Recognit. Lett. 2006, 27, 861–874. [Google Scholar] [CrossRef]
  53. Goodenough, D.J.; Rossmann, K.; Lusted, L.B. Radiographic Applications of Receiver Operating Characteristic (ROC) Curves. Radiology 1974, 110, 89–95. [Google Scholar] [CrossRef]
  54. Lasko, T.A.; Bhagwat, J.G.; Zou, K.H.; Ohno-Machado, L. The Use of Receiver Operating Characteristic Curves in Biomedical Informatics. J. Biomed. Inform. 2005, 38, 404–415. [Google Scholar] [CrossRef] [PubMed]
  55. Hosmer, D.W. Lemeshow, Stanley. In Applied Logistic Regression; John Wiley & Sons, Inc.: Hoboken, NJ, USA, 2000; ISBN 0471722146. [Google Scholar]
  56. Youden, W.J. Index for Rating Diagnostic Tests. Cancer 1950, 3, 32–35. [Google Scholar] [CrossRef] [PubMed]
  57. Cappadonia, C.; Cafiso, F.; Ferraro, R.; Martinello, C.; Rotigliano, E. Analysis of the Rockfall Phenomena Contributing to the Evolution of a Pocket Beach Area Using Traditional and Remotely Acquired Data (Lo Zingaro Nature Reserve, Southern Italy). Remote Sens. 2023, 15, 1401. [Google Scholar] [CrossRef]
  58. Jia, Y.; Song, G.; Wang, L.; Jiang, T.; Zhao, J.; Li, Z. Research on Stability Evaluation of Perilous Rock on Soil Slope Based on Natural Vibration Frequency. Appl. Sci. 2023, 13, 2406. [Google Scholar] [CrossRef]
  59. Cappadonia, C.; Cafiso, F.; Ferraro, R.; Martinello, C.; Rotigliano, E. Rockfall Hazards of Mount Pellegrino Area (Sicily, Southern Italy). J. Maps 2021, 17, 29–39. [Google Scholar] [CrossRef]
  60. Delchiaro, M.; Della Seta, M.; Martino, S.; Nozaem, R.; Moumeni, M. Tectonic Deformation and Landscape Evolution Inducing Mass Rock Creep Driven Landslides: The Loumar Case-Study (Zagros Fold and Thrust Belt, Iran). Tectonophysics 2023, 846, 229655. [Google Scholar] [CrossRef]
  61. Rouhi, J.; Delchiaro, M.; Della Seta, M.; Martino, S. New Insights on the Emplacement Kinematics of the Seymareh Landslide (Zagros Mts., Iran) Through a Novel Spatial Statistical Approach. Front. Earth Sci. (Lausanne) 2022, 10, 869391. [Google Scholar] [CrossRef]
Figure 1. (a) Location of the Torto River basin. (b) Bedrock lithology map of the study area. (1) Anthropic deposits; (2) alluvial deposits; (3) alluvial fan and talus deposit; (4) colluvium and old landslide deposits; (5) evaporitic rocks; (6) sandstones; (7) Flysch Numidico pelites; (8) Flysch Numidico sandstones/conglomerates; (9) “Terravecchia” pelites; (10) “Terravecchia” sandstones/conglomerates; (11) “Varicolori” clays; (12) calcareous and clayey marls; (13) lithoid units.
Applsci 13 09449 g001
Figure 2. (a) Top image: landslides as mapped in the original P.A.I. inventory (yellow polygons are complex landslides, purple polygons are flows, red polygons are slides, and green polygons are diffused erosional areas); bottom image: mapping of single phenomena (red polygons). (b) Example of P.A.I.-driven mapping: original P.A.I. landslide inventory (polygons) and checked P.A.I. landslide inventory (LIPs).
Applsci 13 09449 g002
Figure 3. (a) Rotational slide/flow landslide affecting the slope of the A19 motorway; (b) multiple rotational slide/flow landslides affecting the slope of the SS120 national road.
Applsci 13 09449 g003
Figure 4. Synthetic scheme of the adopted model-building procedures.
Applsci 13 09449 g004
Figure 5. ROC plots of the two SUFRA_1 models validated in the whole Torto River basin (a,b) and in the Sciara sub-basin (c,d). AUC mean values were computed through one-hundred replicates given by extraction of different random negatives.
Applsci 13 09449 g005
Figure 6. ROC plot of the two SUFRA_2 models validated in the whole Torto River basin (a,b) and in the Sciara sub-basin (c,d). AUC mean values were computed through one-hundred replicates given by extraction of different random negatives.
Applsci 13 09449 g006
Table 1. Details of the employed geo-environmental variables (modified from [7,27]).
AcronymDescription of PredictorReferencesPotential Proxy Significance
ELEDistribution of elevation Mean annual rainfall
LCLMorphological classification of the territory based on the variation in elevation with respect to the neighbouring areas[37]Morphological setting
SLOThe first derivative of elevation[38]Speed of the water and potential underlying rupture surfaces [6,27]
NCosine of aspect (direction in which the slope degrades more rapidly)[39] Seasonal wet/dry cycles of soils [40]
ESine of aspect (direction in which the slope degrades more rapidly)[39]Seasonal wet/dry cycles of soils [40]
PLNThe second derivative of elevation, computed along the horizontal plane[41]Activation and propagation of landslides [42]
PRFThe second derivative of elevation, computed along the direction of the highest slope gradient[41]The direction of flow [42]
TWICalculated as ln[A/tanβ], where A and β, computed on each cell, corresponds to the area of upslope drained cells and the slope gradient, respectively[43]Potential infiltration or saturated soil thickness [6,27]
SPINatural logarithm of the catchment area multiplied by the tangent of the slope gradient[44]Proxy of the intensity of surface water erosion [6]
LITOOriginal geological map Physical–mechanical properties of rocks [27]
USECORINE land cover (2018) Potential hydrological and surface hydric erosion induced disturbances [27]
Table 2. Confusion matrix of the SUFRA_1 models in the Torto basin and in the Sciara sub-basin.
Positive CasesNegative CasesTNFNFPTPAcc.Sens.Spec.
Torto
Area
SUFRA_1 Slide459686660302450.7010.69
SUFRA_1 Flow789356271308770.690.980.67
Sciara
Area
SUFRA_1 Slide9907032060.770.670.78
SUFRA_1 Flow7927232040.770.570.78
Table 3. Confusion matrix of the SUFRA_2 models in the Torto basin and in the Sciara sub-basin.
Positive CasesNegative CasesTNFNFPTPAcc.Sens.Spec.
Torto
Area
SUFRA_2 Slide859286820246850.7610.73
SUFRA_2 Flow12289164362481160.750.950.72
Sciara
Area
SUFRA_2 Slide9906702590.7710.74
SUFRA_2 Flow7927401870.8210.80
Disclaimer/Publisher’s Note: The statements, opinions and data contained in all publications are solely those of the individual author(s) and contributor(s) and not of MDPI and/or the editor(s). MDPI and/or the editor(s) disclaim responsibility for any injury to people or property resulting from any ideas, methods, instructions or products referred to in the content.

