
Experimental Study on Axial Stress and Hammer Impacting Energy of Offshore Standard Penetration Test


Abstract
:1. Introduction
2. Offshore SPT
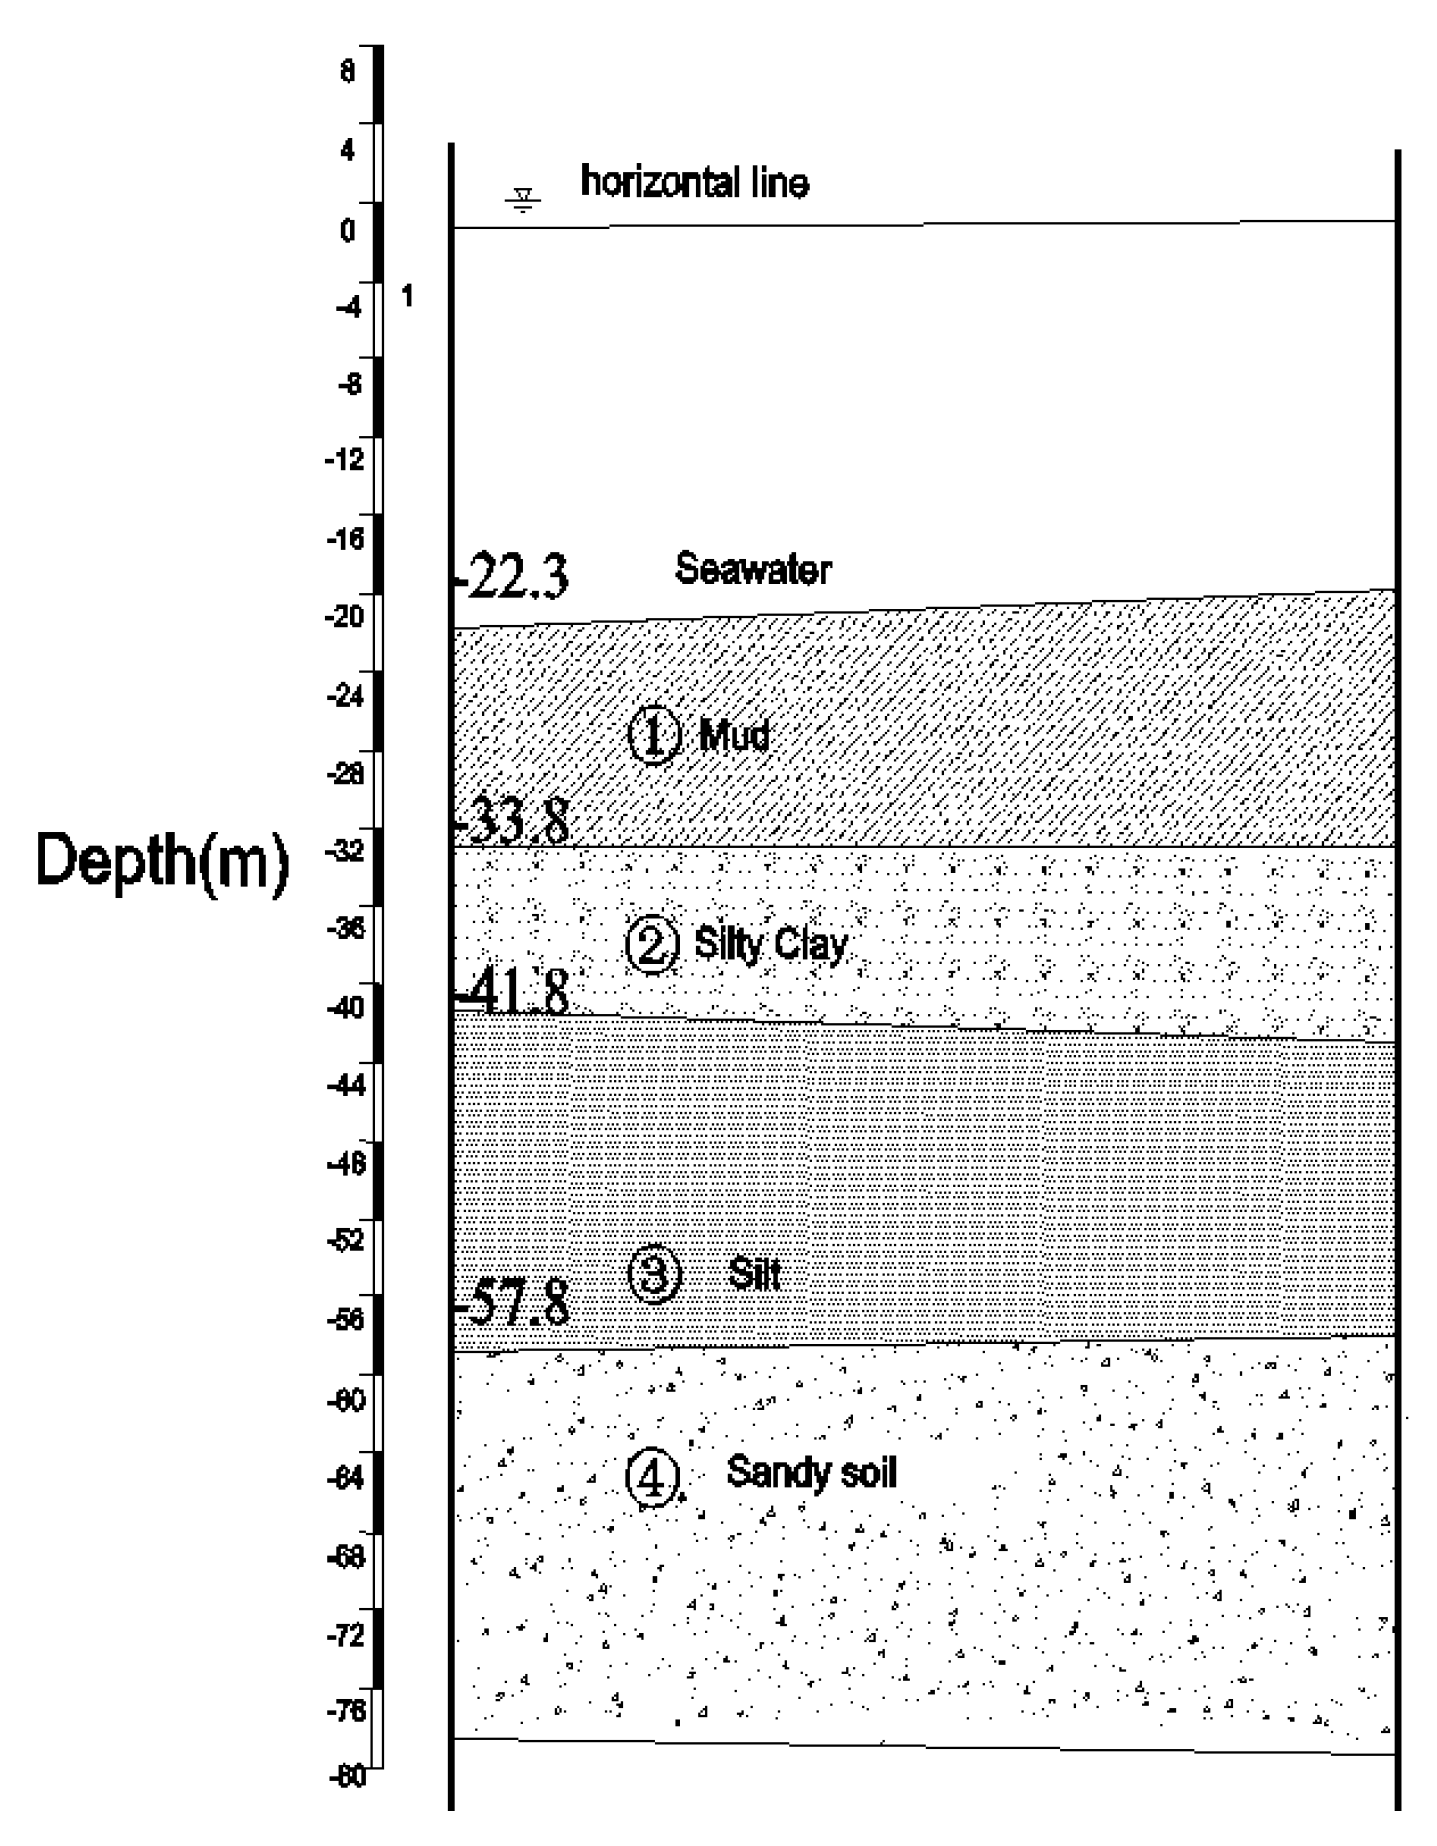
2.1. Test Site
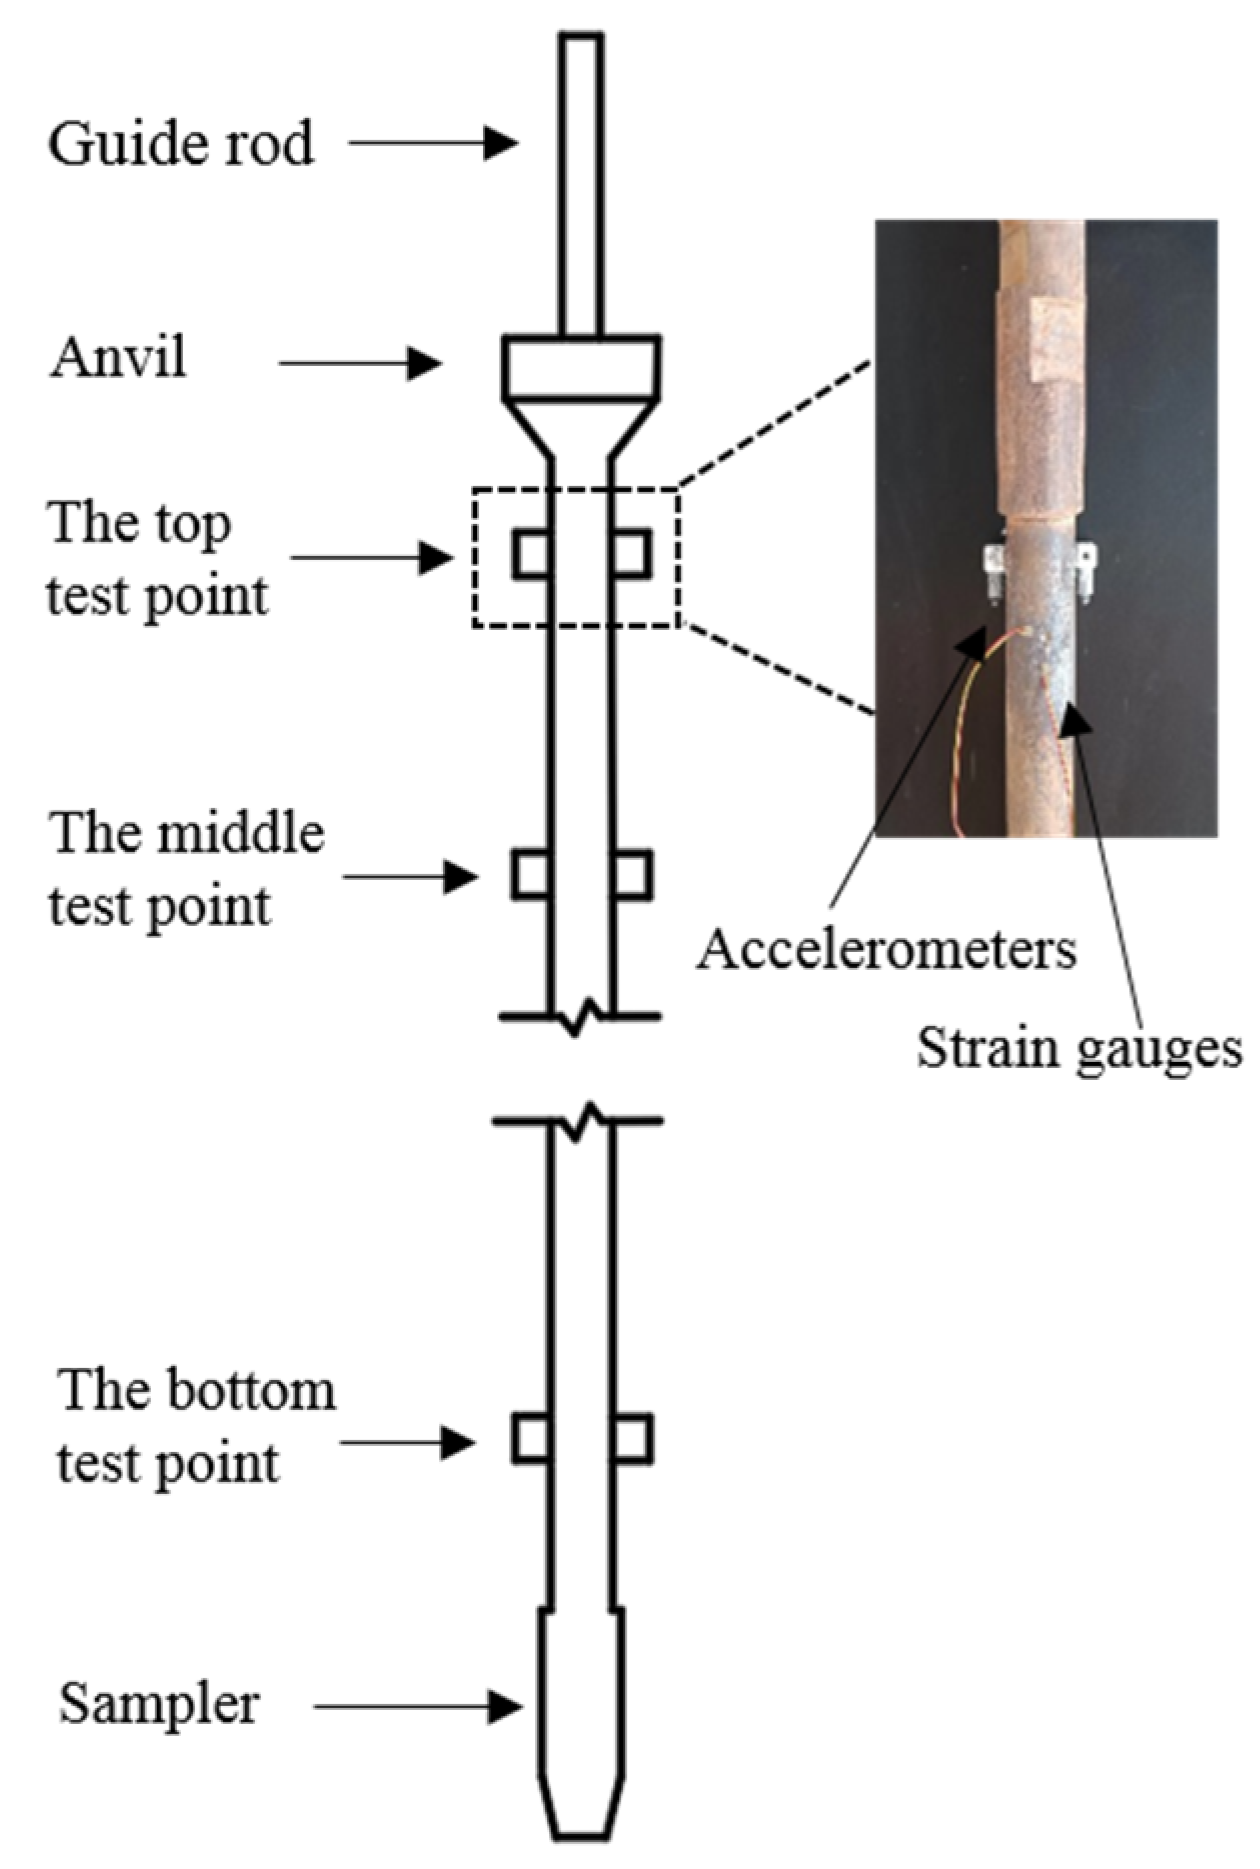
2.2. Test Scheme
3. Results
3.1. Stress Wave Propagation Velocity Analysis
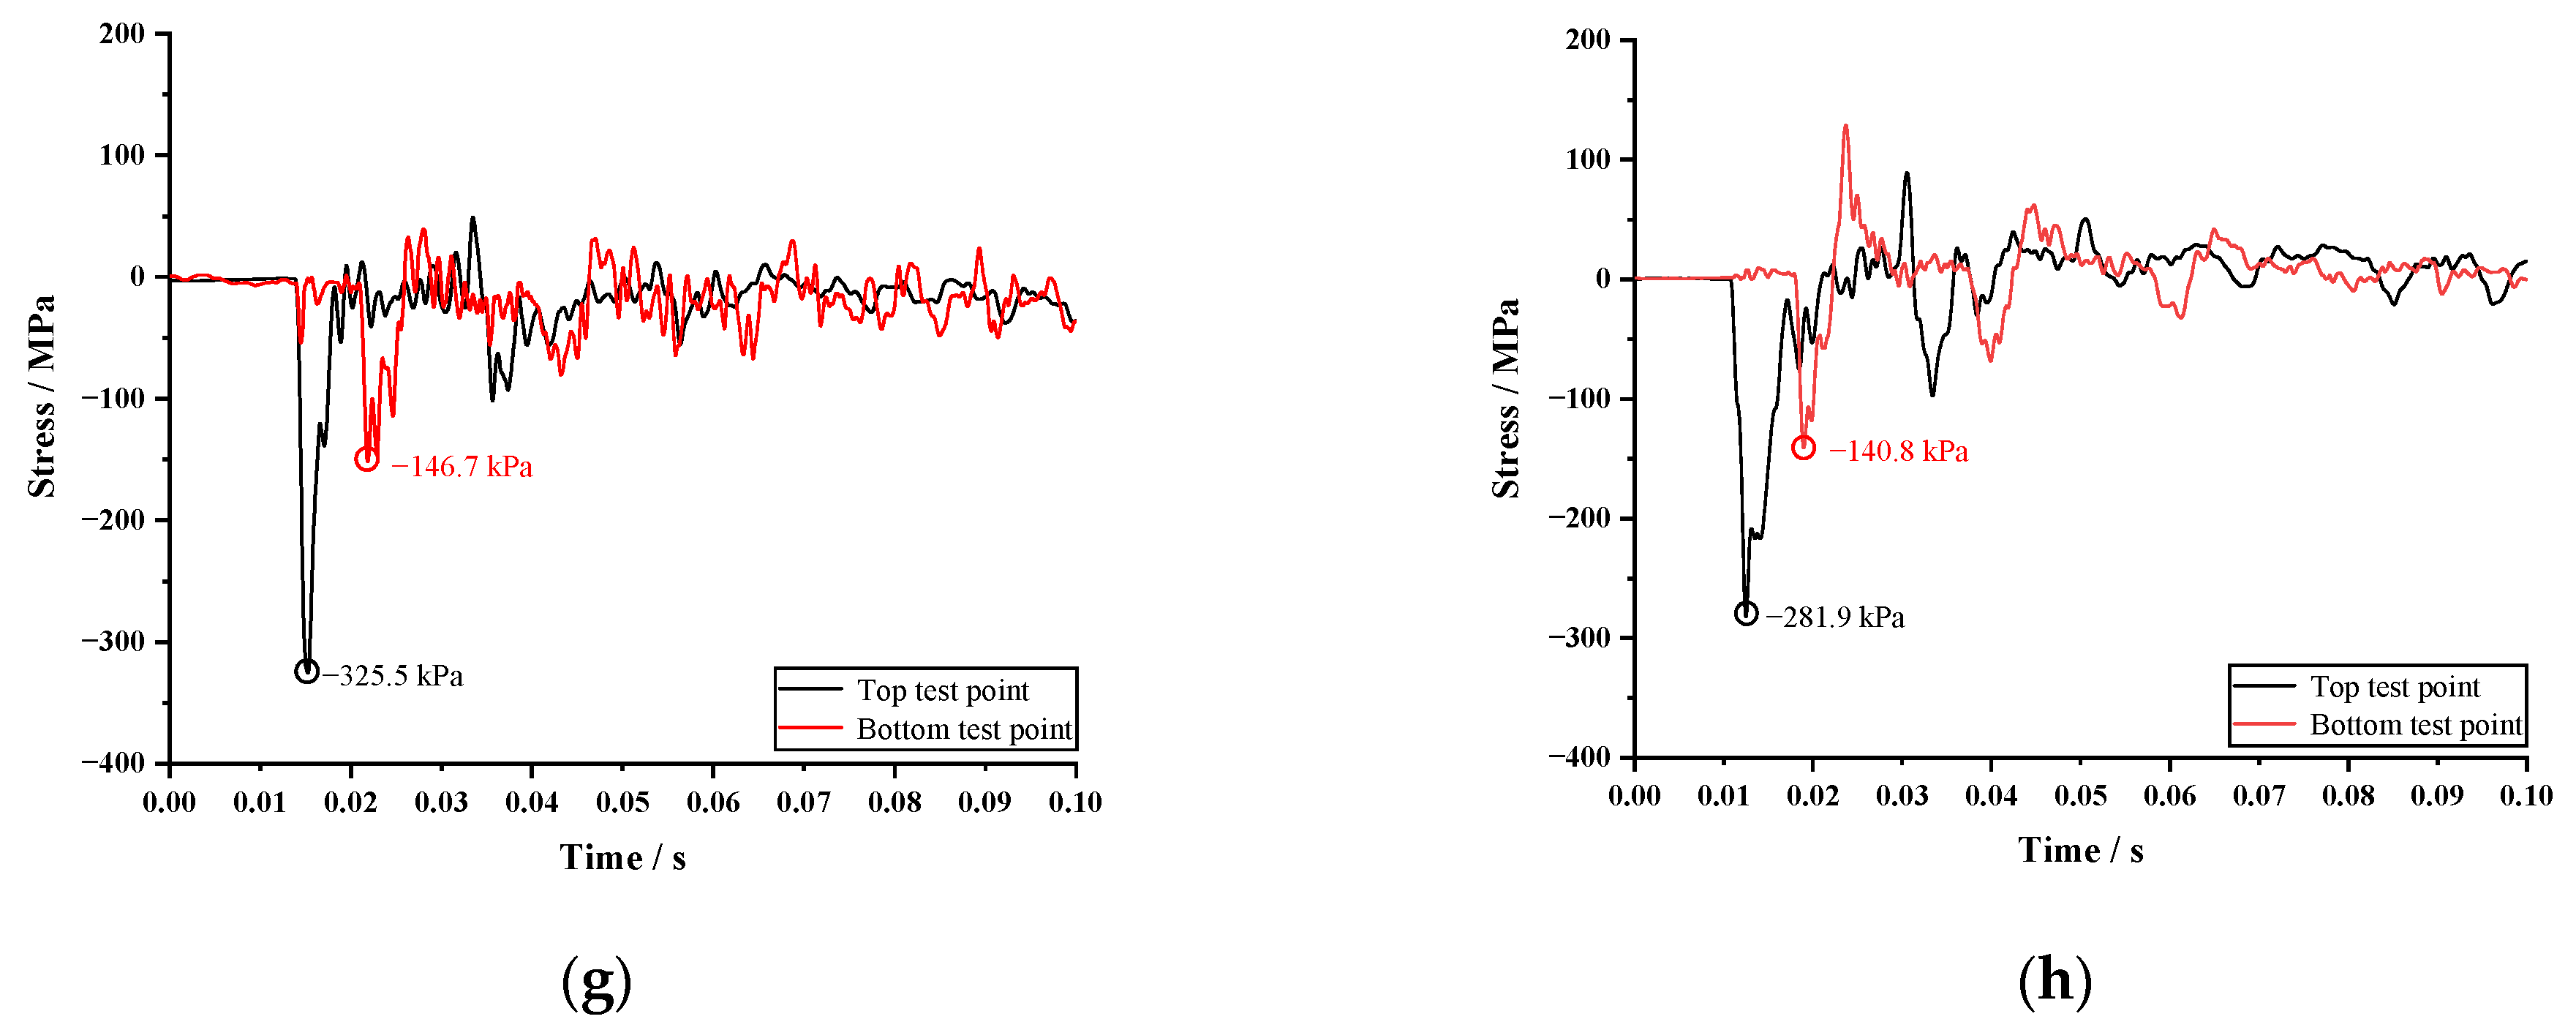
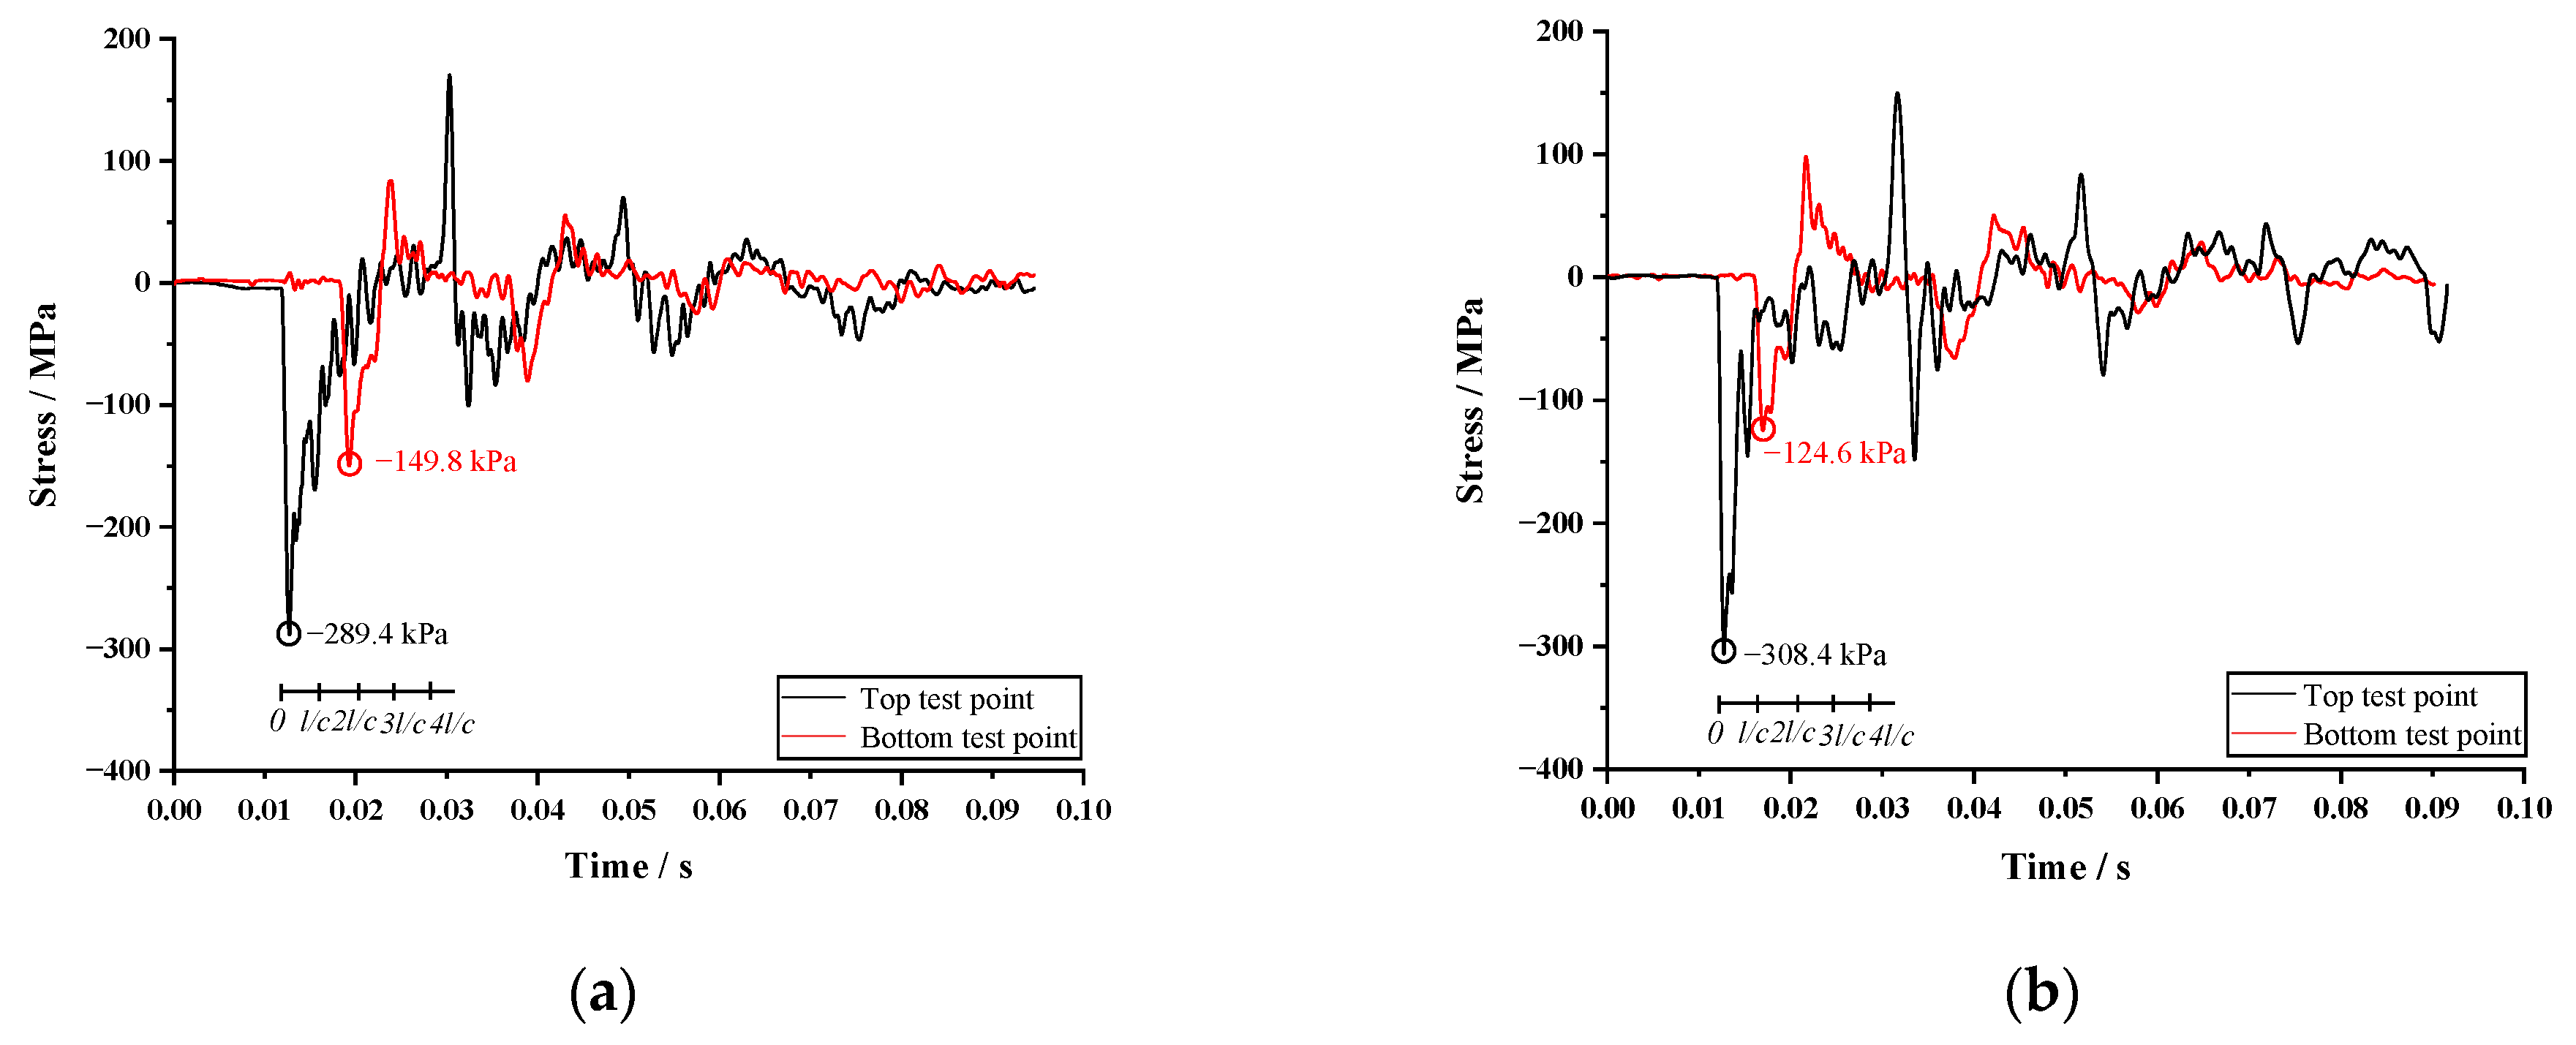
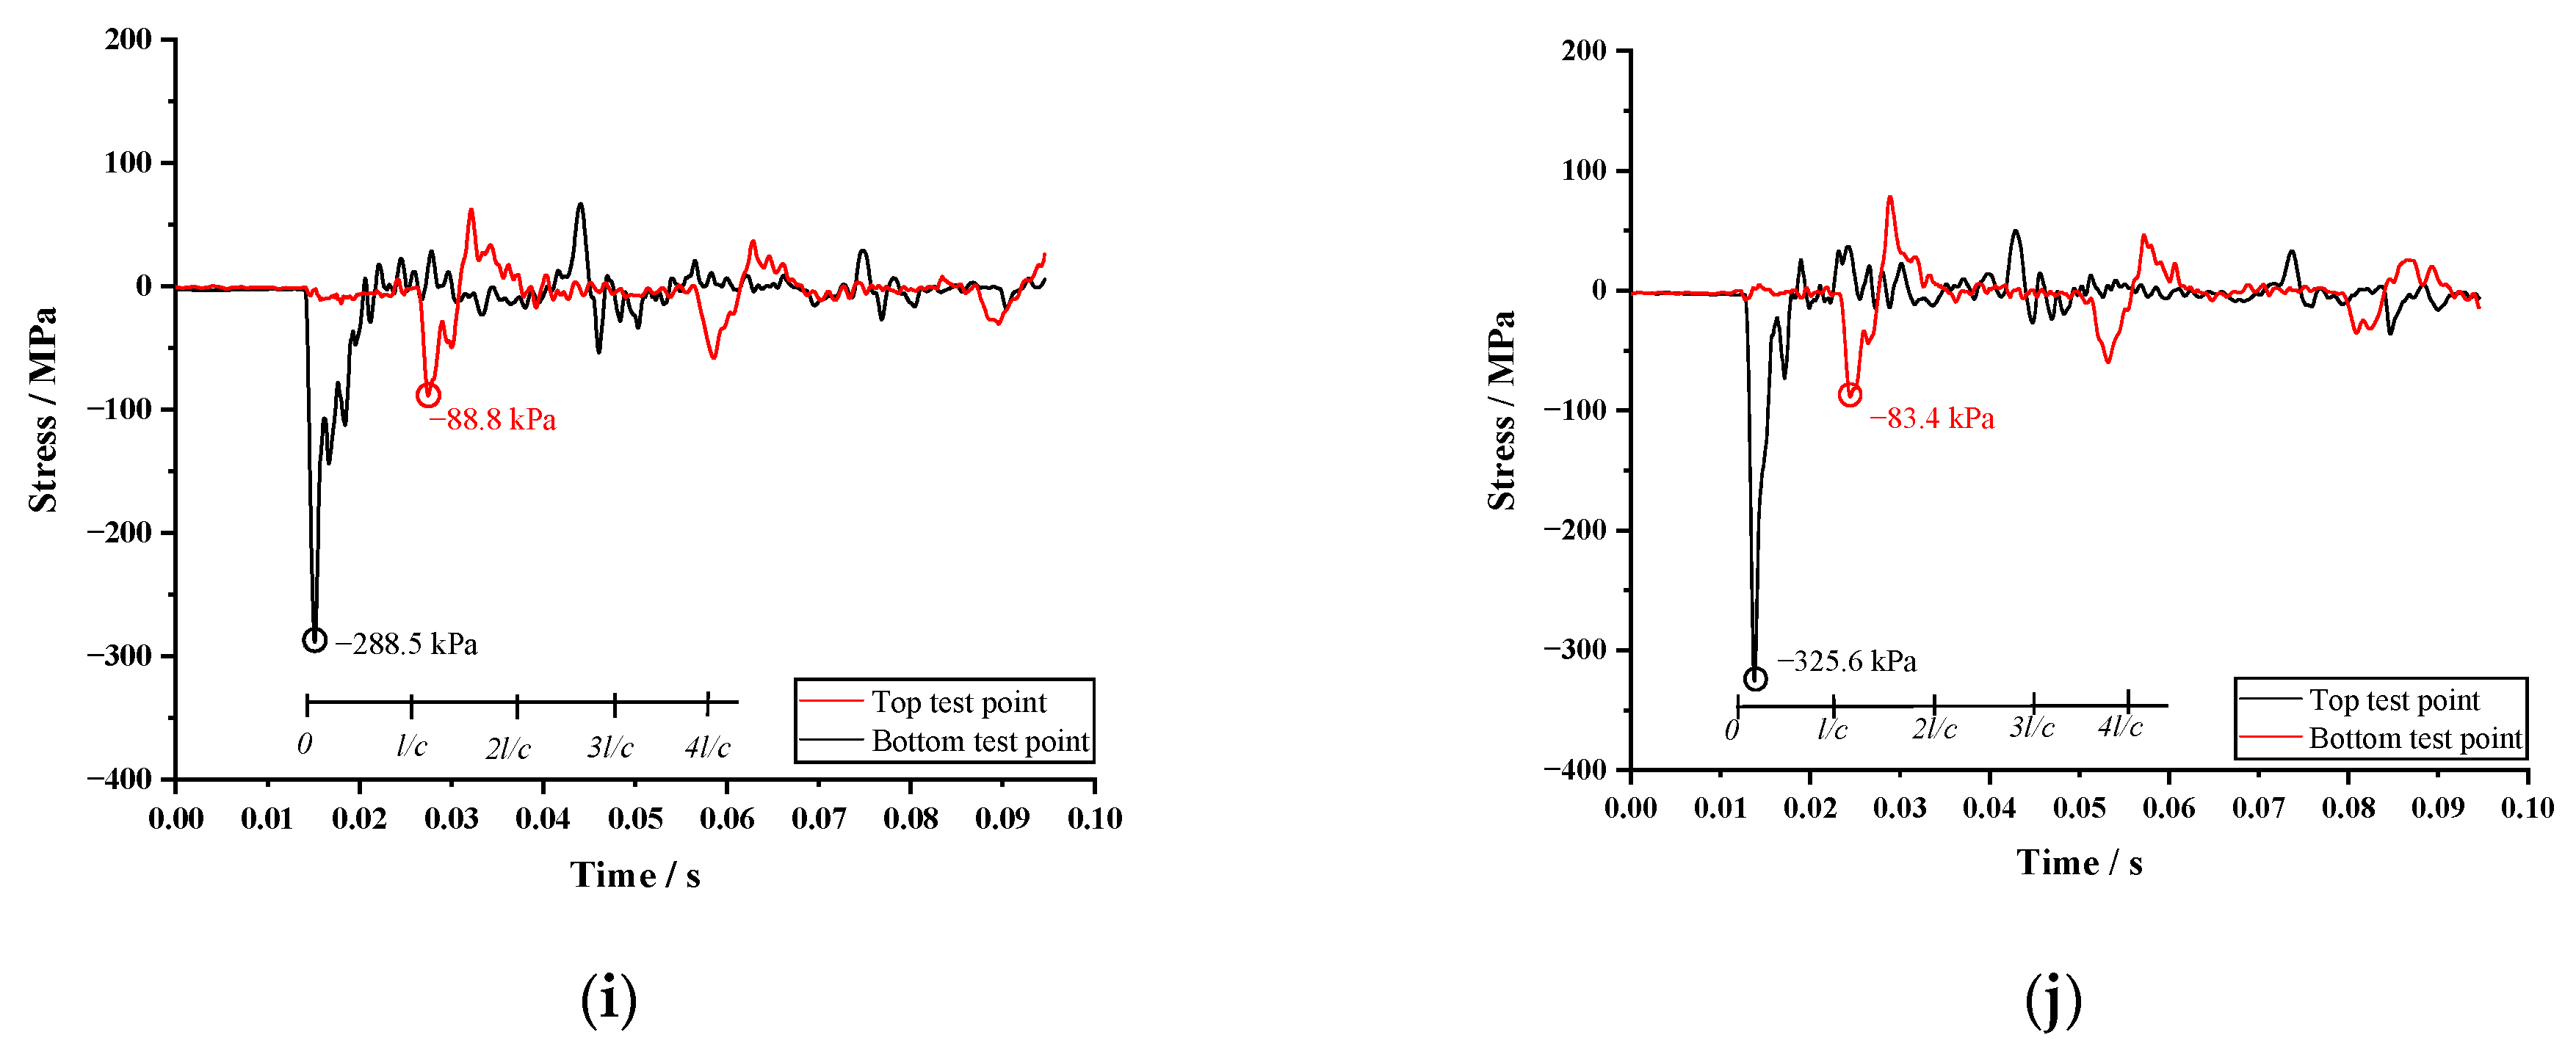
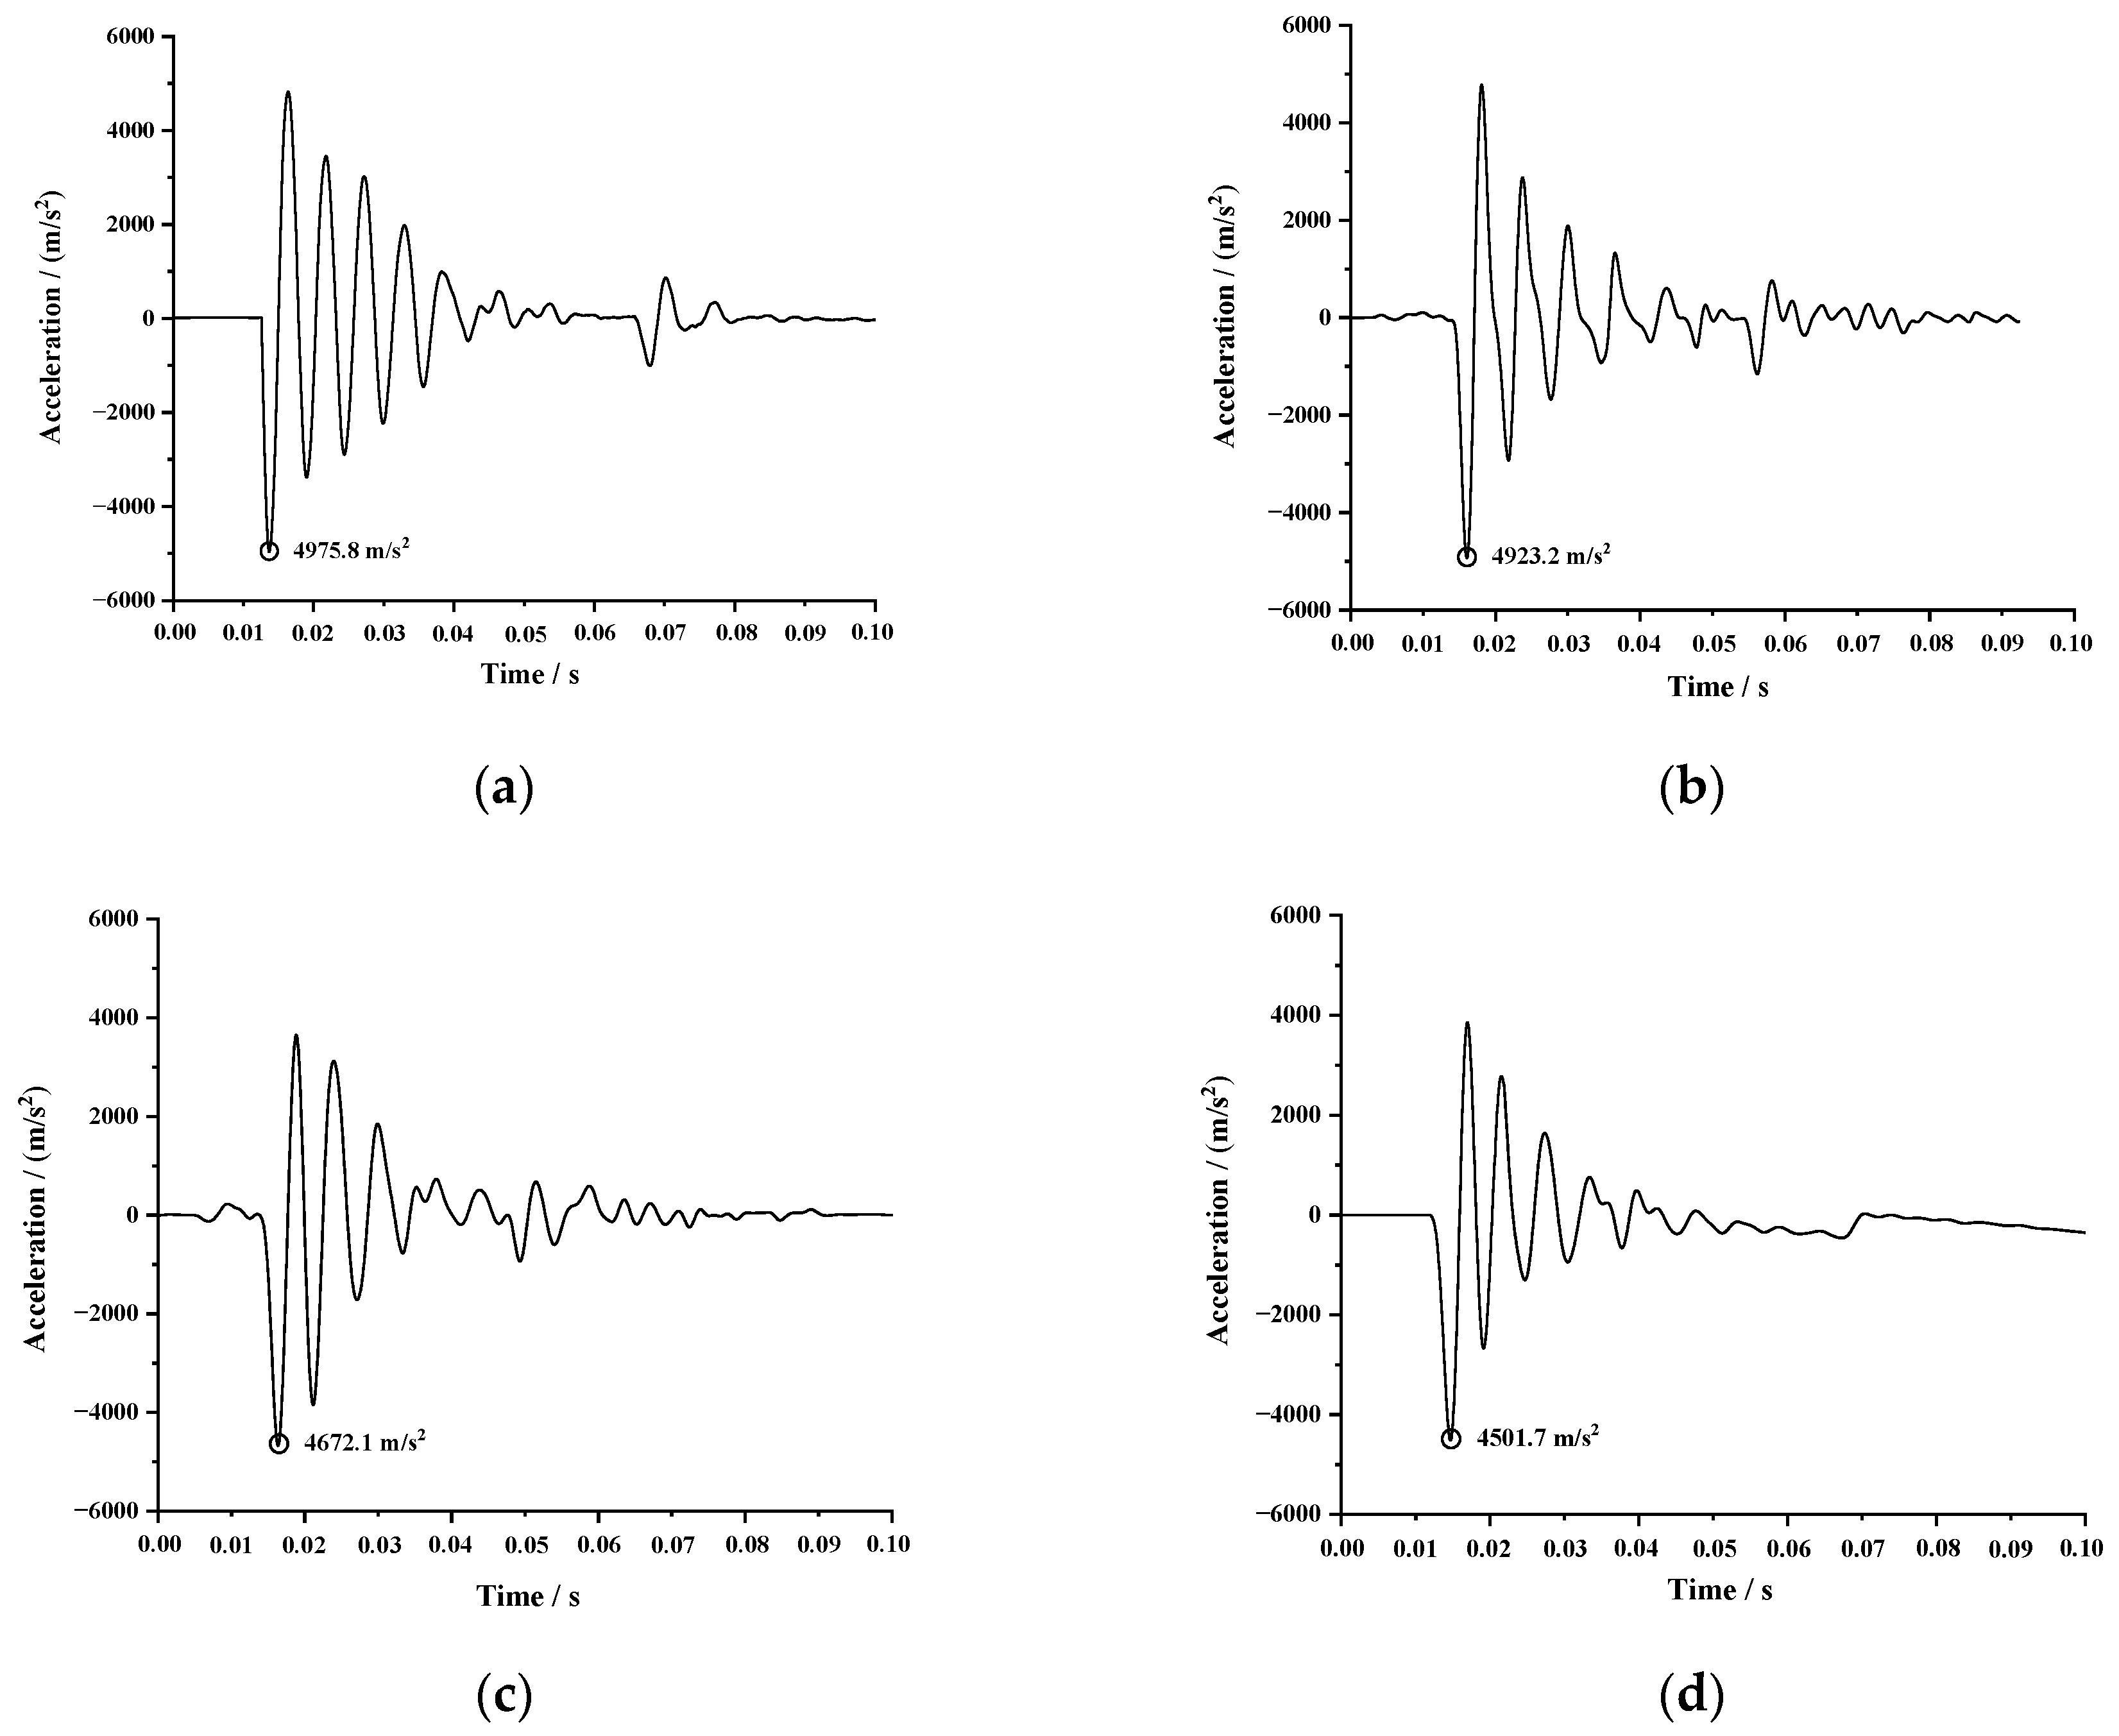
3.2. Probe Rod Axial Stress and Acceleration Analysis
4. Hammer Impacting Energy Transfer Efficiency of Offshore SPT
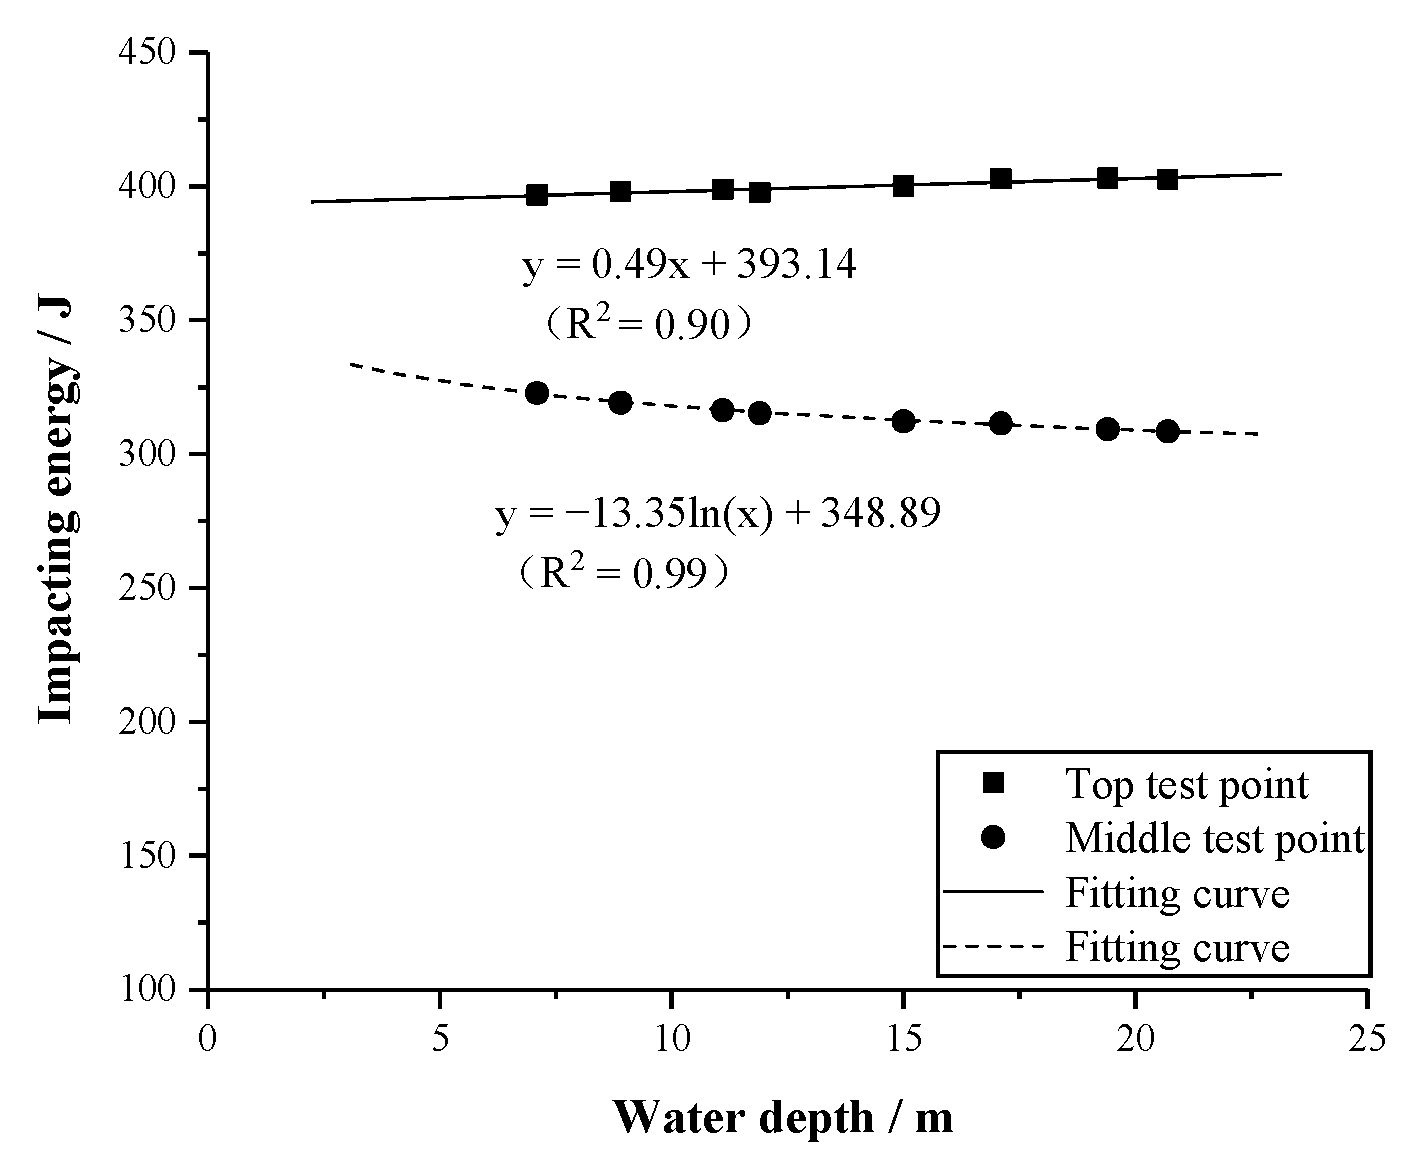
4.1. The Effect of Water Depth on the Hammer Impacting Energy Distribution of the Probe Rod
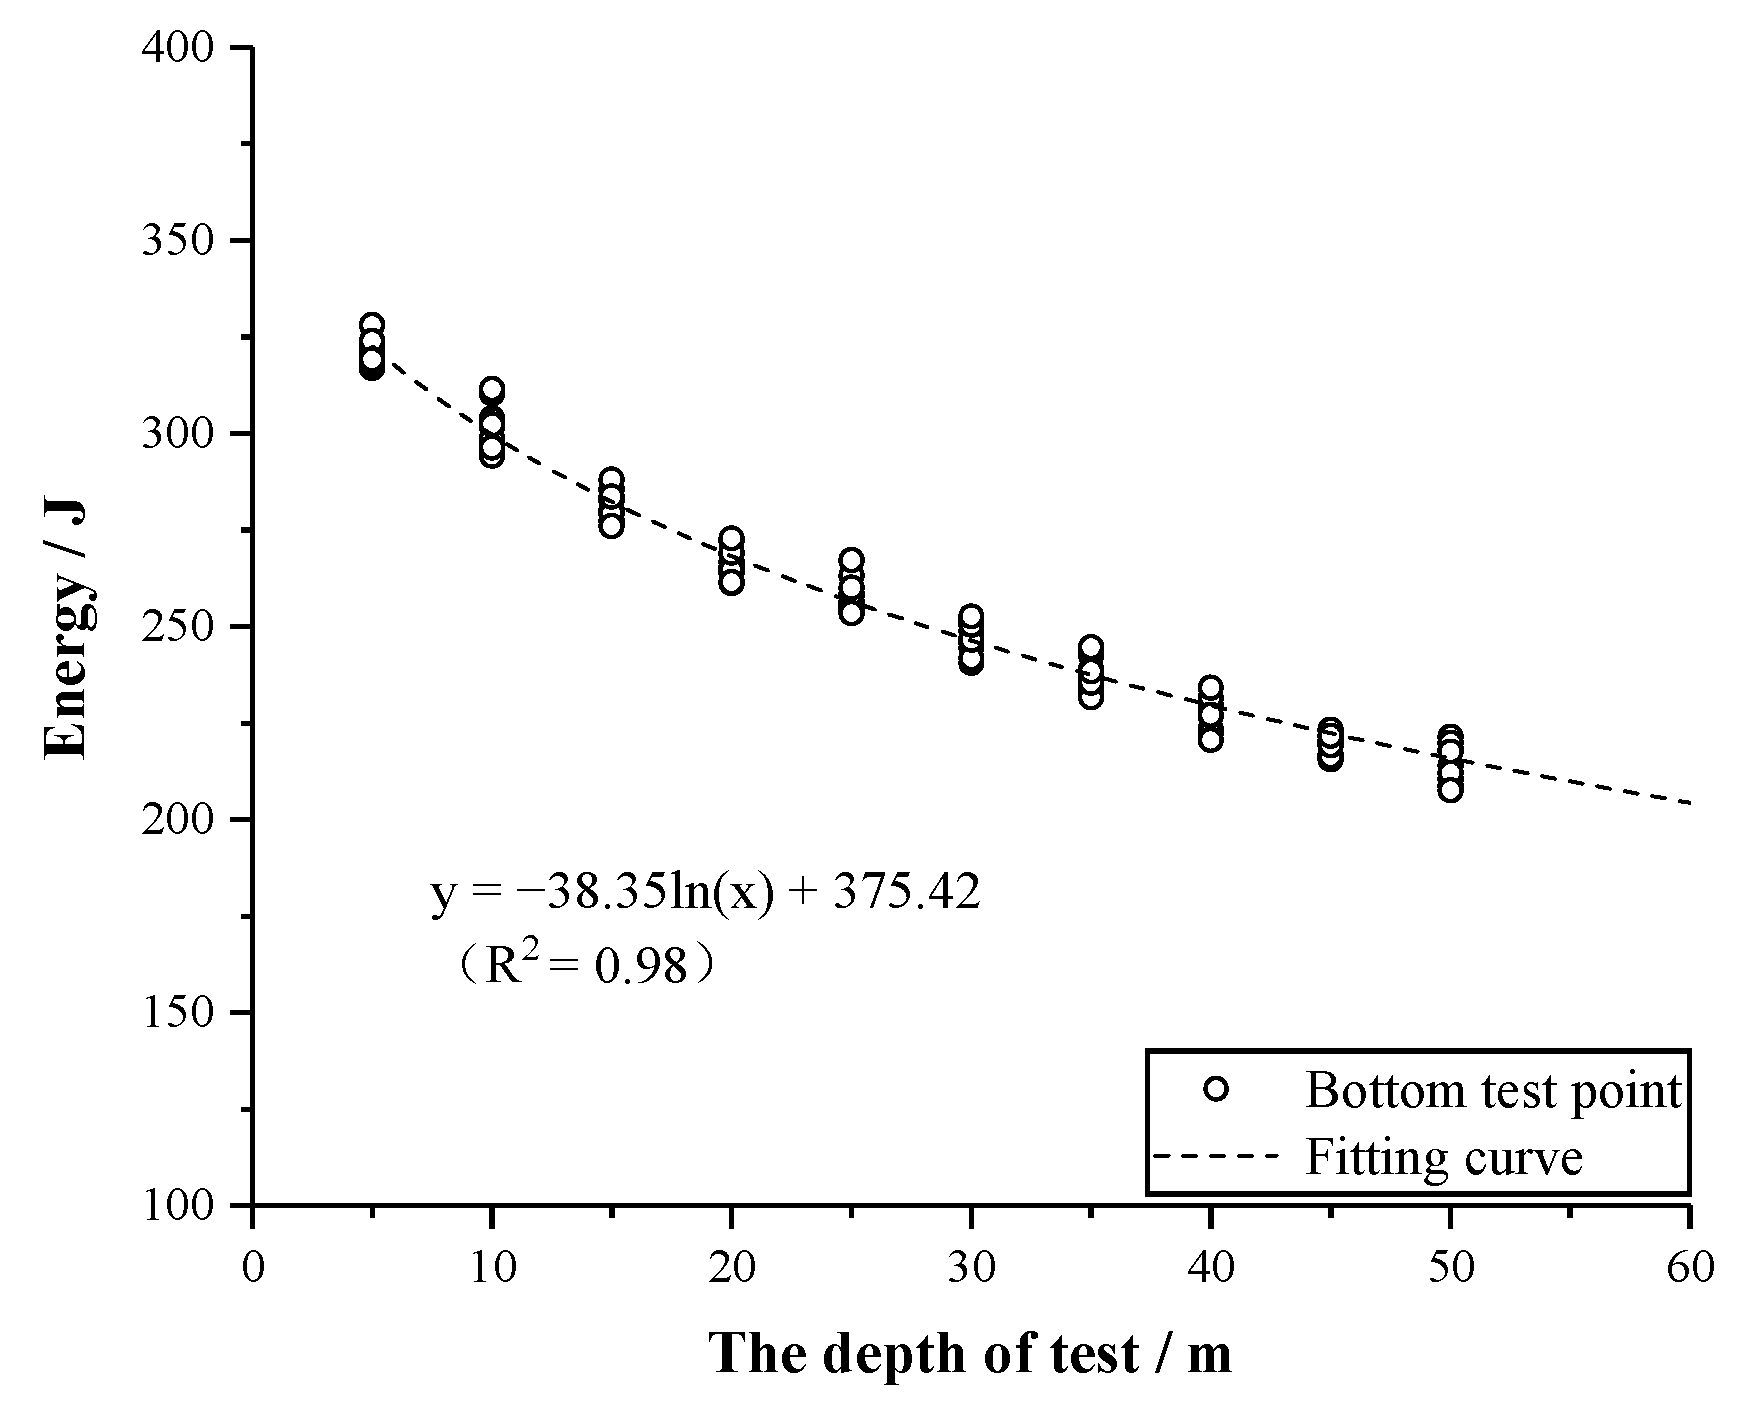
4.2. Effect of Survey Depth on the Hammer Impacting Energy Distribution of the Probe Rod
4.3. Rod Length Correction of Offshore SPT
5. Conclusions
- (1)
- The variation curves of acceleration and axial stress of the probe rod during the hammering process were measured by the offshore SPT. The difference between the measured wave speed and the theoretical wave speed in the test is 4.7–8.8%, which is consistent with the one-dimensional wave theory. The test results show that, as the length of the probe rod grows, the peak acceleration decreases significantly, the peak stress at the top of the rod is basically unchanged, and the peak stress at the bottom of the rod decreases significantly.
- (2)
- The hammer impacting energy at the test points at both ends of the probe rod was obtained using the F-V method based on the one-dimensional wave theory. By analyzing the effective hammer impacting energy distribution of the probe rod under different water depth and survey depth conditions, the relationship between hammer impacting energy and rod length at the top of the rod, water–soil contact surface, and the bottom of the rod is obtained.
- (3)
- According to the definition of rod length correction coefficient and test results, this paper proposes a correction method for blow counts applicable to offshore SPT.
Author Contributions
Funding
Institutional Review Board Statement
Informed Consent Statement
Data Availability Statement
Conflicts of Interest
References
- Chen, P.X.; Pan, G.F.; Xu, J.L.; Chen, X.L.; Li, D. Correlative study of cone penetration test parameters and physico-mechanical properties of the seabed soil on the East China Sea Continental Shelf. Geotech. Investig. 2009, 37, 34–37. (In Chinese) [Google Scholar]
- Meyerhof, G.G. Penetration test and bearing capacity of cohesionless soils. Soil Mech. Found. Eng. Engl. Transl. 1956, 82, 1–19. [Google Scholar] [CrossRef]
- Robertson, P.K.; Campanella, R.G.; Wightman, A. SPT-CPT correlation. J. Geotech. Eng. Div. 1983, 109, 1449–1459. [Google Scholar] [CrossRef]
- Wang, S.J.; He, M.C.; Zhang, J.Z. Estimation of relative density of sand with normalized standard penetration N value. Chin. J. Geotech. Eng. 2005, 27, 682–685. [Google Scholar]
- Hettiarachchi, H.; Brown, T. Use of SPT Blow Counts to Estimate Shear Strength Properties of Soils: Energy Balance Approach. J. Geotech. Geoenviron. Eng. 2009, 135, 830–834. [Google Scholar] [CrossRef]
- Seed, H.B.; Tokimatsu, K.; Harder, L.F.; Chung, R.M. The influence of SPT procedures in evaluating soil liquefaction resistance. J. Geotech. Eng. Div. 1985, 111, 1425–1445. [Google Scholar] [CrossRef]
- Skempton, A.W. Standard penetration test procedures and the efforts in sands overburden pressure, relative density, particle size, ageing and over-consolidation. Geotechnique 1986, 36, 425–447. [Google Scholar] [CrossRef]
- Daniel, C.; Howie, J.; Jackson, R.; Walker, B. Review of Standard Penetration Test Short Rod Corrections. J. Geotech. Geoenviron. Eng. 2005, 131, 489–497. [Google Scholar] [CrossRef]
- ISO 22476-2; Geotechnical Investigation and Testing-Field Testing-Part 2: Dynamic Probing. ISO: Geneva, Switzerland, 2005.
- JIS A1219-2001; Standard Penetration Test Method. Japanese Industrial Standards Committee: Tokyo, Japan, 2001.
- ASTM D4633-10; Standard Test Method for Stress Wave Energy Measurement for Dynamic Penetrometer Testing Systems. American Society for Testing and Materials (ASTM): West Conshohocken, PA, USA, 2010.
- Kovacs, W.D. Velocity measurement of free-fall SPT hammer. J. Geotech. Eng. Div. 1979, 105, 1–10. [Google Scholar] [CrossRef]
- Rahimi, S.; Wood, C.M. Influence of soil aging on SPT-Vs correlation and seismic site classification. Eng. Geol. 2020, 272, 105–653. [Google Scholar] [CrossRef]
- Schmertmann, J.H.; Palacios, A. Energy Dynamics of SPT. J. Geotech. Eng. Div. 1979, 105, 909–926. [Google Scholar] [CrossRef]
- EI-Sherbiny, R.M.; Salem, M.A. Evaluation of SPT energy for Donut and Safety hammers using CPT measurements in Egypt. Ain Shams Eng. J. 2013, 4, 701–708. [Google Scholar] [CrossRef]
- Yokel, F.Y. Energy transfer in standard penetration test. J. Geotech. Eng. Div. 1982, 108, 1197–1202. [Google Scholar] [CrossRef]
- Matsumoto, T.; Sekiguchi, H.; Yoshida, H.; Kita, K. Significance of two-point strain measurement in SPT. Soils Found. 1992, 32, 67–82. [Google Scholar] [CrossRef] [PubMed]
- Lu, C.H.; Wang, J. Correlations between Vs and SPT-N by different borehole measurement methods: Effect on seismic site classification. Bull. Earthq. Eng. 2020, 18, 1139–1159. [Google Scholar] [CrossRef]
- Tsai, J.S.; Liou, Y.J.; Liu, F.C.; Chen, C.H. Effect of hammer shape on energy transfer measurement in the standard penetration test. Soils Found. 2004, 45, 103–114. [Google Scholar] [CrossRef]
- Odebrecht, E.; Schnaid, F.; Rocha, M.M.; Bernardes, G.P. Energy efficiency for standard penetration tests. J. Geotech. Geoenviron. Eng. 2005, 131, 1252–1263. [Google Scholar] [CrossRef]
- Sancio, R.B.; Bray, J.D. An assessment of the effect of rod length on SPT energy calculations based on measured field data. Geotech. Test. J. 2005, 28, 22–30. [Google Scholar]
- Youd, T.; Bartholomew, H.W.; Steidl, J.H. SPT hammer energy ratio versus drop height. J. Geotech. Geoenviron. Eng. 2008, 134, 397–400. [Google Scholar] [CrossRef]
- Lee, C.; Lee, J.S.; An, S.; Lee, W. Effect of Secondary Impacts on SPT Rod Energy and Sampler Penetration. J. Geotech. Geoenviron. Eng. 2010, 136, 522–526. [Google Scholar] [CrossRef]
- Moghaddam, R.B.; Lawson, W.D.; Jayawickrama, P.W. Hammer Efficiency and Correction Factors for the TxDOT Texas Cone Penetration Test. Geotech. Geol. Eng. 2017, 35, 2147–2162. [Google Scholar] [CrossRef]
- Zuo, Y.Z.; Cheng, Z.L.; Ding, H.S.; Liao, J.H. Study of modified coefficient of dynamic penetration rod length. Rock Soil Mech. 2014, 35, 1284–1288. (In Chinese) [Google Scholar]
- Zuo, Y.Z.; Zhao, N. Model tests on modified coefficient of heavy dynamic penetration rod length. Chin. J. Geotech. Eng. 2016, 38, 178–183. (In Chinese) [Google Scholar]
- Shi, L.; Fu, S.J.; Yuan, W.C.; Han, Y.H.; Zhao, M.J. Experimental study on axial impacting force and hammer impacting energy in rod of heavy dynamic penetration test. Chin. J. Rock Mech. Eng. 2016, 35, 201–208. (In Chinese) [Google Scholar]
- Li, H.Z.; Guo, F.; Fu, S.J.; Hao, W.Z.; Li, Z. Adaptation and correction of dynamic penetration rod length. Earth Sci. 2016, 41, 1249–1258. (In Chinese) [Google Scholar]
- Chai, J.F.; Chen, Z.Y. Influence of drill rod’s flexural deflection on standard penetration test in deep bore-holes in maritime spaces. China Harb. Eng. 2016, 36, 40–43. (In Chinese) [Google Scholar]
- Jakeman, D.; Smith, B.L.; Heer, W. Propagation of Pressure Waves through Airwater Mixtures (No. EIR-534); Eidgenoessisches Inst. fuer Reaktorforschung: Lausanne, Switzerland, 1984. [Google Scholar]
- Atabek, H.B.; Lew, H.S. Wave propagation through a viscous incompressible fluid contained in an initially stressed elastic tube. Biophys. J. 1996, 6, 481–503. [Google Scholar] [CrossRef]
- Yu ST, J.; Chen, Y.Y.; Yang, L. Velocity-Stress Equations for Wave Propagation in Anisotropic Elastic Media. In Wave Processes in Classical and New Solids; IntechOpen: London, UK, 2012. [Google Scholar]
- Moradi, S.; Lawton, D.C. Velocity-Stress Finite-Difference Modeling of Poroelastic Wave Propagation. 2013. Available online: https://www.crewes.org/Documents/ResearchReports/2013/CRR201361.pdf (accessed on 10 June 2023).
- Wei, X.; Sun, L.; Sun, Q.; Xu, S.; Zhou, H.; Du, C. Propagation velocity model of stress wave in longitudinal section of tree in different angular directions. BioResources 2019, 14, 8904–8922. [Google Scholar] [CrossRef]
- Wei, X.; Du, C.; Xu, S.; Tian, C.; Yang, X.; Hu, L.; Pang, P. Research on stress wave wood nondestructive testing technology. J. Phys. Conf. Ser. 2022, 2366, 012035. [Google Scholar] [CrossRef]
- Zhang, C.; Zhu, Z.; Wang, S.; Ren, X.; Shi, C. Stress wave propagation and incompatible deformation mechanisms in rock discontinuity interfaces in deep-buried tunnels. Deep. Undergr. Sci. Eng. 2022, 1, 25–39. [Google Scholar] [CrossRef]
- Abou-Matar, H.; Goble, G.G. SPT dynamic analysis and measurements. Geotech. Geoenviron. Eng. 1997, 123, 921–928. [Google Scholar] [CrossRef]


| Soil Layers | Properties | ||||||||
|---|---|---|---|---|---|---|---|---|---|
| Water Content/ % | Density/(g/m3) | Specific Density | Void Ratio | Liquid Limit/% | Plastic Limit/% | Compression Modulus/MPa | Cohesion Force/kPa | Internal Friction Angle/° | |
| Mud (−22.3 m~−33.8 m) | 57.2 | 1.65 | 2.74 | 1.60 | 46.2 | 27.2 | 2.39 | 11.0 | 8.3 |
| Silty clay (−33.8 m~−41.8 m) | 24.8 | 2.02 | 2.73 | 0.69 | 39.7 | 23.9 | 6.90 | 52.0 | 16.2 |
| Silty (−41.8 m~−57.8 m) | 27.2 | 1.96 | 2.70 | 0.75 | / | / | 7.66 | 8 | 31.6 |
| Sandy soil (−57.8 m~) | 21.1 | 1.99 | 2.69 | 0.63 | / | / | 8.97 | 3 | 33.9 |
| Distances between Two Test Point/m | Time Intervals between Two Test Point/s | Stress Wave Velocities /m |
|---|---|---|
| 18.6 | 0.004090 | 4547.7 |
| 18.6 | 0.004052 | 4590.3 |
| 18.6 | 0.004058 | 4583.5 |
| 28.6 | 0.006056 | 4722.6 |
| 28.6 | 0.006121 | 4672.4 |
| 28.6 | 0.006135 | 4661.8 |
| 38.6 | 0.008124 | 4751.4 |
| 38.6 | 0.008198 | 4708.5 |
| 38.6 | 0.008173 | 4722.9 |
| 48.6 | 0.010226 | 4752.6 |
| 48.6 | 0.010273 | 4730.8 |
| 48.6 | 0.010366 | 4688.4 |
Disclaimer/Publisher’s Note: The statements, opinions and data contained in all publications are solely those of the individual author(s) and contributor(s) and not of MDPI and/or the editor(s). MDPI and/or the editor(s) disclaim responsibility for any injury to people or property resulting from any ideas, methods, instructions or products referred to in the content. |
© 2023 by the authors. Licensee MDPI, Basel, Switzerland. This article is an open access article distributed under the terms and conditions of the Creative Commons Attribution (CC BY) license (https://creativecommons.org/licenses/by/4.0/).
Share and Cite
Sun, M.; Zhang, Q.; Sun, H.; Weng, Z. Experimental Study on Axial Stress and Hammer Impacting Energy of Offshore Standard Penetration Test. Appl. Sci. 2023, 13, 9487. https://doi.org/10.3390/app13179487
Sun M, Zhang Q, Sun H, Weng Z. Experimental Study on Axial Stress and Hammer Impacting Energy of Offshore Standard Penetration Test. Applied Sciences. 2023; 13(17):9487. https://doi.org/10.3390/app13179487
Chicago/Turabian StyleSun, Miaojun, Qianlong Zhang, Honglei Sun, and Zhenqi Weng. 2023. "Experimental Study on Axial Stress and Hammer Impacting Energy of Offshore Standard Penetration Test" Applied Sciences 13, no. 17: 9487. https://doi.org/10.3390/app13179487
APA StyleSun, M., Zhang, Q., Sun, H., & Weng, Z. (2023). Experimental Study on Axial Stress and Hammer Impacting Energy of Offshore Standard Penetration Test. Applied Sciences, 13(17), 9487. https://doi.org/10.3390/app13179487