Abstract
During the Multi-Object Tracking (MOT) process, the effectiveness of Re-Identification (Re-ID) is typically contingent upon the performance of detection. In particular, detection errors may result in the blurring of Re-ID features, thereby diminishing the efficacy of Re-ID. In particular, Re-ID exhibits poor robustness in intricate scenarios such as distance and scale alterations, occlusion, and crowding. Meanwhile, the frequent occurrence of object occlusion can result in the interruption of object tracking, thereby impacting the tracking efficiency. To address these issues, a novel MOT method approach that leverages Re-ID enhancement and association correction is proposed. Through an unanchored, one-stage backbone network with CenterNet as the detector, the object position is detected by predicting the heatmap of the object center point. A constraint on the Predicted Distance Difference Loss (PDDL) is then designed for the response value of the predicted heatmap, effectively enhancing the detection accuracy and reduce the detection bias. To address the issue of Re-ID reliance on detection accuracy and enhance its robustness, an Effective Feature Graph Convolutional Neural network (EFGCN) is proposed. This approach expands learnable effective features by constructing a graph model that enhances them through a GCN model of heatmap true value locations and surrounding response value locations. Additionally, a target trajectory Association Correction Module (ACM) is introduced in the association phase to handle interruptions and trajectory fragments caused by occlusion. By improving data association for tracking judgment when dealing with occluded targets and considering the relationship between trajectory fragmentation and the detection of low-scoring targets, attempts are made to continue with tracking occluded targets to form complete object associations. The proposed method is evaluated on the MOT16 and MOT17 datasets and compared with other algorithms. The results demonstrate that it is highly effective.
1. Introduction
Multiple-object tracking (MOT), as a high-level task in computer vision, has been widely applied in various fields such as video surveillance [1,2,3], human behavior recognition, and autonomous driving [4,5,6]. One of the advantages of video-based MOT [7,8,9,10,11,12,13,14] is its ability to accurately localize targets continuously in videos while maintaining their identity information, unchanged, when the appearance or the surrounding environment changes. This allows for the output of complete motion trajectories for tracked objects. As a result, it has gained increasing attention from researchers.
The MOT task can be classified into two categories based on the use of video sequences: online and offline tracking. While offline tracking is capable of achieving better tracking performance by utilizing global information from videos, online tracking is more suitable for real-world applications. However, due to the fact that online tracking is unable to take advantage of subsequent image information in videos, its tracking accuracy relies more heavily on the detection precision of current image targets. Additionally, there has been a growing trend towards targeting specific types of objects within scenes, as many videos contain large numbers of pedestrians. Consequently, pedestrian tracking algorithms currently account for the majority of multi-object tracking methods [15,16,17,18,19,20]. Nevertheless, there are still challenges in improving both real-time performance and tracking robustness simultaneously.
As object detection algorithms continue to improve, Tracking by Detection (TBD) [21] has become a popular tracking strategy. TBD utilizes detectors to distinguish between foreground and background objects in MOT tasks, improving tracking robustness through the tracker continuous communication with the detector while predicting target positions. However, in complex scenarios such as scale transformations and frequent occlusions, target appearance features can be contaminated, leading to poor tracking results. To address this issue, researchers have utilized Re-ID deep learning models for feature extraction, followed by similarity analysis using Euclidean Distance, Cosine Dsitance, and other metric functions to optimize accuracy and differentiation [22].
The methods of Re-ID [23] feature extraction are different; the (Joint Detecting and Embedding, JDE) algorithm proposed by Wang et al. [24] merges the pedestrian re-recognition model into the detector network, and outputs the detection information of the image and the Re-ID feature map in parallel. The detection information is then used to obtain the corresponding feature vector of the target, which avoids the redundant computation of repeated feature extraction. However, the JDE algorithm has a poor detector effect in the case of pedestrians occluding each other, and pedestrian re-recognition relies too heavily on the results of the detector. Zhang et al. [25] proposed FairMOT, an excellent algorithm based on the JDE integration framework. The contradiction between detection and apparent features is alleviated by fusing deep and shallow features. CenterNet [5], based on anchorless detection, is used as a detector to reduce the ambiguity of Re-ID features. The tracking accuracy is further improved and real-time requirements are met.
CenterNet is a centroid-based detection algorithm with detection bias. During tracking training, classification is learned for the feature vectors of the Re-ID feature map at the center point of the target. The inability to accurately locate the effective feature positions on the feature map causes the Re-ID task to be overly dependent on the detection accuracy. Obtaining better tracking results not only improves the detection accuracy but also improves the performance of the association task. Background interference, illumination variations, pedestrian density, and target occlusion have always been difficult problems in multi-target tracking methods. Existing methods often treat short-term occlusion of a target by other objects as target disappearance. When the target reappears, a trajectory is reinitialized, which destroys the integrity of the target trajectory.
To address the above problems this paper proposes a multi-objective tracking algorithm (REACTrack) based on Re-ID enhancement and association correction. The main contributions of this paper are as follows:
- In CenterNet network, a predicted distance difference loss (PDDL) is designed for a center point detection heat map—suppress the response values of non-true Ground Truth (GT) locations in the predicted heat map. Make the high response value closer to the target truth position to improve the detection effect;
- Build an expanded learnable Effective Features GCN (EFGCN). Build a graph model for the relationship between the target GT position and the position around the GT. Ensure Re-ID feature quality and robustness;
- Design of Trajectory-Associated Correction Module (ACM). Under the influence of complex background and frequent occlusion of pedestrian targets, the target trajectory is corrected to improve the trajectory integrity.
The rest of the paper is organized as follows: Section 2 provides the related work on MOT. Section 3 explains REACTrack with detailed description for each stage. Section 4 gives the ablation studies and baseline comparison results and visualization. Finally, Section 5 concludes the paper by providing perspectives for future work.
2. Related Work
MOT can be categorized into two common paradigms: Tracking by Detection (TBD) and Joint Detection and Tracking (JDT). TBD is divided into two stages: in the first phase, an external detector is utilized to discover and localize all the targets of interest in each image frame. The detection response is represented as a rectangular bounding box. In the second phase, data association is performed on the detection responses to achieve tracking of multiple targets. The execution time of the TBD tracking system is approximately the sum of the execution time of each of the two phases. And it becomes larger as the number of targets in the scene increases, which poses a great challenge in building a real-time, multi-target tracking system. In order to reduce computation, researchers have recently proposed the JDT paradigm to perform target detection and target tracking simultaneously. Bergmann et al. [26] first proposed a transition paradigm from the detection-based tracking paradigm to the joint detection and tracking paradigm: the regression-based tracking paradigm, Tracktor. Tracktor transforms a target detector into a tracker by utilizing the bounding box regression of the target detector Faster RCNN [16] to directly predict the position of the target in the next frame. Compared to the detection-based tracking paradigm, Tracktor achieves better tracking performance.
In MOT, Re-ID is often utilized to introduce differentiation between targets to improve the matching accuracy of the tracking algorithm and reduce the false matches. Meanwhile, Re-ID’s target-specific re-recognition capability can help the trajectories of lost targets to re-match the reappearing targets and improve the tracking robustness. Bayraktar et al. [27] proposed an embedding generation module which is tightly coupled with the object detection module and a triplet-based matching module to achieve the fast Re-ID task of objects. Suljagic et al. [28] proposed an interesting similarity-based person Re-ID framework by adopting a Siamese neural network via shared weights. Due to its powerful modeling capability, GCN is widely used in the field of pedestrian re-identification. Yan et al. [29] and Shen et al. [30] constructed graph models at the image level, i.e., each node of the graph represents an image in order to take into account the relationships between images; however, they ignored the relationships between different body parts of pedestrians. Wu et al. [31] introduced a graph neural network to achieve contextual interaction between relevant regional features by utilizing pose-aligned connections and feature affinity connections. However, pose information extraction requires additional computation and is not integrated into the whole network for end-to-end training, which may lead to sub-optimal results. Shen et al. [32] collected candidate items from the output of detection and tracking via a deep neural network and adopted a classifier with codec architecture. They also introduced Re-ID feature information for data association. In addition, the commonly used MOT data association methods [24,25,33,34] only associate the detection frames with scores above a certain threshold with the trajectory, while ignoring the case when the score is below the threshold when the pedestrian is occluded, which leads to non-negligible real missed targets and fragmented trajectories. This is insufficient to depict the pedestrian’s motion state and can easily cause interruption of the trajectory and ID. Zhang et al. [7] proposed to perform tracking by associating each detection frame instead of only the high-scoring detection frames. For low-score detection frames, we utilize their similarity to small trajectories to recover real objects and filter out background detection.
In this paper, PDDL is proposed for centroid detection to make the predicted position closer to the true position of the target, which, in turn, improves the detection accuracy; EFGCN is constructed to improve the quality of Re-ID feature vectors since centroid detection has detection bias, which reduces the Re-ID effect; the detection information is used to set the tracking thresholds, select the available targets, carry out the correlation corrections to the existing trajectory segments, add an ACM to minimize the trajectory interruptions occurring due to occlusion, and optimize the correlation effect.
3. Methods
In this paper, a MOT algorithm, REACTrack, based on re-identification enhancement and association correction is proposed. The algorithm extracts features through DLA-34 network and uses CenterNet, which is based on anchorless detection as a detector. The differential distance loss PDDL for center detection is proposed to enhance the detection effect. Then, GCN is used to expand the effective feature range of Re-ID and enhance the quality of Re-ID features. Finally, we propose a target association correction method, ACM, to ensure the integrity of the target trajectory.
3.1. Overview
The overall network framework of REACMOT proposed in this paper is shown in Figure 1. First, the input images are fed into the backbone network (DLA-34) [25] with a uniform input image size of 1088 × 608 to extract the high-resolution feature maps (stride = 4), and the output feature maps with a size of 64 × 272 × 152. Then, the feature maps are input to CenterNet. PDDL is proposed in the detection branch to improve the detection effect. EFGCN is used in the Re-ID branch to expand the effective feature range in the center of the predicted object. Finally, the target association correction module is connected to reduce the trajectory interruptions occurring due to occlusion and obtain the complete trajectory.

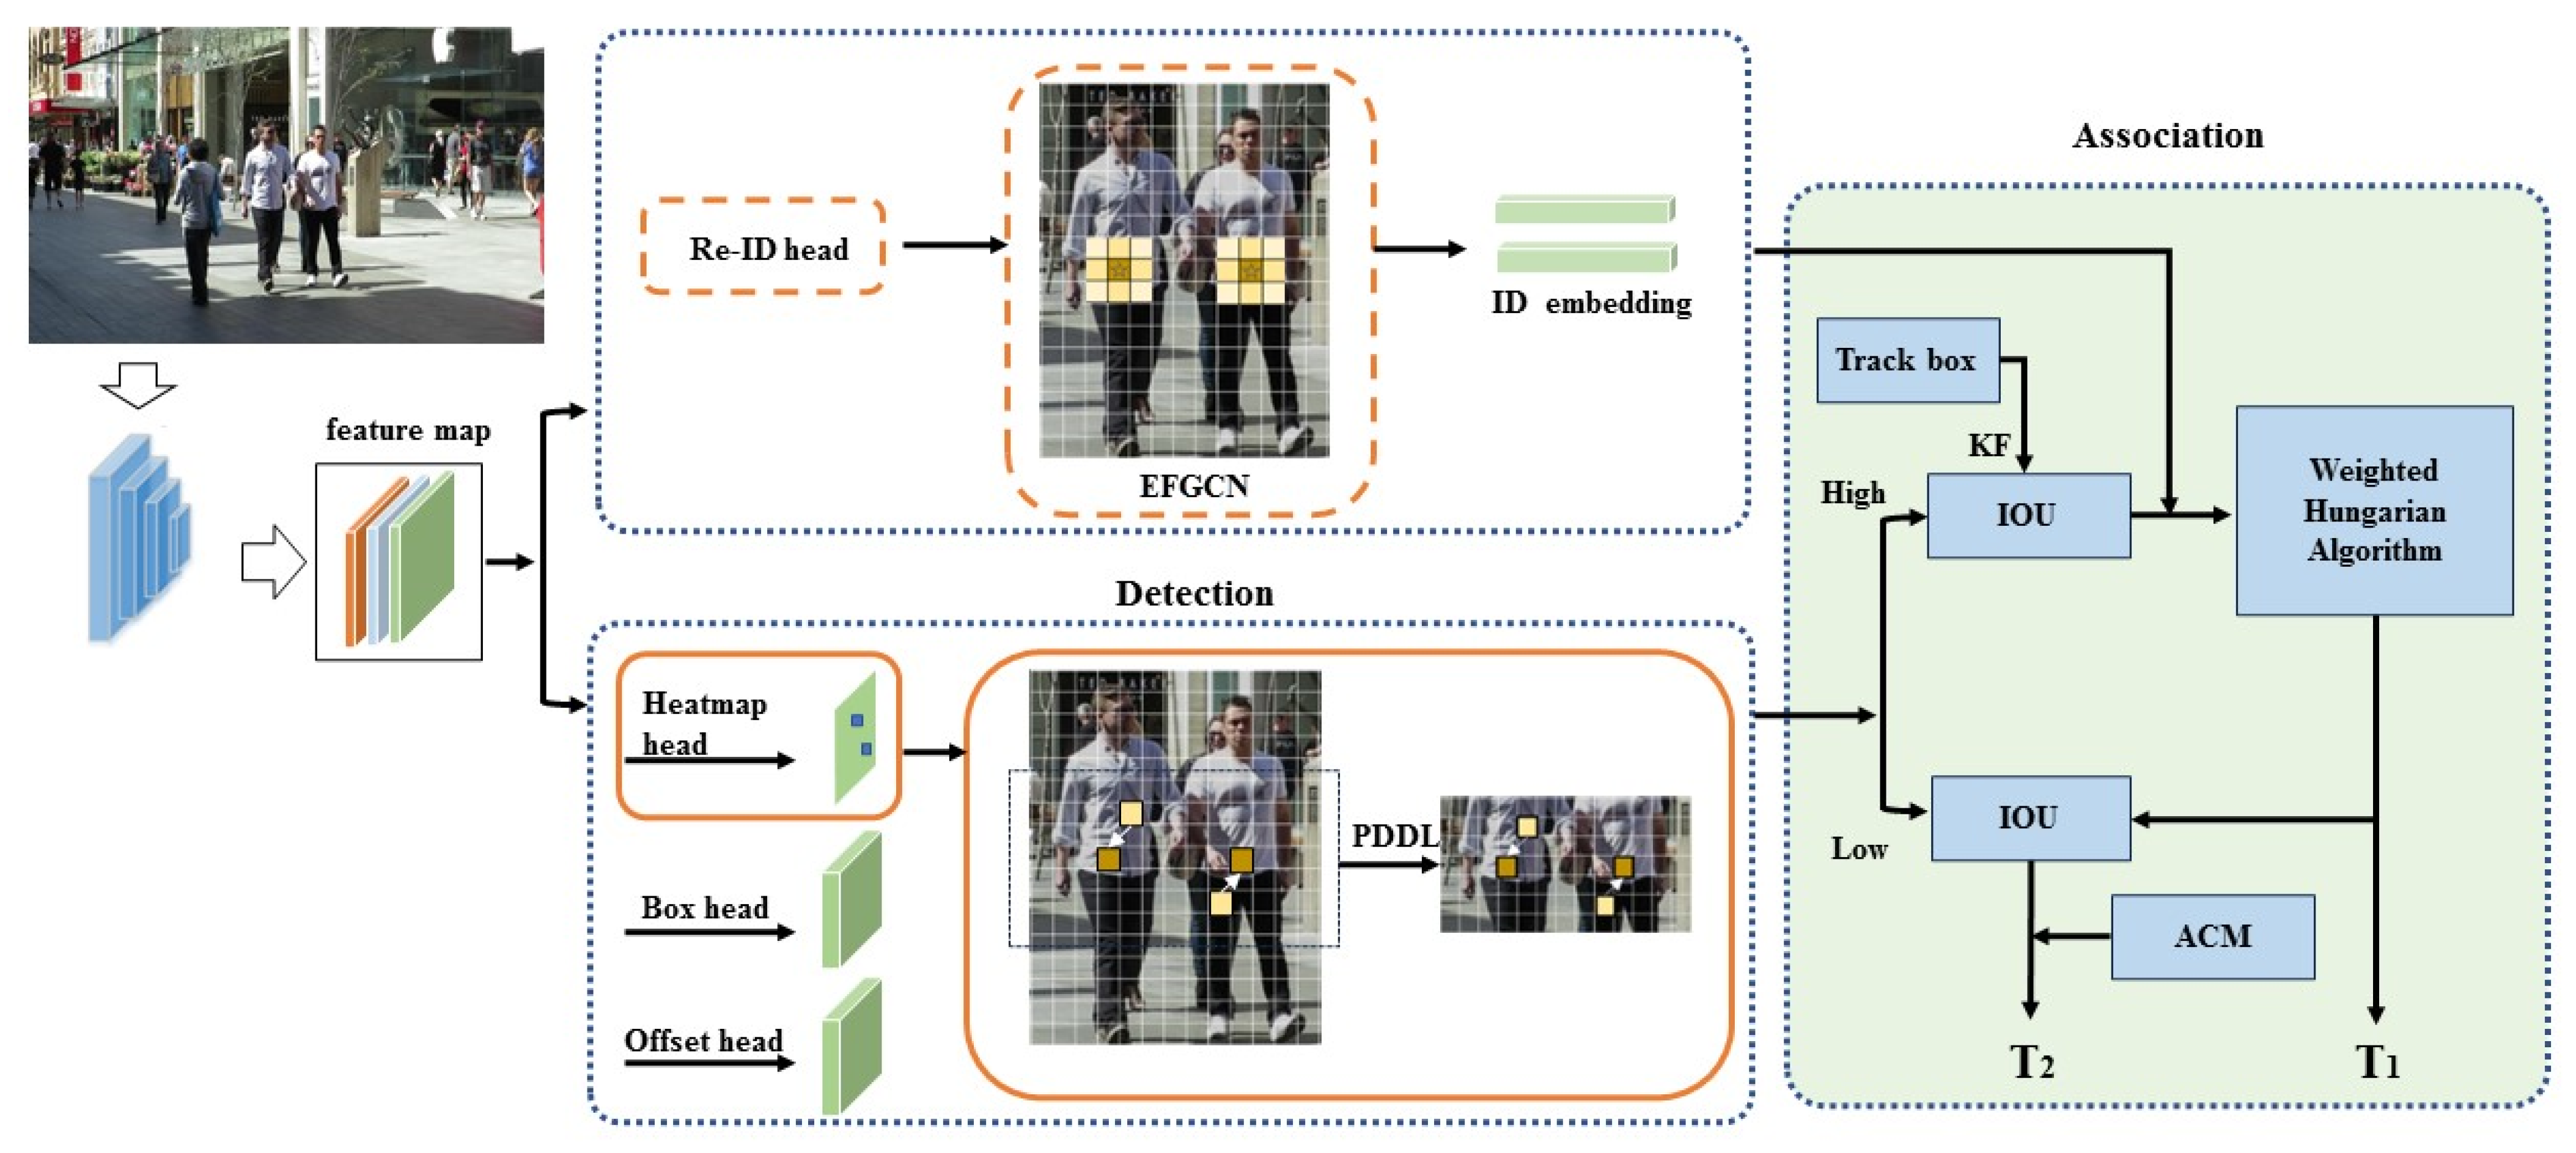
Figure 1.
The overall pipeline of REACTrack. the input image is first fed to a backbone network to extract high-resolution feature maps. Then, the feature maps are fed into the CenterNet detector. Then, the feature map is fed into the CenterNet detector, which is detected and in recognized, respectively to obtain the detection target and ID embedding. In the data association phase, the first step detects the target with ID embedding to obtain the target trajectory by performing the improved weighted Hungarian algorithm. The second step adds ACM for tracking the target trajectory.
3.2. Object Detection
The feature map extracted by the backbone network is fed to the CenterNet detector, which contains three parallel branches used to estimate the heatmap, center offset and bounding box size of the object. To improve the detection effect, we designed PDDL in heatmap to make the predicted position close to the GT position.
3.2.1. Heatmap Prediction Distance Difference
For the input image , where , a center point heatmap is generated at the time of prediction, denoted as ; 4 denotes 4-fold downsampling. When , this point is the detection center point, otherwise it belongs to the background.
For (ground truth) GT values, the center point is denoted as . The center point is computed as , and its downsampled corresponding center point is .
The image is labeled with and the center point is noted as the GT point in the downsampled [128,128] image will be represented in the form of . The heat map response of GT satisfies a Gaussian distribution:
is the standard deviation associated with the target size.
The generated Gaussian kernel (target frame size) is placed on the corresponding position of the original image (image size), each point ranges from 0–1 and 1 represents the center point of this target.
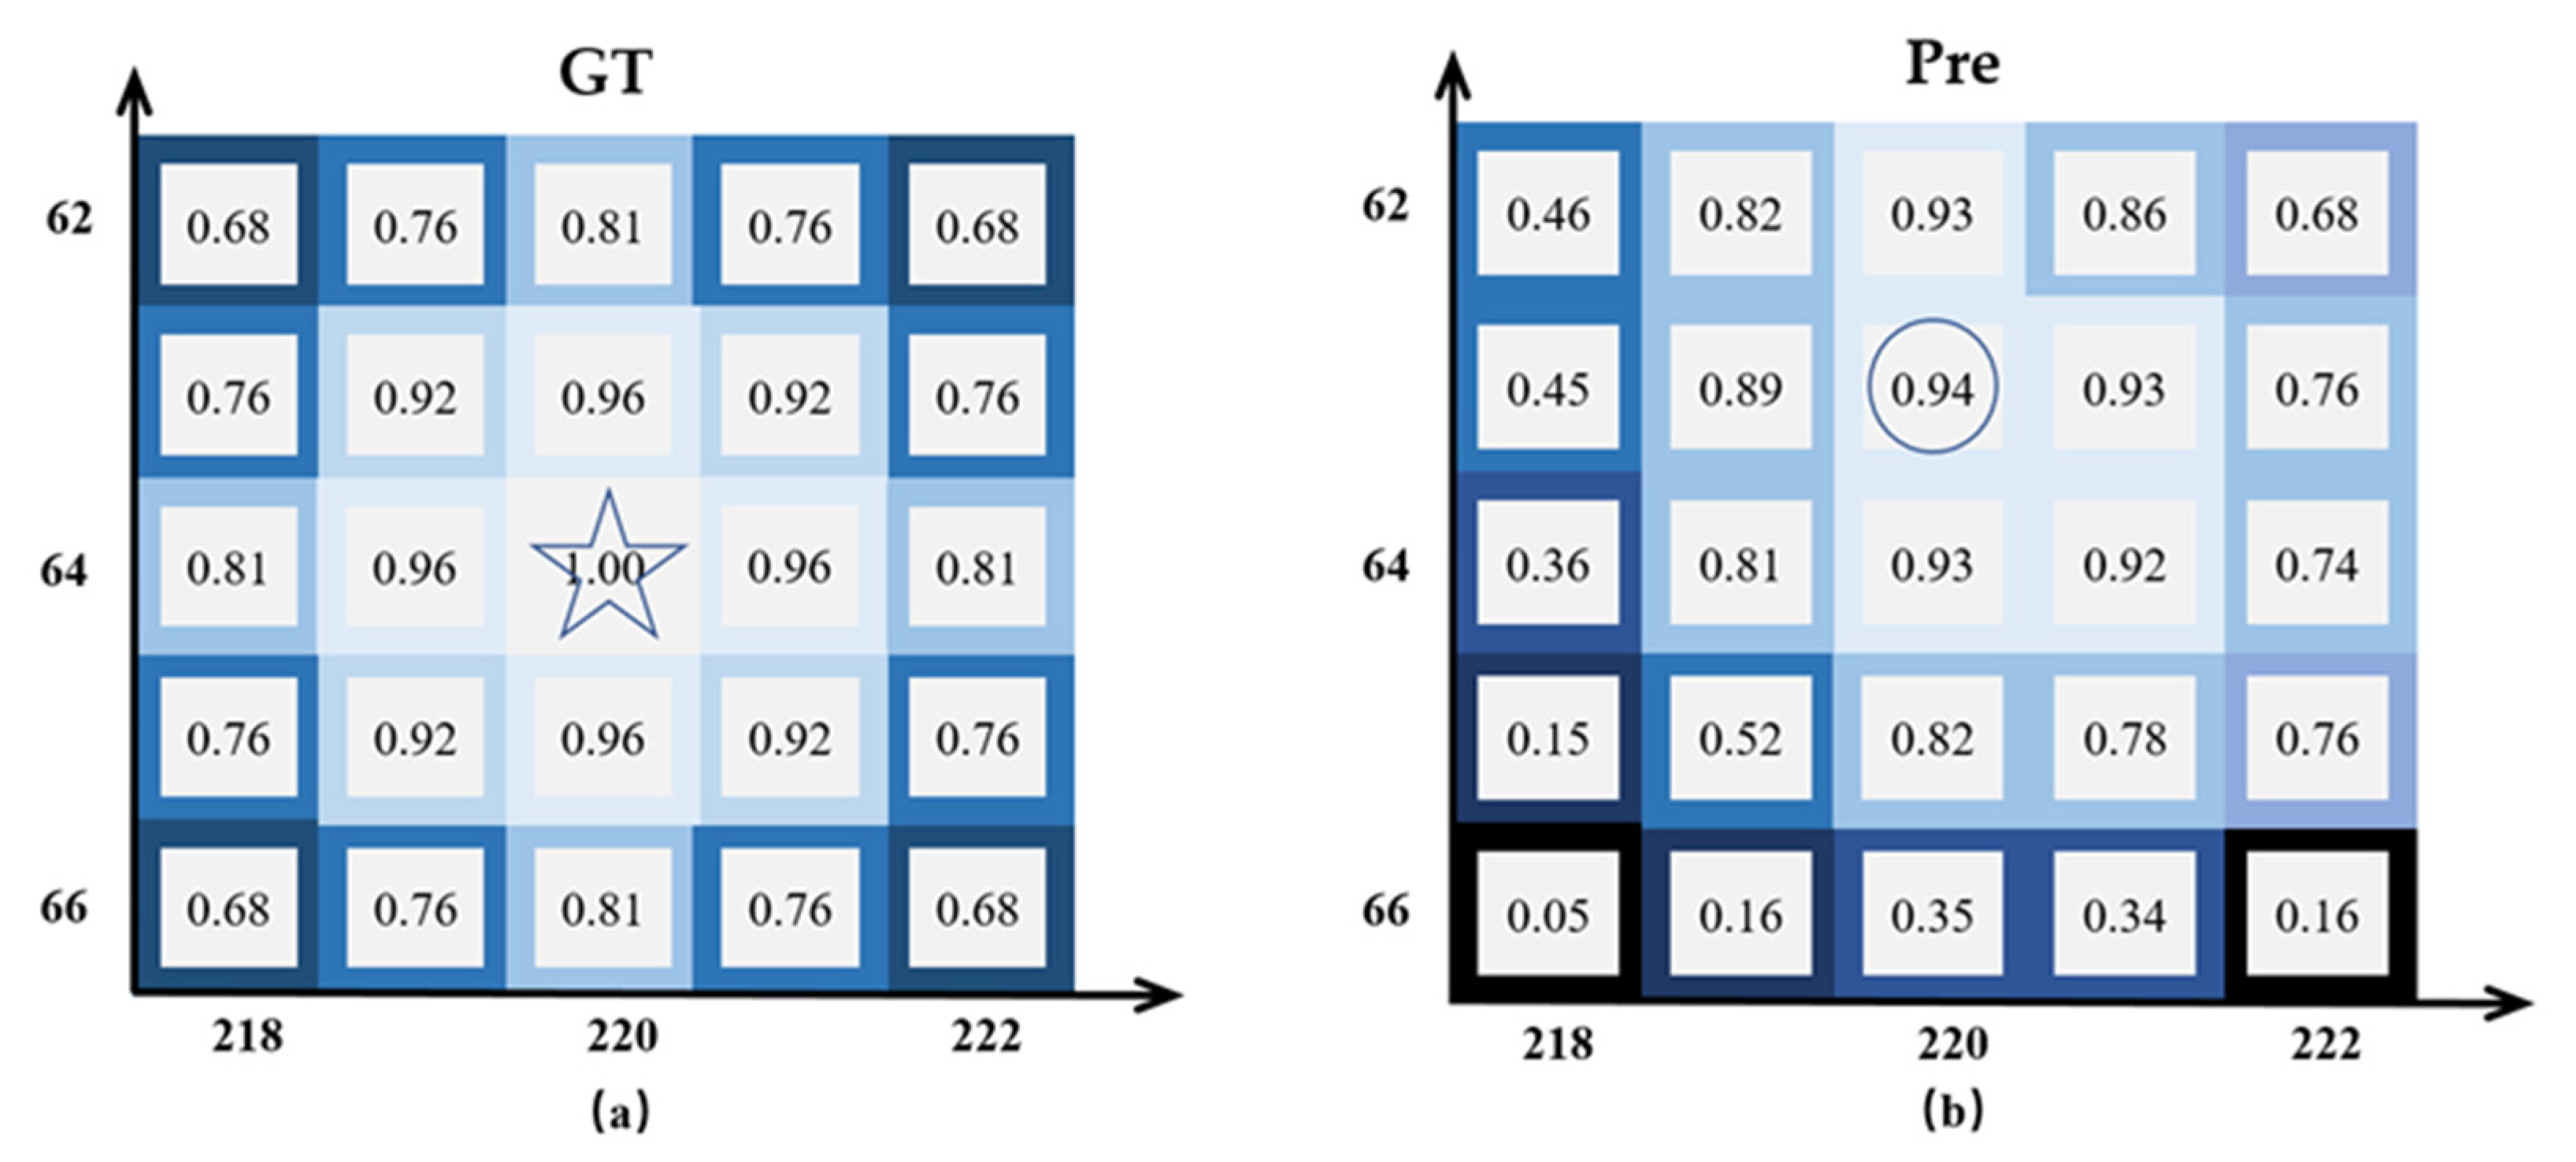
The Heatmap output from the Heatmap head is used to predict the target centroid position. The sizes of the Heatmap are 1 × H × W. If a position of the Heatmap has a value of 1, indicating the coincidence with the target centroid, it is expressed as the GT response value. However, predicting the target center point via heatmap is prone to the situation that the predicted position is shifted and cannot hit the target GT position accurately, as shown in Figure 2. The size of the heat map is 272 × 152. Numbers are response values and axes are labeled as coordinate positions in the heatmap. (a) is the true value GT heatmap of the target, the star marking is the target GT position (GT response value is 1); (b) is the predictive heatmap and the circle marking is the position of the highest response value of the predicted target, i.e., the predictive heatmap target position. It can be seen that there is a certain deviation between the predicted position and the GT position. Although this small deviation has a small impact on the detection accuracy, since the Re-ID feature map only sets the learnable feature vectors at the GT position, the small deviation can also lead to the inability to determine the learnable feature position, which affects the Re-ID effect.
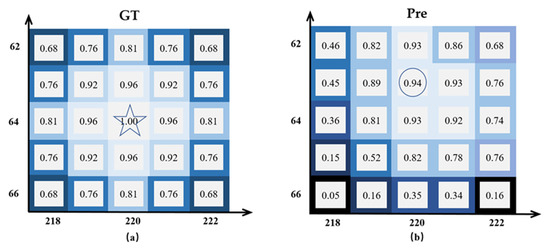
Figure 2.
(a) A True GT heatmap, with the star marking the target GT position (true response value of 1); (b) A Predictive heatmap, with the circle marking the position of the highest response value of the predicted target, i.e., the target Predictive position. There is a bias in the response value.
To solve the problem, this paper defines the distance from the predicted position to the corresponding true position as the distance difference, and constructs the predicted distance difference loss with the average distance difference of high response values to suppress the magnitude of the predicted response values at non-true positions, so that the predicted position is closer to the true value and further improves the detection accuracy. With the object’s true value position as the center, the farther the predicted position with higher response value is from the true value, the greater the loss brought about and the stronger the suppression effect on its response value; on the contrary, the closer the true value position is, the smaller the suppression effect on the high response value, thus bringing the predicted high response value closer to the true value position and realizing the correction of the prediction distance difference. For example, the predicted response value of the true location in the predicted heat map in Figure 2 is 0.93, while there are similar as well as higher predicted response values at the surrounding non-true locations, such as the predicted location being 0.94. After constructing the predicted distance difference loss, the predicted distance difference at the true location is zero, which has no suppression effect, but the high response values at the remaining locations are suppressed to varying degrees, thus ensuring the highest response value at the true location and correcting the predicted location to the GT value.
3.2.2. Heatmap Loss
Heatmap loss includes response value prediction loss and prediction distance difference loss, prediction loss is defined as the error between the predicted response value and the true response value, due to the problem of imbalance in the ratio of positive and negative samples and difficult samples for centroid detection, in order to reduce the effect of sample inhomogeneity, the loss function follows the Focal Loss [35] function in CenterNet, which is expressed as follows:
where N is the number of objects, is the predicted response value of the heatmap at (x, y), is the GT response value, and the preset parameters for Focal Loss are .
The detection deviation loss is defined as the deviation of the distance from the predicted position to the corresponding GT position. Considering that a heatmap detects the object location by predicting the response value, it is not necessary to guarantee the correspondence between the predicted location and the GT object, so the principle of proximity is used to select the corresponding GT object for each predicted location to calculate the loss.
For each high response position of the predicted heatmap, the nearest GT position (the coordinate position with a response value of 1) is selected and the distance between the two coordinates is calculated as the loss. Here, the distance is the 2D coordinate point spacing, so L2 distance is chosen as the loss. A response threshold of λ = 0.5 is set to filter high response values to ensure effective constraints on detection deviations, and the loss calculation is defined as follows:
where M is the number of predicted response values greater than λ, is the predicted object location, is the set of GT position coordinates.
At the same time, considering that the detection deviation loss is a constraint on the deviation of high response value positions around the object centroid, it is a constraint adjustment based on the better response value prediction results. Therefore, the training of the heatmap should focus on response value prediction, and the detection deviation constraint should be performed when the heatmap response value prediction is better. However, the prediction heatmap is poor at the early training stage, and the detection deviation loss is a distance loss, which is larger than the response value prediction loss, so the constraint at this time will cause the fail to converge quickly and affect the training effect of response value prediction. In the later stage of training, when the response value prediction achieves better results, a stronger detection deviation constraint is needed to correct the predicted positions. Therefore, similar to multi-task training, the losses of the heatmap need to be adjusted to meet the training requirements instead of being directly summed. In order to adjust the loss, this paper adds a linear enhancement factor to the deviation loss and adjusts the detection deviation loss by the change in the value of the response value prediction loss convergence process to ensure that the constraint is gradually increased when a better detection effect is achieved. The parameter, μ, is then set to adjust the deviation loss to be of the same order of magnitude as the predicted loss, which can be chosen according to the value of the loss, and μ = 0.1 is taken in the experiment.
The final heatmap loss is defined as follows:
The above equation shows that when is large, the coefficient is small, so has almost no effect on . However, as decreases, the detection deviation loss gradually increases the constraint strength, making the constraint process smoother and obtaining better results.
3.2.3. Offset and Box Loss
Box head outputs a feature map of size W × H × 4, which is used to estimate the distance from the center of the target to the four edges of the detection box. Offset head outputs a feature map of size W × H × 2, which is used to estimate the offset compensation of the center of the target. The offset compensation here is the loss of accuracy caused by the rounding operation when calculating the GT heatmap. Let a GT detection frame in the image be . The distance from the center point to the detection frame is . Since the sampling multiplier under the heatmap is 4, the compensation for the center point offset is . and be the predicted values and the loss function follows the L1 distance in CenterNet, defined as follows:
3.3. Re-ID Enhance
Pedestrian re-identification is the process of extracting recognizable features from the pedestrians in the cropped frame so that the same pedestrians can be accurately identified when they reappear.
The Re-ID head feature map size is 128 × 272 × 152, and each feature point contains a 128-dimensional feature vector. An Effective Feature Graph Convolutional Network EFGCN is proposed. Expanding the range of learnable effective features, enhancing the Re-ID effect, and improving the quality of ID embedding feature vectors.
Currently, only the feature vector at the target GT is used as the Re-ID effective feature for training, so that the detection accuracy will have an impact on Re-ID. Moreover, and the Re-ID will also depend on the detection accuracy, and if no valid features are hit, it will directly affect the effectiveness of tracking. The purpose of the Re-ID effective feature setting process is to determine the location via the object GT heat map and then find the corresponding location on the Re-ID feature map to determine the effective feature vector. However, there is a detection bias in centroid detection, and when the highest response of the marker does not fall in the GT position; even if the deviation of the localization information is very small, it will reduce the feature quality of Re-ID and affect the Re-ID effect.
Expanding the effective feature range of Re-ID can alleviate the bias problem of detection and the chance of hitting a feature can be improved. The relationship between the heatmap GT location and the location around the GT is modeled using GCN.
Construct the graph ,with N nodes and where the feature dimension of each node is 128. denotes the set of each node of the graph structure, and is the set of edges formed by the vertices in the set with the following expression:
inspired by [35], the relationship between the nodes is represented by (7), i.e., the effective feature expansion range threshold is defined as 0.5, forming an adjacency matrix .
K is a key component of the GCN, and each element in K should be non-negative and have coefficients between 0 and 1, so K is normalized, where is the unit matrix. To accurately recognize the same target in a continuous video image, the feature map, , is extracted via EFGCN, and the target is distinguished by the similarity of the feature vector, , at the target GT.
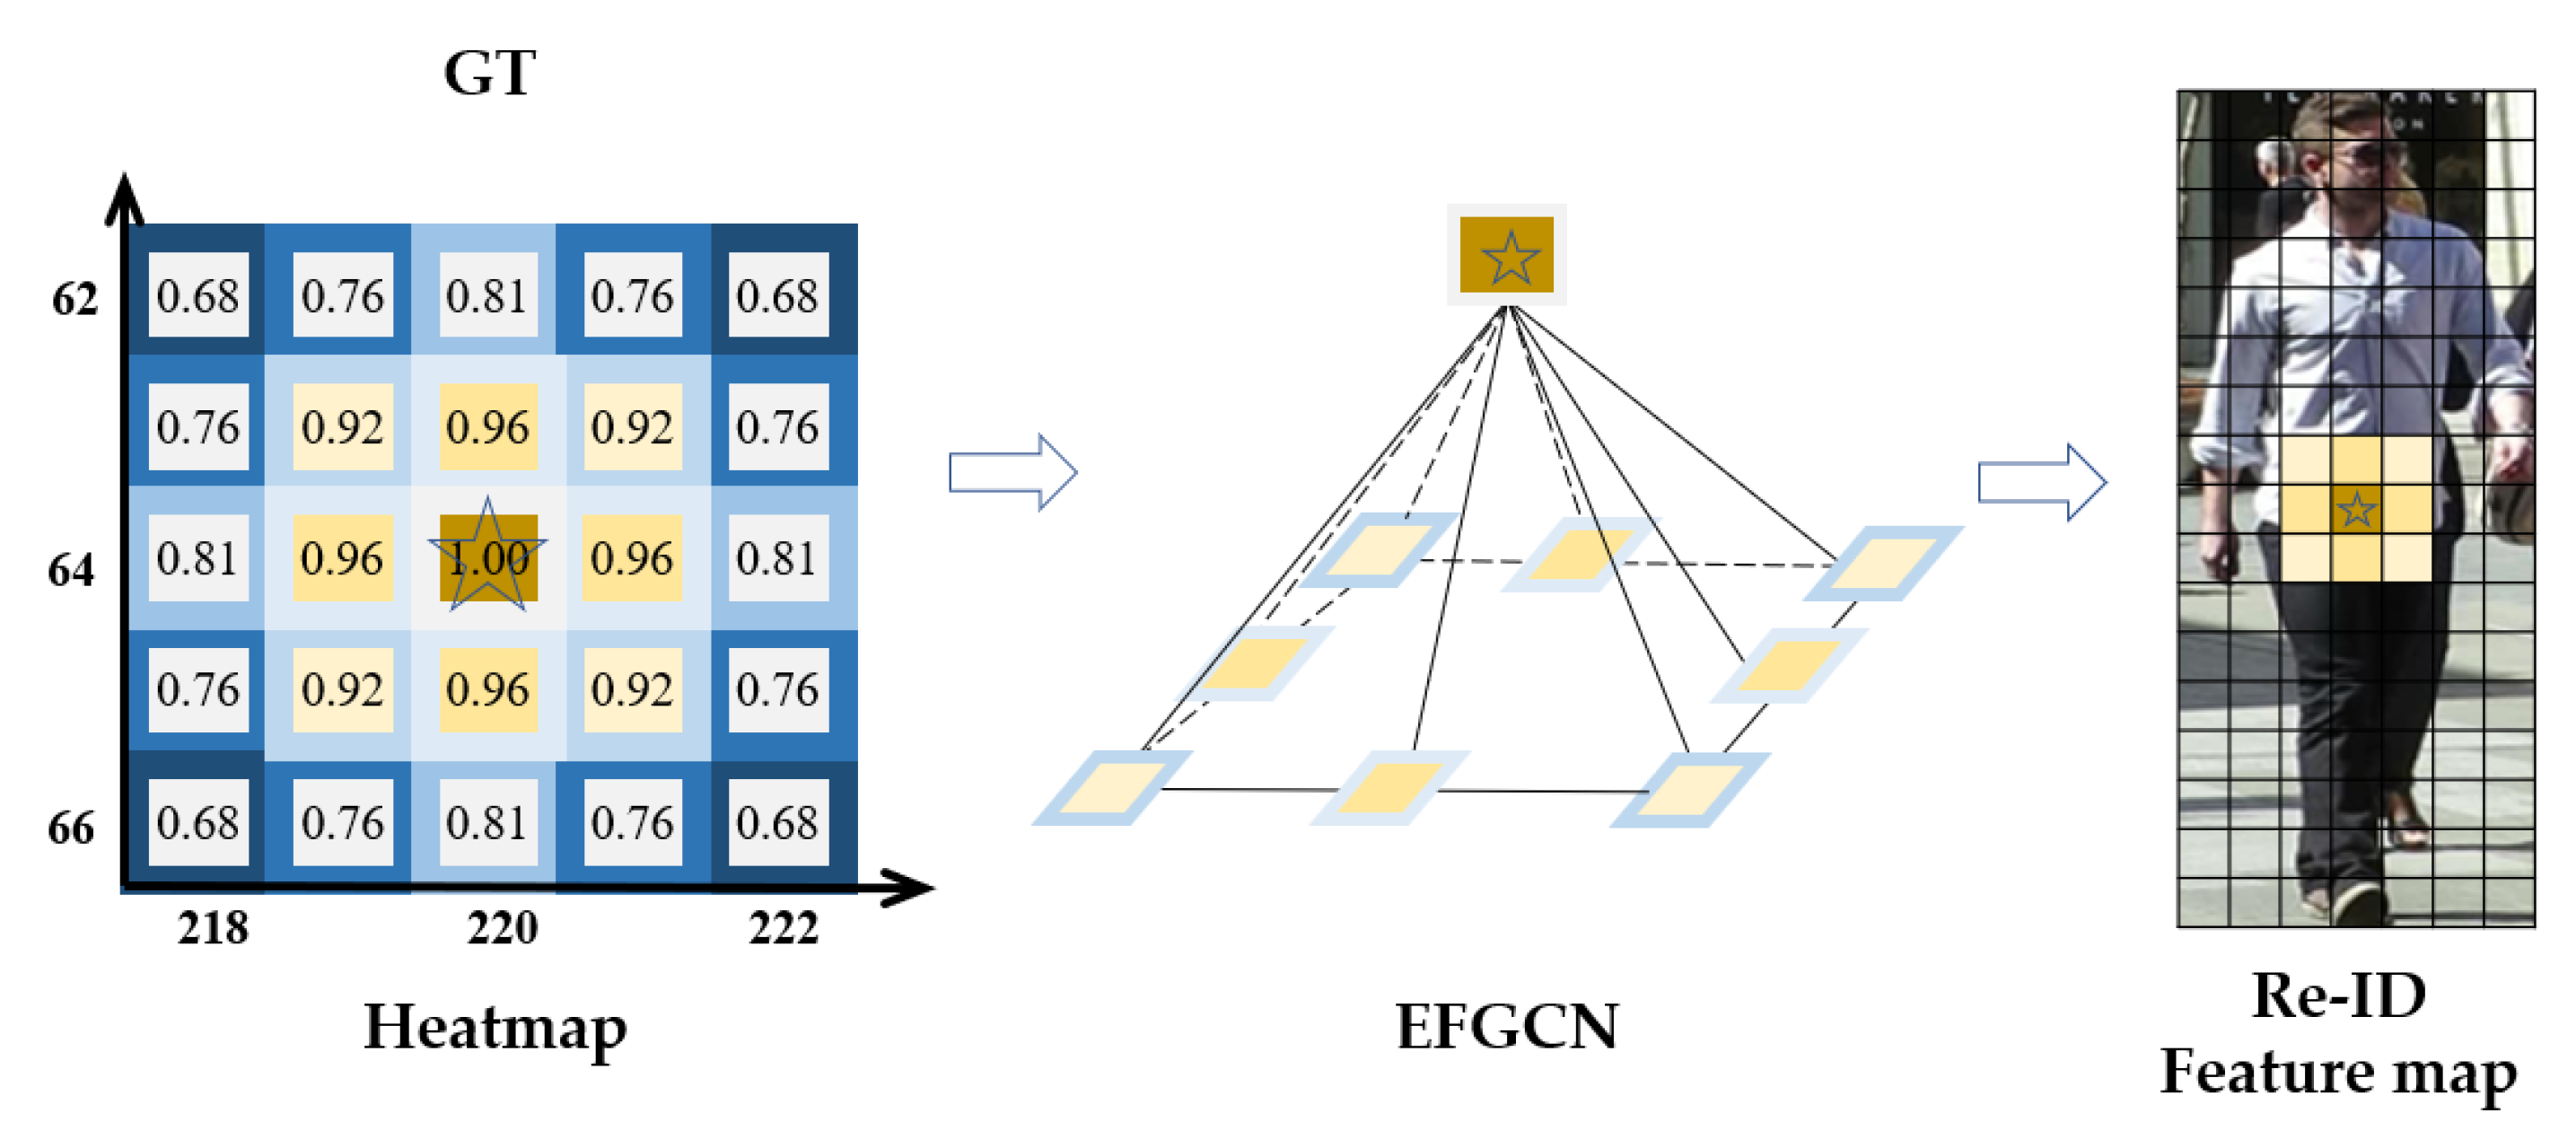
Finally, after EFGCN, as shown in Figure 3, the feature vectors of all nodes with response values greater than the threshold and the GT position node features are aggregated within the threshold that satisfies the condition, which represents the expanded effective features and corresponds to the Re-ID feature map. After the expansion of the range of effective features, the tolerance of the re-id to detection bias can be improved to ensure the re-id features.
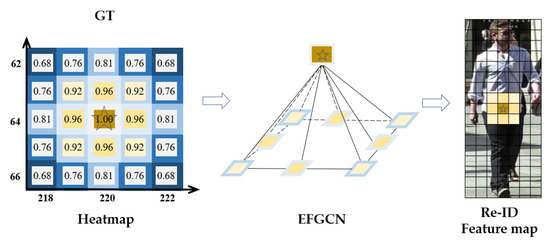
Figure 3.
EFGCN (Effective Feature Graph Convolutional Neural network). A GCN is constructed by taking the target GT value in the heat map as the center point and connecting the predicted distance positions of the nearby targets, and the effective feature range is expanded from the original star-shaped location of the center point to the yellow area.
We learn Re-ID features through a classification task, where pedestrians of the same identity are considered to be of the same category. The target feature vector at GT is passed through a linear classification layer to obtain its probability value . For classifying each ID, where K is the number of identity categories, i.e., the total number of IDs. Re-ID loss is calculated as follows:
where, denotes the true ID probability distribution of the i-th object.
3.4. Multi-Task Training
To train both the detection task and the Re-ID task, the two tasks are dynamically balanced using uncertainty loss [36], which is calculated as follows:
where and are learnable parameters for balancing tasks with initial values of −1.85 and −1.05, respectively.
3.5. Association Correction Network
In the MOT process, the target trajectory is often interrupted due to problems such as background interference and inter-target occlusion, and the target association using the Hungarian algorithm [37] may track the target, but the effect has limitations. For example, a pedestrian from the beginning of the occlusion to the end of the occlusion process, before and after the occlusion of the tracking target ID has been transformed, that is, the tracking trajectory has occurred to interrupt the situation. To address this phenomenon, this paper improves the Hungarian algorithm based on BYTE [7] and proposes a target association correction module to reduce the trajectory interruptions occurring due to occlusion, i.e., tracking the phenomenon of target ID transformations and obtaining a complete trajectory, as shown in Figure 4.
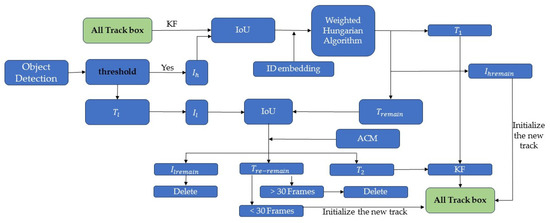
Figure 4.
The overall pipeline of target association correction.
First, the detected pedestrian detection boxes are inputted into the association network, and the thresholds, , , and , are set to denote the detection score high score threshold, low score threshold, and tracking threshold for data association matching, which are categorized into the high score detection boxes () and the low score detection boxes () through the confidence threshold.
Secondly, is IoU (Intersection-Over-Union) matched with the result of Kalman filter prediction of the detection box of the previous frame to calculate the similarity between the detection box and the prediction box; the extracted Re-ID appearance features are fused with the result of IoU matching for feature fusion, and the matching optimization is carried out by using the improved Hungarian algorithm, which is named as the Weighted Hungarian Algorithm, and the weighted cost function is:
α, β are normalized weighting factors.
The following three types of matching results are obtained: the successfully matched trajectory (), the unmatched high score detection box (), and the unmatched trajectory (). For , the trajectory is updated using the Kalman filter, and for , it is initialized as a new trajectory to participate in the next association process, which completes the first association between the detection box and the prediction box. The trajectory () is associated with the low-scoring detection box () for the second time, and in order to ensure the integrity of the trajectory and improve the robustness, the association correction module ACM is embedded.
Specific description of ACM: the target ID during the tracking process is saved and the average value of the height-width of the tracking box of the tracked target is calculated as and . Set the border height of target i of the current t-frame to and width to , perform the comparison, and set the threshold value . Let the center of target i in frame t − 1 be ; let the center of object i in frame t be . Comparisons are made using the Euclidean distance θ, θ {0, 2}; If and are , and , then the front and back frames are the same target.
After the second association, three results are obtained: for the successfully matched trajectories (), they are fed into the Kalman filter again to update the trajectory information. For unmatched low-score detection boxes (), they are treated as background deletion. For still-unmatched trajectories (), if they do not match for 30 consecutive frame rates, they are deleted. Instead, it is added to the tracking sequence. Finally, the obtained tracking sequence is predicted by Kalman filtering, and then associated with and in turn, and the above steps are repeated.
4. Experiments
The experiments were conducted on a 64-bit Ubuntu 20.04 system with GPU 3070Ti *3 and Cuda version 10.2. The open source framework used was PyTorch 1.3.1 and Python version 3.8. We evaluated the datasets, MOT16 and MOT17, from the MOT Challenge benchmark and demonstrated the effectiveness of our approach on the multi-objective tracking problem and compared our model with other recent methods.
The MOT16 dataset [38] has 14 video sequences, including 11,235 video frames, 1342 identity IDs, and 292,733 object frames. The MOT17 dataset [38] contains a total of 14 videos, divided into 7 training datasets and 7 test datasets. MOT17 has high annotation accuracy and covers a variety of multi-object tracking scenarios, covering scenarios where various challenges may be encountered during multi-object tracking, and the tracking algorithm needs good robustness and generalization to achieve good results with the dataset.
4.1. Evaluation Indicators
In order to comprehensively evaluate the tracking performance of the algorithm, several metrics [39,40,41,42] are usually combined to evaluate the tracking performance of the model. The IDs and IDFs are important indicators of the tracking robustness of the model, such as the accuracy and recall of the object IDs, the FP (False Positives) number of hypothetical bounding boxes in the whole sequence that cannot match the bounding boxes of the real track, and the FN (False Negatives) number of bounding boxes in the whole sequence that cannot match the hypothetical bounding boxes of the real track. The MOTA (Multiple Object Tracking Accuracy) is one of the most important evaluation metrics, as is the HOTA (Higher Order Tracking Accuracy). The MT (Mostly Tracked) indicates the percentage of objects that are tracked successfully for more than 80% of the trajectories; the ML (Mostly Lost) indicates the percentage of objects that are tracked successfully for more than 80% of the trajectories. ↑ indicates that larger values are better, ↓ indicates that the smaller the value, the better.
4.2. Ablation Experiment
In this section, we evaluate our work through ablation experiments and comparisons. The experiments use CenterNet object detection model parameters on the COCO [43] dataset to initialize the algorithm model using a deep aggregation network (DLA-34) as the backbone network, which uses a tree structure to fuse semantic information and spatial features from the shallow and deep layers. The Adam optimizer is used to train 35 epochs on the MOT16 dataset, with the batch size set to 12, the initial learning rate set to , and the attenuation at the 25th epoch set to . The response threshold for predicting the distance difference loss is set to 0.5; the Embedding matching threshold is 0.4; the IoU matching threshold is 0.5; the high detection score threshold is 0.6; the low detection score threshold is 0.2; and the trajectory initialization threshold is 0.7. In order to verify the effectiveness of each module, the corresponding ablation experiments were conducted on the MOT16 dataset, and common MOT official evaluation methods were used to verify the effectiveness of each part on the key parameters, and the specific results are shown in Table 1.

Table 1.
REACTrack ablation experiments. √ denotes addition of this module to the base line, which is FairMOT. PDDL, EFGCN, and ACM denote the Predictive Distance Difference Loss, Effective Feature Graph Convolutional Neural Network, and Association Correction modules, respectively. The best results are shown in bold.
By adding the Predicted Distance Difference Loss PDDL, MOTA improves by 2.2% and IDF1 improves by 2.8%, and the effective enhancement of IDF1 proves that the quality of trajectory tracking is optimized. By adding PDDL + EFGCN, MOTA is improved from 73.9 to 77.2, and IDF1 is improved from 78.2 to 80.3, which shows the effect of the two modules working together to effectively improve the detection accuracy, and also alleviate the dependence of Re-ID on the detection performance, which can effectively improve the tracking effect. Furthermore, adding ACM, MOTA increases from 77.2 to 81.1 and IDF1 increases from 80.3 to 82.4, which shows that the index is significantly improved when the three networks work together.
4.3. Comparison with State-of-the-Art Methods
In this section, we compare the performance of REACTrack with previous MOT methods on MOT16. As shown in Table 2, REACTrack achieves the best results on a variety of metrics and outperforms the comparable methods compared by a wide margin, especially on the MOTA, HOTA, IDF1 and IDS metrics.
Table 2.
MOT 16 Results. # indicates one-shot method. * indicates other joint detection and tracking methods which adopt non-ReID methods for data association. The best results are shown in bold.
In order for our algorithm to be compared with ByteTrack, it will be based on FairMOT as shown in Table 3. In order to evaluate the effectiveness of EFGCN Re-ID and ACM, we compare it with ByteTrack using different patterns. The first row represents the tracking process embedded by FairMOT combined with Re-ID. The second row indicates the combination of FairMOT with our proposed EFGCN Re-ID. The MOTA is improved by 5.1% and the IDF1 is improved by 2.5%, so the features extracted by EFGCN are more effective, and it also reduces the dependence on the detection performance and improves the tracking effectiveness. The fourth row compares our ACM algorithm with BYTE. The MOTA improves from 70.3 to 73.4 and the IDF1 improves from 73.2 to 74.8, indicating that our proposed method improves the tracking ability because of the embedding of the EFGCN Re-ID in the correlation process as well as the in-depth processing judgments of the ACM for the occluded targets. The IDS decreases from 236 to 221, which indicates better robustness of tracking.
Table 3.
Comparison with ByteTrack based on FairMOT in MOT17. The best results are shown in bold.
As shown in Table 4, we have compared the performance of REACTrack with the previous MOT method on MOT17. In the one-shot method approach, REACTrack improved the IDF1 metric of FairMOT from 72.3 to 80.1, improves MOTA from 73.7 to 79.2, improves HOTA from 59.3 to 62.8, and reduces the IDs from 3303 to 2031. Compared with the BYTE, we can see that Simple Track improves IDF1 from 77.3 to 80.1 and reduces ID from 2196 to 2031, and the HOTA of both methods is also close. This shows that our tracking method is more effective than the JDE strategy, and the detector used does not want to pass compared to the BYTE strategy, and it also shows that our proposed prediction of the distance difference loss is effective for MOTA, and also the reduction of the ID value shows that our proposed EFGCN and trajectory correlation method can can improve the quality of the features, and reduces the number of switching of the IDs in the case of target occlusion.
Table 4.
MOT 17 Results. # indicates one-shot method. * indicates other joint detection and tracking methods which adopt non-ReID methods for data association.
4.4. Visualization Results
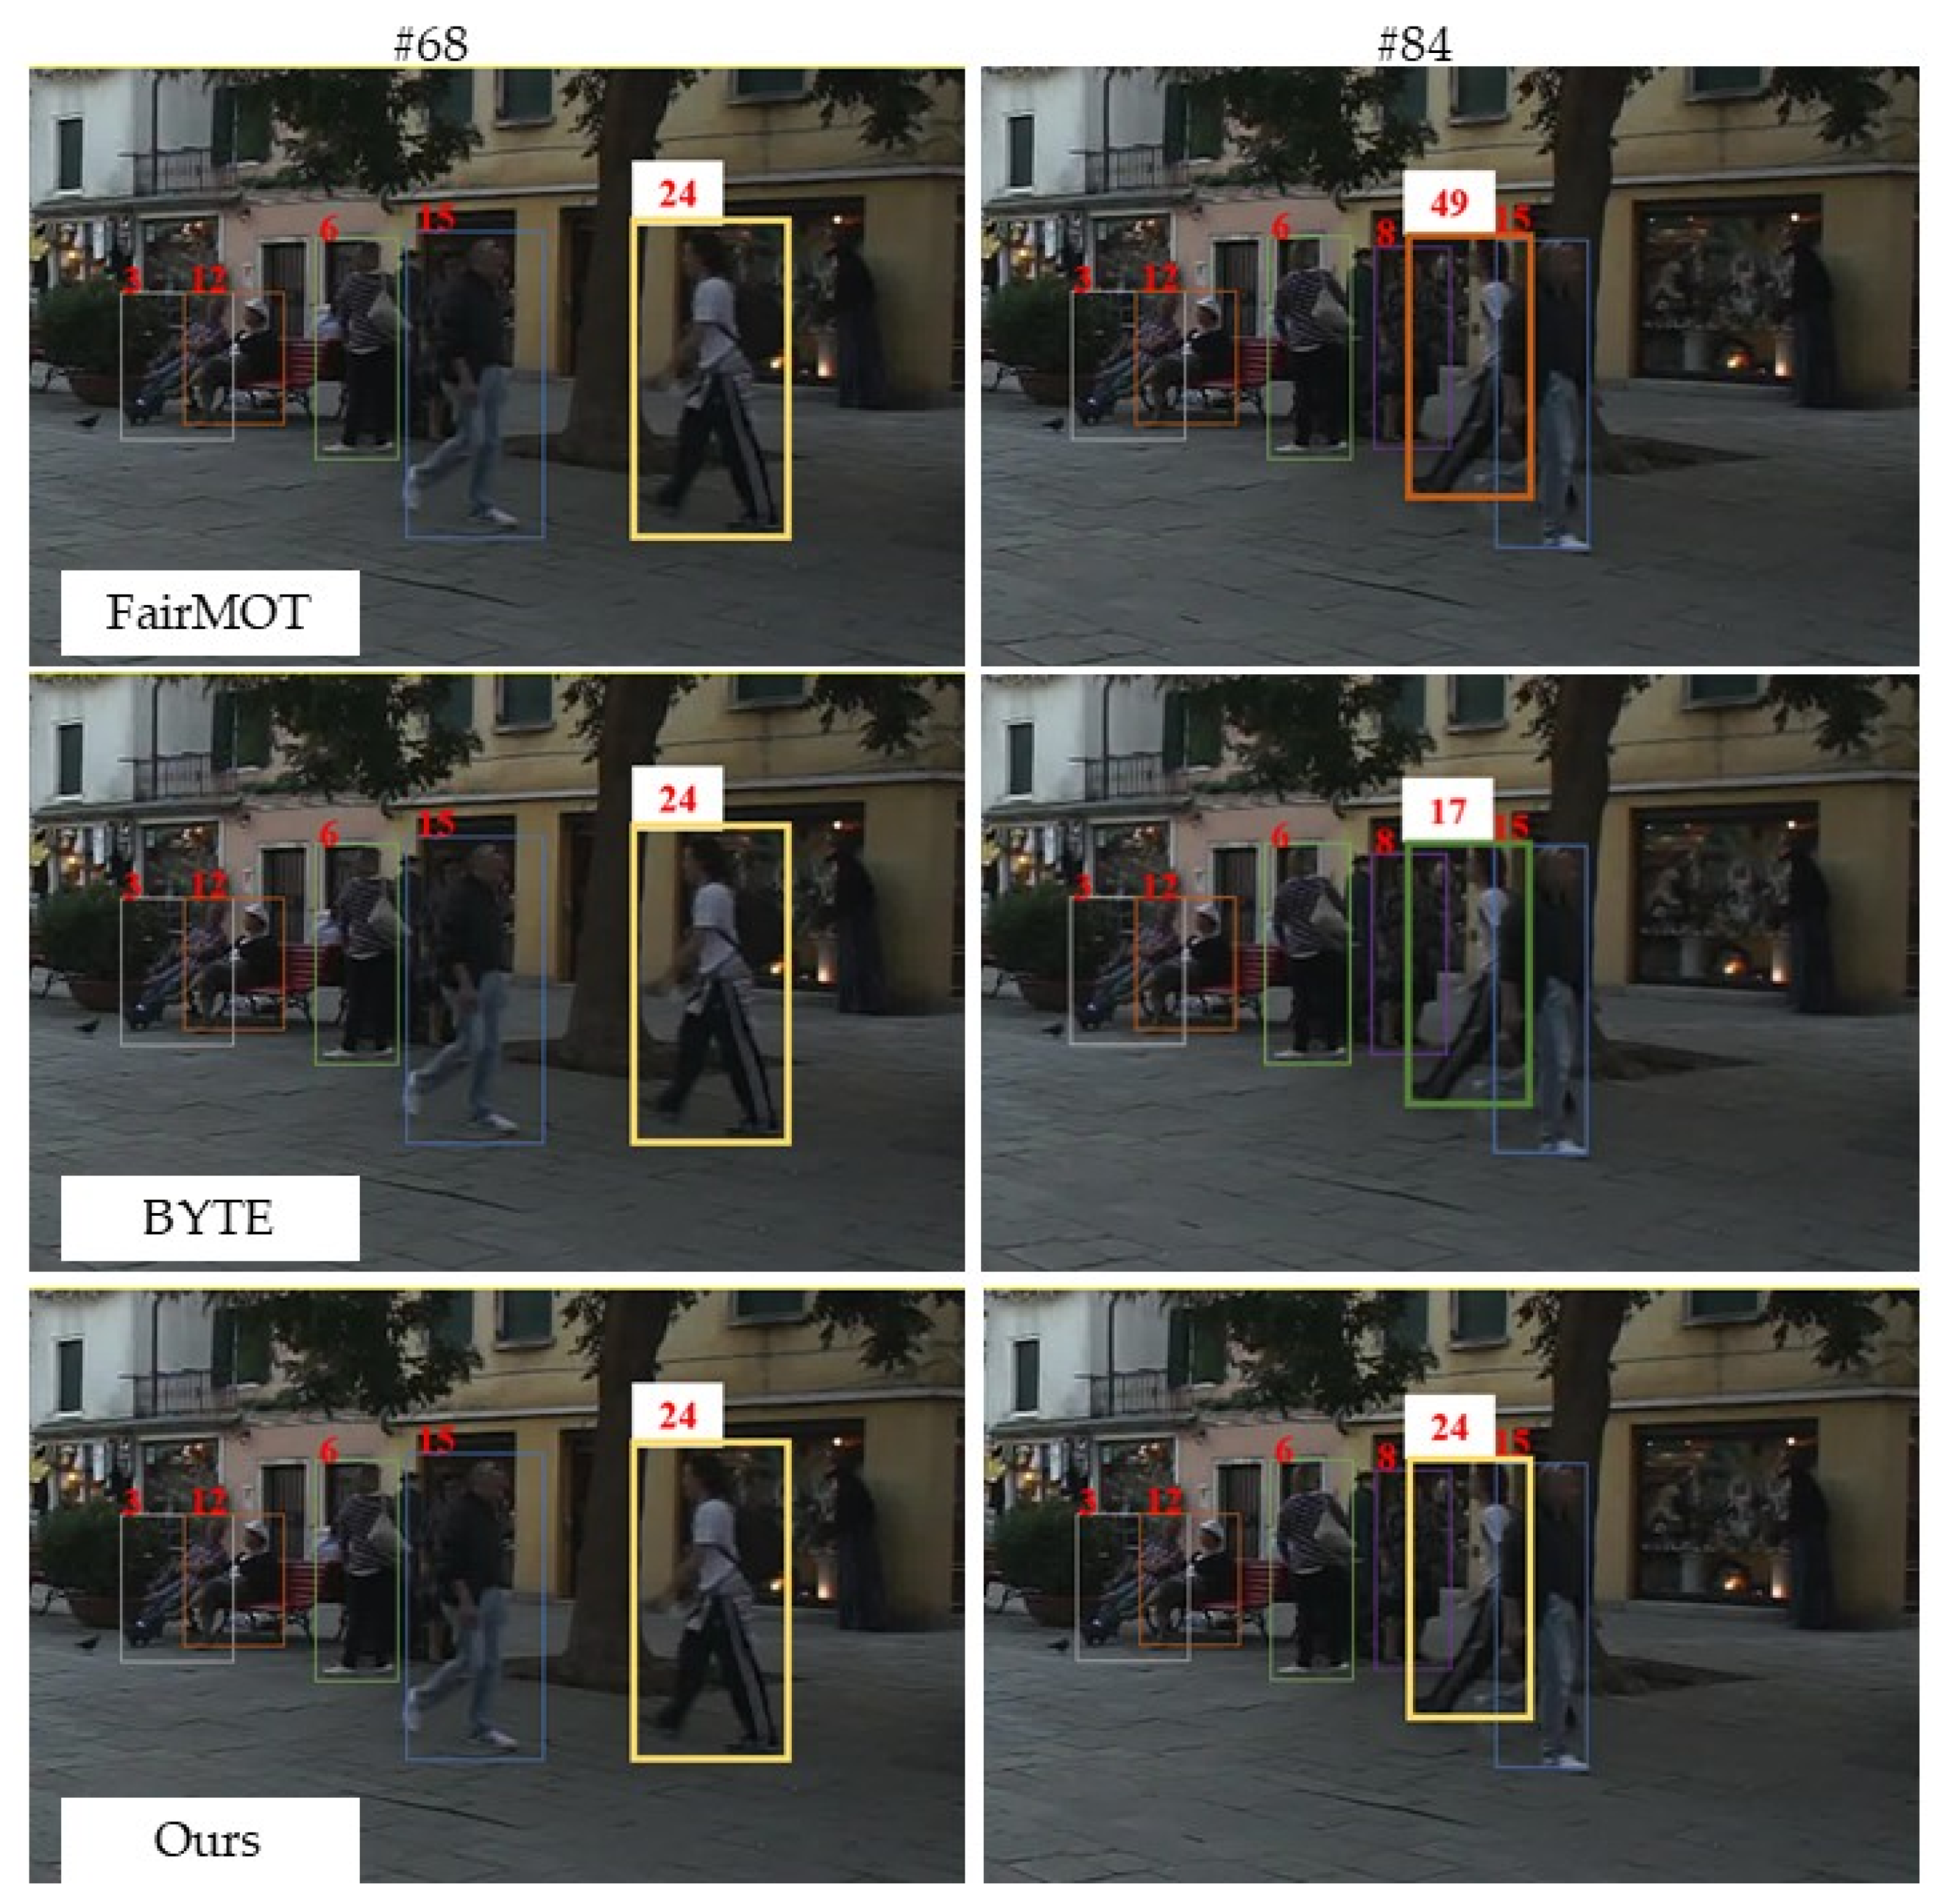
We show in Figure 5 that a number of scenarios that are prone to identity switching and contain sequences from MOT17. We used different tracking methods to generate the visualization results. It can be seen that REACTrack can effectively handle the identity switching problem due to tracking target occlusion. In addition, Figure 6 and Figure 7 show some tracking examples on the MOT17 dataset.
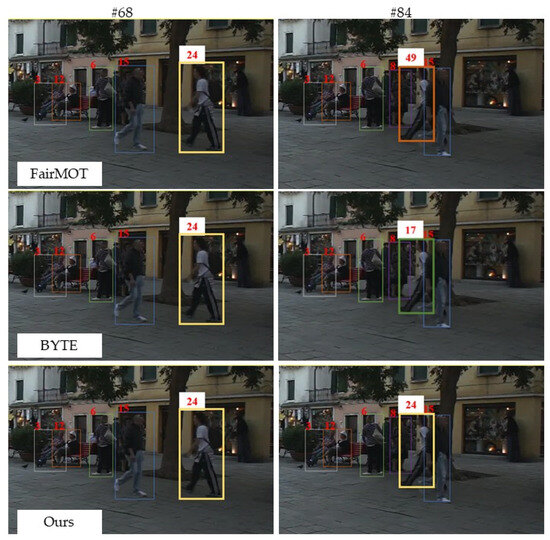
Figure 5.
MOT17-01 tracking results. Robustness of our tracking strategy compared to BYTE and FairMOT methods. The same number and color indicate that the identity of the target has not changed. The # number indicates that the frame number in mot17 video sequence.
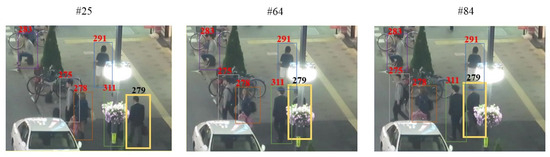
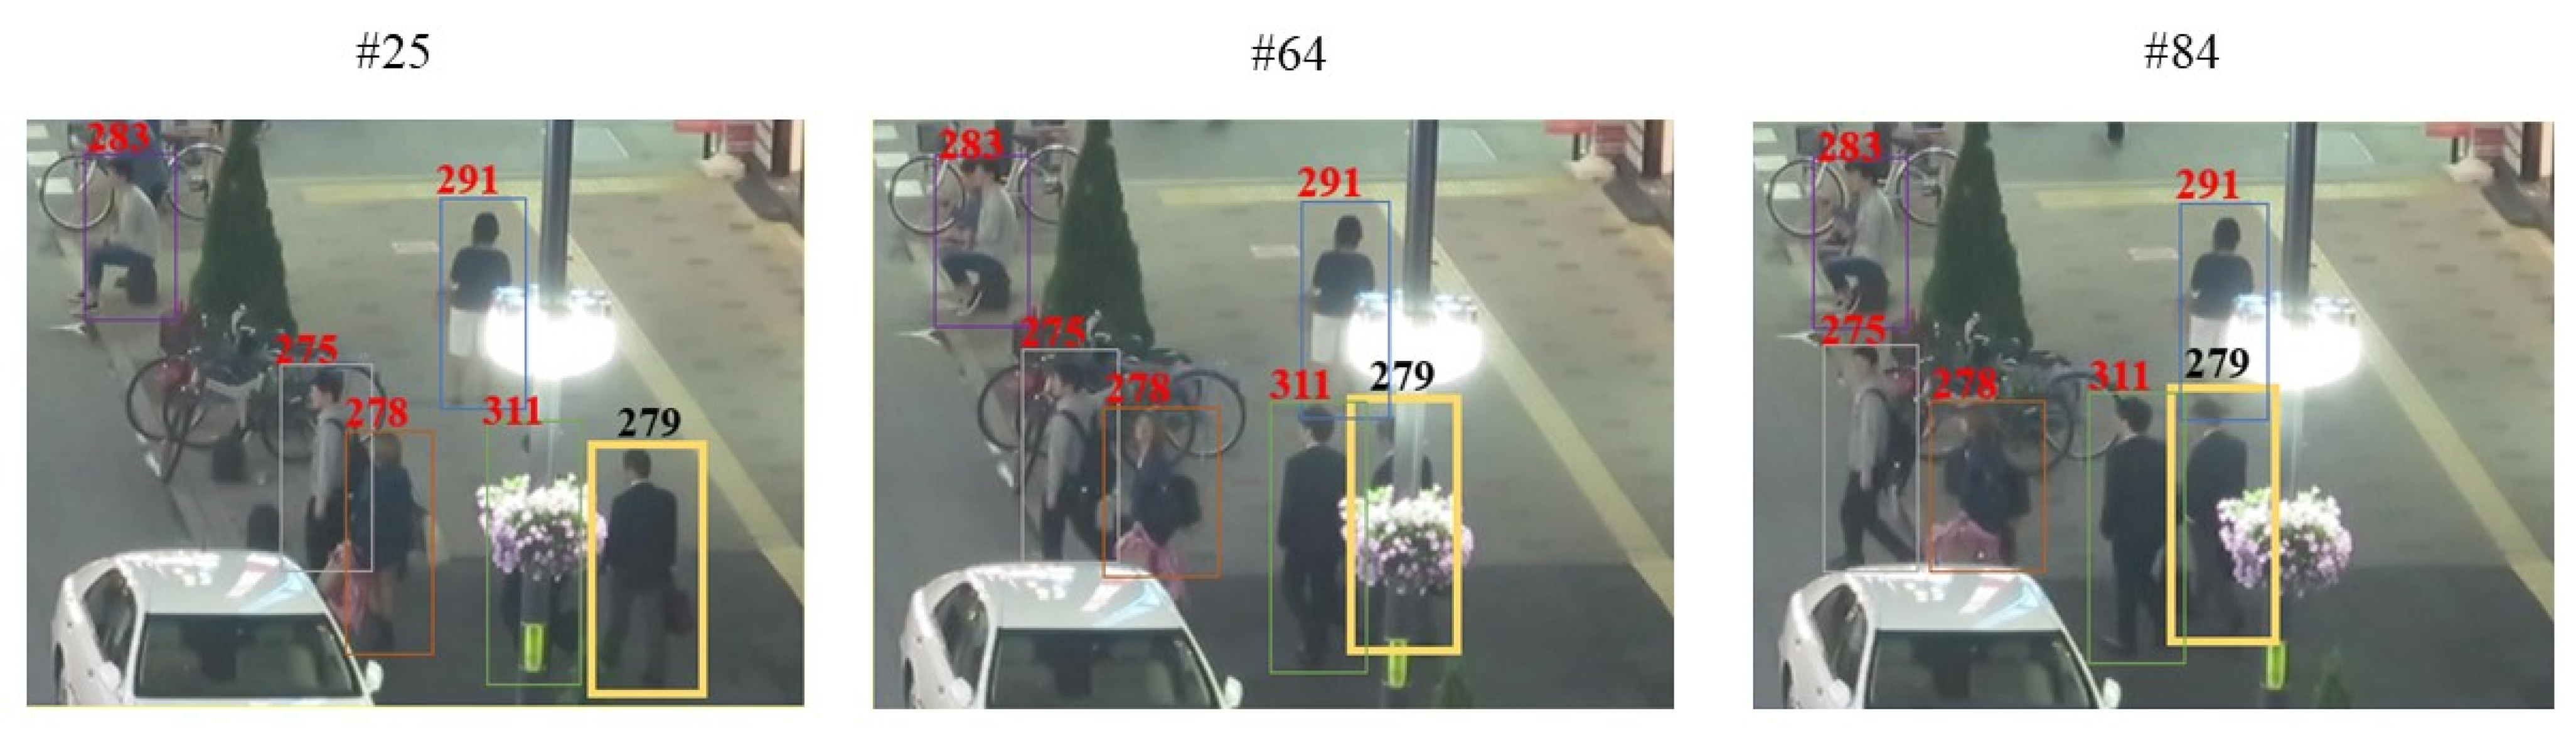
Figure 6.
MOT17-04 tracking results. There is a strong light source interference in the video, and the target pedestrians are occluded. In this paper, we used PDDL to predict the position of the target, and even if the target with ID 279 is occluded in the 64th frame of the video, the target can still be tracked according to the predicted position. The # number indicates that the frame number in mot17 video sequence.

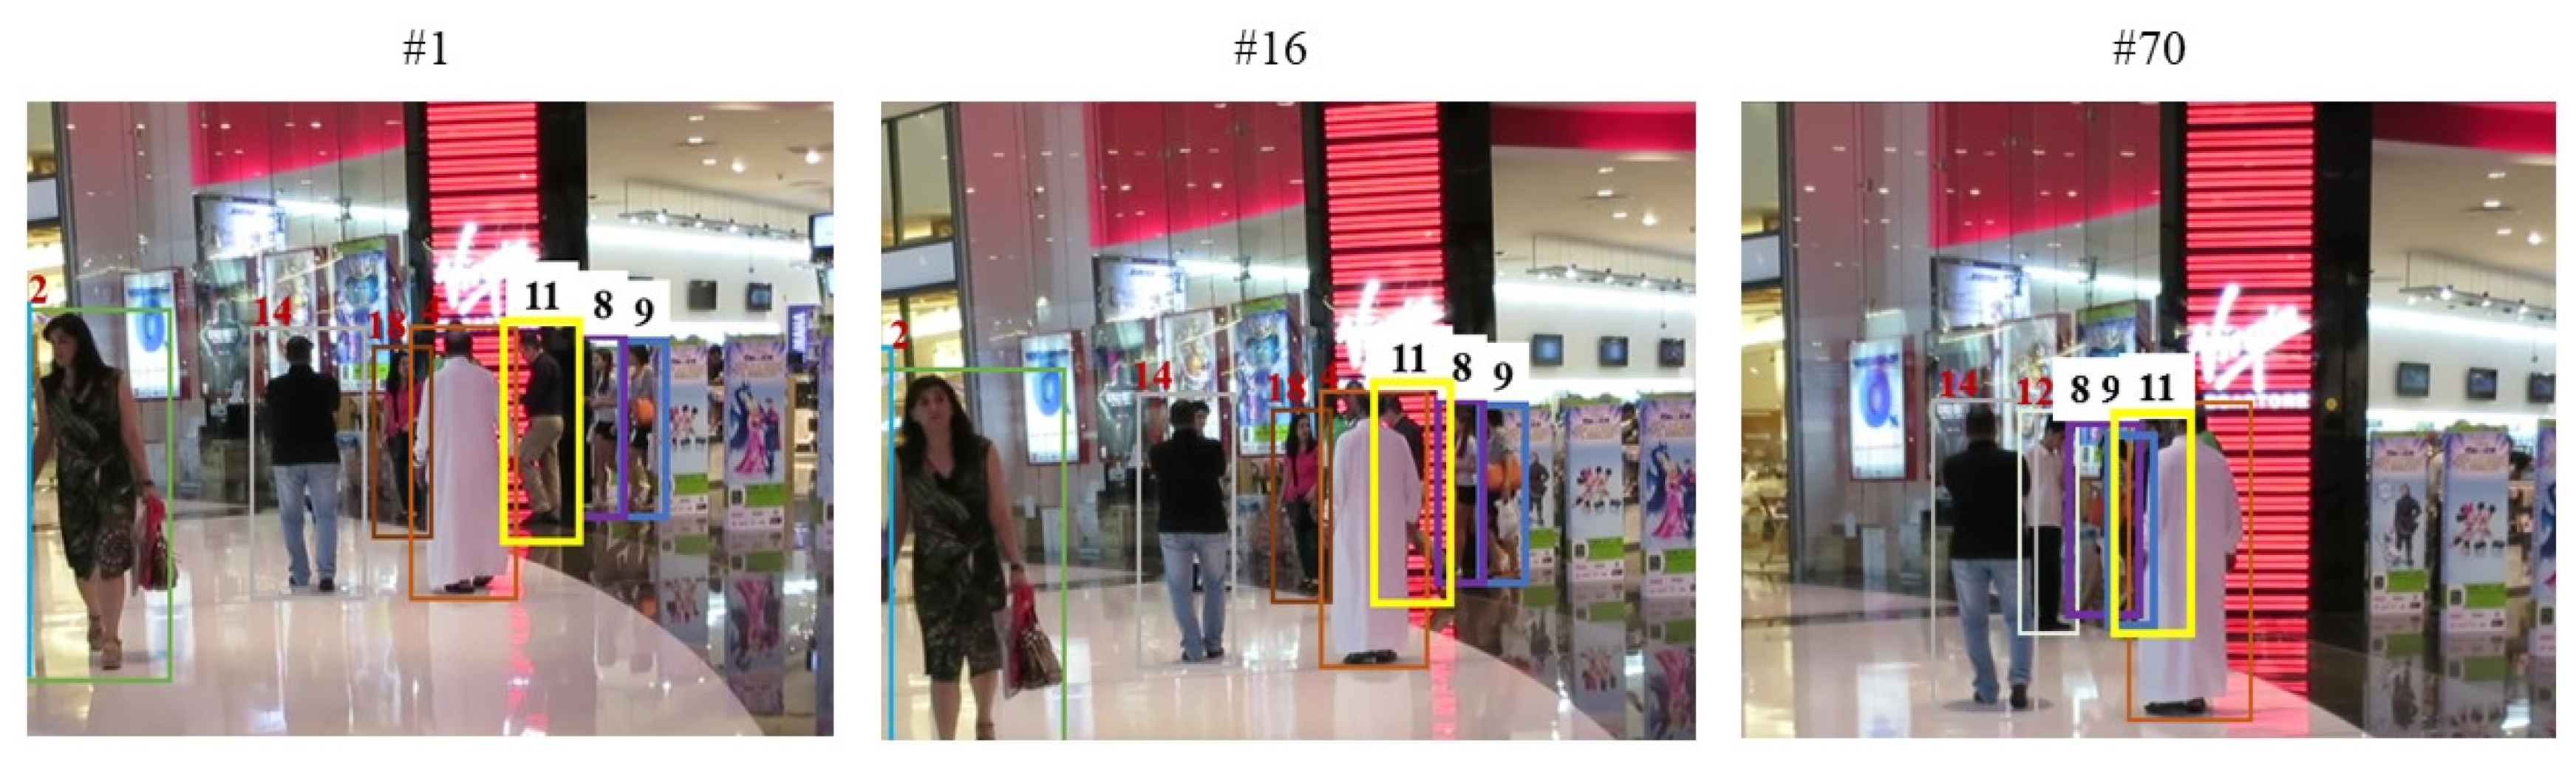
Figure 7.
MOT17-12 tracking results (frame numbers are shown in the upper left corner of each fra me). The video sequence is the data captured in the camera motion state; the target scale, and relative coordinates will change, labeling two small scale and occluded typical targets. No. 8 and No. 9—two companionable women appeared from the doorway of the store after occlusion and left. No. 11—man wearing black after occlusion after the camera advances a number of frames after the scale of the target becomes larger. The # number indicates that the frame number in mot17 video sequence.
In the case of a moving picture, motion blur is likely to occur during tracking. At this point, it becomes crucial to guarantee the feature quality based on the basis. The method in this paper has used is EFGCN, which can guarantee the robustness of the pedestrian feature quality and the effectiveness of tracking under camera motion conditions.
5. Conclusions
In this paper, we have proposed a Predicted Distance Difference Loss, or PDDL, for the JDE-based MOT method to mitigate the detection of centroid offsets, and the PDDL can be easily applied to existing trackers to improve not only tracking performance but also detection accuracy. In addition, we have designed an EFGCN that extends the effective feature range for mitigating Re-ID’s dependence on detection performance and improving feature quality, and have proposed a trajectory correlation correction strategy, ACM, to minimize the loss of occluded targets. Together, these form REACTrack, which has achieved 62.8 HOTA and 80.1 IDF1 on the MOT17 dataset, ranking first among all JDE-based methods.
In future work, we will consider enhancing target features in the temporal dimension and designing an algorithm that can be combined with cross-camera, multi-object tracking and applied to a wider range of scenarios.
Author Contributions
Conceptualization, Y.P. and J.L.; methodology, Y.P. and J.L.; software, J.L.; validation, J.L.; investigation, J.L.; writing—original draft preparation, J.L.; writing—review and editing, Y.P. and J.L. All authors have read and agreed to the published version of the manuscript.
Funding
This research was funded by the [Natural Science Foundation of Jilin Province] grant number [20210101180JC].
Institutional Review Board Statement
Not applicable.
Informed Consent Statement
Not applicable.
Data Availability Statement
The MOT16 and MOT17 datasets presented in this study are openly available in the MOT16 paper [38], respectively.
Conflicts of Interest
The authors declare no conflict of interest.
References
- Ahn, H.; Cho, J. Research of multi-object detection and tracking using machine learning based on knowledge for video surveillance system. Pers. Ubiquitous Comput. 2022, 26, 385–394. [Google Scholar] [CrossRef]
- Yang, X.; Ye, J.; Lu, J. Box-grained reranking matching for multi-camera multi-target tracking. In Proceedings of the IEEE/CVF Conference on Computer Vision and Pattern Recognition (CVPR), New Orleans, LA, USA, 19–24 June 2022; pp. 3096–3106. [Google Scholar]
- Mahmoudi, N.; Ahadi, S.; Rahmati, M. Multi-target tracking using CNN -based features: CNNMTT. Multimed. Tools Appl. 2019, 78, 7077–7096. [Google Scholar] [CrossRef]
- Chandrakar, R.; Raja, R.; Miri, R.; Sinha, U.; Kushwaha, A.K.S.; Raja, H. Enhanced the moving object detection and object tracking for traffic surveillance using RBF-FDLNN and CBF algorithm. Expert Syst. Appl. 2022, 191, 116306. [Google Scholar] [CrossRef]
- Zhou, X.; Koltun, V.; Krähenbühl, P. Tracking objects as points. In Proceedings of the European Conference on Computer Vision (ECCV), Online, 23–28 August 2020; pp. 474–490. [Google Scholar]
- Hou, Y.N.; Ma, Z.; Liu, C.X. Learning Lightweight Lane Detection CNNs by Self Attention Distillation. In Proceedings of the IEEE International Conference on Computer Vision (ICCV), Seoul, Republic of Korea, 27 October–2 November 2019; pp. 1013–1021. [Google Scholar]
- Zhang, Y.; Sun, P.; Jiang, Y.; Yu, D.; Weng, F.; Yuan, Z.; Wang, X. Bytetrack: Multi-object tracking by associating every detection box. In Proceedings of the European Conference on Computer Vision (ECCV), Tel Aviv, Israel, 23–27 October 2022; pp. 1–21. [Google Scholar]
- Jia, L.; Yan, P. Multi-Target Multi-Camera Tracking Based on Mutual Information-Temporal Weight Aggregation Person Re-Identification. In Proceedings of the IEEE 5th International Conference on Electronic Information and Communication Technology (ICEICT), Hefei, China, 21–23 August 2022; pp. 149–151. [Google Scholar]
- Meinhardt, T.; Kirillov, A.; Leal-Taixe, L.; Feichtenhofer, C. Trackformer: Multi-object tracking with transformers. In Proceedings of the IEEE/CVF Conference on Computer Vision and Pattern Recognition (CVPR), New Orleans, LA, USA, 19–24 June 2022; pp. 8844–8854. [Google Scholar]
- Zhu, X.; Su, W.; Lu, L.; Li, B.; Wang, X.; Dai, J. Deformable detr: Deformable transformers for end-to-end object detection. arXiv 2020, arXiv:2010.04159. [Google Scholar]
- Carion, N.; Massa, F.; Synnaeve, G.; Usunier, N.; Kirillov, A.; Zagoruyko, S. End-to-end object detection with transformers. In Proceedings of the European Conference on Computer Vision (ECCV), Glasgow, UK, 23–28 August 2020; Springer: Cham, Switzerland, 2020; pp. 213–229. [Google Scholar]
- Zhu, Y.; Liang, S.; Gong, M.; Yan, J. Decomposed POMDP optimization-based sensor management for multi-target tracking in passive multi-sensor systems. IEEE Sens. J. 2022, 22, 3565–3578. [Google Scholar] [CrossRef]
- Liu, Z.; Shang, Y.; Li, T.; Chen, G.; Wang, Y.; Hu, Q.; Zhu, P. Robust Multi-Drone Multi-Target Tracking to Resolve Target Occlusion: A Benchmark. IEEE Trans. Multimed. 2023, 25, 1462–1476. [Google Scholar] [CrossRef]
- Cao, J.; Pang, J.; Weng, X. Observation-centric sort: Rethinking sort for robust multi-object tracking. arXiv 2022, arXiv:2203.14360. [Google Scholar]
- Luo, W.; Xing, J.; Milan, A.; Zhang, X.; Liu, W.; Kim, T. Multiple object tracking: A literature review. Artif. Intell. 2021, 293, 103448. [Google Scholar] [CrossRef]
- Ren, S.; He, K.; Girshick, R.; Sun, J. Faster R-CNN: Towards real-time object detection with region proposal networks. Adv. Neural Inf. Process. Syst. 2015, 28, 91–99. [Google Scholar] [CrossRef]
- He, K.; Gkioxari, G.; Dollár, P.; Girshick, R. Mask R-CNN. In Proceedings of the IEEE International Conference on Computer Vision, Venice, Italy, 22–29 October 2017; pp. 2961–2969. [Google Scholar]
- Redmon, J.; Farhadi, A. YOLOv3: An Incremental Improvement. arXiv 2018, arXiv:1804.02767. [Google Scholar]
- Peng, J.; Wang, C.; Wan, F. Chained-Tracker: Chaining Paired Attentive Regression Results for End-to-End Joint Multiple-Object Detection and Tracking. In Proceedings of the European Conference on Computer Vision (ECCV), Online, 23–28 August 2020; pp. 145–161. [Google Scholar]
- Tian, Z.; Shen, C.; Chen, H. Fcos: A simple and strong anchor-free object detector. IEEE Trans. Pattern Anal. Mach. Intell. 2020, 44, 1922–1933. [Google Scholar] [CrossRef] [PubMed]
- Ciaparrone, G.; Sanchez, F.; Tabik, S. Deep learning in video multi-object tracking: A survey. Neurocomputing 2020, 381, 61–88. [Google Scholar] [CrossRef]
- Chen, L.; Ai, H.; Zhuang, Z. Real-time multiple people tracking with deeply learned candidate selection and person re-identification. In Proceedings of the 2018 IEEE International Conference on Multimedia and Expo, San Diego, CA, USA, 23–27 July 2018; pp. 1–6. [Google Scholar]
- Bayraktar, E. Improved Object Re-Identification via More Efficient Embeddings. Turk. J. Electr. Eng. Comput. Sci. 2023, 31, 282–294. [Google Scholar] [CrossRef]
- Wang, Z.D.; Zheng, L.; Liu, Y.X. Towards real-time multi-object tracking. In Proceedings of the European Conference on Computer Vision (ECCV), Online, 23–28 August 2020; pp. 107–122. [Google Scholar]
- Zhang, Y.F.; Wang, C.Y.; Wang, X.G. FairMOT: On the Fairness of Detection and Re-identification in Multiple Object Tracking. Int. J. Comput. Vis. 2021, 129, 3069–3087. [Google Scholar] [CrossRef]
- Bergmann, P.; Meinhardt, T.; Leal-Taixé, L. Tracking without bells and whistles. arXiv 2019, arXiv:1903.05625. [Google Scholar]
- Bayraktar, E.; Wang, Y.; Del Bue, A. Fast re-OBJ: Real-time object re-identification in rigid scenes. Mach. Vis. Appl. 2022, 33, 97. [Google Scholar] [CrossRef]
- Suljagic, H.; Bayraktar, E.; Çelebi, N. Similarity based person re-identification for multi-object tracking using deep Siamese network. Neural Comput. Appl. 2022, 34, 18171–18182. [Google Scholar] [CrossRef]
- Yi, C.Y.; Qiang, Z.; Bing, B.N.; Wen, D.Z.; Ming, H.X.; Xiao, K.Y. Learning context graph for person search. In Proceedings of the IEEE Conference on Computer Vision and Pattern Recognition, Long Beach, CA, USA, 16–20 June 2019; pp. 2158–2167. [Google Scholar]
- Yan, T.S.; Hong, S.L.; Shuai, Y.; Da, P.C.; Xiao, G.W. Person re-identification with deep similarity-guided graph neural network. In Proceedings of the European Conference on Computer Vision (ECCV), Munich, Germany, 8–14 September 2018; pp. 486–504. [Google Scholar]
- Wu, Y.; Bourahla, O.E.F.; Li, X.; Wu, F.; Tian, Q.; Zhou, X. Adaptive graph representation learning for video person re-identification. IEEE Trans. Image Process. 2020, 29, 8821–8830. [Google Scholar] [CrossRef]
- Ye, M.; Shen, J.; Lin, G. Deep learning for person re-identification: A survey and outlook. IEEE Trans. Pattern Anal. Mach. Intell. 2021, 44, 2872–2893. [Google Scholar] [CrossRef]
- Pang, J.M.; Qiu, L.L.; Li, X.; Chen, H.F.; Li, Q.; Trevor, D.; Yu, F. Quasi-dense similarity learning for multiple object tracking. In Proceedings of the IEEE/CVF Conference on Computer Vision and Pattern Recognition (CVPR), Online, 19–25 June 2021; pp. 164–173. [Google Scholar]
- Liang, C.; Zhang, Z.; Lu, Y.; Zhou, X.; Li, B.; Ye, X.; Zou, J. Rethinking the competition between detection and re-id in multi-object tracking. IEEE Trans. Image Process. 2020, 31, 3182–3196. [Google Scholar] [CrossRef]
- Xiao, L.W.; Abhinav, G. Videos as space-time region graphs. In Proceedings of the European Conference on Computer Vision (ECCV), Munich, Germany, 8–14 September 2018; pp. 399–417. [Google Scholar]
- Kendall, A.; Gal, Y.; Cipolla, R. Multi-task learning using uncertainty to weigh losses for scene geometry and semantics. In Proceedings of the IEEE Conference on Computer Vision and Pattern Recognition, Salt Lake City, UT, USA, 18–23 June 2018; pp. 7482–7491. [Google Scholar]
- Kuhn, H.W. The Hungarian method for the assignment 10 computer engineering and applications problem. Nav. Res. Logist. Q. 1955, 2, 83–97. [Google Scholar] [CrossRef]
- Milan, A.; Leal-Taixé, L.; Reid, I. MOT16: A benchmark for multi-object tracking. arXiv 2016, arXiv:1603.00831. [Google Scholar]
- Wu, B.; Nevatia, R.T. Detection and tracking of multiple, partially occluded humans by Bayesian combination of edgelet based part detectors. Int. J. Comput. Vis. 2007, 75, 247–266. [Google Scholar] [CrossRef]
- Bernardin, K.; Stiefelhagen, R. Evaluating Multiple Object Tracking Performance: The CLEAR MOT Metrics. EURASIP J. Image Video Process. 2008, 2008, 246309. [Google Scholar] [CrossRef]
- Ristani, E.; Solera, F.; Zou, R. Performance Measures and a Data Set for Multi-target, Multi-camera Tracking. In Proceedings of the European Conference on Computer Vision (ECCV), Amsterdam, The Netherlands, 10–16 October 2016; pp. 17–35. [Google Scholar]
- Luiten, J.; Osep, A.; Dendorfer, P. Hota: A higher order metric for evaluating multi-object tracking. Int. J. Comput. Vis. 2021, 129, 548–578. [Google Scholar] [CrossRef]
- Lin, T.; Maire, M.; Belongies, S. Microsoft coco: Common objects in context. In Proceedings of the European Conference on Computer Vision (ECCV), Zurich, Switzerland, 7–13 October 2014; pp. 740–755. [Google Scholar]
- Pang, B.; Li, Y.; Zhang, Y. Tubetk: Adopting tubes to track multi-object in a one-step training model. In Proceedings of the IEEE/CVF Conference on Computer Vision and Pattern Recognition, Seattle, WA, USA, 14–19 June 2020; pp. 6308–6318. [Google Scholar]

Disclaimer/Publisher’s Note: The statements, opinions and data contained in all publications are solely those of the individual author(s) and contributor(s) and not of MDPI and/or the editor(s). MDPI and/or the editor(s) disclaim responsibility for any injury to people or property resulting from any ideas, methods, instructions or products referred to in the content. |
© 2023 by the authors. Licensee MDPI, Basel, Switzerland. This article is an open access article distributed under the terms and conditions of the Creative Commons Attribution (CC BY) license (https://creativecommons.org/licenses/by/4.0/).