Abstract
In this paper, we present a method of calculating cornering stiffness for different camber angles. The method removes the need for measurement data at different camber angles. The camber angle is regarded as equivalent to a local shift of load in the contact patch from one half-side to the other. A simple model is presented to describe the load shift. The cornering stiffness from each side, accounting for their loads, is then assumed to contribute to the total stiffness. The load shift model is validated through two finite element models. Cornering stiffnesses given by the model for two different tires are then compared to the measurements. To show the universality of the method, its application to interpolated measurement data is shown. The proposed method shows promising results for moderate camber angles.
1. Introduction
Cornering stiffness is a critical tire parameter, which has a significant impact on vehicle handling performance [1,2,3,4]. It depends on many things, such as tire size, type, ply, tread design, etc. For a given tire, load and inflation pressure are the two primary entities that influence its cornering stiffness. There is also the camber angle, which has shown a noticeable effect [5,6,7].
Cornering stiffness description with different camber angles has been realized in many tire models, among which Magic Formula (MF) put forward by Pacejka is extensively used in vehicle simulation. Cornering stiffness in MF is expressed considering the influences of load and camber angle [8]. The influence of inflation pressure is also expressed [9]. As a semi-physical model, MF shows high precision in cornering stiffness expression, but a set of parameters are used. The determination of these parameters requires numerous test data: side slip test data under different loads and camber angles are needed. These tests can be done on an indoor tire test rig or outdoor tire test trailer [10,11]. Purchasing or hiring this kind of equipment is very expensive, which makes tire testing a costly task. Different combinations of slip angle, camber angle and load generate a huge workload and long working time. Furthermore, test results under complex input conditions may lead to tire wear, which can influence test accuracy.
UniTire was put forward by Konghui Guo in 1986, and is also a semi-physical model [12,13]. It has been successfully applied to the expression of many tire mechanical characteristics. Cornering stiffness in UniTire is also expressed considering the influences of load and camber angle. In a recent work, inflation pressure and temperature influences were included [14,15]. Similarly to MF, cornering stiffness parameterization of UniTire also needs side slip data under different loads and camber angles. Therefore, the same drawbacks exist as for MF.
The finite element (FE) method has been applied to tire mechanical characteristics research along with the development of computer technique. Since the 1970s, researchers have used the FE model to analyze tire mechanical characteristics. Kaga worked in Yokohama to analyze strain energy density change on each part of the belt layer caused by the drum test rig radius [16]. Kennedy studied the influence of tire belt structure parameters on the stress distribution [17]. After the 1990s, FE analysis software, such as ABAQUS and ANSYS, made tire FE analysis more popular. Tire steady-state and transient simulation, stress and strain distribution analysis can all be carried out through the FE model [18,19,20,21]. The FE model can also express tire material and structural details, which means a vast amount of calculation. When simulating cornering stiffness for different camber angles, either a high performance computer or a long calculating time is needed. Furthermore, mesh elements may experience convergence problems in large deformation situations [22]. Thus, the load, slip angle and camber angle coupling are limited.
In view of the aforesaid problems, it would be time- and resource-saving to remove the need for measurements at different camber angles. This paper proposes a method for obtaining cornering stiffness with varying camber angles based on nothing more than pure side slip characteristics and tire size information. We explore the idea of regarding camber as an equivalence of the load shift in the contact patch.
2. Method Description
For a given tire, the cornering stiffness is dictated by the contact patch geometric characteristics and the contact pressure distribution. Here, the assumption is made that the change in contact pressure distribution due to camber can be simplified as a load shift between the left and right half of the tire, and this load shift will be enough to approximately model the corresponding change in cornering stiffness. In this way, the half tire cornering stiffness could be obtained based on the whole tire cornering stiffness, since the left and right half of the tire are ideally the same in physics. An error may be imported because of the lack of load change description within the half-tire. According to the validation results, this error is acceptable. In this section, we will introduce a method for estimating the load shift due to the camber and use this load to calculate the cornering stiffness at different camber angles.
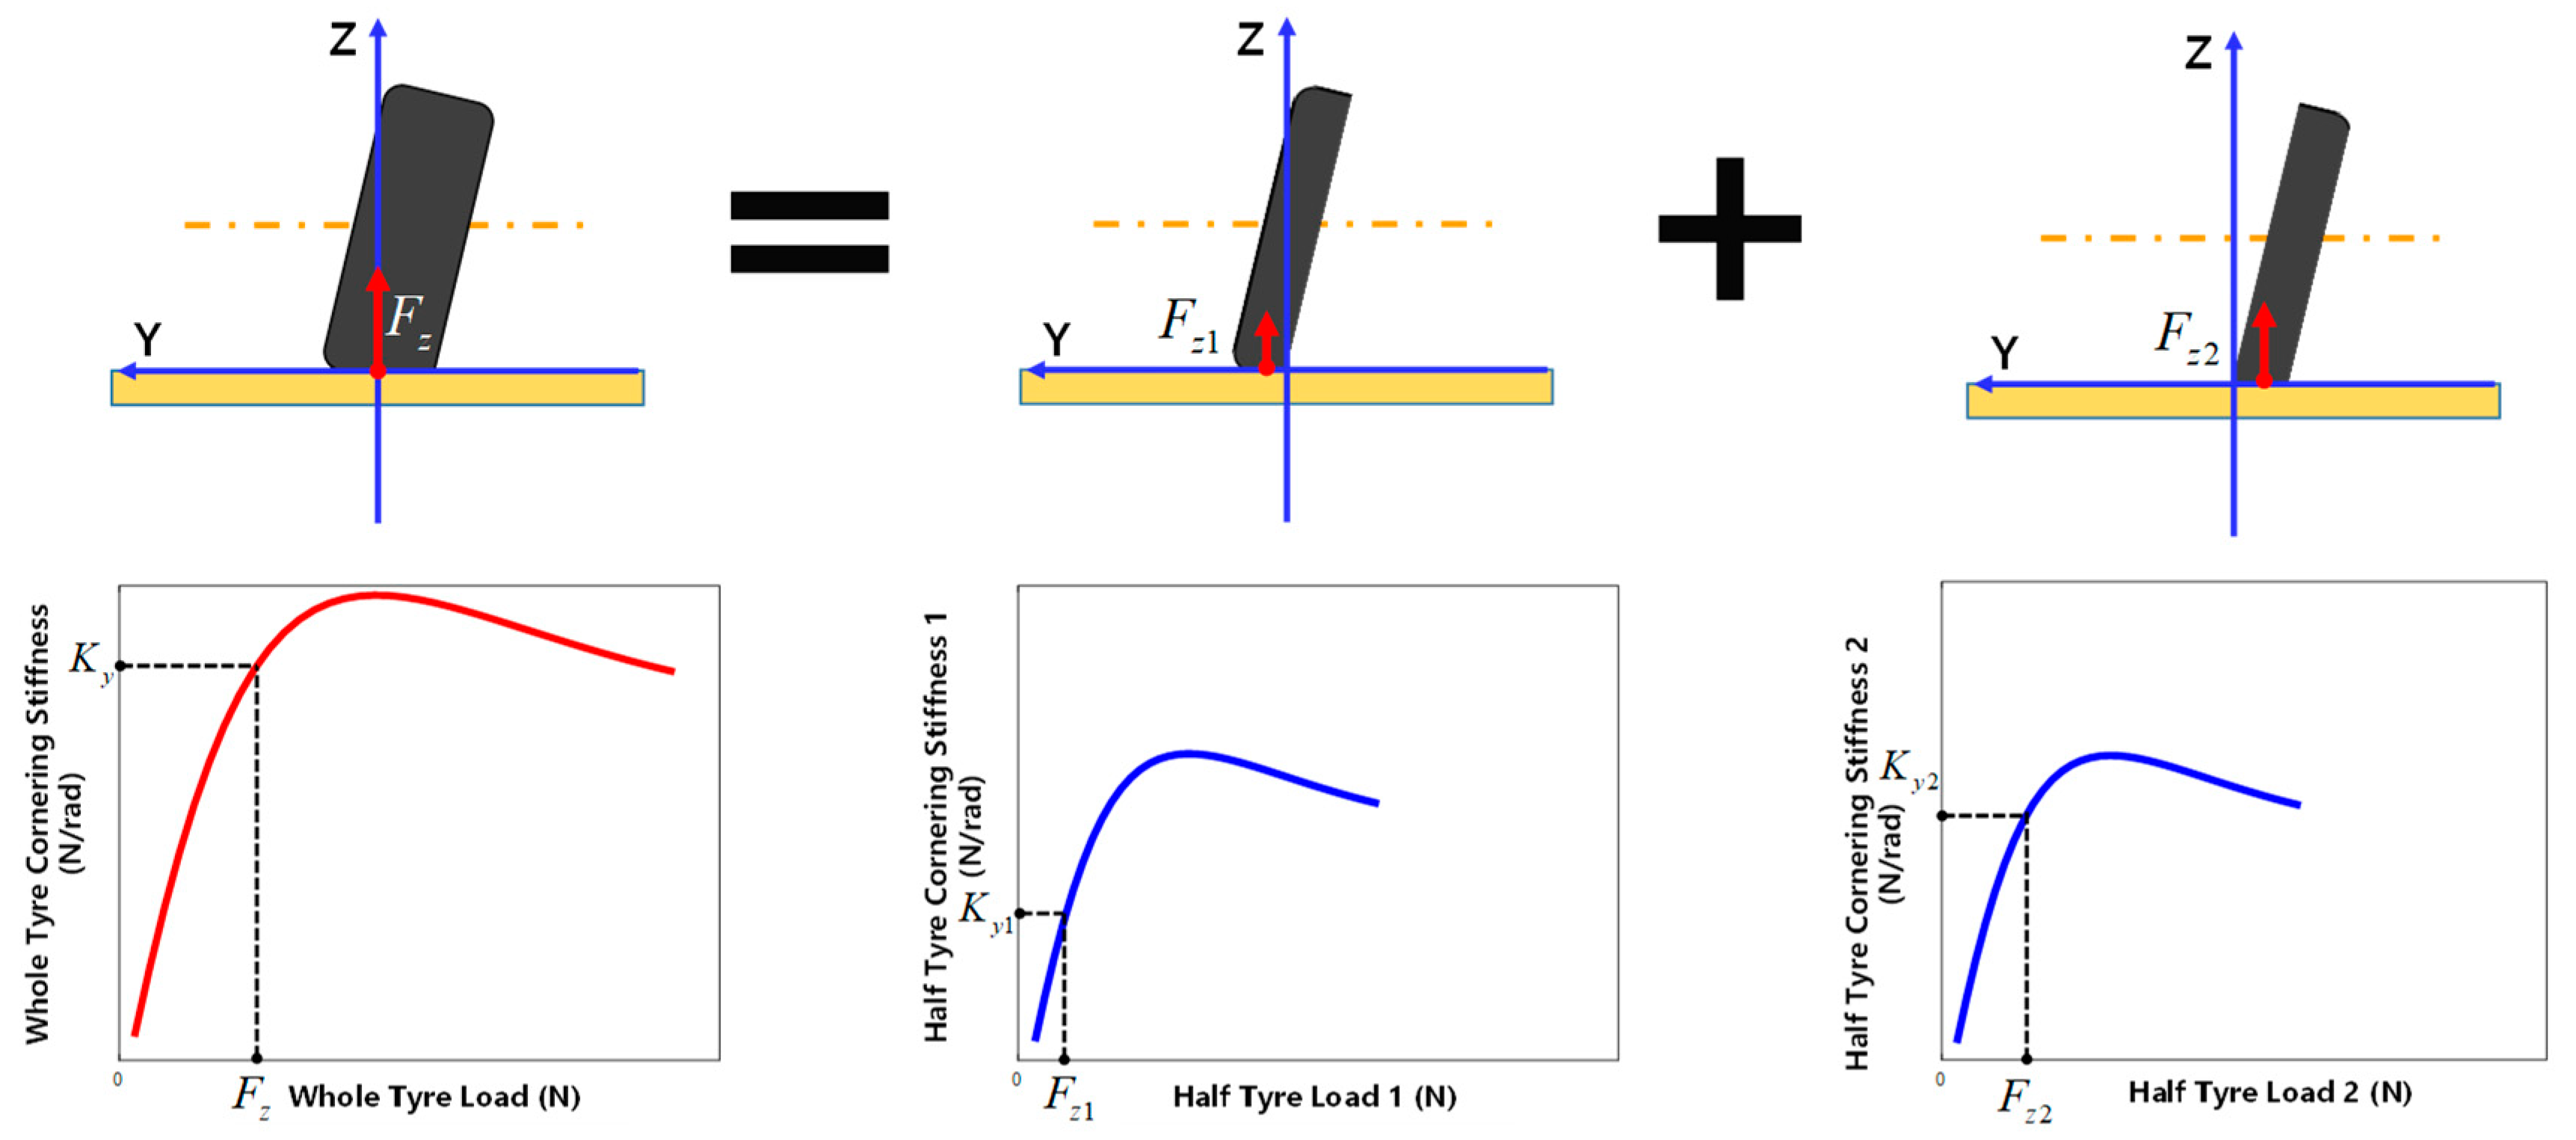
As is shown in Figure 1, if the tire is divided into two parts along its width’s central plane, loads acting on both parts are essentially equal under free rolling conditions. A camber angle will induce a load shift from one part to the other. Since cornering stiffness is strongly dependent on load, the cornering stiffness contribution from each part will also change. Hence, by treating the camber as a load shift, a model of how cornering stiffness changes with camber angle can be obtained as the sum of the cornering stiffness contributions of each part, so that we can write
where and are the load and cornering stiffness of the whole tire, respectively, while and are the corresponding half-tire results.
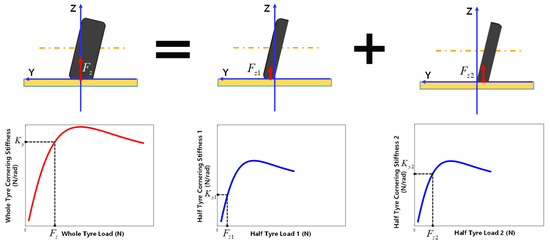
Figure 1.
Diagrammatic view of the proposed calculation method.
2.1. Local Load Calculations
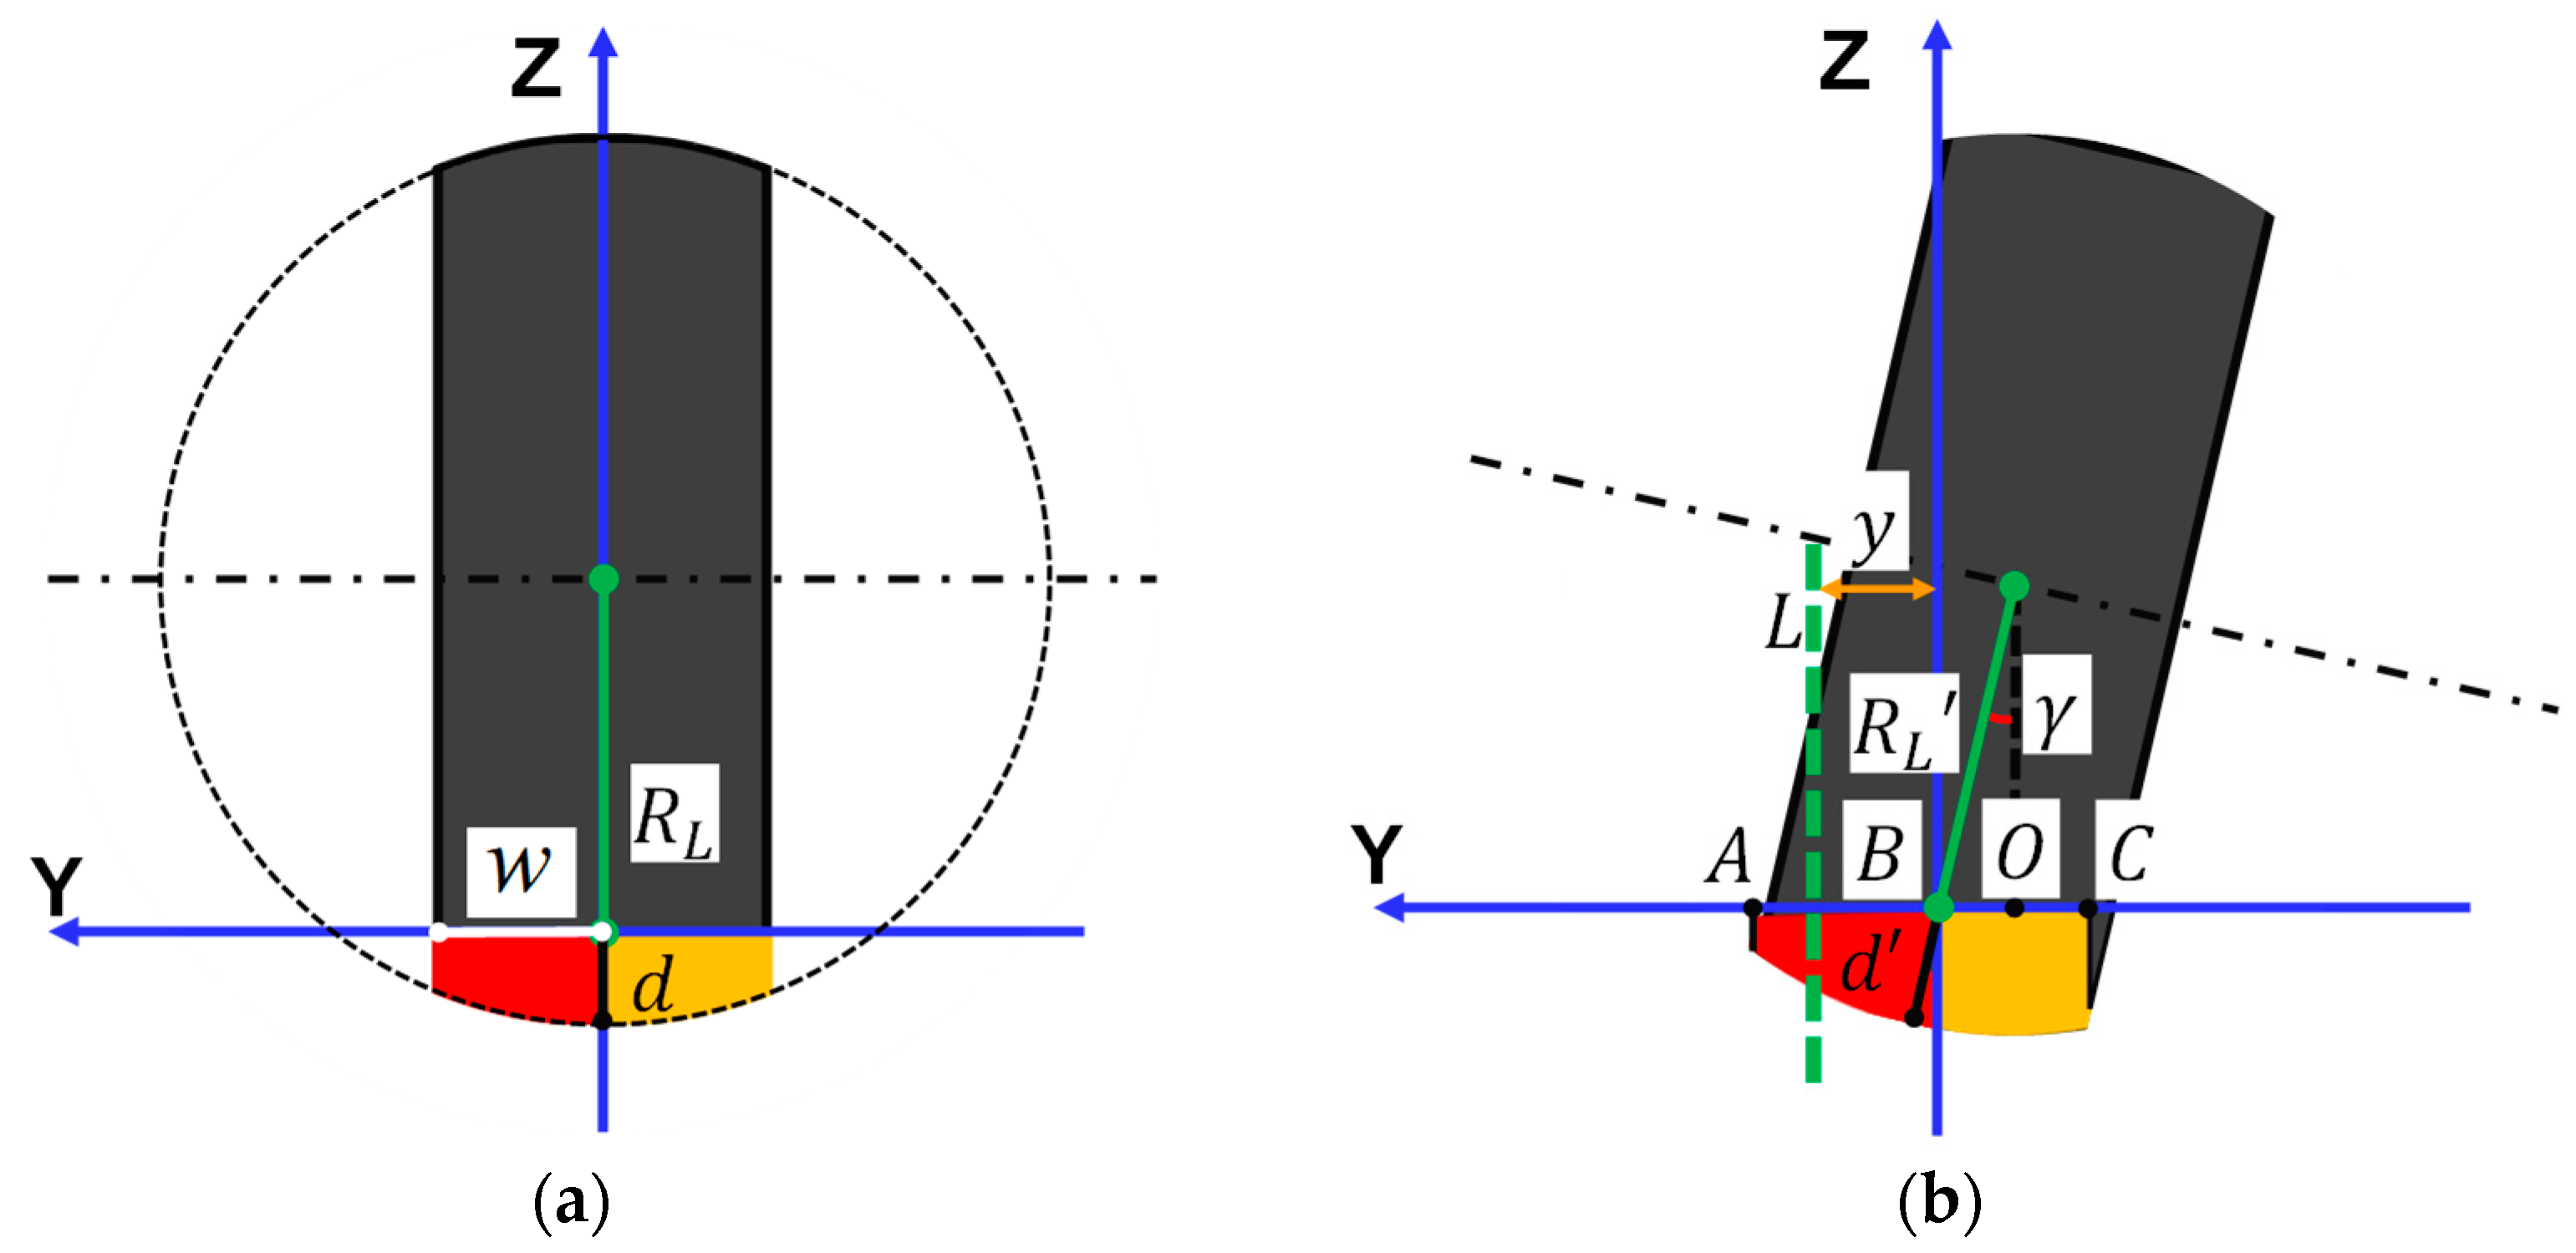
In this section, we assume that the tire is isotropic. To simplify calculations, the tire is also assumed to be shaped like a slice of a sphere, i.e., the tread radius of curvature is equal to the tire unloaded radius (refer to Figure 2a). Two methods for calculating the camber-induced load distribution are proposed: the tilting method and the rotating method.
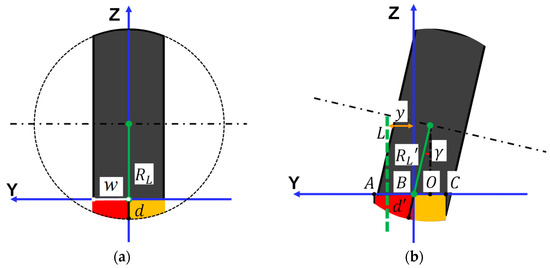
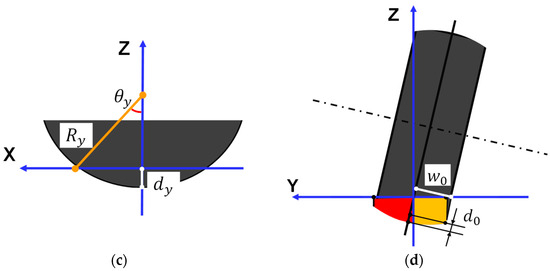
Figure 2.
Cross-section diagrammatic drawing of deformation caused by the load. (a) Deformation at zero camber angle. is the contact patch width of each part, is the radial deformation of the tire, is the loaded radius. (b) Deformation at non-zero camber angle γ. is the radial deformation of the cambered tire. is the loaded radius. Points , and are the deformation boundary projections on Y-axis. Point is the rim centre projection on Y-axis. The green dotted line is located away from point . (c) The lateral view of the plane where the green dotted line is located in Figure 2b. and are the radius and vertical deformation of this plane, respectively. is half of the central angle corresponding to the contact length of this plane. (d) The boundary conditions used in the calculations. is half the width of the tire. is the maximum thickness of the tread.
2.1.1. The Tilting Method
The author put forward the tilting method inspired by the geometric relationship between the tire and the road. The intersection of the undeformed tire and the road is used for indicating the tire’s vertical deformation. Deformation without camber angle is shown in Figure 2a. By tilting the tire, Figure 2b shows the deformation change. In Figure 2b, the deformation volume boundaries of two tire parts are perpendicular to the road, because the load is perpendicular to the road.
In Figure 2, the deformation volume shown in red is proportional to the load on the left part, while that shown in yellow is proportional to the load on the right part. Taking the point as the origin of the integral coordinate system in Figure 2b, we have:
where is the tire unloaded radius. is used to determine the position of point and choosing the formula of (, point is on the tread. , and point reaches its maximum, as is shown in Figure 2b).
where is used to determine the position of and choose the formula of (, point is on the tread. , point reaches its maximum, as is shown in Figure 2b). Here the point C is assumed to be to the right of O, which requires .
and are the deformation volumes of the left and right parts of the tire. is the total load on the tire. and are the local loads on the left and the right parts of the tire, respectively. For negative , swap loads on both sides.
This method is easy to think of, but it fails to capture the half-tire contact patch width change caused by camber on a rolling tire. Hence, we present a slightly different method for estimating the load shift.
2.1.2. The Rotating Method
A tire under the camber will show two important characteristics compared to a non-cambered tire. One is the load transfer between the two sides, and the other is the contact patch width change. The tilting method only shows the load transfer. To cover the contact patch width change, the author put forward the rotating method.
The FE simulation results in Figure 3 show the contact patch changing with increasing camber angle for a rolling tire (details of FE simulation are presented in the Results section below). Ignoring the contact patch shape sharpness change for different camber angles, the shape of the contact patch is only shifted in the lateral direction. Based on this observation we assume that the contact patch always keeps the same shape as the non-cambered tire. Keeping the centre of the tire fixed, as well as the contact patch area, rotating the tire according to an applied camber angle will shift the contact patch laterally with respect to the tire tread. The tire shoulders will limit the contact shape to expand beyond its width. A schematic drawing in Figure 3 illustrates the idea.
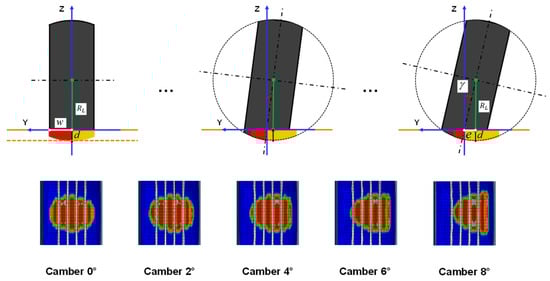
Figure 3.
Rotating method diagrammatic drawing and contact patch shapes under different camber angles.
The load on the outer half of the contact will decrease and the contact patch will shift away from the shoulder of the tire. Rotating the tire will shift the contact patch from the outer half to the inner, leading to a decreased volume for the outer half. We can regard the inner side as the remaining part of the volume (colored yellow in Figure 3). We illustrate this as a volume outside the width of the tire and ignore that the real volume has a different shape on the inner side.
According to Figure 3, we have:
Taking the point of intersection of the Y-axis and as the origin of the integral coordinate system, we have:
where is the radial deformation of an arbitrary point along the width of the contact patch. is half of the central angle corresponding to the chord length of contact patch length on this point.
2.2. Cornering Stiffness
For small wheel loads, the cornering stiffness is generally close to linear with respect to wheel load, and thus the effect from the load shift due to small camber angles is expected to be negligible. For higher wheel loads, the cornering stiffness is non-linear and the camber angle influence should be noticeable already at small angles [23]. For large camber angles, most of the load will be transferred to one of the sides leading to a saturation of the effect on cornering stiffness in this model.
From pure side slip measurements, we can parameterize the function between the cornering stiffness and the load:
where represents the function. is the cornering stiffness and is the load. are model parameters. With the assumption of symmetry of the tire, each part shares the total load equally. Meanwhile, the corresponding cornering stiffness is also half of the whole value. For each half-tire, we have:
We can obtain the cornering stiffness dependence with the load of the two parts from (24) and (25). This is inspired by Pacejka’s similarity method described in [9]. We will now illustrate this on two typical tire models: the MF and the UniTire.
2.2.1. Magic Formula
The load dependence for the cornering stiffness, under pure side slip conditions, is given below. The quantities and are model parameters.
According to Formulas (25) and (26), we have:
where is the cornering stiffness of the half-tire. is the corresponding load.
2.2.2. UniTire
The cornering stiffness dependence of load, under pure side slip conditions, is given below. is the tire’s reference load. , and are model parameters.
According to Formulas (25) and (28), we have:
3. Results
In this section, the method application results are shown. As previously stated, the proposed method is based on calculations of the local load shift and cornering stiffness. These two calculations are validated separately.
3.1. Load Distribution Validation Based on FE Model
Testing equipment capable of measuring the three forces and moments is commonly available. Indoor tire test rigs and outdoor tire test trailers are widely applied in engineering practice [24,25,26,27]. However, measuring the load distribution of the contact patch for a tire in combined side slip and camber angle is hard. There are commercially available techniques to measure the contact patch, for example, the High-Speed TireScan System provided by Tekscan [28]. This technique measures the pressure distribution while in motion. In the case of a direct measurement of the local pressure in the contact patch, it is hard to determine the position of the two parts. This problem originates from the fact that the carcass is compliant and will result in a phenomenon referred to as a carcass camber [29]. Hence, FE models will be used here to verify the load calculation method.
3.1.1. FE Modeling
For this study, two FE models are used. Table 1 shows their basic information.

Table 1.
FE models basic information.
The FE modeling technology is very mature [30]. As is shown in Figure 4, this modeling could be described in four steps:
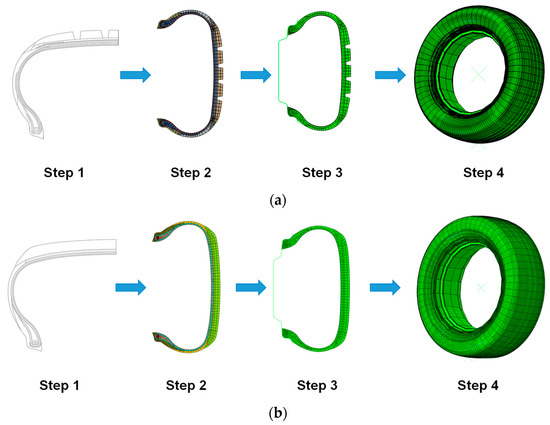
Figure 4.
The FE modeling process. (a) FE 1#; (b) FE 2#.
- (1)
- Geometry section preparation. This step is carried out in AutoCAD [31]. By cutting the too long lines and extending the too short lines, we obtain the closed surface region for meshing.
- (2)
- Section meshing. This step is carried out in Hypermesh [32]. CGAX4H and CGAX3H meshes are used for the two-dimensional (2D) element, and SFMGAX1 mesh is used for the one-dimensional (1D) element.
- (3)
- 2D modeling. This step is carried out in ABAQUS. This process is to define the material characteristics and fit the tire onto the rim.
- (4)
- Three-dimensional (3D) tire modeling. The 3D model is obtained by rotating the 2D model through the tire rotation axis.
3.1.2. FE Model Validation
The accuracy of the FE models is confirmed by comparisons to test data. According to the proposed method in the second section, load distribution is symmetric for positive and negative camber angles. Here, we take the positive camber angle result as an example. The corresponding tire test for FE 1# is done on the MTS Flat-Trac® Tire Force & Moment Measurement Systems [24], while the FE 2# tire is tested on the Flat Test Rig in the State Key Laboratory of Automobile Simulation and Control, Jilin University, see Figure 5. Some technical specifications of the Jilin University test rig are given in Table 2.
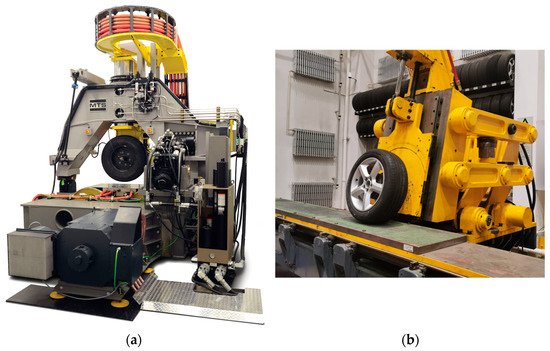
Figure 5.
The tire test rigs for FE models’ validation. (a) MTS Flat-Trac; (b) Flat Test Rig in Jilin University.
Table 2.
Jilin University Flat Test Rig specifications.
Ideally, the tire load distribution at different camber angles should be measured directly using the test rigs. For a rolling tire, such a measurement would require the test rig to be equipped with force sensors on the road contact. In addition, the tire carcass camber should also be measured to determine the boundary of the two tire parts. These kinds of measurements are rare and hard to realize for most tire test rigs, and hence we use simulations. We had access to the pure side slip and pure camber lateral force test data for these tires. Since the camber thrust should be fairly independent of friction levels, and instead be dictated by the structural properties of the tread and carcass, it is chosen as a suitable property for verifying the FE models.
The FE models are simulated under the same conditions as in the test, and the excellent agreement with measurement is shown in Figure 6 for both tires. Therefore, the FE models could be used in the following load distribution validation.
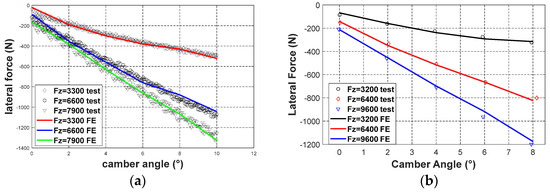
Figure 6.
Pure camber lateral force results of test data and FE simulation. (a) FE 1#; (b) FE 2#.
3.1.3. Load Distribution Validation
The basic geometry of the tire was obtained from the tire dimension, with mm, mm for FE 1#, and mm, mm for FE 2#.
For the tilting method, the radial deformation of the cambered tire is obtained through the unchanged deformation volume expression before and after cambering. For the rotating method, the loaded radius is obtained from zero camber angle FE simulations. Those results are shown in Table 3.
Table 3.
Cambered tire d′ and at zero camber angle.
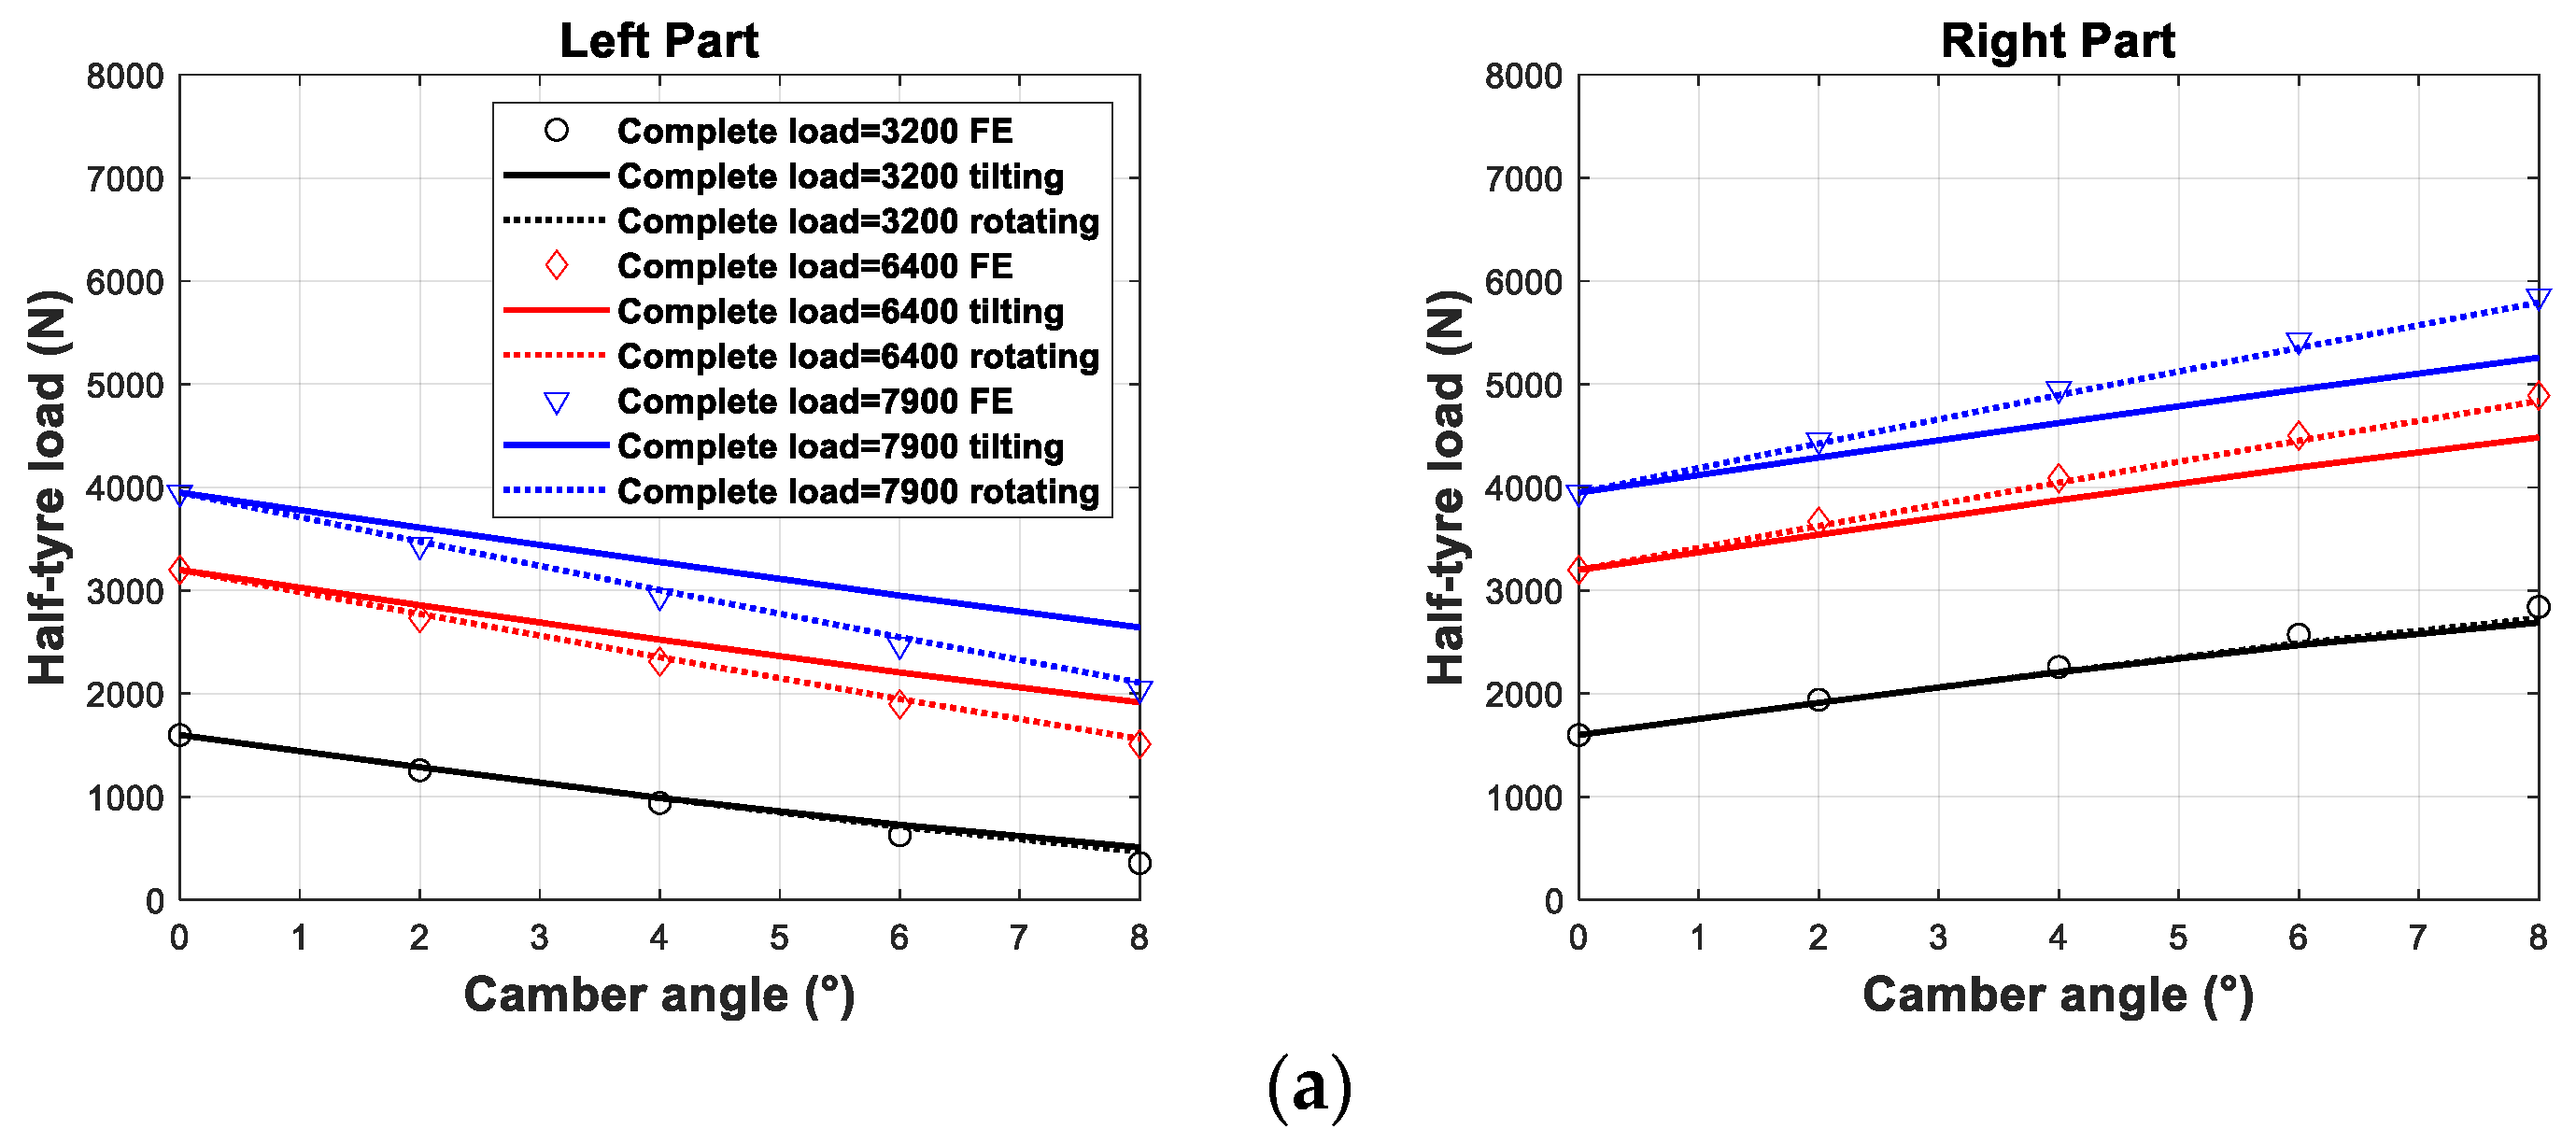
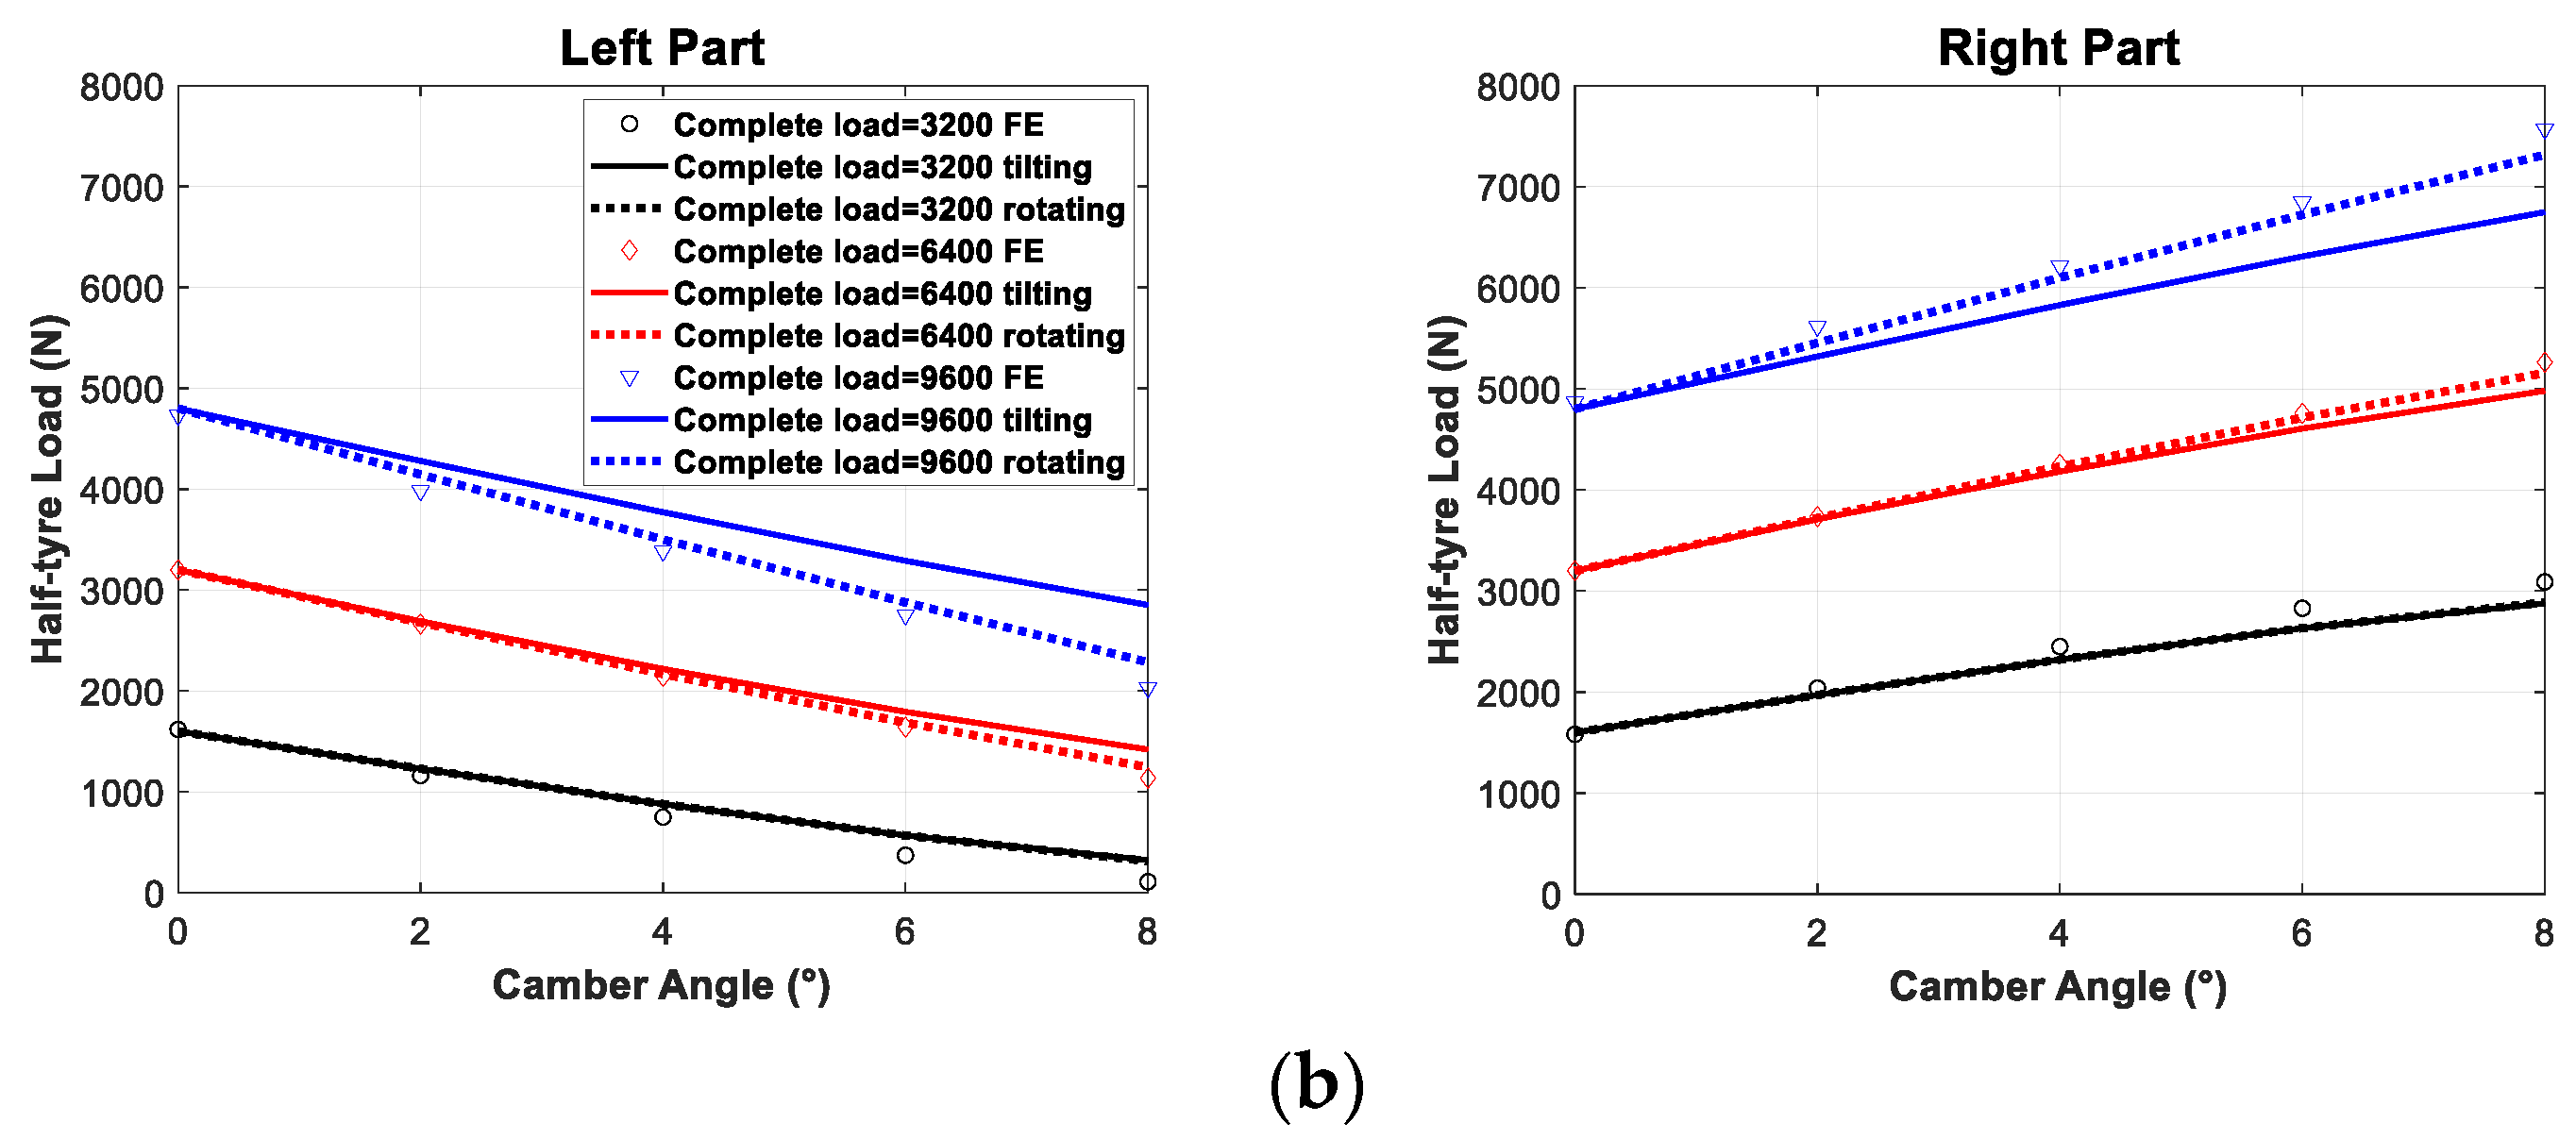
The load distribution according to tilting and rotating methods are compared with the FE simulations, as is shown in Figure 7. The rotating method results are in good agreement with the FE simulations for both high loads and camber angles, and will thus be used in further modelling.
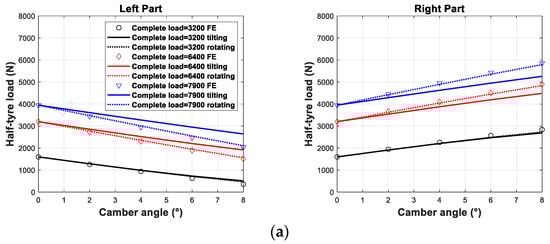
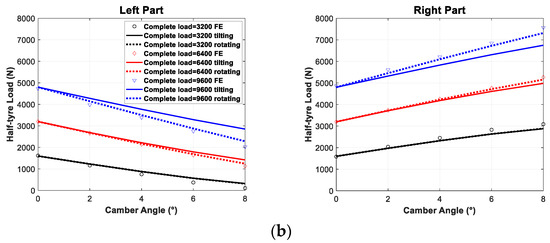
Figure 7.
Load distribution comparison of calculation and simulation methods. (a) FE 1#; (b) FE 2#.
3.2. Method Applied to Tire Model
In this section, both the Magic Formula and the UniTire models are used.
The tires’ sizes are 235-75R15 (tire 1#) and P265-70R17 (tire 2#). Their rated loads are 7110 N and 8200 N, respectively. These are different from the tires used in FE model validation because of the lack of measured data for combined side slip and camber. We can obtain the load distribution ( and ) through the rotating method, and use (loaded radius) values obtained from pure side slip measurements.
3.2.1. Magic Formula
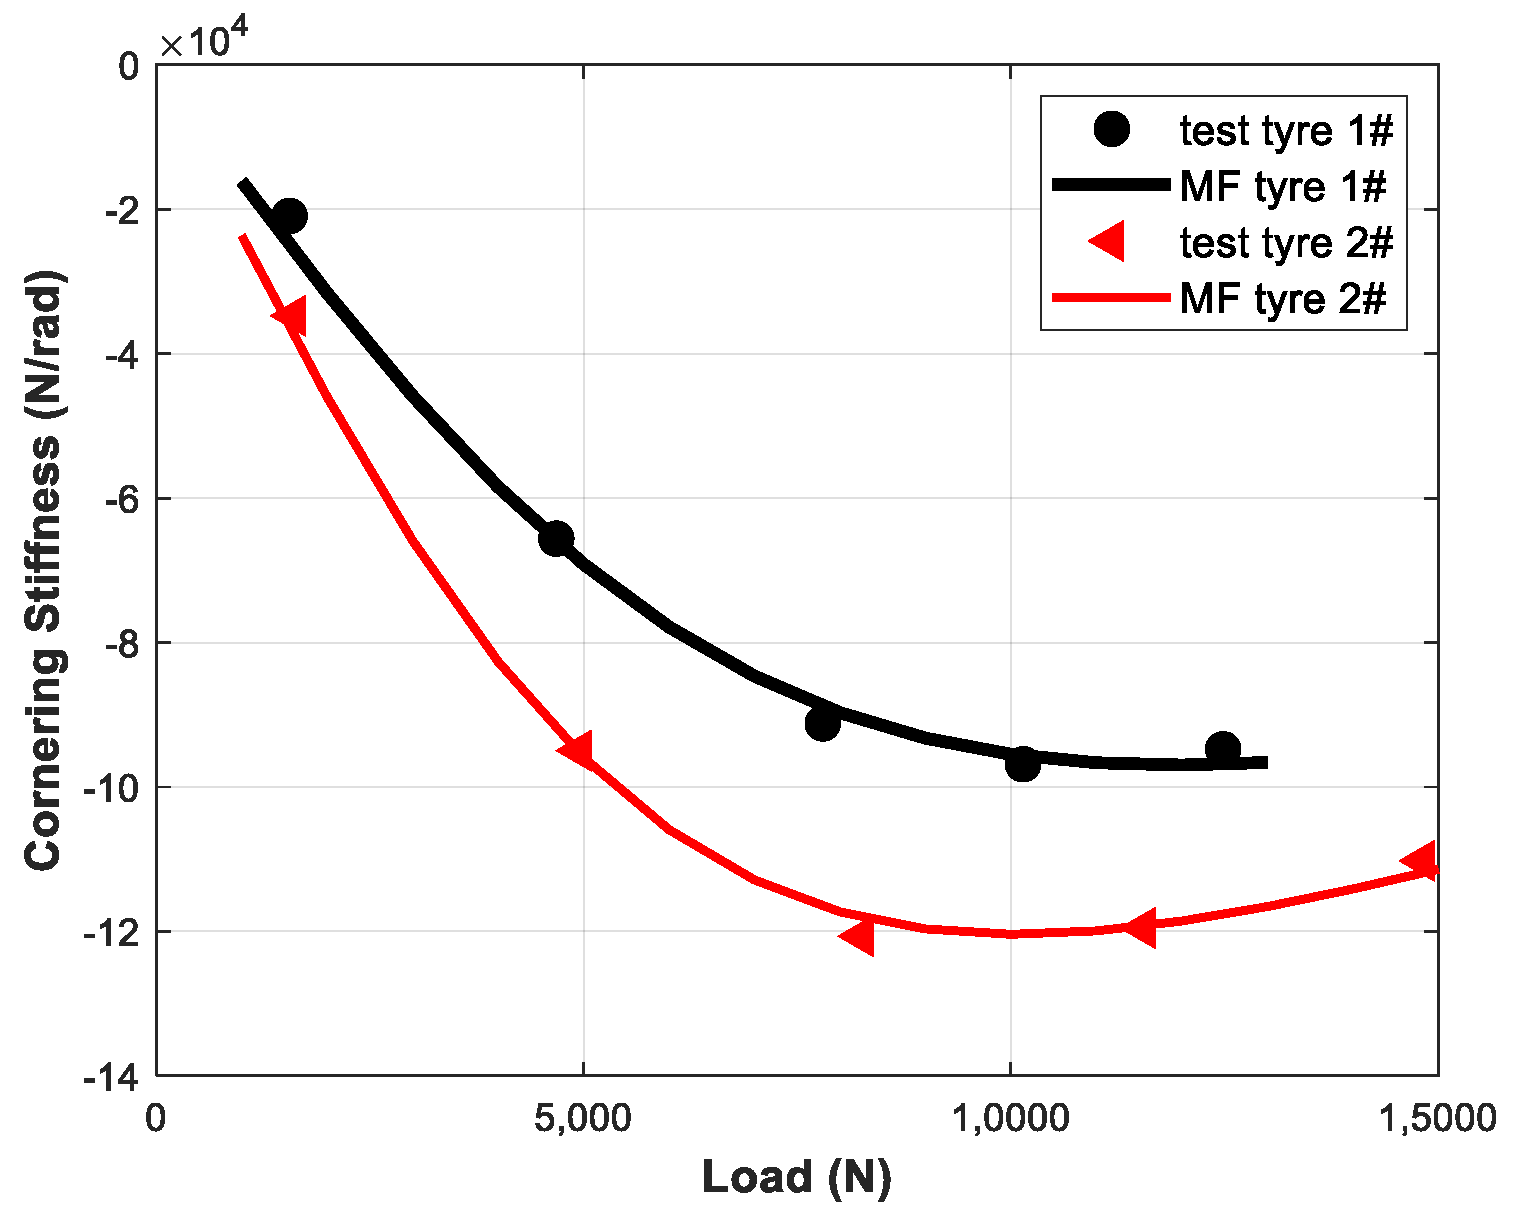
By parameterizing side slip data with different loads through Formula (26), we can obtain and . The parameterizing result is shown in Figure 8. Inputting , , and into Formula (27), we can obtain and . Their sum () is the predicted cornering stiffness.
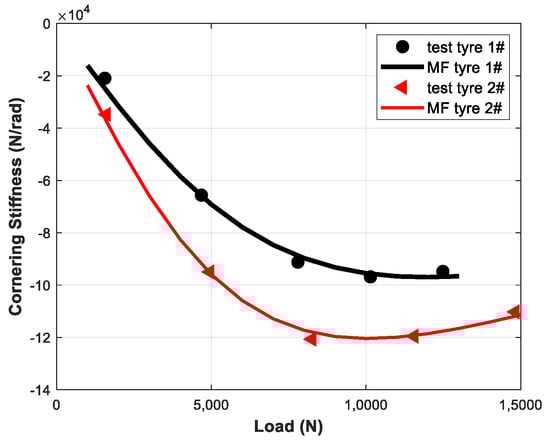
Figure 8.
Side slip data with different loads parameterizing result through Formula (26).
The cornering stiffness dependence on load and camber angle in the Magic Formula tire model is shown in Formula (30). The variables , and are model parameters.
By parameterizing side slip data with different loads and camber angles directly through Formula (30), we can obtain . Figure 9 shows the comparisons of and . It is known that the influence of camber angle on cornering stiffness is not large. The zero-camber case is also plotted for reference, to illustrate that the proposed method is more accurate than neglecting the camber effect.
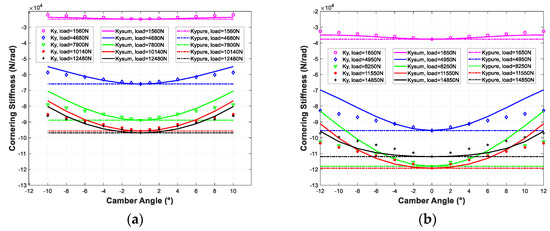
Figure 9.
Result comparisons. (a) Tire 1#; (b) Tire 2#.
3.2.2. UniTire
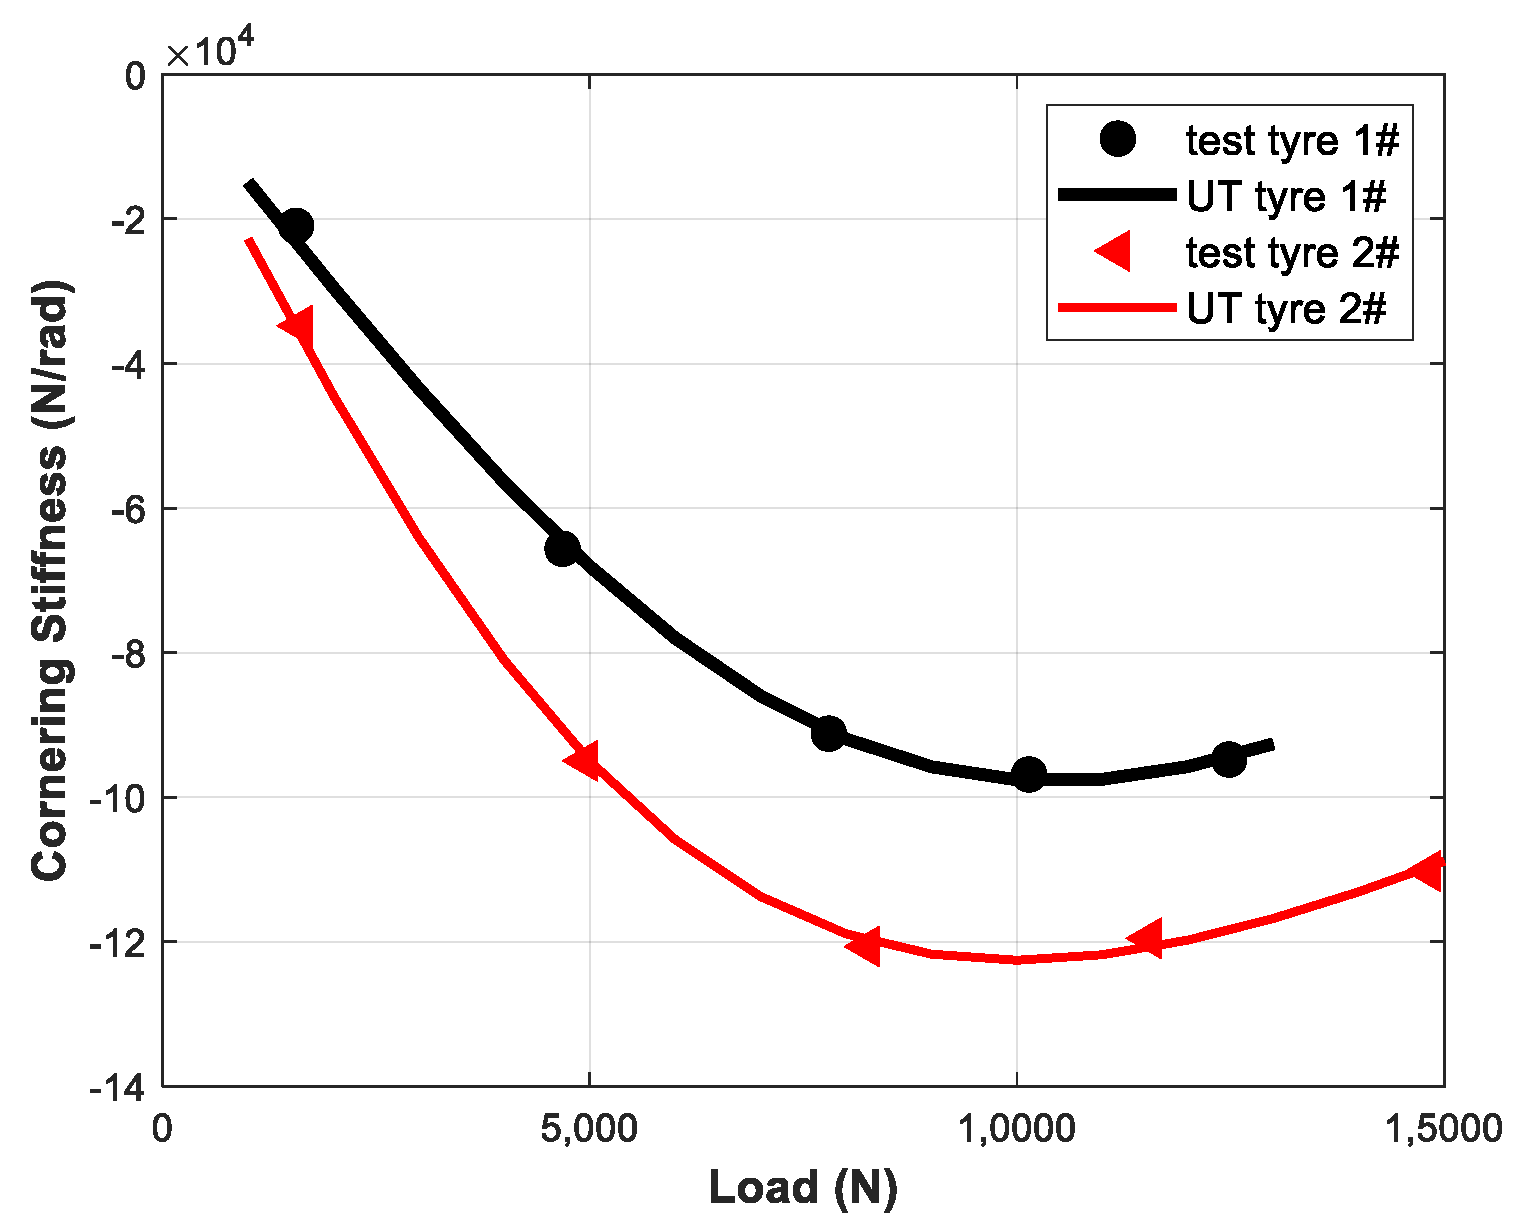
By parameterizing side slip data with different loads through Formula (28), we can obtain , and . The parameterizing result is shown in Figure 10.

Figure 10.
Side slip data with different loads parameterizing result through Formula (28).
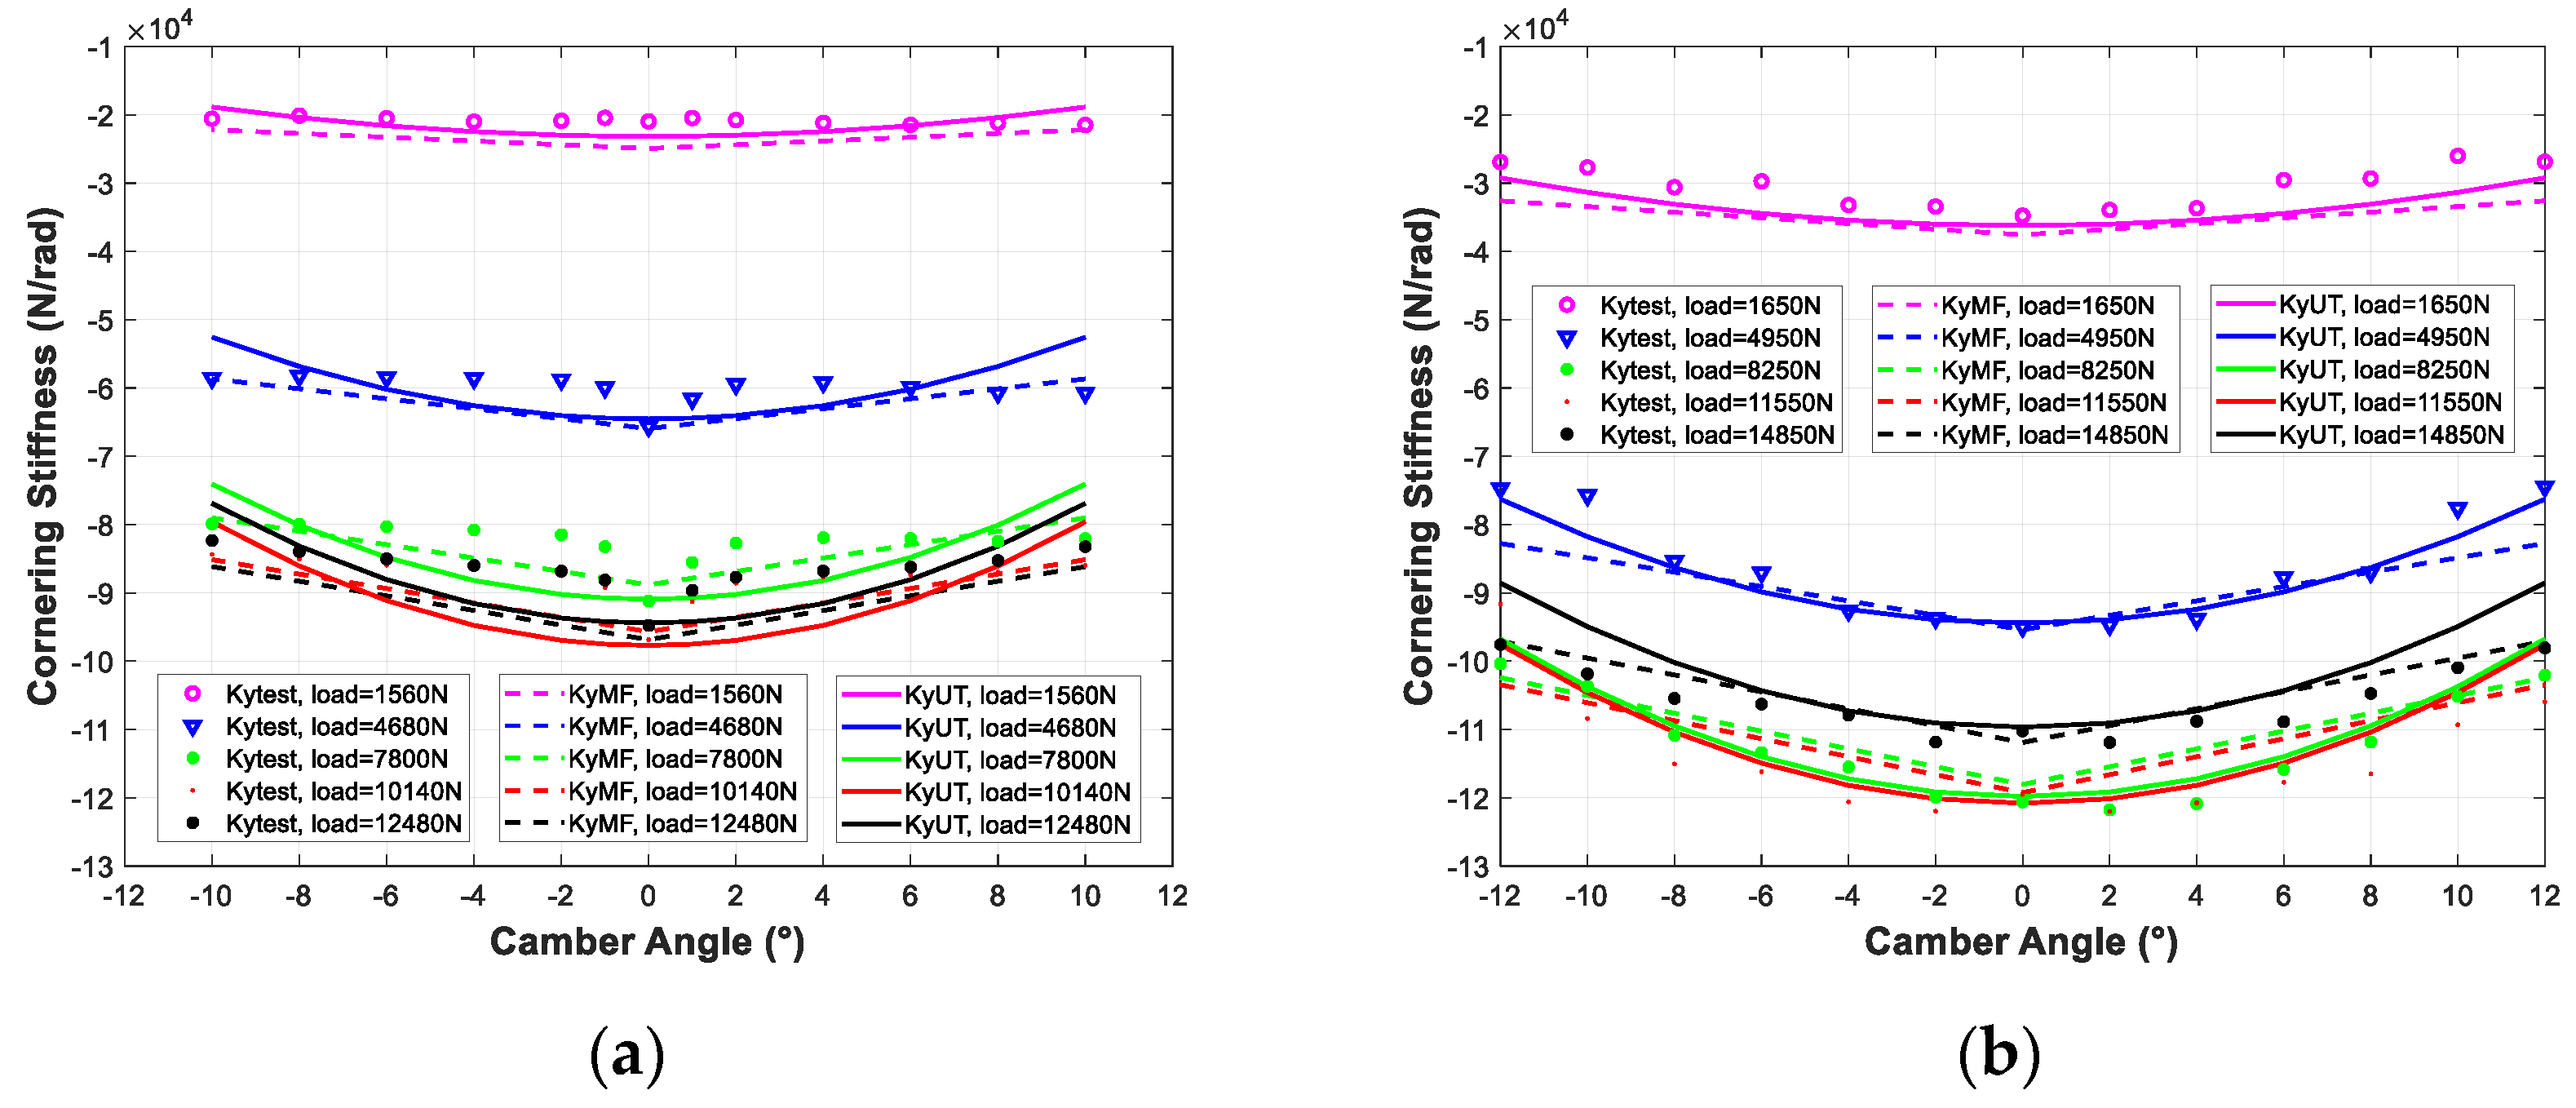
The cornering stiffness dependence of load and camber angle for the UniTire is shown in Formula (31). The variables , , and are model parameters. Figure 11 shows the comparisons.
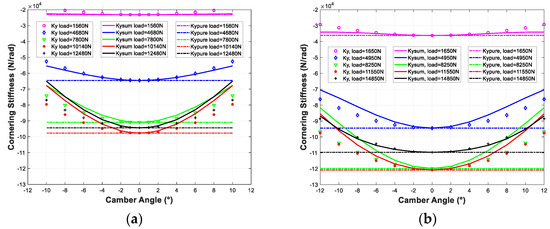
Figure 11.
Result comparisons. (a) Tire 1#; (b) Tire 2#.
From the above result, we can see that the method expresses the influence tendency of camber on cornering stiffness and produces accurate results compared to the full parameterization. Most cases along the curve have accuracies higher than 95%. Neglecting the camber effect values has lower accuracy and fails in expressing the decreasing cornering stiffness. In the MF or UniTire parameterizing expression, the proposed method could be a replacement with high accuracy and low consumption.
3.3. Method Application Validation Based on Test Data
The proposed method does not rely on a particular tire model. In this comparison, the proposed method will be applied to measurement data that is interpolated.
The same tire test data used in 2.2 is also used here. Tire cornering stiffness is obtained through numerical differentiation and uses the lateral force at a slip angle of positive and negative 1 degree. This is further referred to as .
Considering the load range on each half-tire, only cornering stiffness with middle load and small camber angle could be obtained from pure side slip test data with a wide load range (see Table 4).
Table 4.
Load and camber angle range obtained from test data.
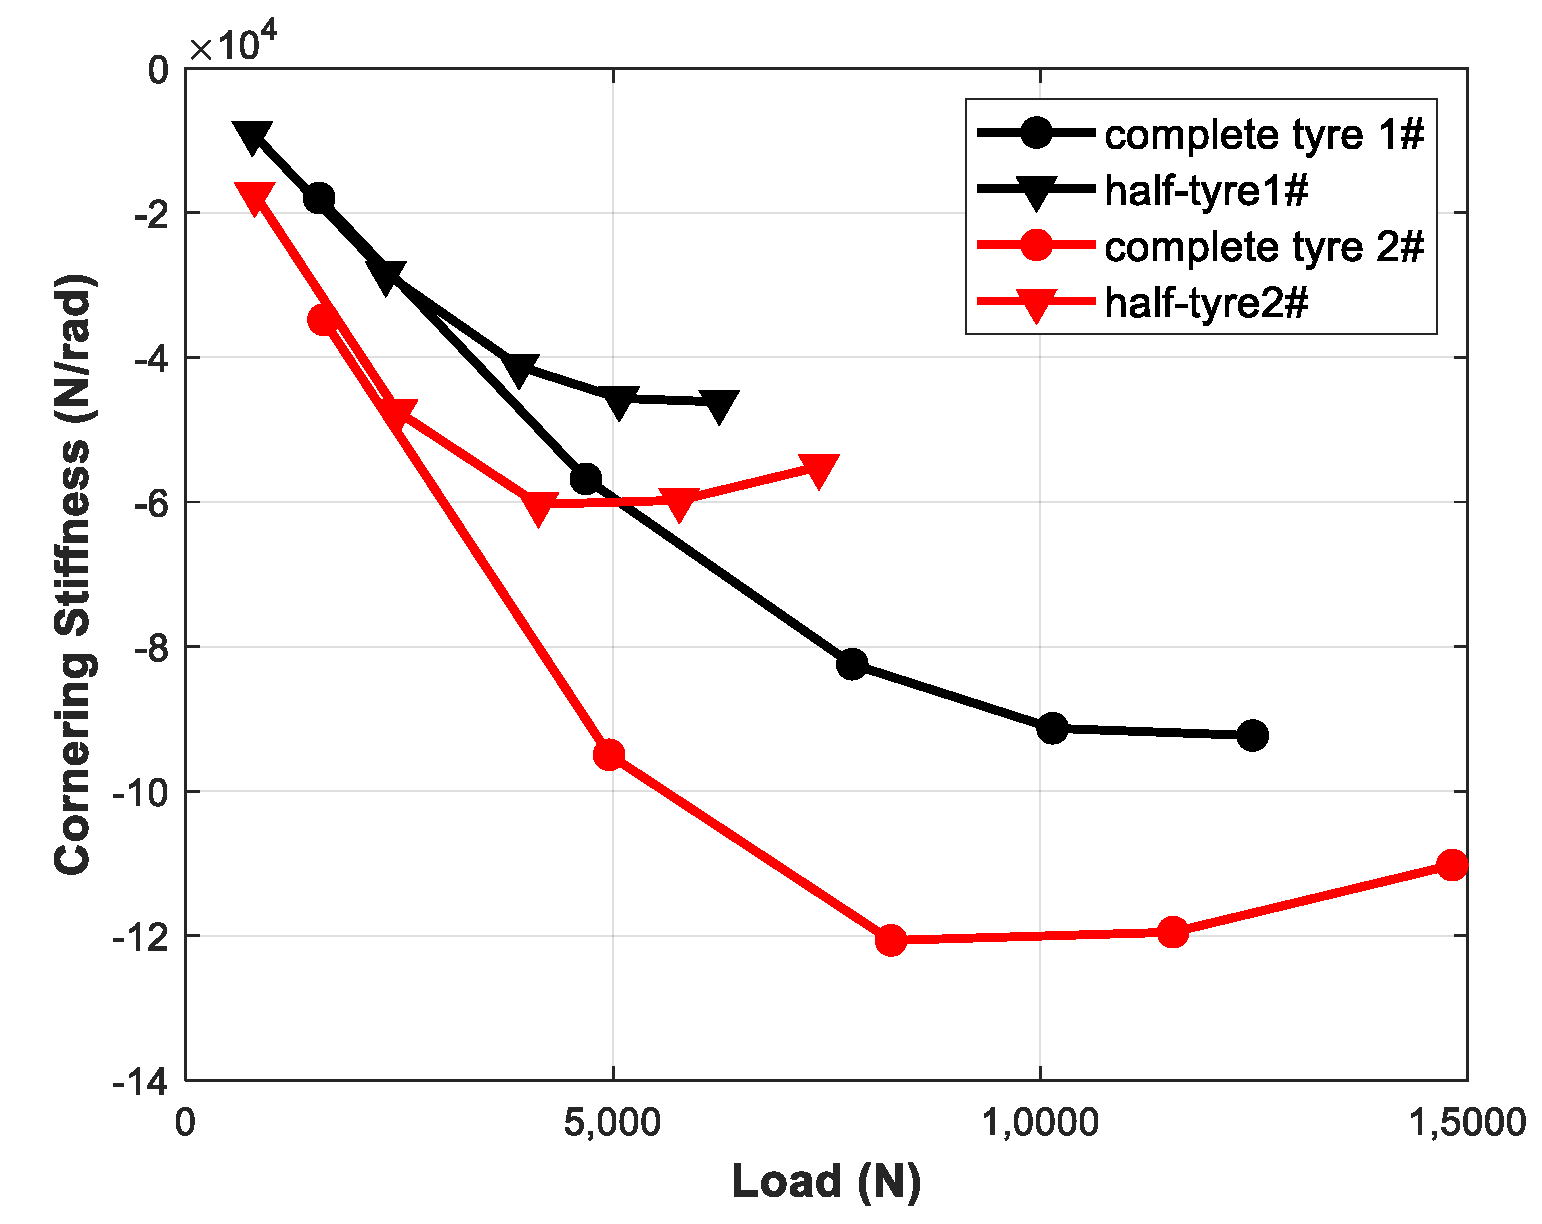
According to side slip test data without camber angle, we can obtain cornering stiffness versus load curves of the complete tire and half-tire (see Figure 12).

Figure 12.
Cornering stiffness as a function of the load curves of complete tire and half-tire.
The interpolation method is used to calculate half-tire cornering stiffness based on known data in Figure 12. Results are shown in Figure 13.
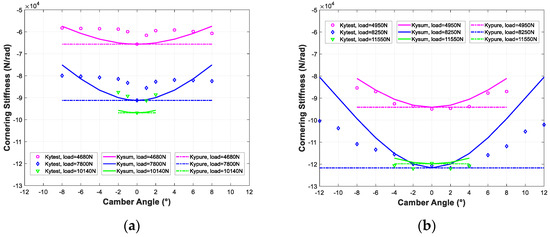
Figure 13.
Result comparisons. (a) Tire 1#; (b) Tire 2#.
We can see that the proposed method captures the cornering stiffness change tendency with camber. The expression also shows high accuracy (most results are higher than 90%). Based on the interpolated measurement data, the method shows universality, which could be used as cornering stiffness prediction guidance using different tire models.
3.4. Comparison between Test Data and Model Parameterizing Result
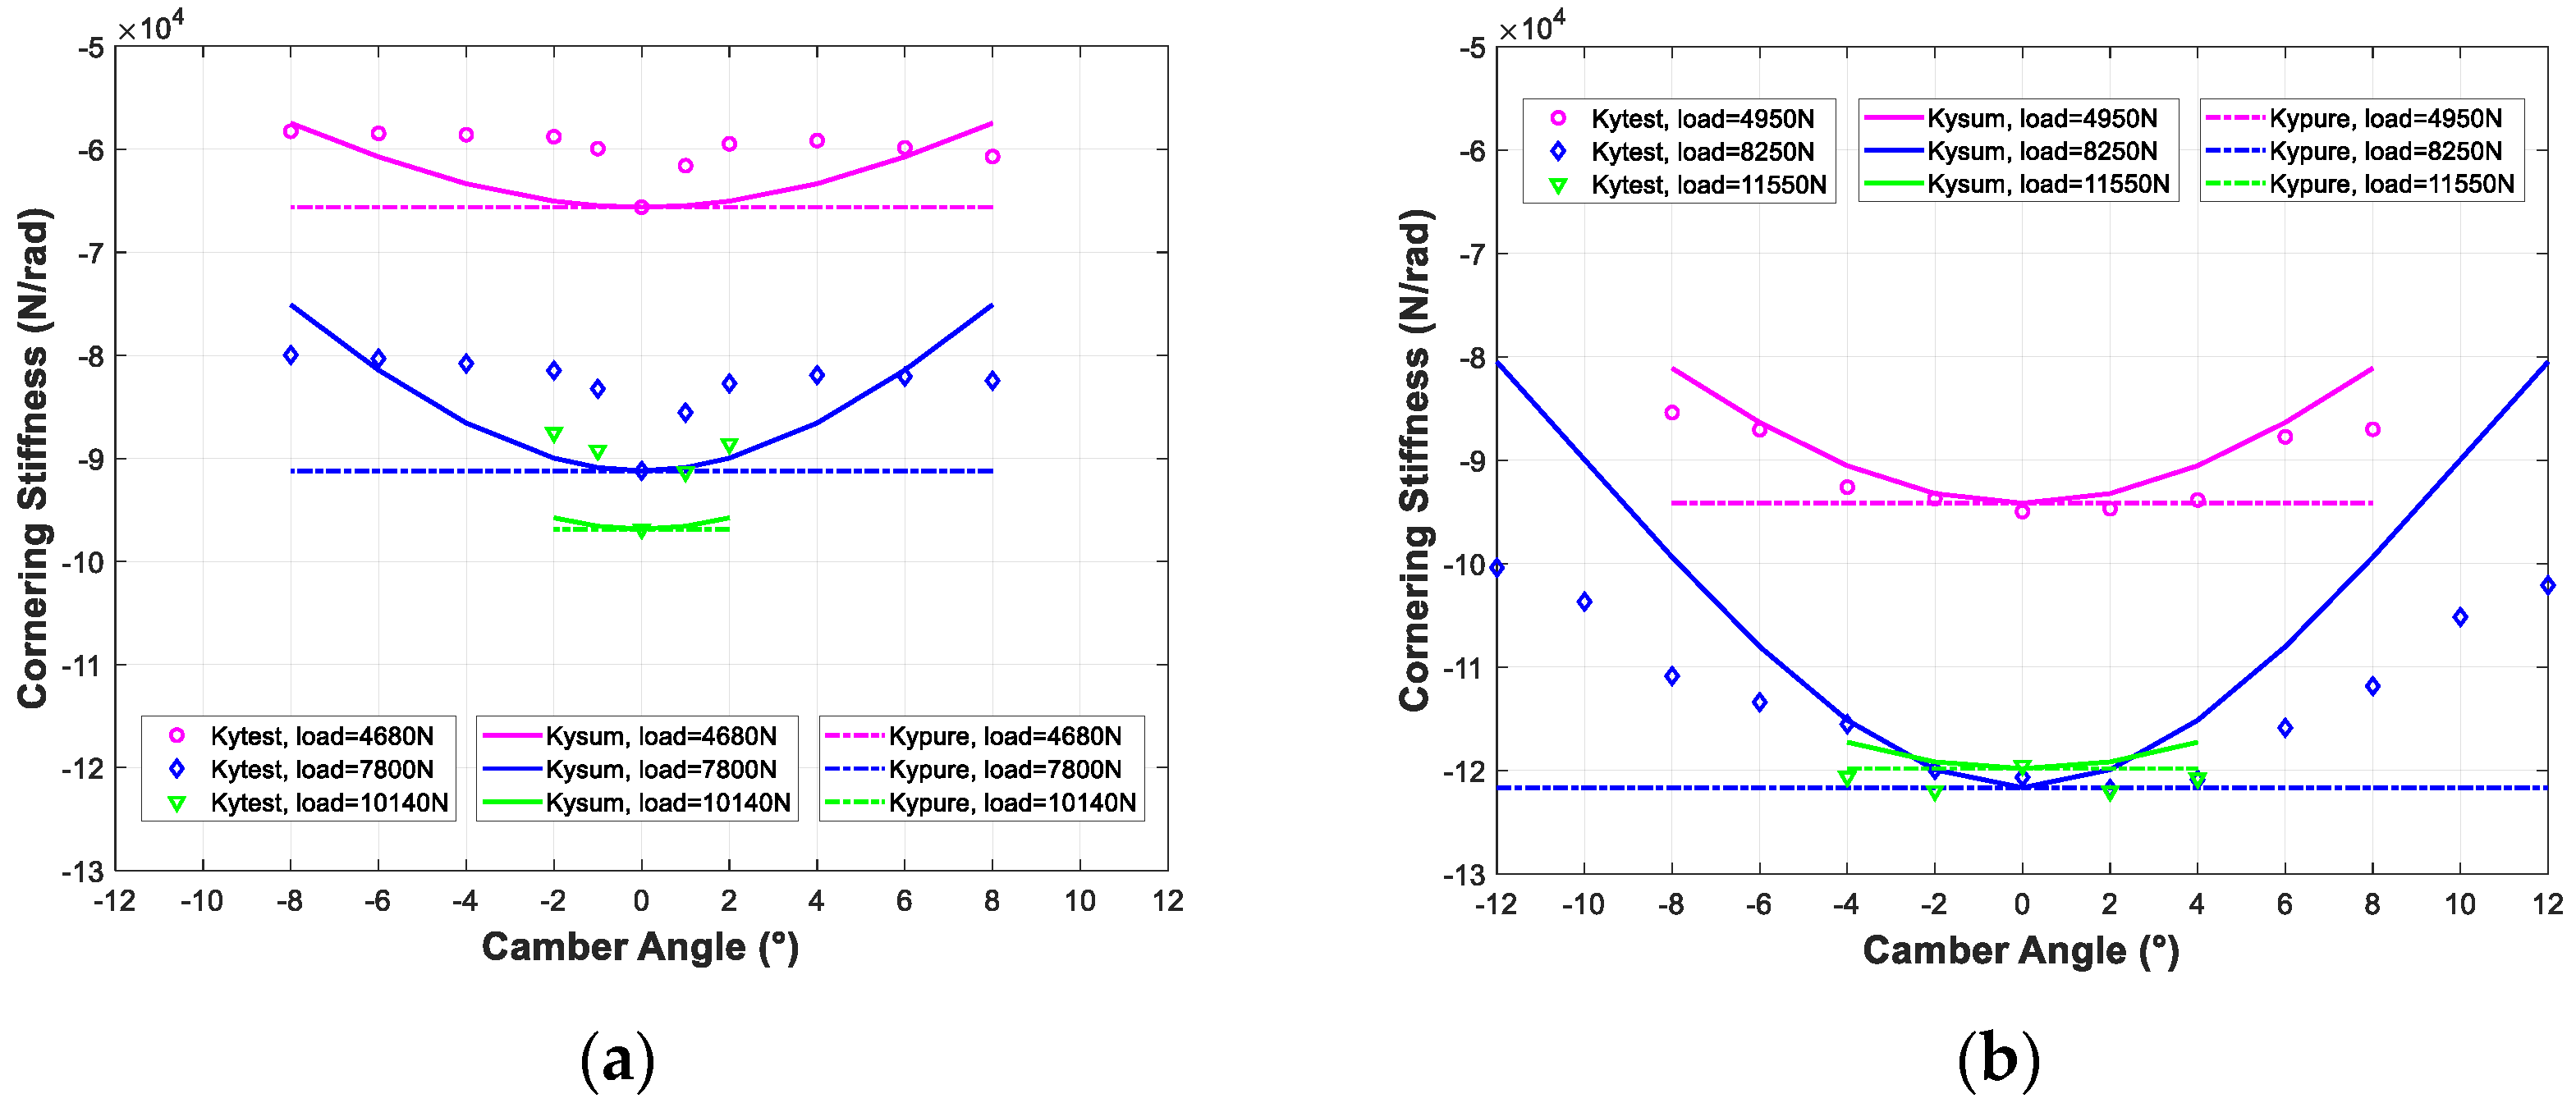
When comparing the MF cornering stiffness () and UniTire cornering stiffness () parameterizing results with the test result, we notice that they do not match very well with the measurement, as shown in Figure 14.
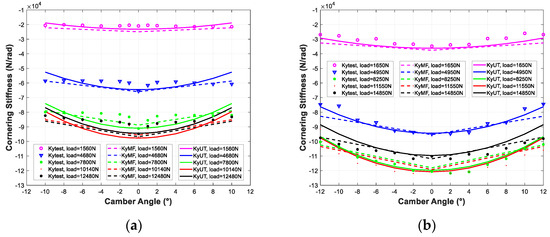
Figure 14.
Result comparisons. (a) Tire 1#; (b) Tire 2#.
The difference between and is caused by the different expressions in Formulas (30) and (31). MF and UniTire are both semi-physical models. They use different formulas to show the decreasing cornering stiffness with increasing camber.
For the data used here, we can observe that the effect of camber on the cornering stiffness seems to saturate for high angles for tire #1. Cornering stiffness is relatively constant after camber angles larger than 2°. This phenomenon might be explained based on Figure 12.
Taking tire 1# with 4680 N complete tire load as an example, the half-tire load changes from 610 N to 4071 N, where the curve of cornering stiffness varying with load is close to linear. A 42.5% change in load results in less than 1.2% change in cornering stiffness. This is why, in Figure 14a, the does not change noticeably after camber angles larger than 2°. When it comes to tire 2# with 4950 N complete tire load, the half-tire load changes from 413 N to 4540 N, where the curve of cornering stiffness varying with load is far from linear. A 45.4% change in load results in up to 20% change in cornering stiffness. This brings up the result in Figure 14b.
The curves in Figure 12 are different for different tires, and consequently also for the test results in Figure 14. The MF and UniTire expressions fail to capture the camber and cornering stiffness relationship in some cases, especially for some larger camber angles. However, for this paper, the proposed method works well on both the empirical models and the measurement data.
4. Discussion
The method proposed for obtaining cornering stiffness with varying camber angles is time- and resource-saving. It requires tire dimension and only pure side slip characteristics. Compared with the common techniques, i.e., based on combined slip and camber data, the camber angle input is removed. Table 5 shows the number of measurements for the example data above. A 91% saving in measurements could be made using the proposed method.
Table 5.
Measurements number of tire 1# (tire 2#) data.
This method does have some limitations:
- I.
- based on the symmetry assumption, this method does not show the effects of ply steer and conicity [33].
- II.
- considering the load range on each half-tire, only cornering stiffness with middle load and small camber angle could be obtained from pure side slip test data with a wide load range when not using a tire model.
- III.
- cornering versus load curves of the half-tire is obtained from the non-cambered tire with nearly uniform load distribution along the width, but it is used in the cambered half-tire with various load distribution along the width, which could cause errors.
The effects of ply steer and conicity are usually small. Hence, point I does not contribute largely to the error of the method. The application of the tire model makes possible prediction of half-tire results beyond the corresponding complete tire load range, which avoids limitation II. In the proposed method, the tire is divided into two parts. The tire can also be divided into more parts along the tire width. In this way, the error described in III could also be reduced.
In the proposed method, the influence of camber angle is treated as load distribution. Currently, this is only used in the prediction of cornering stiffness. The approach could be extended to large side slips and lateral force generation, but requires further inquiry.
5. Conclusions
The work presented in this paper proposes a method to obtain cornering stiffness for different camber angles based on characteristics from pure side slip. The method can capture the general trend of cornering stiffness for different camber angles and performs better than neglecting the camber effect. It reduces the need for measurements in combined camber and side slip conditions.
The camber is expressed as an equivalence of the load shift in the contact patch. This reduces one variable of the problem and makes possible the omission of sideslip data with different camber angles.
The whole tire is divided into two parts. With the assumption of symmetry of the tire, each part shares the total load and contributes to the cornering stiffness equally at zero camber, making it possible to obtain the half tire cornering stiffness from the whole tire result.
Two load distribution methods are proposed. The tilting method shows the right tendency but has lower accuracy. Thus, the rotating method is needed, which shows both the load transfer and the contact patch width change for a cambered tire. Two FE models are built for the load distribution calculation validation. The rotating method has good agreement with the FE result, and is used in prediction method validation.
The prediction results are compared to those obtained by parameterizing measurement data using MF and UniTire, as well as directly towards measurement data. The comparisons show promising results, indicating that the method could be applicable in conditions where the dependence of camber angle is of some importance, and cost reduction in model parameterization is central.
A comparison between test data and model parameterizing result is done. The different effect of camber on the cornering stiffness is explained by the relationship between cornering stiffness and load. This further illustrates the rationality of expressing camber as an equivalence of the load shift.
Author Contributions
Methodology, Y.S.; Software, Y.S. and Y.Z.; Validation, Y.S. and Y.Z.; Data curation, Y.Z.; Writing—original draft, Y.S.; Writing—review & editing, Y.S.; Supervision, D.L. All authors have read and agreed to the published version of the manuscript.
Funding
The authors gratefully acknowledge financial support from China Scholarship Council.
Institutional Review Board Statement
Not applicable.
Informed Consent Statement
Not applicable.
Data Availability Statement
Not applicable.
Acknowledgments
Yanru Suo acknowledges Qianjin Liu for correcting a mathematical error in the Method description.
Conflicts of Interest
The authors declare no conflict of interest.
References
- Gillespie, T.D. Fundamentals of Vehicle Dynamics; Society of Automotive Engineers: New York, NY, USA, 2009. [Google Scholar]
- Wang, Y.; Geng, K.; Xu, L.; Ren, Y.; Dong, H.; Yin, G. Estimation of sideslip angle and tire cornering stiffness using fuzzy adaptive robust cubature kalman filter. IEEE Trans. Syst. Man Cybern. Syst. 2020, 52, 1451–1462. [Google Scholar] [CrossRef]
- Fnadi, M.; Plumet, F.; Benamar, F. Nonlinear tire cornering stiffness observer for a double steering off-road mobile robot. In Proceedings of the International Conference on Robotics and Automation (ICRA), Montreal, QC, Canada, 20–24 May 2019; pp. 7529–7534. [Google Scholar]
- Pasto, C.; Lot, R.; Massaro, M. The Effect of Road Unevenness on Cornering Performance of Road Vehicles. In Proceedings of the Lecture Notes in Engineering and Computer Science: Proceedings of The World Congress on Engineering 2021, London, UK, 7–9 July 2021; pp. 247–252. [Google Scholar]
- Foale, T. Motorcycle Handling and Chassis Design: The Art and Science; Tony Foale Designs: Madrid, Spain, 2006. [Google Scholar]
- Wong, J.Y. Theory of Ground Vehicles; John Wiley & Sons: Hoboken, NJ, USA, 2008. [Google Scholar]
- Gent, A.N.; Walter, J.D. Pneumatic Tire. In Mechanical Engineering Faculty Research; The University of Akron: Akron, OH, USA, 2006. [Google Scholar]
- Pacejka, H. Tire and Vehicle Dynamics, 2nd ed.; Elsevier Science: Amsterdam, The Netherlands, 2006. [Google Scholar]
- Pacejka, H. Tire and Vehicle Dynamics, 3rd ed.; Elsevier Science: Amsterdam, The Netherlands, 2012. [Google Scholar]
- Bakker, E.; Nyborg, L.; Pacejka, H.B. Tyre modelling for use in vehicle dynamics studies. SAE Trans. 1987, 96, 190–204. [Google Scholar]
- Schmeitz, A.J.C.; Besselink, I.J.M.; Jansen, S.T.H. TNO MFSWIFT. Veh. Syst. Dyn. 2007, 45 (Suppl. S1), 121–137. [Google Scholar] [CrossRef]
- Guo, K.; Lu, D. UniTire: Unified tire model for vehicle dynamic simulation. Veh. Syst. Dyn. 2007, 45 (Suppl. S1), 79–99. [Google Scholar] [CrossRef]
- Guo, K.; Lu, D.; Chen, S.-K.; Lin, W.C.; Lu, X.-P. The UniTire model: A nonlinear and non-steady-state tyre model for vehicle dynamics simulation. Veh. Syst. Dyn. 2005, 43 (Suppl. S1), 341–358. [Google Scholar] [CrossRef]
- Sun, L.; Lu, D.; Li, B.; Suo, Y.; Xia, D. Analysis and Prediction of Tire Cornering Properties for Different Inflation Pressures Based on Deflection Control. Tire Sci. Technol. 2021, 49, 104–127. [Google Scholar] [CrossRef]
- Lu, L.; Lu, D.; Wu, H.; Wang, W.; Li, L.; Lv, Y.M. Research and modeling of tire cornering characteristics considering temperature based on UniTire model. Proc. Inst. Mech. Eng. Part D J. Automob. Eng. 2021, 236, 497–511. [Google Scholar] [CrossRef]
- Kaga, H.; Okamoto, K.; Tozawa, Y. Stress analysis of a tire under vertical load by a finite element method. Tire Sci. Technol. 1977, 5, 102–118. [Google Scholar] [CrossRef]
- Kennedy, R.H.; Patel, I.P.; Mcminn, M.S. Radial truck tire inflation analysis: Theory and experiment. Rubber Chem. Technol. 1981, 5, 751–766. [Google Scholar] [CrossRef]
- Olatunbosun, O.A.; Bolarinwa, O. FE simulation of the effect of tire design parameters on lateral forces and moments. Tire Sci. Technol. 2004, 32, 146–163. [Google Scholar] [CrossRef]
- Kabe, K.; Koishi, M. Tire cornering simulation using finite element analysis. J. Appl. Polym. Sci. 2000, 78, 1566–1572. [Google Scholar] [CrossRef]
- Yan, X.; Wang, Y.; Feng, X. Study for the endurance of radial truck tires with finite element modeling. Math. Comput. Simul. 2002, 59, 471–488. [Google Scholar] [CrossRef]
- Guan, Y.; Zhao, G.; Cheng, G. Influence of belt cord angle on radial tire under different rolling states. J. Reinf. Plast. Compos. 2006, 25, 1059–1077. [Google Scholar]
- Nguyen-Xuan, H.; Bordas, S.; Nguyen-Dang, H. Smooth finite element methods: Convergence, accuracy and properties. Int. J. Numer. Methods Eng. 2008, 74, 175–208. [Google Scholar] [CrossRef]
- Yanru, S.; Dang, L.; Fredrik, B.; Yandong, Z.; Mattias, H. Research on Prediction of Tire Camber-Sideslip Combined Mechanical Characteristics. In Proceedings of the 28th International Symposium on Dynamics of Vehicles on Roads and Tracks. IAVSD, Ottawa, ON, Canada, 21–25 August 2023. [Google Scholar]
- Flat-Trac® Tire Force & Moment Measurement Systems. Available online: https://www.mts.com/en/products/automotive/tire-test-systems/flat-trac-tire-system (accessed on 9 May 2022).
- Test Systems for Tires & Wheels. Available online: https://www.zf.com/products/en/testsystems/anwendungen/test_systems_for_tires_and_wheels/test_systems_for_tires_and_wheels.html (accessed on 9 May 2023).
- Tyre Testing. Available online: https://tass.plm.automation.siemens.com/tyre-testing (accessed on 9 May 2023).
- Skid Trailer. Available online: https://www.dufournier.com/testing-equipment/skid-trailer (accessed on 9 May 2023).
- High Speed TireScan. Available online: https://www.tekscan.com/products-solutions/systems/high-speed-tirescan (accessed on 9 May 2023).
- Lu, D.; Wang, D.; Wang, C.; Guo, K. Tire Carcass Camber and its Application for Overturning Moment Modeling; SAE Technical Paper; SAE International: Pittsburgh, PA, USA, 2013. [Google Scholar]
- Smith, M. ABAQUS/Standard User’s Manual, Version 6.9; Dassault Systèmes Simulia Corp: Johnston, RI, USA, 2009. [Google Scholar]
- Autodesk AutoCAD: Trusted by Millions, Built to Accelerate Your Creativity. Available online: https://www.autodesk.eu/products/autocad/overview?term=1-YEAR&tab=subscription (accessed on 20 July 2023).
- A History of Solving the Most Challenging Problems. Available online: https://altair.com/hypermesh (accessed on 21 July 2023).
- Bakker, E.; Pacejka, H.B.; Lidner, L. A new tire model with an application in vehicle dynamics studies. SAE Trans. 1989, 98, 101–113. [Google Scholar]


Disclaimer/Publisher’s Note: The statements, opinions and data contained in all publications are solely those of the individual author(s) and contributor(s) and not of MDPI and/or the editor(s). MDPI and/or the editor(s) disclaim responsibility for any injury to people or property resulting from any ideas, methods, instructions or products referred to in the content. |
© 2023 by the authors. Licensee MDPI, Basel, Switzerland. This article is an open access article distributed under the terms and conditions of the Creative Commons Attribution (CC BY) license (https://creativecommons.org/licenses/by/4.0/).