Article

Thermodynamic and Economic Analysis of a Liquid Air Energy Storage System with Carbon Capture and Storage for Gas Power Plants

1
Department of Refrigeration and Cryogenic Engineering, Xi’an Jiaotong University, Xi’an 710049, China
2
ShaanGu Group Co., Ltd., Xi’an 710082, China
*
Author to whom correspondence should be addressed.
Appl. Sci. 2023, 13(17), 9559; https://doi.org/10.3390/app13179559
Submission received: 17 June 2023 / Revised: 18 August 2023 / Accepted: 21 August 2023 / Published: 23 August 2023
(This article belongs to the Section Energy Science and Technology)

Abstract

:
Liquid air energy storage (LAES) technology is helpful for large-scale electrical energy storage (EES), but faces the challenge of insufficient peak power output. To address this issue, this study proposed an efficient and green system integrating LAES, a natural gas power plant (NGPP), and carbon capture. The research explores whether the integration design is theoretically feasible for future adoption in operating the LAES system and NGPP. The effect of the charging pressure, the number of air expansion stages, and electricity prices on the overall thermodynamic and economic characteristics are investigated. The round-trip efficiency and the exergy round-trip efficiency of the proposed system are 47.72% and 69.74%, respectively. The calculations show that the minimum dynamic payback period for such a project is 3.72 years, and the lowest levelized cost of electricity is 0.0802 USD·kWh−1. This work provides a reference for peak-shaving power stations with energy storage and carbon capture.

1. Introduction

Dramatic progress has been made in renewable energy technologies over the past few decades [1]. However, grid instabilities caused by intermittent renewable resources call for developing electrical energy storage (EES) technologies to improve renewable energy penetration and peak regulation [2]. Liquid air energy storage (LAES) is now regarded as a promising large-scale and long-term EES technology. In a typical LAES system, renewable energy or off-peak electricity is consumed to produce liquid air (LA) during off-peak times, and the LA is discharged to drive stages of the turbines to generate electricity during on-peak times. Electrical energy storage and management is achieved through the interconversion of electrical energy and LA cold energy. The round-trip efficiency (RTE) is defined as the ratio of the electricity generation by air expansion to the electricity consumption by air liquefaction. Thus, RTE is employed as the most critical performance index for EES systems performance evaluation. Compared with other large-scale EES technologies, LAES is characterized by a great volumetric energy density (approximately 200 kWh·m−3) [3], a high technology readiness level [2], and an inexhaustible working medium. However, industrial applications of stand-alone LAES systems are limited by their relatively low RTE, which is approximately 50% [4].
In recent years, the thermodynamic performance enhancement of LAES systems has been studied through various methods, especially to maximize the RTE. Ref. [5] studied an LAES system based on the Kapitza liquefaction cycle and a four-stage direct expansion process with a packed bed as the cold energy storage. The results showed that the less the cold storage was utilized, the greater the impact of the charging pressure on specific consumption. Ref. [6] used a combustion chamber (CRV) with hot thermal energy storage (HTES) to recover the waste heat from LAES. An investigation based on the first and second laws of thermodynamics showed that the RTE and ERTE of the system were 65.7% and 49.7%, respectively. The investment cost for such an LAES system (5.3 MW) was USD 3.68 million. Ref. [7] found that a baseline LAES system had 20–40% of excessive compression heat, thus an organic Rankine cycle (ORC) combined with a vapor compression refrigeration cycle was adopted to generate additional electricity by using waste heat. The RTE of the coupled LAES was reported to be higher than 60%. Again, in order to fully utilize the compression heat, ref. [8] recommended a nitrogen power plant with a Brayton cycle. Still, the industrial feasibility of the system was not optimistic due to the wide temperature range (from −160 °C to 200 °C). Power plant integration, compression waste heat utilization, and cold energy recovery have proved to be effective methods for improving the LAES system’s performance. The increased power output and efficiencies of LAES allow it to support grid operations and provide opportunities to increase economic revenues.
Liquefied natural gas (LNG) cold energy has emerged as an option for improving the overall performance of LAES systems [9]. Refs. [10,11] contributed to the idea of loading LA as the cold energy carrier in the LNG supply chain. The optimized design reduced both the energy consumption and total expenses for LNG liquefaction by more than 25% [12]. Ref. [13] combined an existing LNG regasification plant with a conventional LAES system. LNG was gasified directly through two regenerative Rankine cycles during peak times, while the LNG cold energy was used to liquefy the pressurized air during off-peak times. The results showed that the involvement of the LNG regasification process in the LAES system was beneficial for the RTE. To meet the bidirectional peak electricity and natural gas (NG) requirements, ref. [14] established an integrated LAES system combining an LNG regasification terminal and an NG power plant. LNG cold energy was used in the pre-cooler and inter-cooler for air cooling during the LAES charging process. After desorbing the cold energy, the gasified NG was delivered from the pipeline network to the CRV during peak periods. The mixed gas produced by combustion was exhausted without decarbonization. Ref. [15] studied an LAES system utilizing LNG to cool the compressed air, and the surplus compression heat and LA cold energy was used to drive a two-stage ORC system. The RTE was found to be 45.44% when the liquefaction pressure was 7 MPa and the expansion pressure was 8 MPa. As previously mentioned, recovering LNG cold resources to improve the LAES system’s performance has proved to be an effective solution for the development of LAES technologies. In many countries, NG is one of the main fuels for peaking power plants and, therefore, utilizing only LNG cold energy results in a waste of the NG work capacity. A prospective method for improving the power output and power delivery flexibility of a stand-alone LAES system is to integrate a natural gas power plant (NGPP) into the LAES. The internal cold energy recovery can liquefy and, thus, capture the CO2 generated in the NGPP, ensuring low CO2 emission operation. From a thermodynamic and economic point of view, the installation of an NGPP and cryogenic CO2 capture and storage (CCS) in a typical LAES is complex and worth investigating.
Economic analysis of the LAES system has drawn more and more attention in recent years. The high-grade heat from nuclear [16], photovoltaic power plants [17], and biomethane [18] were introduced into LAES to improve their economic characteristics. Ref. [19] provided a net present value (NPV) assessment of an LAES system in the UK. The optimization results revealed that the shortest payback period for a 200 MW LAES system was 5.6 years. Ref. [20] considered an LAES system based on the Kapitza liquefaction cycle. The minimum payback period was 2.99 years through the integration of a thermoelectric generator. Ref. [21] proposed a tri-generation LAES system that supplied electricity, heat, and cold energy. The sensitivity analysis indicated that the profitability of the system was susceptible to peak electricity prices. Ref. [22] developed a real-time optimal dispatching algorithm to optimally control the LAES system by weekly-ahead electricity market price forecasting. Using the electricity market price from Ontario, the LAES system was proven to have positive revenues with an RTE of 60%. Ref. [23] proposed a tri-generation LAES system, which could provide 2.0 MW power in transition seasons, 1.7 MW heating in winter, and 2.4 MW cooling in summer. The authors underlined the competitive economic characteristics of LAES compared to other EES technologies, particularly the specific investment and the levelized cost of electricity (LCOE). Ref. [24] found that the LCOE for an LAES system equipped with an NG combustion process could be reduced to 161 EUR·MWh−1, which was lower than that of an LAES system with waste heat recovery (171 EUR·MWh−1). The above studies have analyzed LAES systems in regard to a wide range of reported economic characteristics and underlined the potential for commercial development and the application of LAES technologies. However, little literature has been found on the economic study of an LAES–NGPP–CCS system.
Here, an LAES system enhanced with an NGPP is proposed for both electrical energy storage and power peak shaving. The system uses inexpensive electricity to produce and store LA. When electricity prices are high, gasified LA is split into two parts in a specified ratio, a part of them is expanded directly in air turbines (ATs) and the other combusts with NG and, then, drives a flue gas turbine (GT). A CCS unit is incorporated into the proposed plant, which allows the proposed system to overcome the operational limitations imposed by stricter CO2 emission standards. The research discusses whether this integrated design is theoretically feasible for future adoption.
The objective of this study is to assess the thermodynamic sensitivity and economic profitability of the proposed system with different charging pressures, air expansion stages, and on-peak and off-peak electricity prices. In Section 2, the system configuration and operation mechanism are described. In Section 3, the initial conditions, assumptions, and mathematical models are given. In Section 4, the results of the thermodynamic and economic evaluation are presented and discussed. In Section 5, the main findings are summarized.

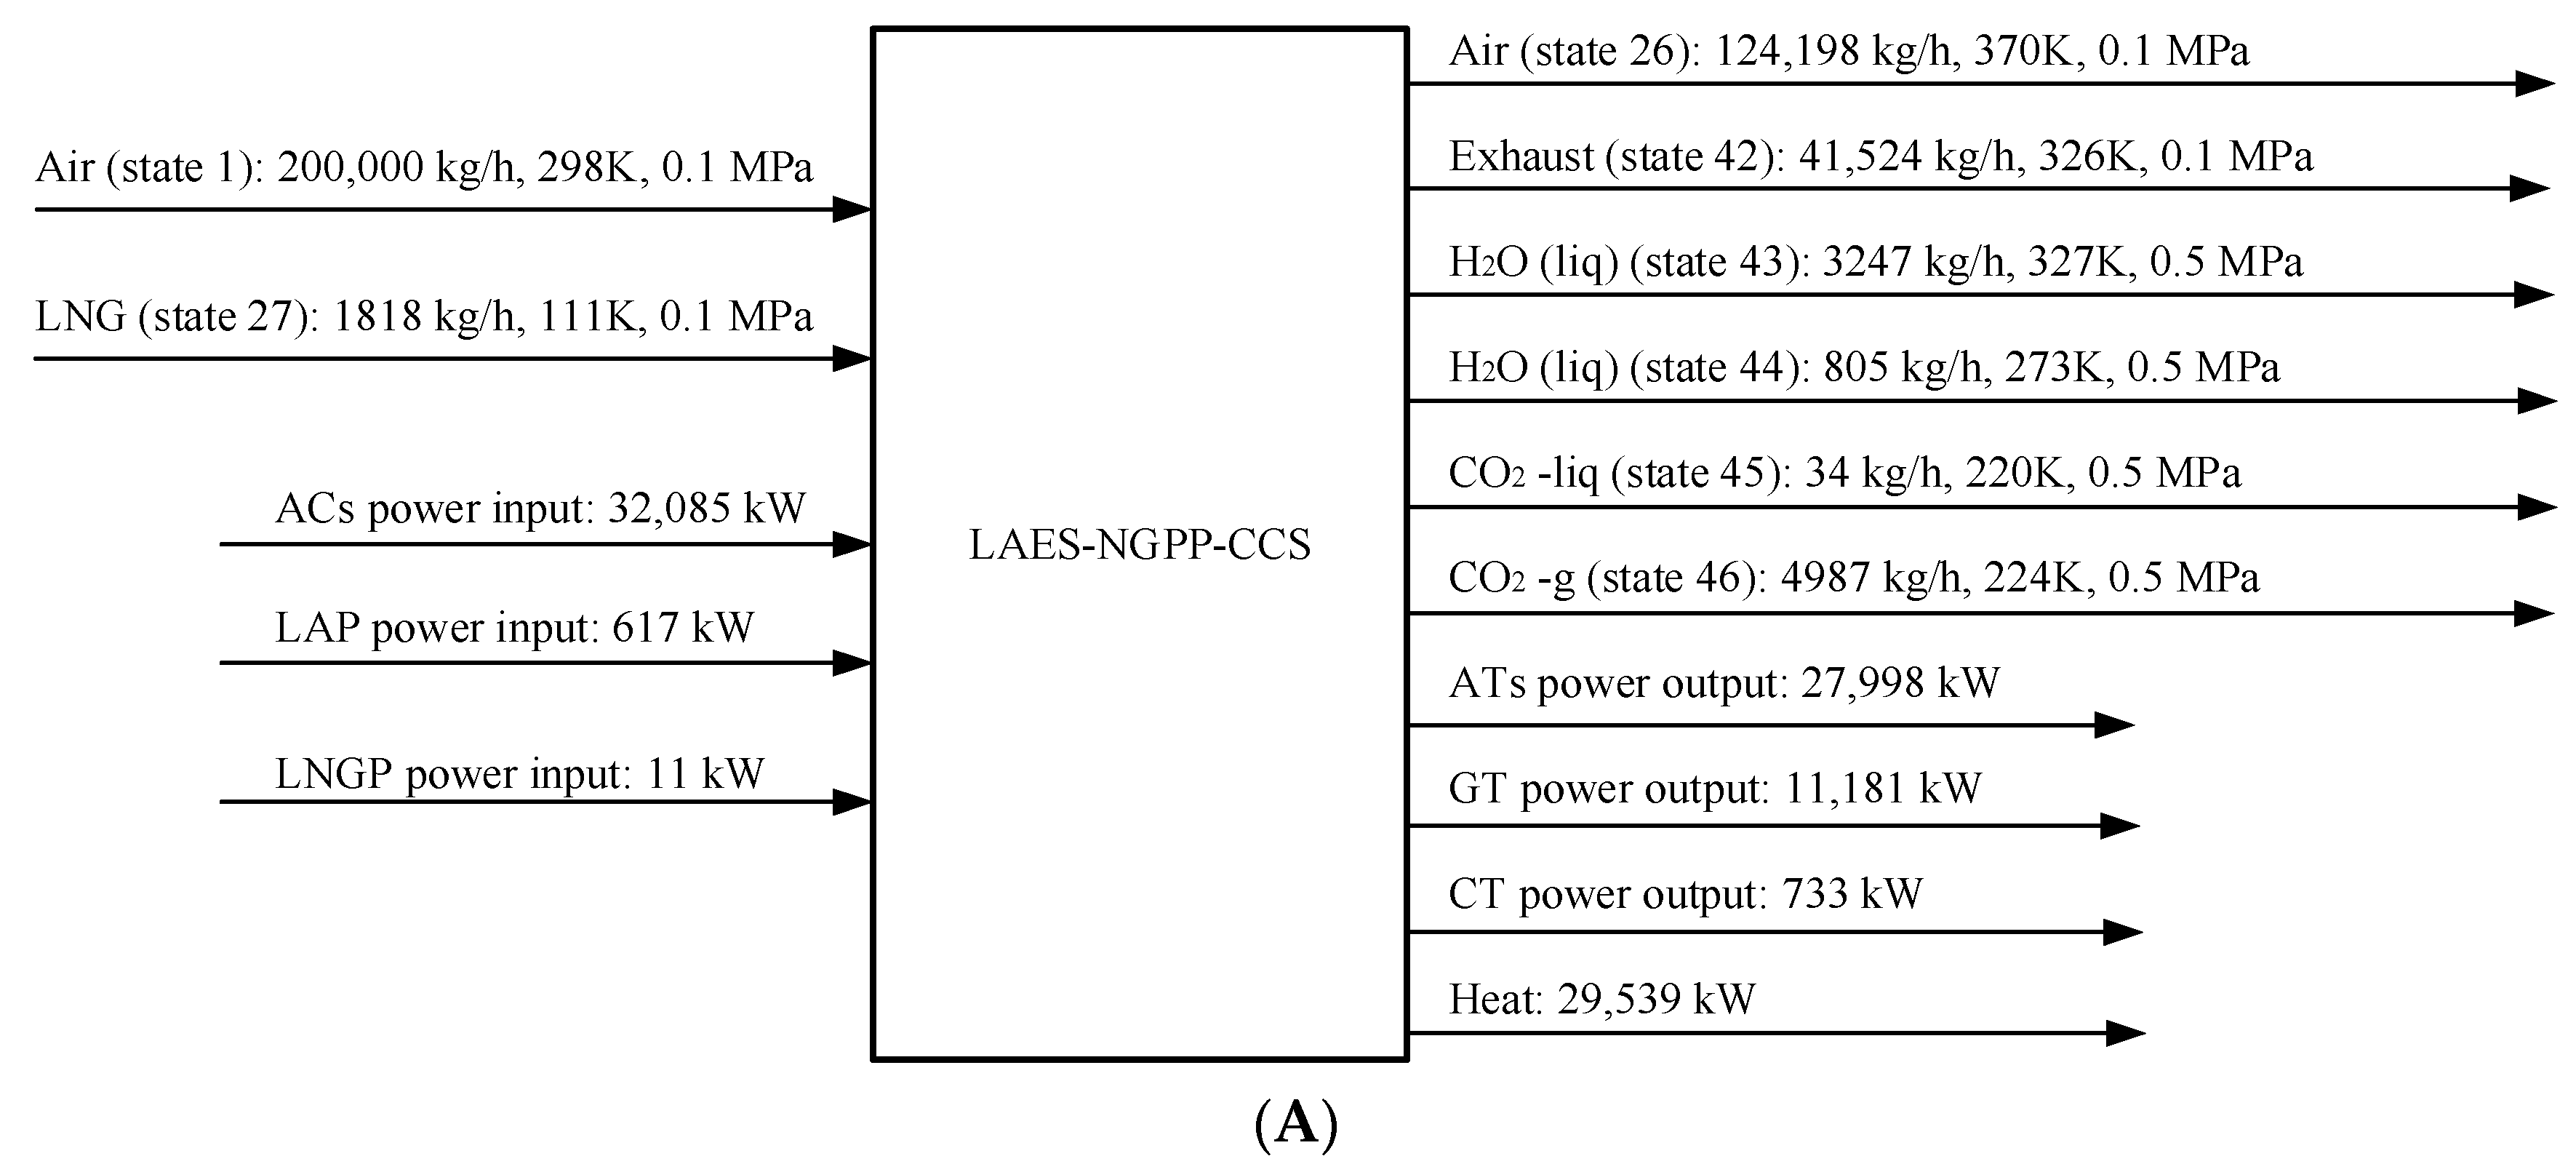
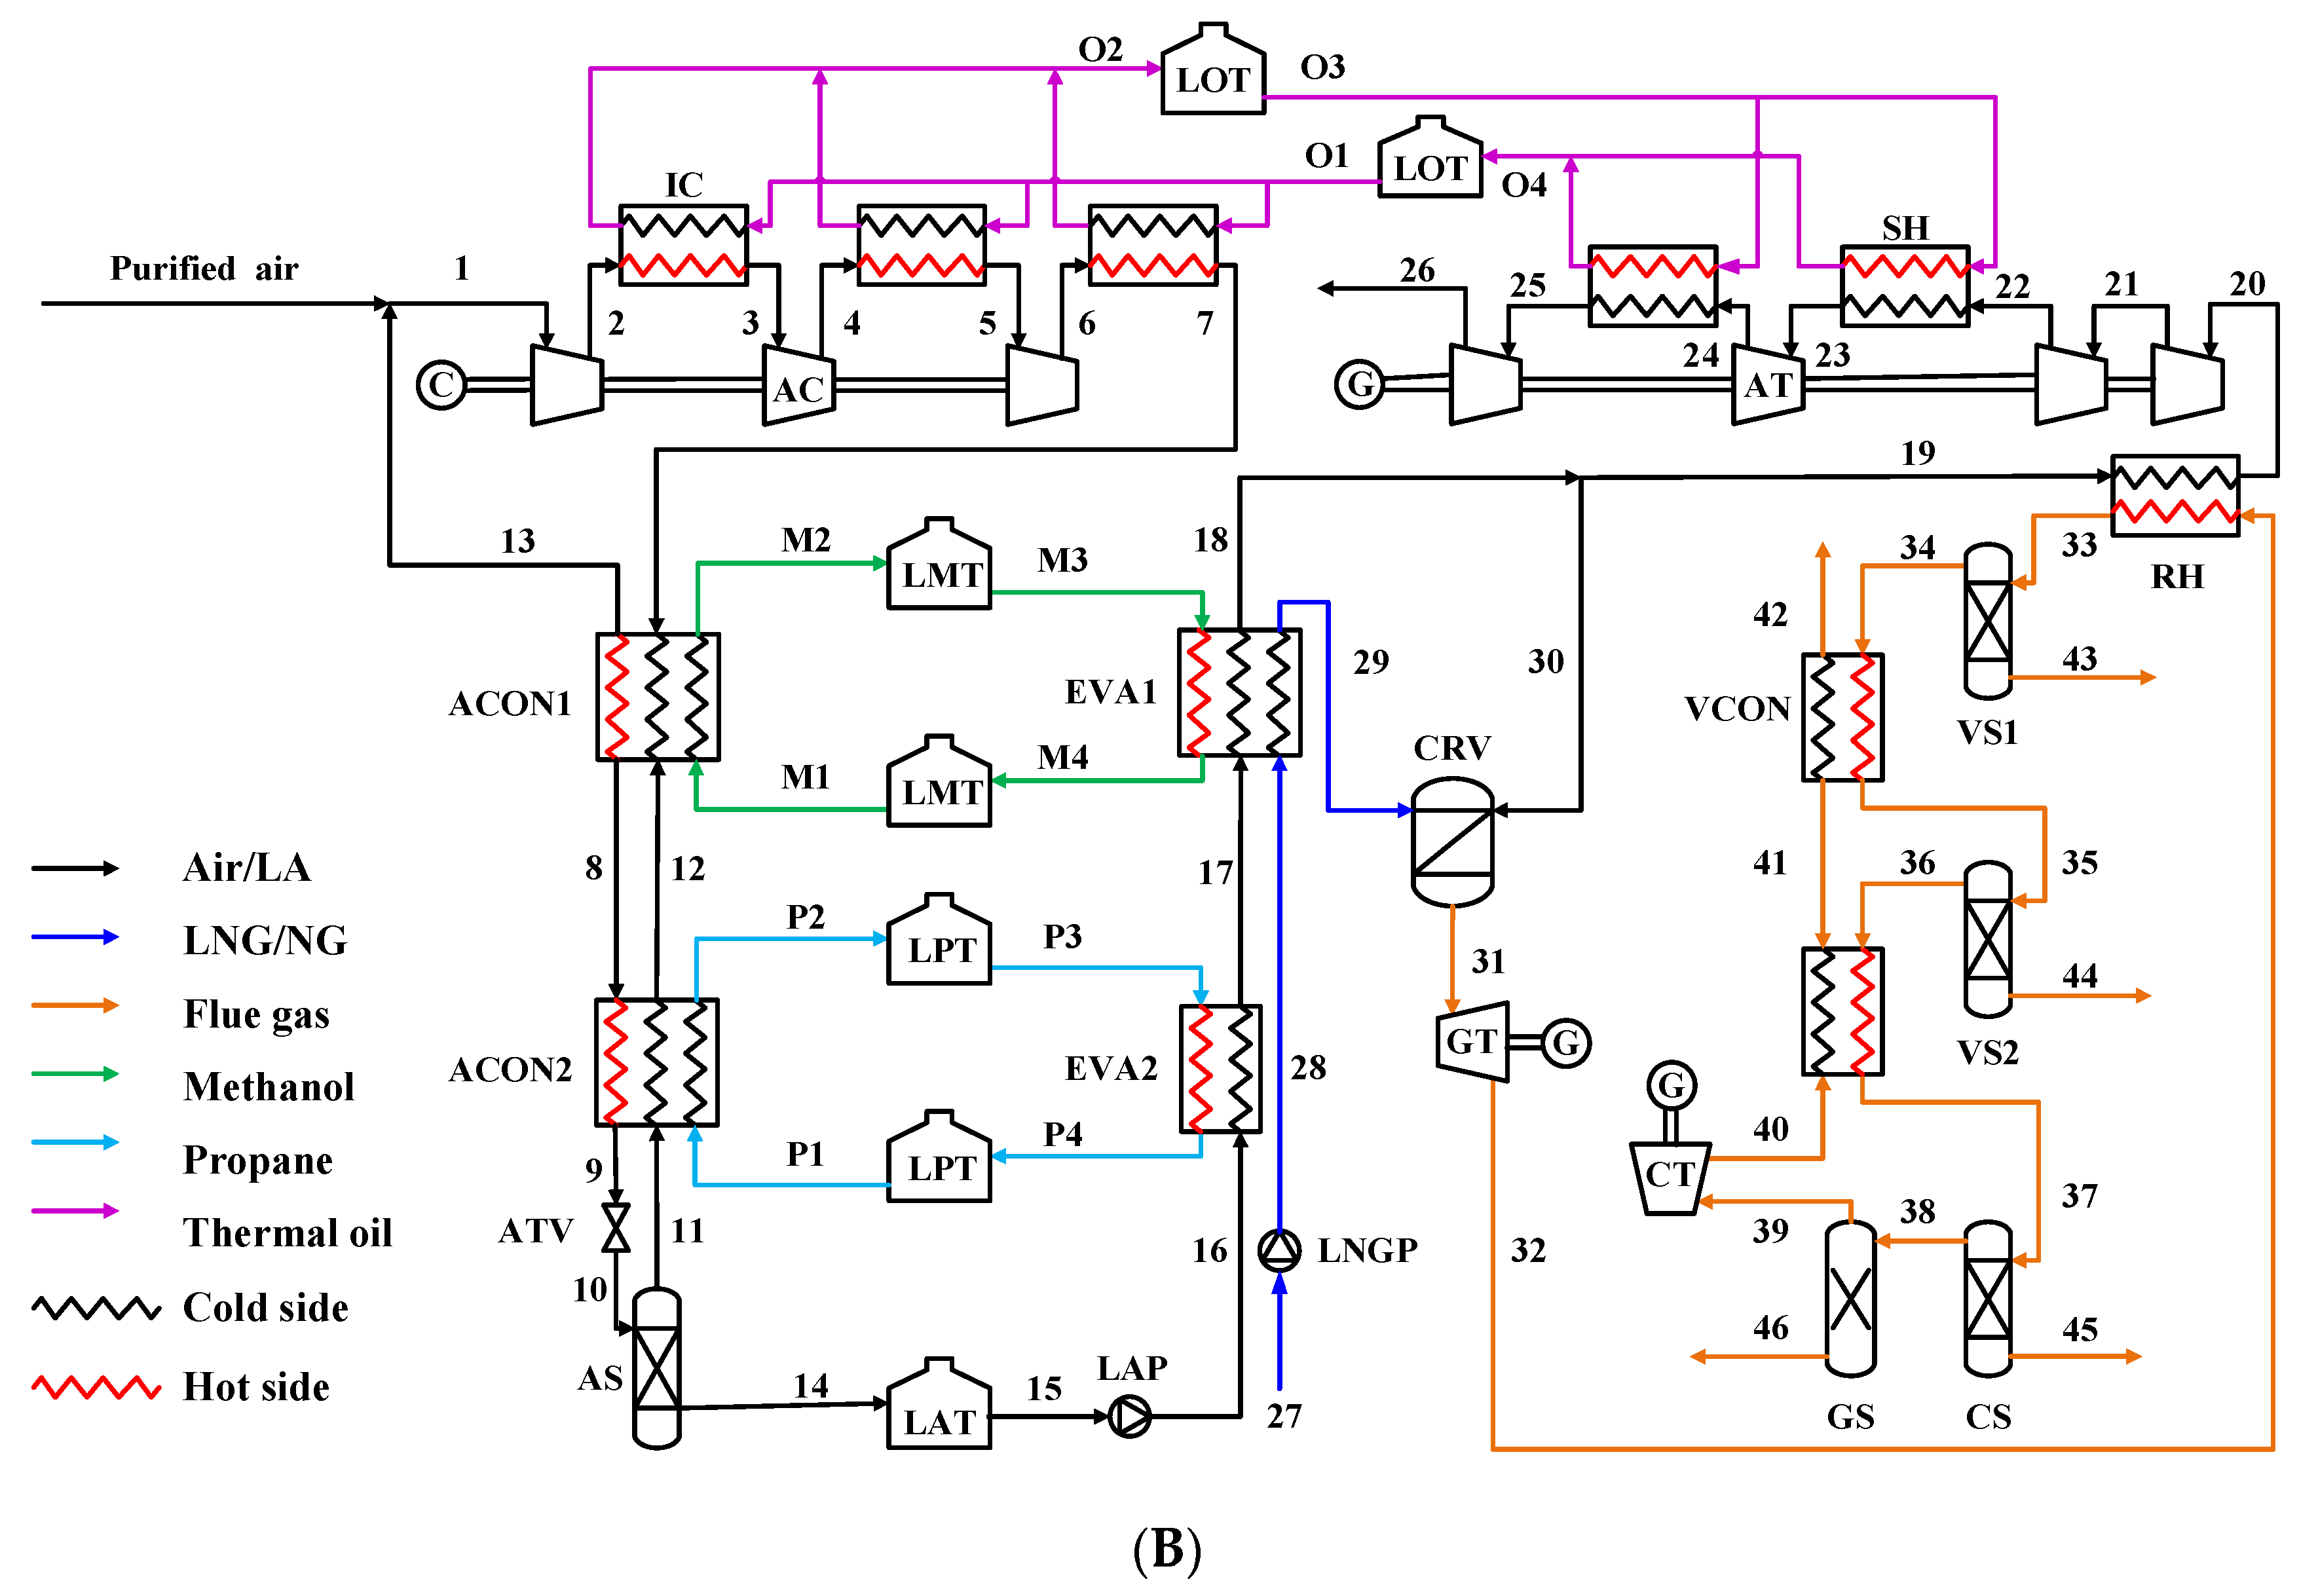
2. System Description

The sketch of the proposed system, which comprises an LAES unit, an NG power plant, and a CO2 capture unit, is depicted in Figure 1. A Linde–Hampson liquefaction cycle is adopted for the air liquefaction. The present study does not discuss the purification and pre-treatment of the feed gas, LNG transmission, and storage processes [20]. In the proposed arrangement, methanol and propane are exploited to recycle the cryogenic energy of the LA in the discharging period, to pre-cool the compressed air in the charging process. To explore the overall performance of the proposed complex system, assume that the compressors and turbines are operating at a steady state. A brief schematic is provided in Figure 1A to indicate the temperature, pressure, heat, and power of all the inlets and exits.
During the charging period, the 1–2 air compressor (AC) in the first stage, the 3–4 AC in the second stage, and the 5–6 AC in the third stage, are operated to pressurize the purified air with surplus power from the grid. The air compression process is associated with a huge amount of waste heat release at a high outlet temperature. Therefore, the 2–3 inter-cooler (IC) in the first stage, the 4–5 IC in the second stage, and the 6–7 IC in the third stage, use O1-O2 thermal oil to recover the compression heat [25]. In the air liquefaction unit, compressed air is cooled down by circulating refrigerants (i.e., M1–M2 methanol and P1-P1 propane) and the 11–13 reflux air in the 7–9 air condensers (ACONs). Meanwhile, the refrigerants are stored in thermal insulated containers, i.e., liquid methanol tanks (LMTs) and liquid propane tanks (LPTs), and thermal oil is stored in liquid thermal oil tanks (LOTs). Afterwards, a two-phase mixture of air is produced through an expansion in the 9–10 throttle valve (ATV). As a result, LA is separated in the 10–14 air separator (AS) and stored in the 14–15 liquid air tank (LAT), while gas-phase air (state 11) flows back into the ACONs.
During the discharging period, LA and LNG are pumped into the 16–18 evaporators (EVAs) by the 15–16 liquid air pump (LAP) and the 27–28 LNG pump (LNGP), respectively, and then the LA and LNG are gasified. The required evaporating heat is supplied by the heated M3–M4 methanol and P3–P4 propane. Then, the air splits into two streams, one entering the 30–31 CRV being mixed with NG (state 29) for combustion, and the other entering the 19–20 re-heater (RH), the 20–21 AT in the first stage, the 21–22 AT in the second stage, the 23–24 AT in the third stage, and the 25–26 AT in the fourth stage. The exhaust air from the AT (stages 22 and 24) is heated up by the thermal oil in the O3–O4 superheater (SH). Flue gas from the combustion (state 31) is mainly composed of CO2, water (H2O), and nitrogen (N2), etc.
The flue gas is at a high temperature and pressure (approximately 1600–1750 °C, 7 MPa) and is used to drive the 31–32 GT to generate power. The RH is responsible for condensing the moisture of the flue gas (state 32) and heating the inlet air in the AT in the first stage, and the 33–43 vapor separator 1 (VS1) is employed to remove the condensed H2O. For deep moisture removal, the flue gas (state 34) is further cooled in the 34–35 vapor condenser (VCON), and all of the condensed H2O is separated in the 35–44 vapor separator 2 (VS2). Then, the dry flue gas (state 36) passes through the 36–37 carbon dioxide condenser (CCON) and the 37–38 carbon dioxide separator (CS) serially, where partial CO2 can be condensed and removed, while the residual CO2 is separated in the 38–46 gas separator (GS). Since the decarbonized flue gas (state 39) is still at a high pressure (approximately 0.546 MPa), it expands in the 39–40 cryo-turbine (CT) to generate electricity and cold energy. The flue gas flows back into the 40–41 CCON and 41–42 VCON, releases its cold energy, and is finally discharged. Stream 42 contains mainly nitrogen and argon.

3. Methods

3.1. Initial Condition and Assumptions

Detailed simulations of the steady-state process are performed with Aspen HYSYS software. The Peng–Robinson equation of state is employed for material property calculations. According to the published literature, identical assumptions are adopted in the present study in order to simplify the problem and to obtain comparable results. Table 1. lists the default parameters for the process design. The simulation assumptions are as follows:
  • The atmospheric temperature and pressure are set to 298.1 K and 101.3 kPa [26];
  • The energy storage and recovery processes operate at steady states [27];
  • Ignore the kinetic and potential energy variations [28];
  • The pressure drops and heat losses in the connection tubes and storage tanks are neglected [27,28];
  • The pressure drops through the heat exchangers are considered to be 1% of the inlet pressure [29];
  • The ACs have adiabatic efficiencies of 90% [27], the LAP and LNGP have adiabatic efficiencies of 70% [30], and the ATs have isentropic efficiencies of 90% [26,29];
  • The minimum temperature difference (MTD) in the heat exchangers is set at 3K [27];
  • NG is completely combusted in the CRV;
  • The LNG is composed of methane [31]. The purified air stream is simplified to a ternary mixture consisting of 77% nitrogen, 22% oxygen, and 1% argon.
Table 1. Process design basis [27].
ParametersValues
Air   mass   flow   rate   m 1 /kg·h−1200,000
Air   inlet   temperature   T 1 /K298.1
Air   inlet   pressure   p 1 /MPa0.1013
Air   outlet   pressure   p 26 /MPa0.1
Liquid   air   storage   pressure   p 14 /MPa0.1
Liquid   air   regasification   pressure   p 16 /MPa8
LNG   feed   temperature   T 27 /K111.4
LNG   feed   pressure   p 27 /MPa0.1
LNG   regasification   pressure   p 28 /MPa7
Charging   duration   t c h /h8
Discharging   duration   t d i s /h8

3.2. Thermodynamic Analysis

Energy- and exergy-based analyses are conducted to investigate the thermodynamic performance of the proposed system. Specific energy and exergy equations for key components are included in Appendix A, Table A1.
The round-trip efficiency (RTE) reflects the proportion of a given electricity input that can be recovered, and is expressed as the ratio of the electricity net output to the sum of the electricity consumption and low heating value (LHV) of the LNG fuel [32].
R T E = ( P A T + P G T + P C T P L N G P P L A P ) · t d i s ( P A C + L H V 27 · m 27 ) · t c h
where P A T refers to the power produced by air turbines (kW), P G T refers to the power produced by the flue gas turbine (kW), P C T refers to the power produced by the cryo-turbine (kW), P L N G P refers to the power consumed by the LNG pump (kW), P L A P refers to the power consumed by the liquid air pump (kW), t d i s is the discharging period (h), P A C refers to the power consumed by the air compressors (kW), L H V 27 refers to the low heating value of the LNG fuel (kJ/kg), m 27 refers to the mass flow rate of the LNG fuel (kg·h−1), and t c h is the charging period (h).
Exergy analysis is used to evaluate the energy conversion with different types of energy inputs and outputs, considering the quality of various energy streams [32]. According to the second law of thermodynamics, the overall exergy round-trip efficiency (ERTE) is calculated as Equation (2),
E R T E = ( P A T + P G T + P C T + Q A C + E x 26 + E x 42 + E x 43 + E x 44 + E x 45 + E x 46 ) · t d i s P A C · t c h + ( P L N G P + P L A P + E x 27 + L H V 27 · m 27 ) · t d i s
where Q A C is the stored compression heat (kW), and E x 26 , E x 27 , E x 42 , E x 43 , E x 44 , E x 45 , and E x 46 are the exergy of stream 26, 27, 42, 43, 44, 45, and 46 (kW), respectively.
Specific power consumption (SPC, kWhe·kgLA−1), namely the electricity required to produce a specific mass of liquid air, is a valid tool for comparing the energy storage efficiency of various LAES systems [3],
S P C = P A C / m L A
where m L A is the mass flow rate of the LA (kg·h−1).
The liquefaction ratio (%), Y, is defined as the ratio of the mass flow of LA to the mass flow of compressed air, m1 (kg·h−1).
Y = m L A / m 1

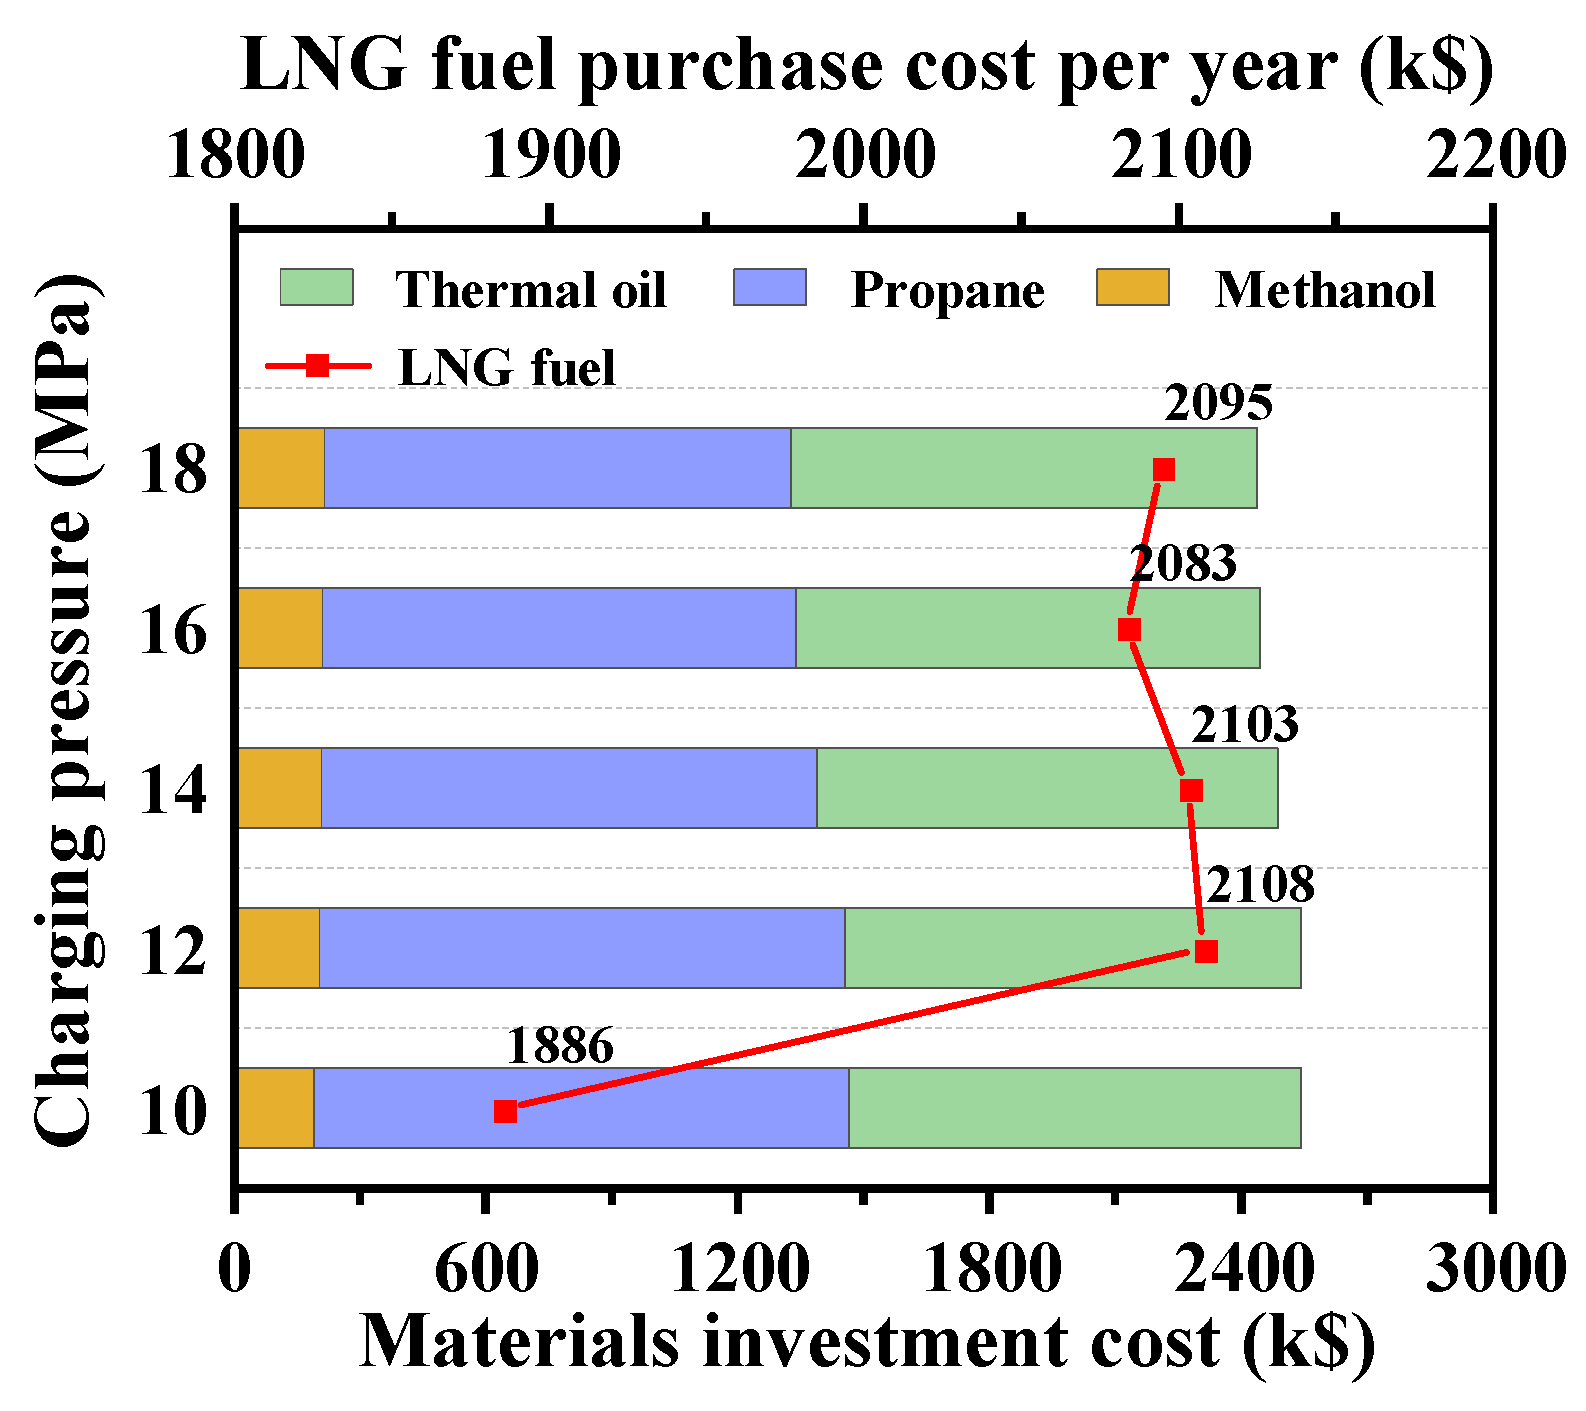
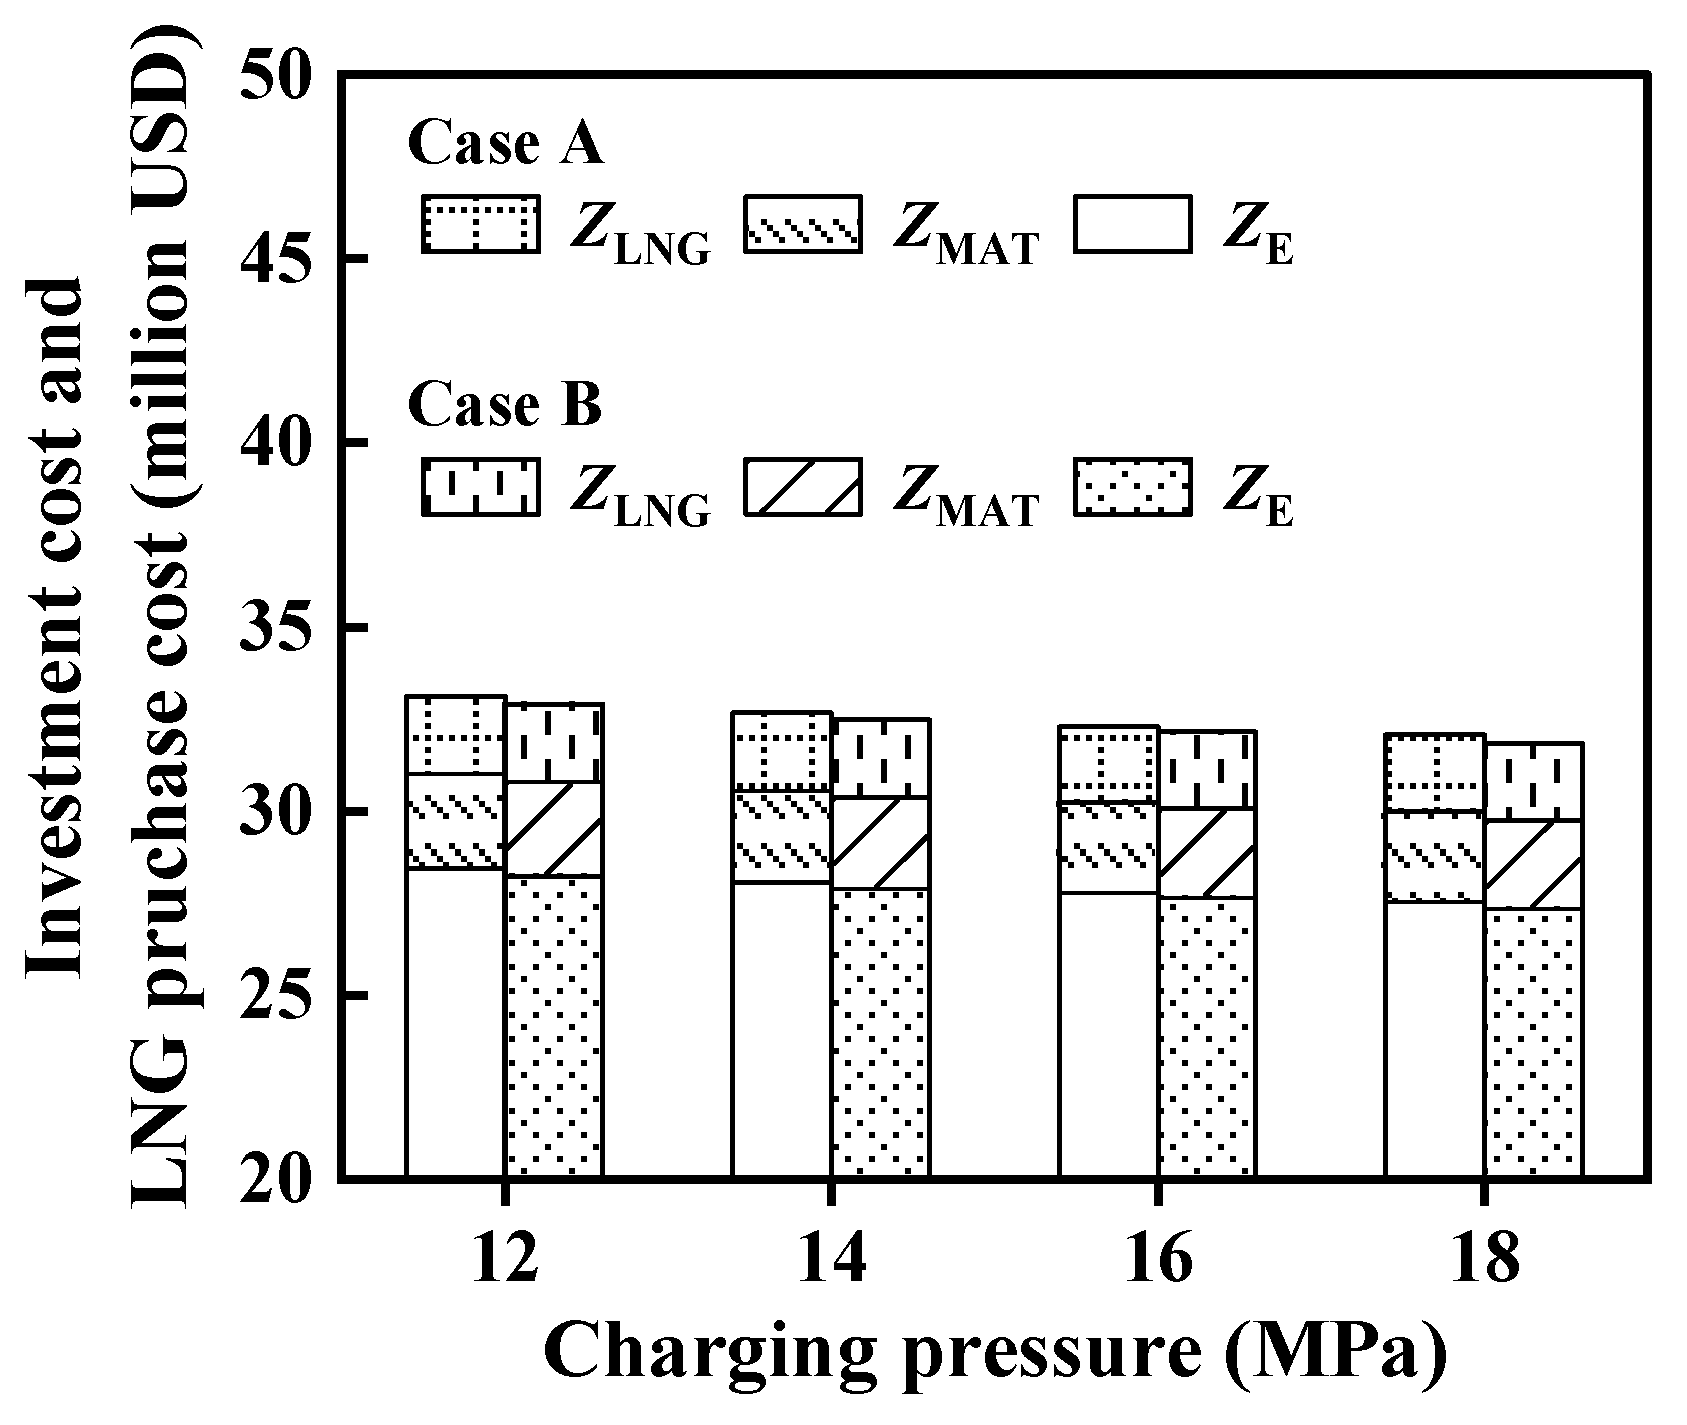
3.3. Economic Analysis

3.3.1. Investment Cost Function

Economic analysis is used to estimate the capital costs and economic benefits of a system. Cost estimation models for the equipment and materials are presented in Table 2 and Table 3. Relevant references for the last three years are also provided.

3.3.2. Economic Performance Indicators

It is indispensable to explore the economic risks and rewards of the proposed system by establishing economic criterion. The calculation formulas for the economic evaluation indicators are given in Equations (4)–(13), and all formulas refer to published studies with a high relevance to this study. Table 4 reveals the key parameters required for the economics calculations, and the data are based on recent official sources, such as the International Monetary Fund.
The initial investment cost Z I I C (USD) includes the total equipment investment cost Z E q   (USD) and materials investment cost Z M a t (USD) [14],
Z I I C = Z E q + Z M a t
Z M a t = Z o i l + Z m e t + Z p r o
where Z o i l , Z m e t , Z p r o is the investment cost of the thermal oil, methanol, and propane (USD).
The purchase cost of the LNG per year Z L N G (USD) is [36],
Z L N G = 397 t d i s × m 27 × 365 / 1000
where m 27 is the mass flow rate of the LNG fuel (kg·h−1).
The detailed expression of the total annual cost A C t (USD) is [14],
A C t = α × Z I I C + P in   × t c h × 365 × Z E , o f f p e a k + Z L N G
where α is the annual operation and maintenance factor, Z I I C is the initial investment cost (USD), P in   is the power input during the charging process (kW), and Z E , o f f p e a k is the unit price of the off-peak electricity (USD·kWh−1).
The total annual revenue A R t (USD) is expressed as [14],
A R t = P out   × t d i s × 365 × Z E , o n p e a k
where P out   is the power output during the discharging process (kW), and Z E , p e a k is the unit price of the on-peak electricity (USD·kWh−1).
Then, the total annual profit A P t (USD) can be determined as follows,
A P t = A R t A C t
Net present value, NPV, can assess the long-term profitability of a system with the cumulative sum of the total annual profits over the entire lifetime, deducting the initial investment cost. Future profits are discounted at an appropriate discount rate [14],
N P V = n = 1 S L A P t ( 1 + i ) n Z I I C
where n refers to the considered year, SL refers to the service life of the proposed system, and i refers to the discount rate.
The dynamic payback period (DPP) represents the payback years that the discounted NPV recovers the initial investment cost. The DPP method takes into account the influence of the time factor on the monetary value, which is defined as [26]:
D P P = j 1 + N P V j 1 A P t
where j represents the year of the first positive NPV harvest, and N P V j 1 is the absolute value of the NPV at the ( j 1 ) th year (USD).
The levelized cost of electricity (USD·kWh−1), LCOE, allows for comparing the electricity generation costs based on the same criteria. It is as described by the following formula [14,36,37]:
L C O E = R × Z I I C + n = 1 S L A C t ( 1 + f ) n n = 1 S L E o u t ( 1 + f ) n = R × Z I I C + n = 1 S L A C t ( 1 + f ) n n = 1 S L P o u t · t d i s · 365 ( 1 + f ) n
R = R a i × ( 1 + R a i ) S L ( 1 + R a i ) S L 1
where R a i is the annual interest rate, R is the capital recovery factor, which is determined by R a i , f is the inflation rate, and E o u t (kWh) represents the electricity generation in year n , which equals the output power multiplied by the discharge periods in year nth.
Table 4. Parameter interpretation of the economic evaluation indicators [30,38,39,40,41,42].
ParameterValue
Service life (SL)20 years
Discount   rate   ( i )3%
Inflation   rate   ( f )2%
Annual   interest   rate   ( R a i )5%
Annual   operation   and   maintenance   factor   ( α )5%

4. Results and Discussion

The compressor outlet pressure (i.e., charging pressure) and air expansion stages affect the power consumption, power generation, and the initial investment cost. Moreover, on-peak and off-peak electricity prices also impact the benefits of price arbitrage. Therefore, this section focuses on a sensitivity analysis of these key parameters to investigate the overall thermodynamic efficiency, energy consumption and generation, and cost-effectiveness. Other parameters (e.g., ATV inlet temperature, air split ratio, etc.) are kept constant in the simulation.

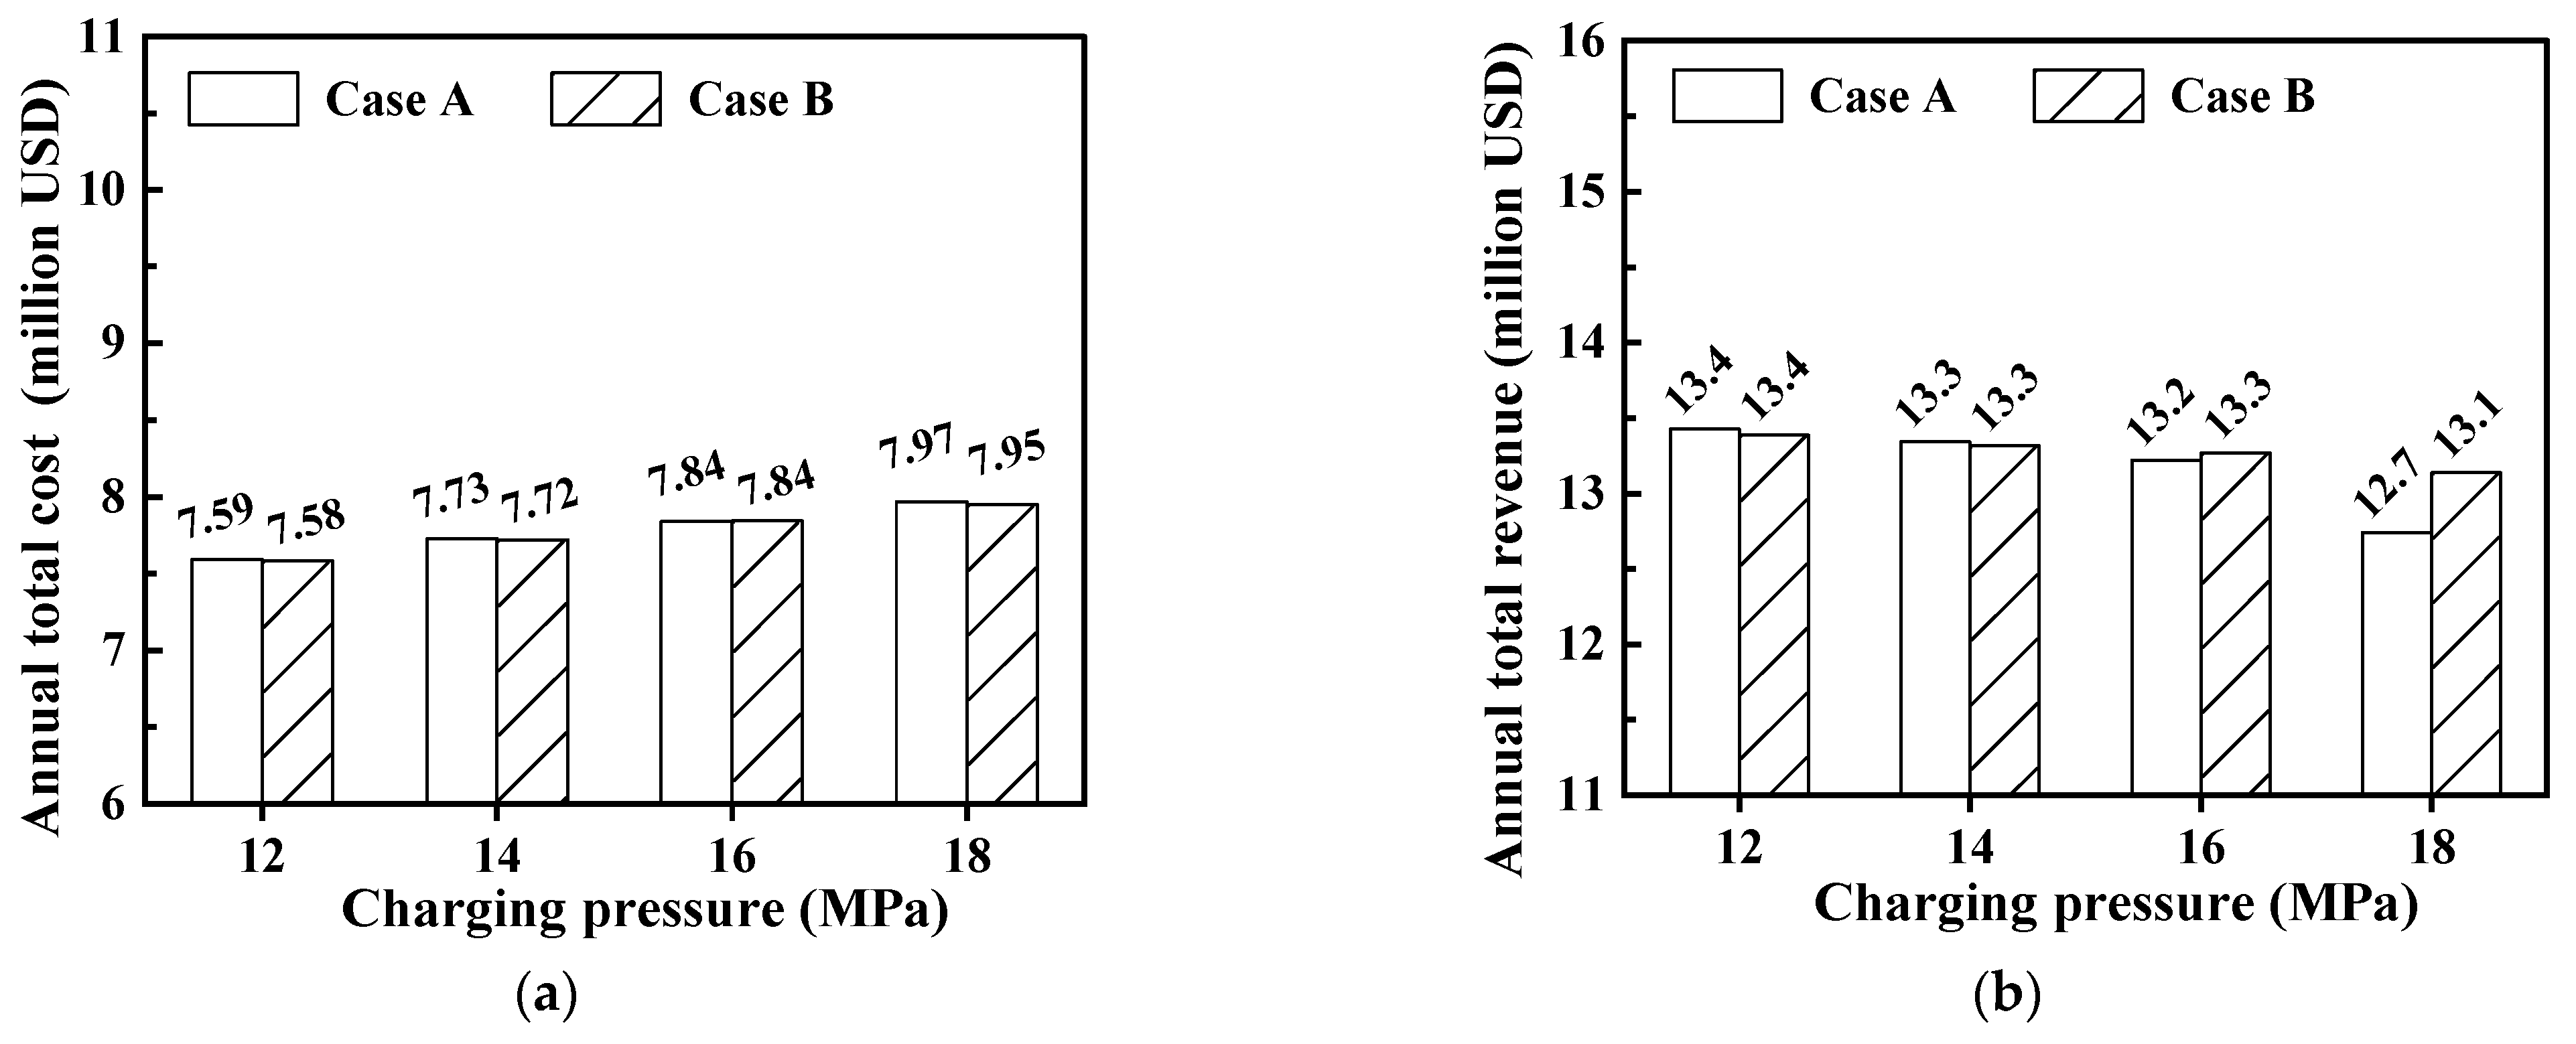
4.1. Compressor Outlet Pressure

Figure 2 illustrates the effect of the charging pressure on the RTE, ERTE, and SPC. It is noticed that the RTE increases from 45.62% to 47.72% as the charging pressure increases from 10 MPa to 12 MPa, and then the RTE shows a downward trend. The ERTE reaches its maximum value of 69.74% at the charging pressure of 12 MPa and drops to 69.17% as the charging pressure rises to 18 MPa. When the charging pressure increases from 10 MPa to 18 MPa, the compression power keeps increasing from 30,546 kW to 35,649 kW (by 16.71%), the liquefaction ratio increases from 83.44% to 86.49% and then gradually decreases to 84.97%, and the SPC rises from 0.1830 kWhe·kgLA−1 to 0.2098 kWhe·kgLA−1. The total net output power of the proposed system, which takes into account the power produced by the ATs, GT, and CT, as well as the power consumed by the LAP and LNGP, increases from 24,250 kW to 27,369 kW as the charging pressure varies from 10 MPa to 12 MPa. As the charging pressure further increases to 18 MPa, the total net output power decreases to 25,961 kW.
Figure 3 shows the materials investment cost and LNG fuel purchase cost per year. Figure 4 shows the investment in the equipment. The initial investment cost Z I I C is USD 29.88–30.99 million, and the investment cost in the LPTs (USD 8.98–10.25 million), the ACs, ATs, and LOTs accounts for the main part of the Z I I C . Capital investment in the materials accounts for at most 8.5% of the total capital expenditure. As the charging pressure increases, the compression power consumption and the compression heat increase, resulting in higher investment costs for the ACs and thermal oil. The liquefaction temperature of the compressed air also increases with rising charging pressure, decreasing the cold energy requirement for the air condensation process, and reducing the investment costs in propane and the LPTs.
Figure 5a shows that the NPV increases, as time goes by, during the life span of the system. The maximum NPV of USD 55.81 million and the minimum NPV of USD 40.98 million occur at the charging pressures of 12 MPa and 18 MPa, respectively. Therefore, it is indicated that the optimal lifetime economic benefits of the project occur with a charging pressure of 12 MPa. When operating at a charging pressure of 10 MPa, the NPV of the system is USD 41.09 million, which is USD 109 thousand higher than the NPV at 18 MPa. This is due to the similar total annual profit for the two different conditions (USD 4,770,187 at 10 MPa and USD 4,769,784 at 18 MPa).
Both the DPP and LCOE show a decreasing trend before increasing with the rising charging pressure, according to Figure 5b. When increasing the charging pressure to 12–16 MPa, the DPP can be shortened to 5.73–6.20 years. The LCOE with the charging pressure of 12 MPa is 0.0965 USD·kWh−1, which is 0.0101 USD·kWh−1 less than that with the charging pressure of 18 MPa. It is because the largest net output power of the system occurs at the charging pressure of 12 MPa (see Table 5), allowing the system to generate the highest total annual revenue.
The results show that the charging pressure of 12 MPa can be an optimal condition with ideal technical and economic performance. When the charging pressure is set to 12 MPa, the RTE, ERTE, LCOE, and net output power of the system reach their maximum values (47.72%, 69.74%, 0.0965 USD·kWh−1, and 27,369 kW, respectively), and the SPC is 0.1855 kWhe·kgLA−1. Although the investment costs for the components (USD 28.44 million) and materials (USD 2.55 million) are high, it takes only 5.73 years to recoup the invested capital, with an expected net return of USD 55.81 million over 20 years. The detailed stream parameters (i.e., T, p, m) are included in Appendix A, Table A2.

4.2. Air Expansion Stages and Superheating Stages

Table 6 summarizes the effects of the air expansion stages and superheating stages on the overall thermodynamic and economic performance. Case A represents the four-stage air expansion and two-stage air superheating, as shown in Figure 1. Case B represents the three-stage air expansion and one-stage air superheating. This section carries out a comparative analysis of Case A and Case B to investigate the effect of air expansion stages on the coupled system performance.
The RTEs of Case A and Case B decrease as the charging pressure varies from 12 MPa to 18 MPa. The maximum RTE of Case B is up to 47.58%, 0.14% lower than that of Case A. The minimum RTE of Case B is 44.10%, 1.66% higher than that of Case A. The ERTE of Case B decreases with an increase in the charging pressure. For the given charging pressure values, the highest ERTE in Case B is 69.91%, which is 0.18% higher than that of Case A. The SPC is similar in both cases, with 0.1855–0.2102 kWh of electricity consumed to generate 1 kg of LA. In Case B, the DPP and LCOE are 5.72–6.32 years and 0.0967–0.1032 USD·kWh−1, respectively. When the charging pressure is 12 or 14 MPa, the difference in the LCOE between Case A and Case B is within 0.2. When the charging pressure is 16 or 18 MPa, the shorter DPP and lower LCOE are in Case A than in Case B.
Figure 6 shows the equipment investment cost, materials investment cost, and LNG purchase cost for both Case A and Case B. At a charging pressure of 12, 14, 16, and 18 MPa, Case B offers a lower equipment investment cost, accounting for USD 28.23, 27.87, 27.63, and 27.34 million, respectively, which is less than that of Case A (USD 28.44, 28.07, 27.78, and 27.54 million, respectively). This can be attributed to the lower costs for the ATs and SH in Case B.
The annual total cost and revenue are shown in Figure 7. The power consumption in the ACs increases by over 1 MW for a 2 MPa increase in the charging pressure, and the annual electricity purchase cost increases correspondingly, resulting in an increase in the annual total cost. With constant on-peak and off-peak electricity prices, the power generation is reduced with an increase in the charging pressure, resulting in lower annual total revenue. Therefore, the NPV for Case B charging at 18 MPa is USD 47.43 million, which is less than that at 12 MPa of USD 55.60 million, as shown in Figure 8.
By incorporating a configuration with the three-stage air expansion and one-stage air superheating, the economic advantages of the proposed system are enhanced. At a charging pressure of 12 MPa, Case B matches the system well, leading to the greatest profits, while minimizing the annual cost. With an initial investment of USD 30.78 million and an annual cost of USD 7.58 million, Case B generates an annual revenue of USD 13.4 million. The system consumes 32,085 kW of off-peak power in energy storage mode, while it produces a net output power of 27,291 kW in energy release mode.

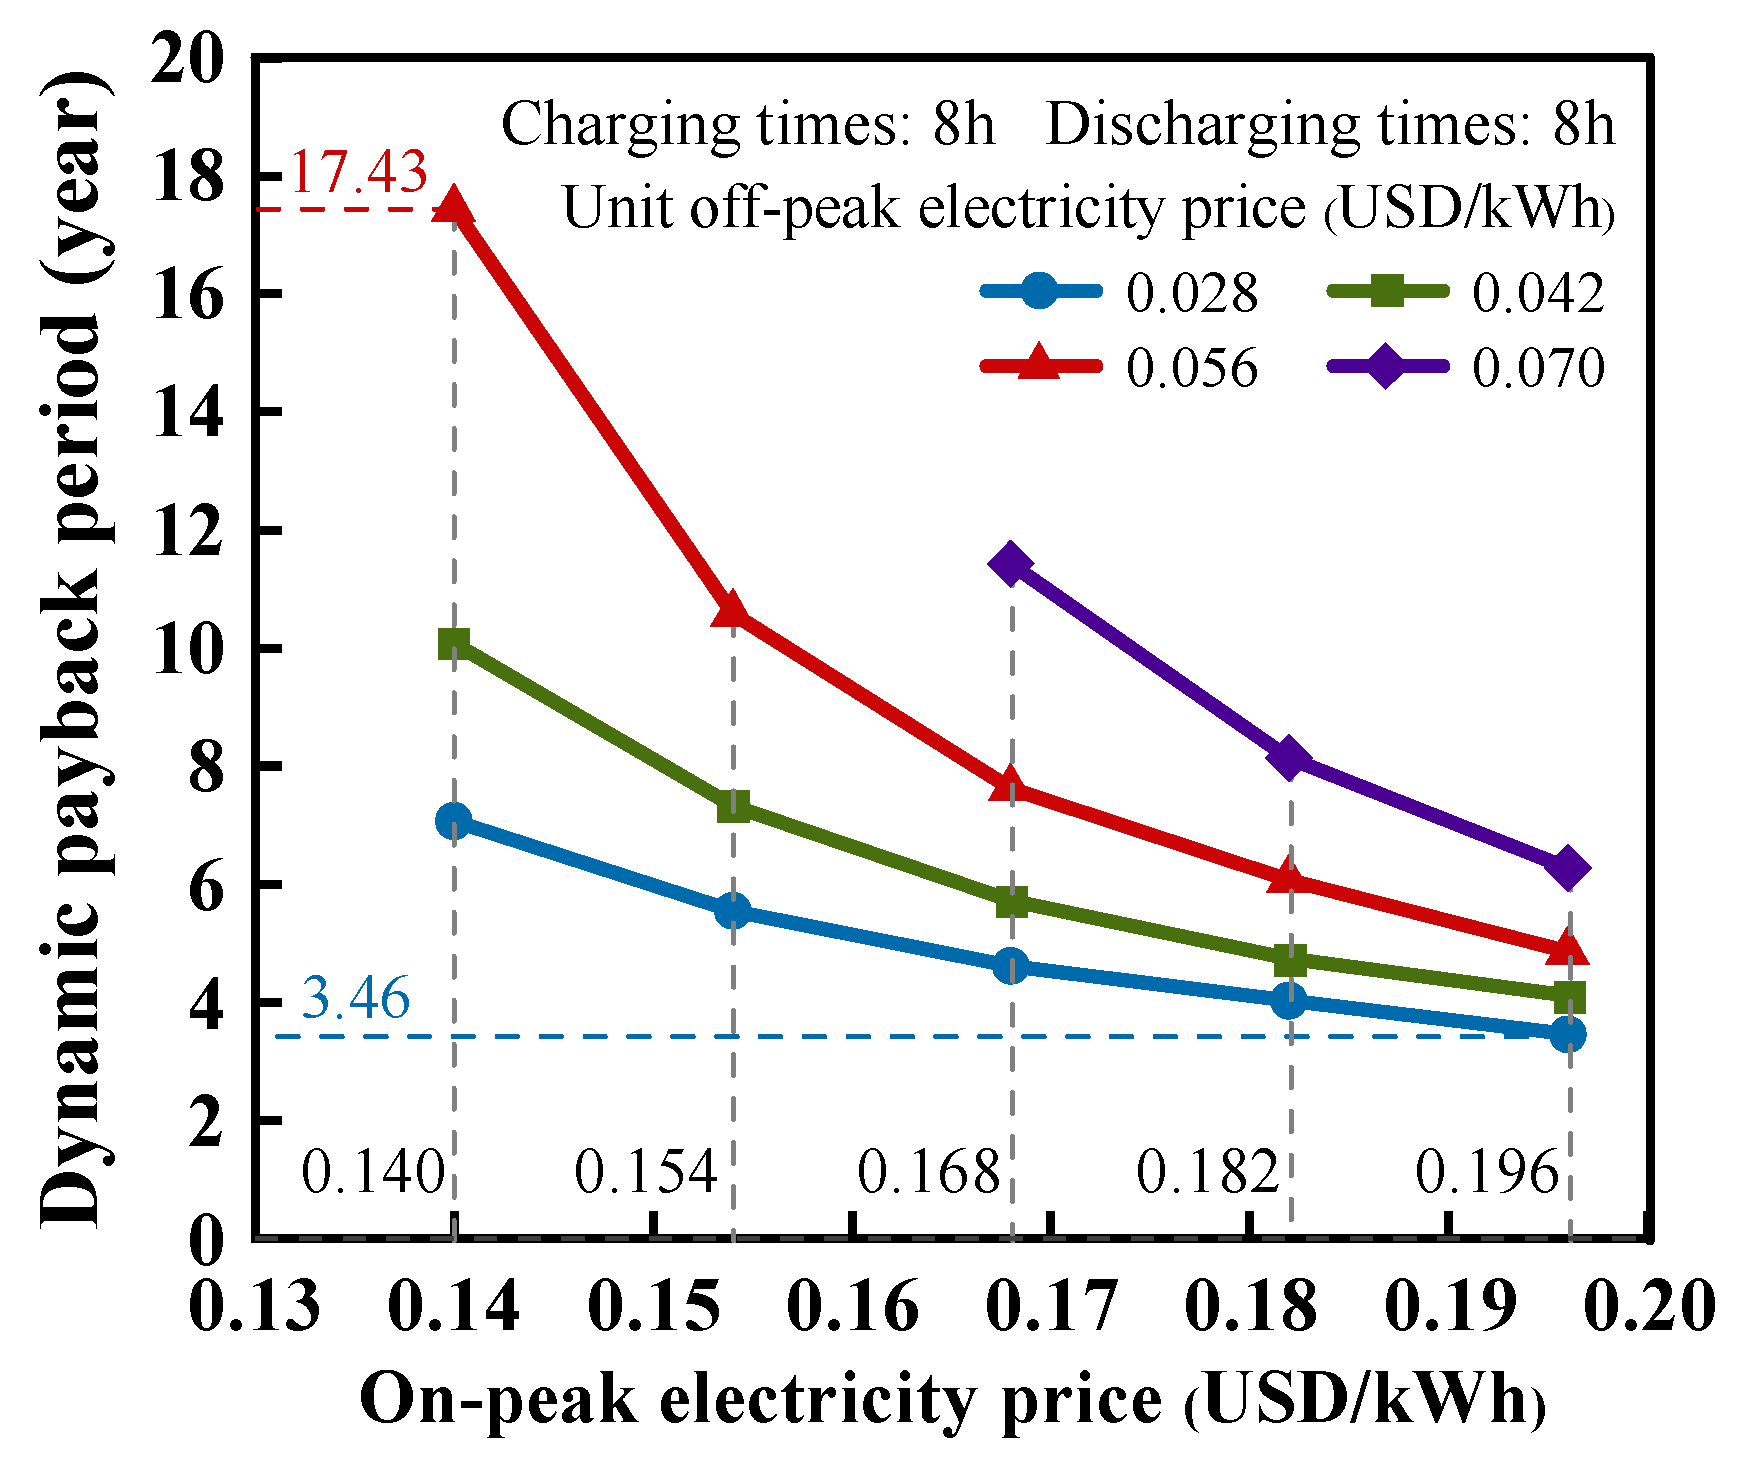
4.3. On-Peak and Off-Peak Electricity Prices

The on-peak and off-peak electricity prices significantly affect the economic feasibility of the proposed system. In this section, Case B is studied at the charging pressure of 12 MPa. The ranges of on-peak and off-peak electricity prices are 0.028–0.070 USD·kWh−1 and 0.140–0.196 USD·kWh−1, respectively.
Figure 9 shows the variation in the project NPV with the on-peak and off-peak electricity prices. By increasing the on-peak electricity prices from 0.140 to 0.196 USD·kWh−1, the highest NPV of USD 88.8 million is achieved. For the given charging and discharging times, lower off-peak electricity prices contribute to save more on annual operating costs and, thus, leading to an increase in annual profits [43]. Assuming the fixed on-peak electricity price is 0.168 USD·kWh−1, the NPV rises from USD 16.57 to 75.11 million as the off-peak electricity price drops from 0.070 to 0.028 USD·kWh−1. In addition, an increase in the on-peak electricity prices can have a positive impact on both the annual total revenue and the NPV of the project.
The effect of the on-peak and off-peak electricity prices on the DPP is shown in Figure 10. If the off-peak electricity price is 0.070 USD·kWh−1, the project will operate at a loss throughout its entire lifetime if the peak electricity price drops below 0.168 USD·kWh−1. However, if the peak electricity price is 0.196 USD·kWh−1 and the off-peak price is 0.028 USD·kWh−1, the DPP is shortened to 3.46 years. At the off-peak electricity price of 0.028, 0.042, 0.056 and 0.070 USD·kWh−1, the LCOE of the system is 0.0802, 0.0967, 0.1131, 0.1296 USD·kWh−1, respectively.

5. Conclusions

A new LAES system with carbon capture for gas power plants was proposed. By utilizing the cold energy and exergy of LNG and decarbonized high pressure flue gas, H2O and CO2 were condensed and removed. A reduction in CO2 emissions and an improvement in electricity output can be achieved. This study investigated the effect of the charging pressure, air expansion stages, and electricity prices on the system performance with thermodynamic and economic analysis models. The main findings are presented as follows:
  • A charging pressure of 12 MPa was preferred for both thermodynamic and economic advantages. In this scenario, Case A had its highest net generation of 27,369 kW with an RTE of 47.72% and an ERTE of 69.74%. The equipment and material investment costs were calculated to be USD 28.44 and 2.55 million, respectively. The best outcome for Case A resulted in an SPC of 0.1855 kWhe·kgLA−1 and an LCOE of 0.0965 USD·kWh−1;
  • A net power output of 27,291 kW was observed in Case B when the charging pressure was 12 MPa, giving an RTE of 47.58% and an ERTE of 69.91%. Benefiting from the cost reductions from the ATs and SHs, the equipment investment in Case B was USD 28.23 million, which was USD 209.98 thousand less than that in Case A. The SPC and LCOE for Case B were USD 0.1855 kWhe·kgLA−1 and 0.0967 USD·kWh−1, respectively, which were almost equal to those of Case A;
  • The proposed system allowed for better access to price arbitrage. By operating the system with 8 h charging and 8 h discharging per day, while considering off-peak and on-peak electricity prices of 0.042 USD/kWh and 0.196 USD/kWh, respectively, the NPV was expected to be USD 88.8 million. An off-peak electricity price of 0.028 USD·kWh−1 and an on-peak electricity price of 0.196 USD·kWh−1 led to an attractive DPP of 3.46 years and an LCOE of 0.0802 USD·kWh−1;
  • The viability of price arbitrage was constrained by the electricity price. The on-peak electricity price fell below 0.168 USD·kWh−1 and the off-peak price exceeded 0.070 USD·kWh−1, which meant that it did not reach good profitability for the allowed electricity market conditions. The DPP may exceed the specified time limit (20 years) and even fail to achieve a positive annual profit.
Above all, the RTE and ERTE of the proposed system have been proven to be acceptable and have considerable potential for further development under the condition of sufficient economic benefits. The liquid propane tanks, air compressors, and air turbines will account for the main part of the initial investment costs. Based on this study, enhancing the recovery of exhausted heat and cold energy could lead to better electricity conversion efficiency and reduce investment costs.

Author Contributions

Conceptualization, X.Q.; methodology, H.T.; software, X.Q. and N.W.; investigation, W.L.; data curation, X.Q.; writing—original draft preparation, X.Q.; writing—review and editing, X.Q. and N.W.; supervision, H.T.; funding acquisition, H.T. All authors have read and agreed to the published version of the manuscript.

Funding

The work was funded by the National Natural Science Foundation of China (Grant Number: 52076159).

Institutional Review Board Statement

Not applicable.

Informed Consent Statement

Not applicable.

Data Availability Statement

Not applicable.

Conflicts of Interest

The authors declare no conflict of interest.

Nomenclature

Symbols
A heat exchange area, kW·K−1
e mass entropy, kJ·kg−1·K−1
E electricity, kWh
E x exergy, kW
E x d exergy destruction, kW
f inflation rate
h mass enthalpy, kJ·kg−1
i discount rate
m mass flow rate, kg·h−1
p pressure, MPa
P power, kW
Q A C compression heat, kW
R capital recovery factor
R a i annual interest rate
t c h charging time per day, h
t d i s discharging time per day, h
T temperature, K
V volume, m3
Yliquefaction ratio
Z M a t total materials investment cost, USD
Z E q total equipment investment cost, USD
Z E , o n p e a k unit price of on-peak electricity, USD·kWh−1
Z E , o f f p e a k unit price of off-peak electricity, USD·kWh−1
Z I I C initial investment cost, USD
Z L N G purchase cost of LNG fuel per year, USD
Z o i l purchase cost of thermal oil, USD
Z p r o purchase cost of propane, USD
Z m e t purchase cost of methanol, USD
α annual operation and maintenance factor
Abbreviations
NGnatural gas
ACair compressor
A C t annual total cost, USD
ACONair condenser
A P t annual total profit, USD
A R t annual total revenue, USD
ASair separator
ATair turbine
ATVair throttle valve
CCONcarbon dioxide condenser
CONcondenser
CRVcombustion chamber
CScarbon dioxide separator
CTcryo-turbine
DPPdynamic payback period, years
EESelectrical energy storage
ERTEexergy round-trip efficiency
EVAevaporator
GTflue gas turbine
GSgas separator
HTEShot thermal energy storage
ICinter-cooler
LAliquid air
LAESliquid air energy storage
LAPliquid air pump
LATliquid air tank
LCOElevelized cost of electricity, USD·kWh−1
LHVlow heat value, kJ·kg−1
LMTliquid methanol tank
LNGliquefied natural gas
LNGPliquefied natural gas pump
LOTliquid thermal oil tank
LPTliquid propane tank
MTDminimum temperature difference, K
NPVnet present value, USD
ORCorganic Rankine cycle
RHre-heater
RTEround-trip efficiency
SEPseparator
SHsuperheater
SPCspecific power consumption, kWhe·kgLA−1
VCONvapor condenser
VSvapor separator
Subscripts and superscripts
ininput
j year of the first positive net present value harvest
ncounters
outoutput
S L service life
ttotal

Appendix A

Table A1. Energy and exergy balance equations for critical components.
EquipmentEnergy Balance EquationsExergy Balance Equations
ACs m 1 h 1 h 2 + m 3 h 3 h 4   +   m 5 h 5 h 6 + 3600   P A C = 0 m 1 e 1 e 2 + m 3 e 3 e 4   +   m 5 e 5 e 6 + 3600   P A C   = E x A C , d
ICs m 2 h 2 h 3 + m 4 h 4 h 5   +   m 6 h 6 h 7 = m O 2 h O 2 h O 1 m 2 e 2 e 3 + m 4 e 4 e 5   +   m 6 e 6 e 7 m O 2 e O 2 e O 1   = 3600   E x I C , d
ACONs m 7 h 7 h 9 + m 11 h 11 h 13   = m M 2 h M 2 h M 1 + m P 2 h P 2 h P 1 m 7 e 7 e 9 + m 11 e 11 e 13     m M 2 e M 2 e M 1 m P 2 e P 2 e P 1   = 3600   E x A C O N , d
ATV m 9 h 9 = m 10 h 10 m 9 e 9 m 10 e 10 = 3600   E x A T V , d
AS m 10 h 10 = m 11 h 11 + m 14 h 14 m 10 e 10 m 11 e 11 m 14 e 14   = 3600   E x A S , d
LAP m 15 h 15 + 3600   P L A P = m 16 h 16 m 15 e 15 e 16 + 3600   P L A P = E x L A P , d
LNGP m 27 h 27 + 3600   P L N G P = m 28 h 28 m 27 e 27 e 28 + 3600   P L N G P   = E x L N G P , d
EVAs m 16 h 16 h 18 + m 28 h 28 h 29   = m M 4 h M 4 h M 3 + m P 4 h P 4 h P 3 m 16 e 16 e 18 + m 28 e 28 e 29     m M 4 e M 4 e M 3 m P 4 e P 4 e P 3   = 3600   E x E V A s , d
CRV m 29 h 29 + m 29 L H V 29 + m 30 h 30 = m 31 h 31 m 29 e 29 + m 29 L H V 29 + m 30 e 30     m 31 e 31 = 3600   E x C R V , d
GT m 31 h 31 = m 32 h 32 + 3600   P G T m 31 e 31 m 32 e 32 3600   P G T = E x G T , d
RH m 19 h 19 h 20 = m 33 h 33 h 32 m 19 e 19 e 20 m 33 e 33 e 32   = 3600   E x R H , d
VS1 m 33 h 33 = m 34 h 34 + m 43 h 43 m 33 e 33 m 34 e 34 m 43 e 43   =   3600   E x V S 1 , d
VCON m 34 h 34 h 35 = m 42 h 42 h 41 m 34 e 34 e 35 m 42 e 42 e 41   = 3600   E x V C O N , d
VS2 m 35 h 35 = m 36 h 36 + m 44 h 44 m 35 e 35 m 36 e 36 m 44 e 44   = 3600   E x V S 2 , d
CCON m 36 h 36 h 37 = m 41 h 41 h 40 m 36 e 36 e 37 m 41 e 41 e 40   = 3600   E x C C O N , d
CS m 37 h 37 = m 38 h 38 + m 45 h 45 m 37 e 37 m 38 e 38 m 45 e 45   = 3600   E x C S , d
GS m 38 h 38 = m 39 h 39 + m 46 h 46 m 38 e 38 m 39 e 39 m 46 e 46   = 3600   E x G S , d
CT m 39 h 39 = m 40 h 40 + 3600   P C T m 39 e 39 m 40 e 40 3600   P C T = E x C T , d
AT m 20 [ h 20 h 21 + h 21 h 22   +   h 23 h 24 + h 25 h 26 ]   = 3600   P A T m 20 [ e 20 e 21 + e 21 e 22   +   ( e 23 e 24 ) + e 25 e 26 ]     3600   P A T = E x A T , d
SH m 22 h 22 h 23 + m 24 h 24 h 25   = m O 4 h O 4 h O 3 m 22 e 22 e 23 + m 24 e 24 e 25     m O 4 e O 4 e O 3 = 3600   E x S H , d
Table A2. Working fluid parameters in the proposed system.
Stream PointMass Flow (kg/h)Temperature (K)Pressure (MPa)Composition
1200,0002980.1N2, O2, Ar
2200,0004850.5N2, O2, Ar
3200,0002980.5N2, O2, Ar
4200,0004852.4N2, O2, Ar
5200,0002982.4N2, O2, Ar
6200,00048712.0N2, O2, Ar
7200,00029811.9N2, O2, Ar
8200,00018411.8N2, O2, Ar
9200,0009011.8N2, O2, Ar
10200,000800.1N2, O2, Ar
1127,024790.1N2, O2, Ar
1227,0241810.1N2, O2, Ar
1327,0242930.1N2, O2, Ar
14172,976790.1N2, O2, Ar
15172,976790.1N2, O2, Ar
16172,976848.0N2, O2, Ar
17172,9761737.9N2, O2, Ar
18172,9762927.8N2, O2, Ar
19124,1982927.8N2, O2, Ar
20124,1987007.8N2, O2, Ar
21124,1985392.6N2, O2, Ar
22124,1984330.9N2, O2, Ar
23124,1984570.9N2, O2, Ar
24124,1983670.3N2, O2, Ar
25124,1984570.3N2, O2, Ar
26124,1983700.1N2, O2, Ar
2718181110.1LNG
2818181157.0LNG
2918182927.0NG
3048,7782927.8N2, O2, Ar
3150,59617237.0CO2, H2O, N2, Ar
3250,59611240.5CO2, H2O, N2, Ar
3350,5963270.5CO2, H2O, N2, Ar
3447,3493270.5CO2, H2O, N2, Ar
3547,3492730.5CO2, H2O, N2, Ar
3646,5442730.5CO2, N2, Ar
3746,5442200.5CO2, N2, Ar
3846,5102200.5CO2, N2, Ar
3941,5242200.5N2, Ar
4041,5241550.1N2, Ar
4141,5242160.1N2, Ar
4241,5243260.1N2, Ar
4332473270.5H2O
448052730.5H2O
45342200.5H2O, CO2
4649872240.5CO2
O1417,4052930.1Thermal oil
O2417,4054600.1Thermal oil
O3417,4054600.1Thermal oil
O4417,4054430.1Thermal oil
M171,9611721.0Methanol
M271,9612931.0Methanol
M371,9612931.0Methanol
M471,9611721.0Methanol
P1241,071891.0Propane
P2241,0711811.0Propane
P3241,0711811.0Propane
P4241,071891.0Propane

References

  1. Osman, A.I.; Hefny, M.; Abdel Maksoud, M.I.A.; Elgarahy, A.M.; Rooney, D.W. Recent advances in carbon capture storage and utilisation technologies: A review. Environ. Chem. Lett. 2020, 19, 797–849. [Google Scholar] [CrossRef]
  2. Gandhi, A.; Zantye, M.S.; Faruque Hasan, M.M. Integration of cryogenic energy storage with renewables and power plants: Optimal strategies and cost analysis. Energy Convers. Manag. 2022, 269, 116165. [Google Scholar] [CrossRef]
  3. Borri, E.; Tafone, A.; Romagnoli, A.; Comodi, G. A review on liquid air energy storage: History, state of the art and recent developments. Renew. Sustain. Energy Rev. 2021, 137, 110572. [Google Scholar] [CrossRef]
  4. Wang, C.; Akkurt, N.; Zhang, X.; Luo, Y.; She, X. Techno-economic analyses of multi-functional liquid air energy storage for power generation, oxygen production and heating. Appl. Energy 2020, 275, 115392. [Google Scholar] [CrossRef]
  5. Tafone, A.; Romagnoli, A.; Borri, E.; Comodi, G. New parametric performance maps for a novel sizing and selection methodology of a Liquid Air Energy Storage system. Appl. Energy 2019, 250, 1641–1656. [Google Scholar] [CrossRef]
  6. Saleh Kandezi, M.; Mousavi Naeenian, S.M. Investigation of an efficient and green system based on liquid air energy storage (LAES) for district cooling and peak shaving: Energy and exergy analyses. Sustain. Energy Technol. Assess. 2021, 47, 101396. [Google Scholar] [CrossRef]
  7. She, X.; Peng, X.; Nie, B.; Leng, G.; Zhang, X.; Weng, L.; Tong, L.; Zheng, L.; Wang, L.; Ding, Y. Enhancement of round trip efficiency of liquid air energy storage through effective utilization of heat of compression. Appl. Energy 2017, 206, 1632–1642. [Google Scholar] [CrossRef]
  8. Zhang, T.; She, X.; Ding, Y. A power plant for integrated waste energy recovery from liquid air energy storage and liquefied natural gas. Chin. J. Chem. Eng. 2021, 34, 242–257. [Google Scholar] [CrossRef]
  9. Lee, I.; Park, J.; Moon, I. Conceptual design and exergy analysis of combined cryogenic energy storage and LNG regasification processes: Cold and power integration. Energy 2017, 140, 106–115. [Google Scholar] [CrossRef]
  10. Park, J.; You, F.; Mun, H.; Lee, I. Liquefied natural gas supply chain using liquid air as a cold carrier: Novel method for energy recovery. Energy Convers. Manag. 2021, 227, 113611. [Google Scholar] [CrossRef]
  11. Park, J.; Mun, H.; Kim, J.; Lee, I. Advanced natural gas liquefaction process on LNG supply chain with liquid air: From design to thermodynamic and techno-economic analyses. Energy Convers. Manag. 2022, 252, 115107. [Google Scholar] [CrossRef]
  12. Park, J.; Qi, M.; Kim, J.; Noh, W.; Lee, I.; Moon, I. Exergoeconomic optimization of liquid air production by use of liquefied natural gas cold energy. Energy 2020, 207, 118193. [Google Scholar] [CrossRef]
  13. Qi, M.; Park, J.; Kim, J.; Lee, I.; Moon, I. Advanced integration of LNG regasification power plant with liquid air energy storage: Enhancements in flexibility, safety, and power generation. Appl. Energy 2020, 269, 115049. [Google Scholar] [CrossRef]
  14. Gao, Z.; Ji, W.; Guo, L.; Fan, X.; Wang, J. Thermo-economic analysis of the integrated bidirectional peak shaving system consisted by liquid air energy storage and combined cycle power plant. Energy Convers. Manag. 2021, 234, 113945. [Google Scholar] [CrossRef]
  15. Zhang, T.; Chen, L.; Zhang, X.; Mei, S.; Xue, X.; Zhou, Y. Thermodynamic analysis of a novel hybrid liquid air energy storage system based on the utilization of LNG cold energy. Energy 2018, 155, 641–650. [Google Scholar] [CrossRef]
  16. Park, J.H.; Heo, J.Y.; Lee, J.I. Techno-economic study of nuclear integrated liquid air energy storage system. Energy Convers. Manag. 2022, 251, 114937. [Google Scholar] [CrossRef]
  17. Legrand, M.; Labajo-Hurtado, R.; Rodríguez-Antón, L.M.; Doce, Y. Price arbitrage optimization of a photovoltaic power plant with liquid air energy storage. Implementation to the Spanish case. Energy 2022, 239, 121957. [Google Scholar] [CrossRef]
  18. Rehman, A.; Qyyum, M.A.; Qadeer, K.; Zakir, F.; Ding, Y.; Lee, M.; Wang, L. Integrated biomethane liquefaction using exergy from the discharging end of a liquid air energy storage system. Appl. Energy 2020, 260, 114260. [Google Scholar] [CrossRef]
  19. Xie, C.; Hong, Y.; Ding, Y.; Li, Y.; Radcliffe, J. An economic feasibility assessment of decoupled energy storage in the UK: With liquid air energy storage as a case study. Appl. Energy 2018, 225, 244–257. [Google Scholar] [CrossRef]
  20. Liu, Q.; He, Z.; Liu, Y.; He, Y. Thermodynamic and parametric analyses of a thermoelectric generator in a liquid air energy storage system. Energy Convers. Manag. 2021, 237, 114117. [Google Scholar] [CrossRef]
  21. Cui, S.; He, Q.; Liu, Y.; Wang, T.; Shi, X.; Du, D. Techno-economic analysis of multi-generation liquid air energy storage system. Appl. Therm. Eng. 2021, 198, 117511. [Google Scholar] [CrossRef]
  22. Khani, H.; Dadash Zadeh, M.R. Real-Time Optimal Dispatch and Economic Viability of Cryogenic Energy Storage Exploiting Arbitrage Opportunities in an Electricity Market. IEEE Trans. Smart Grid 2015, 6, 391–401. [Google Scholar] [CrossRef]
  23. Gao, Z.; Guo, L.; Ji, W.; Xu, H.; An, B.; Wang, J. Thermodynamic and economic analysis of a trigeneration system based on liquid air energy storage under different operating modes. Energy Convers. Manag. 2020, 221, 113184. [Google Scholar] [CrossRef]
  24. Hamdy, S.; Morosuk, T.; Tsatsaronis, G. Exergetic and economic assessment of integrated cryogenic energy storage systems. Cryogenics 2019, 99, 39–50. [Google Scholar] [CrossRef]
  25. Guizzi, G.L.; Manno, M.; Tolomei, L.M.; Vitali, R.M. Thermodynamic analysis of a liquid air energy storage system. Energy 2015, 93, 1639–1647. [Google Scholar] [CrossRef]
  26. Adedeji, M.; Abid, M.; Dagbasi, M.; Adun, H.; Adebayo, V. Improvement of a liquid air energy storage system: Investigation of performance analysis for novel ambient air conditioning. J. Energy Storage 2022, 50, 104294. [Google Scholar] [CrossRef]
  27. Lee, I.; You, F. Systems design and analysis of liquid air energy storage from liquefied natural gas cold energy. Appl. Energy 2019, 242, 168–180. [Google Scholar] [CrossRef]
  28. Bao, J.; He, X.; Deng, Y.; Zhang, N.; Zhang, X.; An, B.; He, G. Parametric analysis and multi-objective optimization of a new combined system of liquid carbon dioxide energy storage and liquid natural gas cold energy power generation. J. Clean. Prod. 2022, 363, 132591. [Google Scholar] [CrossRef]
  29. Wen, N.; Tan, H. Modelling and optimization of liquid air energy storage systems with different liquefaction cycles. Energy Convers. Manag. 2022, 271, 116321. [Google Scholar] [CrossRef]
  30. Li, D.; Duan, L. Techno-economic analysis of solar aided liquid air energy storage system with a new air compression heat utilization method. Energy Convers. Manag. 2023, 278, 116729. [Google Scholar] [CrossRef]
  31. Huang, Z.F.; Soh, K.Y.; Wan, Y.D.; Islam, M.R.; Chua, K.J. Assessment of an intermediate working medium and cold energy storage (IWM-CES) system for LNG cold energy utilization under real regasification case. Energy 2022, 253, 124080. [Google Scholar] [CrossRef]
  32. Kim, J.; Noh, Y.; Chang, D. Storage system for distributed-energy generation using liquid air combined with liquefied natural gas. Appl. Energy 2018, 212, 1417–1432. [Google Scholar] [CrossRef]
  33. Wu, S.; Zhou, C.; Doroodchi, E.; Moghtaderi, B. Techno-economic analysis of an integrated liquid air and thermochemical energy storage system. Energy Convers. Manag. 2020, 205, 112341. [Google Scholar] [CrossRef]
  34. Su, R.; Yu, Z.; Xia, L.; Sun, J. Performance analysis and multi-objective optimization of an integrated gas turbine/supercritical CO2 recompression/transcritial CO2 cogeneration system using liquefied natural gas cold energy. Energy Convers. Manag. 2020, 220, 113136. [Google Scholar] [CrossRef]
  35. Wang, C.; Cui, Q.; Dai, Z.; Zhang, X.; Xue, L.; You, Z.; She, X. Performance analysis of liquid air energy storage with enhanced cold storage density for combined heating and power generation. J. Energy Storage 2022, 46, 103836. [Google Scholar] [CrossRef]
  36. Zhao, P.; Xu, W.; Zhang, S.; Gou, F.; Wang, J.; Dai, Y. Components design and performance analysis of a novel compressed carbon dioxide energy storage system: A pathway towards realizability. Energy Convers. Manag. 2021, 229, 113679. [Google Scholar] [CrossRef]
  37. Zhang, T.; She, X.; You, Z.; Zhao, Y.; Fan, H.; Ding, Y. Cryogenic thermoelectric generation using cold energy from a decoupled liquid air energy storage system for decentralised energy networks. Appl. Energy 2022, 305, 117749. [Google Scholar] [CrossRef]
  38. Liu, Q.; Arabkoohsar, A.; Liu, Y.; He, Z. Techno-economic analysis of a liquid air energy storage system combined with calcium carbide production and waste heat recovery. J. Energy Storage 2023, 60, 106689. [Google Scholar] [CrossRef]
  39. Nabat, M.H.; Zeynalian, M.; Razmi, A.R.; Arabkoohsar, A.; Soltani, M. Energy, exergy, and economic analyses of an innovative energy storage system; liquid air energy storage (LAES) combined with high-temperature thermal energy storage (HTES). Energy Convers. Manag. 2020, 226, 113486. [Google Scholar] [CrossRef]
  40. Trading Economics. 2023. Available online: https://zh.tradingeconomics.com/china/indicators (accessed on 12 June 2023).
  41. Inflation.eu, Table–2023 Inflation China (CPI). 2023. Available online: https://www.inflation.eu/en/inflation-rates/china/historic-inflation/cpi-inflation-china-2023.aspx#:~:text=Chart%20-%20CPI%20inflation%20China%202023%20%28yearly%20basis%29,of%20information%20that%20we%20believe%20to%20be%20reliable (accessed on 12 June 2023).
  42. FRED, Interest Rates, Discount Rate for China (INTDSRCNM193N). 2023. Available online: https://fred.stlouisfed.org/series/INTDSRCNM193N# (accessed on 12 June 2023).
  43. Yang, Y.; Tong, L.; Liu, Y.; Guo, W.; Wang, L.; Qiu, Y.; Ding, Y. A novel integrated system of hydrogen liquefaction process and liquid air energy storage (LAES): Energy, exergy, and economic analysis. Energy Convers. Manag. 2023, 280, 116799. [Google Scholar] [CrossRef]
Figure 1. (A) Control volume schematic of the proposed system. (B) A sketch of the proposed system.
Applsci 13 09559 g001aApplsci 13 09559 g001b
Figure 2. Effect of charging pressure on the RTE, ERTE, and SPC.
Applsci 13 09559 g002
Figure 3. Effect of charging pressure on materials investment cost and LNG purchase cost.
Applsci 13 09559 g003
Figure 4. Effect of charging pressure on component investment cost.
Applsci 13 09559 g004
Figure 5. Effect of charging pressure on the economic indicators, (a) NPV and (b) DPP and LCOE.
Applsci 13 09559 g005
Figure 6. Effect of the air expansion stages on the investment cost and LNG purchase cost.
Applsci 13 09559 g006
Figure 7. Effect of the air expansion stages on the (a) annual total cost and (b) annual total revenue.
Applsci 13 09559 g007
Figure 8. Effect of the air expansion stages on the NPV.
Applsci 13 09559 g008
Figure 9. Effect of the (a) on-peak electricity price and (b) off-peak electricity price on the NPV.
Applsci 13 09559 g009
Figure 10. Effect of the on-peak and off-peak electricity price on the DPP.
Applsci 13 09559 g010
Table 2. Investment cost models for the equipment.
EquipmentModel (USD)
Air compressor (AC) [26,33] Z A C = 7900 ( P A C ) 0.62
Air turbine (AT) [26,33] Z A T = 1100 ( P A T ) 0.81
Cryo-turbine (CT) [26,33] Z C T = 1100 ( P C T ) 0.81
Inter-cooler (IC) [6] Z I C = 12,000 A I C / 100 0.6
Condenser (CON) [6] Z C O N = 32,800 A C O N / 80 0.68
Evaporator (EVA) [6] Z E V A = 32,800 A E V A / 80 0.68
Re-heater (RH) [6] Z R H = 12,000 A R H / 100 0.6
Superheater (SH) [6] Z S H = 12,000 A S H / 100 0.6
Liquid air tank (LAT) [6] Z L A T = 320 × V LAT
Liquid methanol tank (LMT) [33] Z L M T = 572 × V LMT  
Liquid propane tank (LPT) [33] Z L P T = 1326 × V LPT  
Liquid thermal oil tank (LOT) [33] Z LOT   = 423 × V LOT  
Liquid air pump (LAP) [33] Z LAP   = 483 P L A P
LNG pump (LNGP) [28] Z LNGP   = 1120   P LNGP   0.8
Combustion chamber (CRV) [34] Z CRV   = 25.65 · m C R V 0.995 p CRV , out   / p CRV , in   1 + e 0.018 · T CRV , out   26.4
Flue gas turbine (GT) [34] Z G T = 1100   ( P G T ) 0.81
Air throttle valve (ATV) [6] Z A T V = 114.5   m A T V 0.67
Separator (SEP) [6] Z S E P = 114.5   m S E P 0.67
Table 3. Investment cost models for the materials.
MaterialsMathematical Model (USD)
Thermal oil [35] Z o i l = 326.3 t c h × m o i l / 1000  
Methanol [35] Z m e t = 352 t c h × m m e t / 1000
Propane [35] Z p r o = 649.6 t c h × m p r o / 1000
Table 5. Effect of the charging pressure on the liquefaction ratio, and the input and net output power.
Charging Pressure (MPa)1012141618
Liquefaction ratio (%)83.4486.4985.9485.3884.97
Total input power of the system (kW)30,54632,08533,41234,58835,649
Total net output power of the system (kW)24,25027,36927,20426,94625,961
Table 6. Effect of the air expansion stages on the overall system performance.
Charging Pressure (MPa)RTE
(%)
ERTE
(%)
SPC
(kWhe·kgLA−1)
DPP
(Year)
LCOE
(USD·kWh−1)
12Case A47.7269.740.18555.730.0965
Case B47.5869.910.18555.720.0967
14Case A46.4069.510.19446.020.0989
Case B46.3169.730.19446.000.0989
16Case A45.2469.330.20266.200.1011
Case B45.2869.680.20266.120.1008
18Case A42.7369.170.20987.060.1067
Case B44.1069.370.21026.320.1032
Disclaimer/Publisher’s Note: The statements, opinions and data contained in all publications are solely those of the individual author(s) and contributor(s) and not of MDPI and/or the editor(s). MDPI and/or the editor(s) disclaim responsibility for any injury to people or property resulting from any ideas, methods, instructions or products referred to in the content.

