Abstract
The effects of saline water on three greenhouse tomato cultivars (Feisty-Red, Ghandowra-F1, and Valouro-RZ) under three salinity concentrations (S1, ~2.5 dS m−1; S2, ~6.0 dS m−1; and ~9.0 dS m−1) and four nutrient regimes (N1–N4) were studied by evaluating the vegetative growth, chlorophyll content, leaf area, water use efficiency (WUE), and fruit yield of the cultivars. Vegetative growth parameters, such as plant height, leaf area, and stem diameter, were negatively correlated with increased levels of salinity. Also, the lowest WUE was noted for the high-salinity (~9.0 dS m−1) treatments. The Valouro-RZ cultivar performed better in terms of vegetative growth parameters when compared to both the Ghandowra-F1 and Feisty-Red cultivars. The plants grafted onto Maxifort rootstock showed more tolerance to salinity stress, with significant differences in plant growth, tomato yield, and WUE when compared with the non-grafted plants. The use of a modified nutrient solution (N2) in combination with moderately saline water (S2, ~6.0 dS m−1) resulted in a high mean yield (30.7 kg m−2), with a reduction of about ~1.6% compared with the mean yield of the control (i.e., the combination of S1 and N1), which was estimated to be about 31.2 kg m−2. High salinity significantly affected the mean WUE, which was the highest at 31.3 kg m−3 for the control plants (low salinity—S1), followed by the moderate-salinity (S2) plants at 30.4 kg m−3, and the lowest mean WUE was recorded for the high-salinity (S3) plants at 17.7 kg m−3. These results indicate that a combination of grafting onto rootstocks and using an appropriate nutrient recipe (i.e., N2 in this study) can mitigate the negative effects of salt stress on tomato plants grown under hydroponic conditions.
1. Introduction
Saudi Arabia is a desertic land exposed to extreme temperatures and an arid climate, with limited groundwater resources [1]. Despite the harsh environmental conditions, such as high levels of evapotranspiration and low levels of precipitation, the Kingdom has managed to become self-sufficient in the production of some vegetables and food crop products [2]. With the rapid growth of the population, there is a rising demand for vegetables and tomatoes. Hence, the sustainability of agriculture and water resources in Saudi Arabia is essential for food and water security [3]. Soil and water resources, along with the application of agricultural inputs, determine the production potential of agricultural ecosystems. Increased crop yields are associated with an increased use of water and fertilizer, and modern research has focused on maximizing the water and fertilizer use efficiency (WFUE) of crops [3,4,5]. The quickly dwindling global supply of fresh water and renewable water resources, coupled with increasing demands for water from the agricultural sector, is threatening the food and water security of nations around the world. As a result, approaches to water resource management are also changing dramatically [6].
The long-term annual precipitation in Saudi Arabia is recorded as 114 mm. The annual water demand has been steadily rising due to increases in developmental activities and essential services in proportion to the growing population. The agricultural sector utilizes around 80 percent of the total quantity of water used in the Kingdom [7]. Limited water resources, sparse and low rainfall, higher temperatures, evapotranspiration, and eco-physical conditions pose significant challenges to agricultural activities. The sustainability of the agroecosystems of Saudi Arabia depends heavily on the efficient management of available soil and water resources. However, the steady decline in the finite water resources and the continued degradation of soil resources make the task much more challenging [8,9]. In addition, the external inputs required for agricultural production are becoming more scarce and costly. Thus, the conservation of water and soil resources via the transformation of traditional agricultural practices into modern agricultural practices for self-sustainability is an essential matter in Saudi Arabia. The construction of greenhouses and protected cultivations alter microclimate conditions to favor the productivity of plants, and they also predominantly reduce transpiration and increase water productivity [10,11].
In traditional agriculture, soil is a medium of plant growth that offers mechanical support to plants, stores water, and provides plants with the required nutrients. However, continuous and intensive use of soil in greenhouses has led to infestation by plant pathogens and deficiencies in essential nutrients. This has resulted in the use of soil disinfections, leading to the pollution of the environment and damage to fertigation systems [12]. Hydroponics, a smart agricultural technique involving the cultivation of plants without soil, which is also referred to as soilless culture and nutriculture, among other terms, is a viable system that overcomes these problems [13,14]. The production of crops in hydroponic greenhouses results in increased food production, improved food quality, conservation of resources, and protection of the environment. In Saudi Arabia, water is not only scarce but also precious. Since saline water can be used as an alternative for irrigating salt-tolerant crops, especially under hydroponic conditions, the country is planning to use desalinated sea (saline) water as an alternative to groundwater resources [15,16]. In such a situation, studies on the use of saline water without sacrificing the yield and quality of crops are very much necessary to determine appropriate water management practices.
In general, to achieve optimum yields regardless of the substrate used, plants must be supplied with an adequate amount of a nutrient solution to compensate for high evapotranspiration rates and to ensure an adequate source of nutrients, along with the draining of excess amounts of nutrients and ensuring the availability of oxygen to the root system to avoid the accumulation of salt in the root zone [17,18,19]. Plants exposed to high concentrations of salt experience osmotic stress, which leads to water deficits and unhealthy growth. These factors negatively affect the physiological and metabolic processes of plants, such as photosynthesis, respiration, and cell division [20,21,22,23]. The accumulation of sodium (Na+) and chloride (Cl−) in plants prevents the intake of nutrients (K+, Ca++, Mg++, and NO3−) and leads to reductions in vegetative growth and yield [24,25].
Crops that can be hydroponically grown with saline water are limited to salt-tolerant and moderately salt-tolerant species, such as tomato, asparagus, cucumber, rose, and carnation. Even among salt-tolerant species, varietal differences may exist. Varietal trials need to be conducted to determine the most tolerant varieties. The salt tolerance of a variety, its stage of development, the frequency of irrigation, and the addition of deficit nutrients are several factors to be considered when using saline water. Tomato plants have been reported to be a moderately salt-tolerant crop [26,27,28]. In previous research, salt stress was found to result in reduced growth and yield. However, salt stress produced fruits of better quality, which fetched higher market prices [29,30,31,32]. Tomato has been characterized as salt-sensitive and reported to be more susceptible to high salinity (8.7 dS m−1) at an early stage of development than in late growth stages [31]. However, Li et al. [33] observed that the effects of salt stress could be fully revocable by discharging excess amounts of salt from tomato roots, provided that the plant parts have not attained the rapid growth stage at a salinity level of 9.0 dS m−1.
Therefore, this study aimed (i) to assess the effects of salinity on three tomato cultivars grown under hydroponic conditions on perlite substrate by examining the morphological features (plant height, stem diameter, and leaf area), mineral concentrations in plant tissues (chlorophyll, Na+, Ca2+, and K+), fruit size, and yield, and (ii) to evaluate the effect of grafting for alleviating the effects of salinity and the water use efficiency (WUE) of these tomato crops, induced by three salinity levels (EC values of ~2.5, ~6.0, and ~9.0 dS m−1) and four nutrient solutions (N1–N4).
2. Materials and Methods
Experimental trials were conducted across two seasons, 2020–2021 and 2021–2022, in a hydroponic greenhouse (28 × 32 × 4.5 m) at the educational farm (24°39′ N, 46°44′ E) of the College of Food and Agriculture Sciences, King Saud University, Riyadh, Saudi Arabia. To control the indoor climate and hydroponic irrigation system, the greenhouse was equipped with MACQU systems (Geosmart, Athens, Greece) to implement the planned treatments. The climate system was equipped with cooling pads and fans, heaters, circulation fans, shading screen, and overhead ventilation, along with sensors installed at a height of 2.0 m inside the greenhouse to monitor radiation, temperature, and relative humidity. Tomato plants were grown on 12 lines of stainless-steel troughs at a height of 1 m with a slope of 5%. Each experimental line accommodated 27 perlite substrate bags (0.90 × 0.22 × 0.15 m), each with a capacity of 30 L. The distance between two plant lines was 1.78 m, and the distance between two plants within a line was 0.25 m. The plant density was maintained at 2.7 plants m−2. Irrigation was performed using self-draining drippers set at a flow rate of 3 L h−1, with a weekly schedule in an open operation mode. The irrigation water had an EC value of 1.04 dS m−1 and Na+, Ca2+, K+, HCO3−, Cl−, and SO4− content of 3.61, 0.76, 0.19, 0.35, 2.39, and 1.82 meq L−1, respectively.
2.1. Plant Materials, Growth Conditions, and Experimental Setup
Three commercial greenhouse tomato (Solanum lycopersicum L.) cultivars, Ghandowra-F1 (Enza Zaden, Enkhuizen, The Netherlands), Valouro-RZ (Rijk Zwaan, De Lier, The Netherlands), and Feisty-Red (Seminis, St. Louis, MO, USA) were used as scions. The selected scion cultivars were grafted onto a commercial rootstock, Maxifort (S. lycopersicum × S. habrochaites, De Ruiter Seeds/Monsanto, Bergschenhoek, The Netherlands). Non-grafted plants of the three tomato cultivars were used as the control. Tomato rootstocks and scion seedlings with identical stem diameters at similar growth stages were selected for grafting. To ensure similar stem diameter and differences in growth vigor, the rootstock seeds were sown five days earlier than the seeds of the scions [34,35,36]. A tube grafting technique was adopted, and the grafted seedlings were kept at controlled conditions at a temperature between 22 °C and 24 °C and a relative humidity of 85–90%, with 45% shade, for seven days for their better survival [37]. Healthy seedlings of grafted and non-grafted tomatoes were transplanted into a hydroponic glass greenhouse at the four-leaf stage on 6 February 2020 (1st season) and 25 November 2020 (2nd season).
The experiments were conducted in both seasons using a split-split-plot system and a randomized complete block design with three replicates. Three salinity levels designed as low (~2.5 dS m−1), moderate (~6.0 dS m−1), and high (~9.0 dS m−1) and four nutrient recipes (N1–N4) were used in both the first and second seasons (Table 1). The control nutrient solution (N1) was prepared with water-soluble fertilizers, as recommended by Hochmuth and Hochmuth [38]. The rest of the nutrient recipes (N2–N4), as presented in Table 2, were prepared by adding more concentrations of K and Ca to the control recipe (N1), where N2 was N1 + 15% additional amount of K, N3 was N1 + 15% additional amount of Ca, N4 was N1 + 15% additional amount of both K and Ca. The EC of the fertilizer solution was maintained at ~2.0 dS.m−1 for each salinity level. In the case of salinity level S1, municipality-supplied water with an EC of ~1.0 dS.m−1 was used and the N1 solution was prepared with an EC of ~3.0 dS.m−1. In the case of the S2 and S3 treatments, an EC of 2 dS.m−1 was maintained for the fertilizer recipe, and the EC of the solutions was adjusted with added NaCl dissolved in municipality-supplied water to a final value of ~6.0 and ~9.0 dS.m−1, respectively. To prevent possible osmotic shock, NaCl concentration was initiated at 20 mM and then gradually increased until reaching the targeted concentration, as described in [39]. The pH and EC of the nutrient solutions were monitored frequently using hand-held pH and EC devices.

Table 1.
Salinity (S) and nutrient solution (N) used in the experiments across the two growing seasons.
Table 2.
Nutrient solution [38] used as a control (N1) in the experiments across the two growing seasons.
A programmed irrigation schedule was prepared to supply the nutrient solutions to the plants. The schedule was set based on the incoming solar radiation, plant transpiration demands, and growth stage. The “irrigation start mode” was set at an accumulated radiation threshold of 400 flux, and the “irrigation stop mode” was set based on attaining the selected dose [40]. The nutrient concentration of each solution was tested for EC and pH on a daily basis. The pH range was set from 5.5 to 6.5, and the targeted EC and pH values were adjusted by adding acidic and sodic solutions, without affecting the target nutrient concentrations [41,42]. The nutrient solutions were supplied to the plants through drippers for two (initial plant growth stage) to eight minutes (maturity stage) for 2 to 5 times a day using automatically activated motor pumps. In the summer months, more water was supplied twice during the nighttime, at 11 p.m. and at 2 a.m. (3 min each) when the temperature exceeded 30 °C. The drainage percentage of the nutrient solutions was maintained at 10–15% [38]. An automatic climatic controller was used to maintain the threshold air temperature at 22 °C and 18 °C during daytime and nighttime, respectively.
2.2. Data Collection and Statistical Analysis
Tomato plant growth parameters (plant height, leaf area, and stem diameter) and leaf chlorophyll measurements were collected at days 25, 50, 75, and 110 after transplanting (DAT) and the data were summed for the entire season. The use of non-destructive methods provides a cost-efficient means for frequent measurements of leaf chlorophyll over a large area. Previous studies have found that spectral indices derived from light absorption or reflection in the visible and near-infrared (NIR) regions have good correlations with leaf chlorophyll. A portable chlorophyll meter (SPAD-502/501, Soil Plant Analysis Development, Konica–Minolta, Inc., Osaka, Japan) was used to measure the chlorophyll content of the plants by taking measurements with eight readings between the midrib and the leaf margin. Since the SPAD meter readings were relative quantities, they were converted to actual leaf chlorophyll content using the generalized transformation equations developed by Cerovic et al. [29].
Tissue analysis was performed to determine the Na+, K+, and Ca2+ concentrations in leaf petioles. Tomatoes were harvested when at least 80% of the fruits attained the red ripeness stage. The harvested fruits were weighed and graded. The unmarketable yield represented fruits exhibiting cracking, catface, blossom-end rot, blotchy ripening, and fruits that fell into the category of extra-small-sized (<40 mm). The collected data were analyzed using the SAS software program (Version 9.4, SAS Institute Inc. Cary, NC, USA). Significant differences among the individual treatments were evaluated using an analysis of variance (ANOVA) and the least significant difference (LSD) test. The collected data from the experiments were subjected to a tri-factorial ANOVA (salinity × nutrition × block) with nutrient and salt treatments as the main factors. In addition, a principal component analysis (PCA) was performed to determine the biophysical parameters that were responsive to salinity stress.
3. Results
3.1. Vegetative Growth
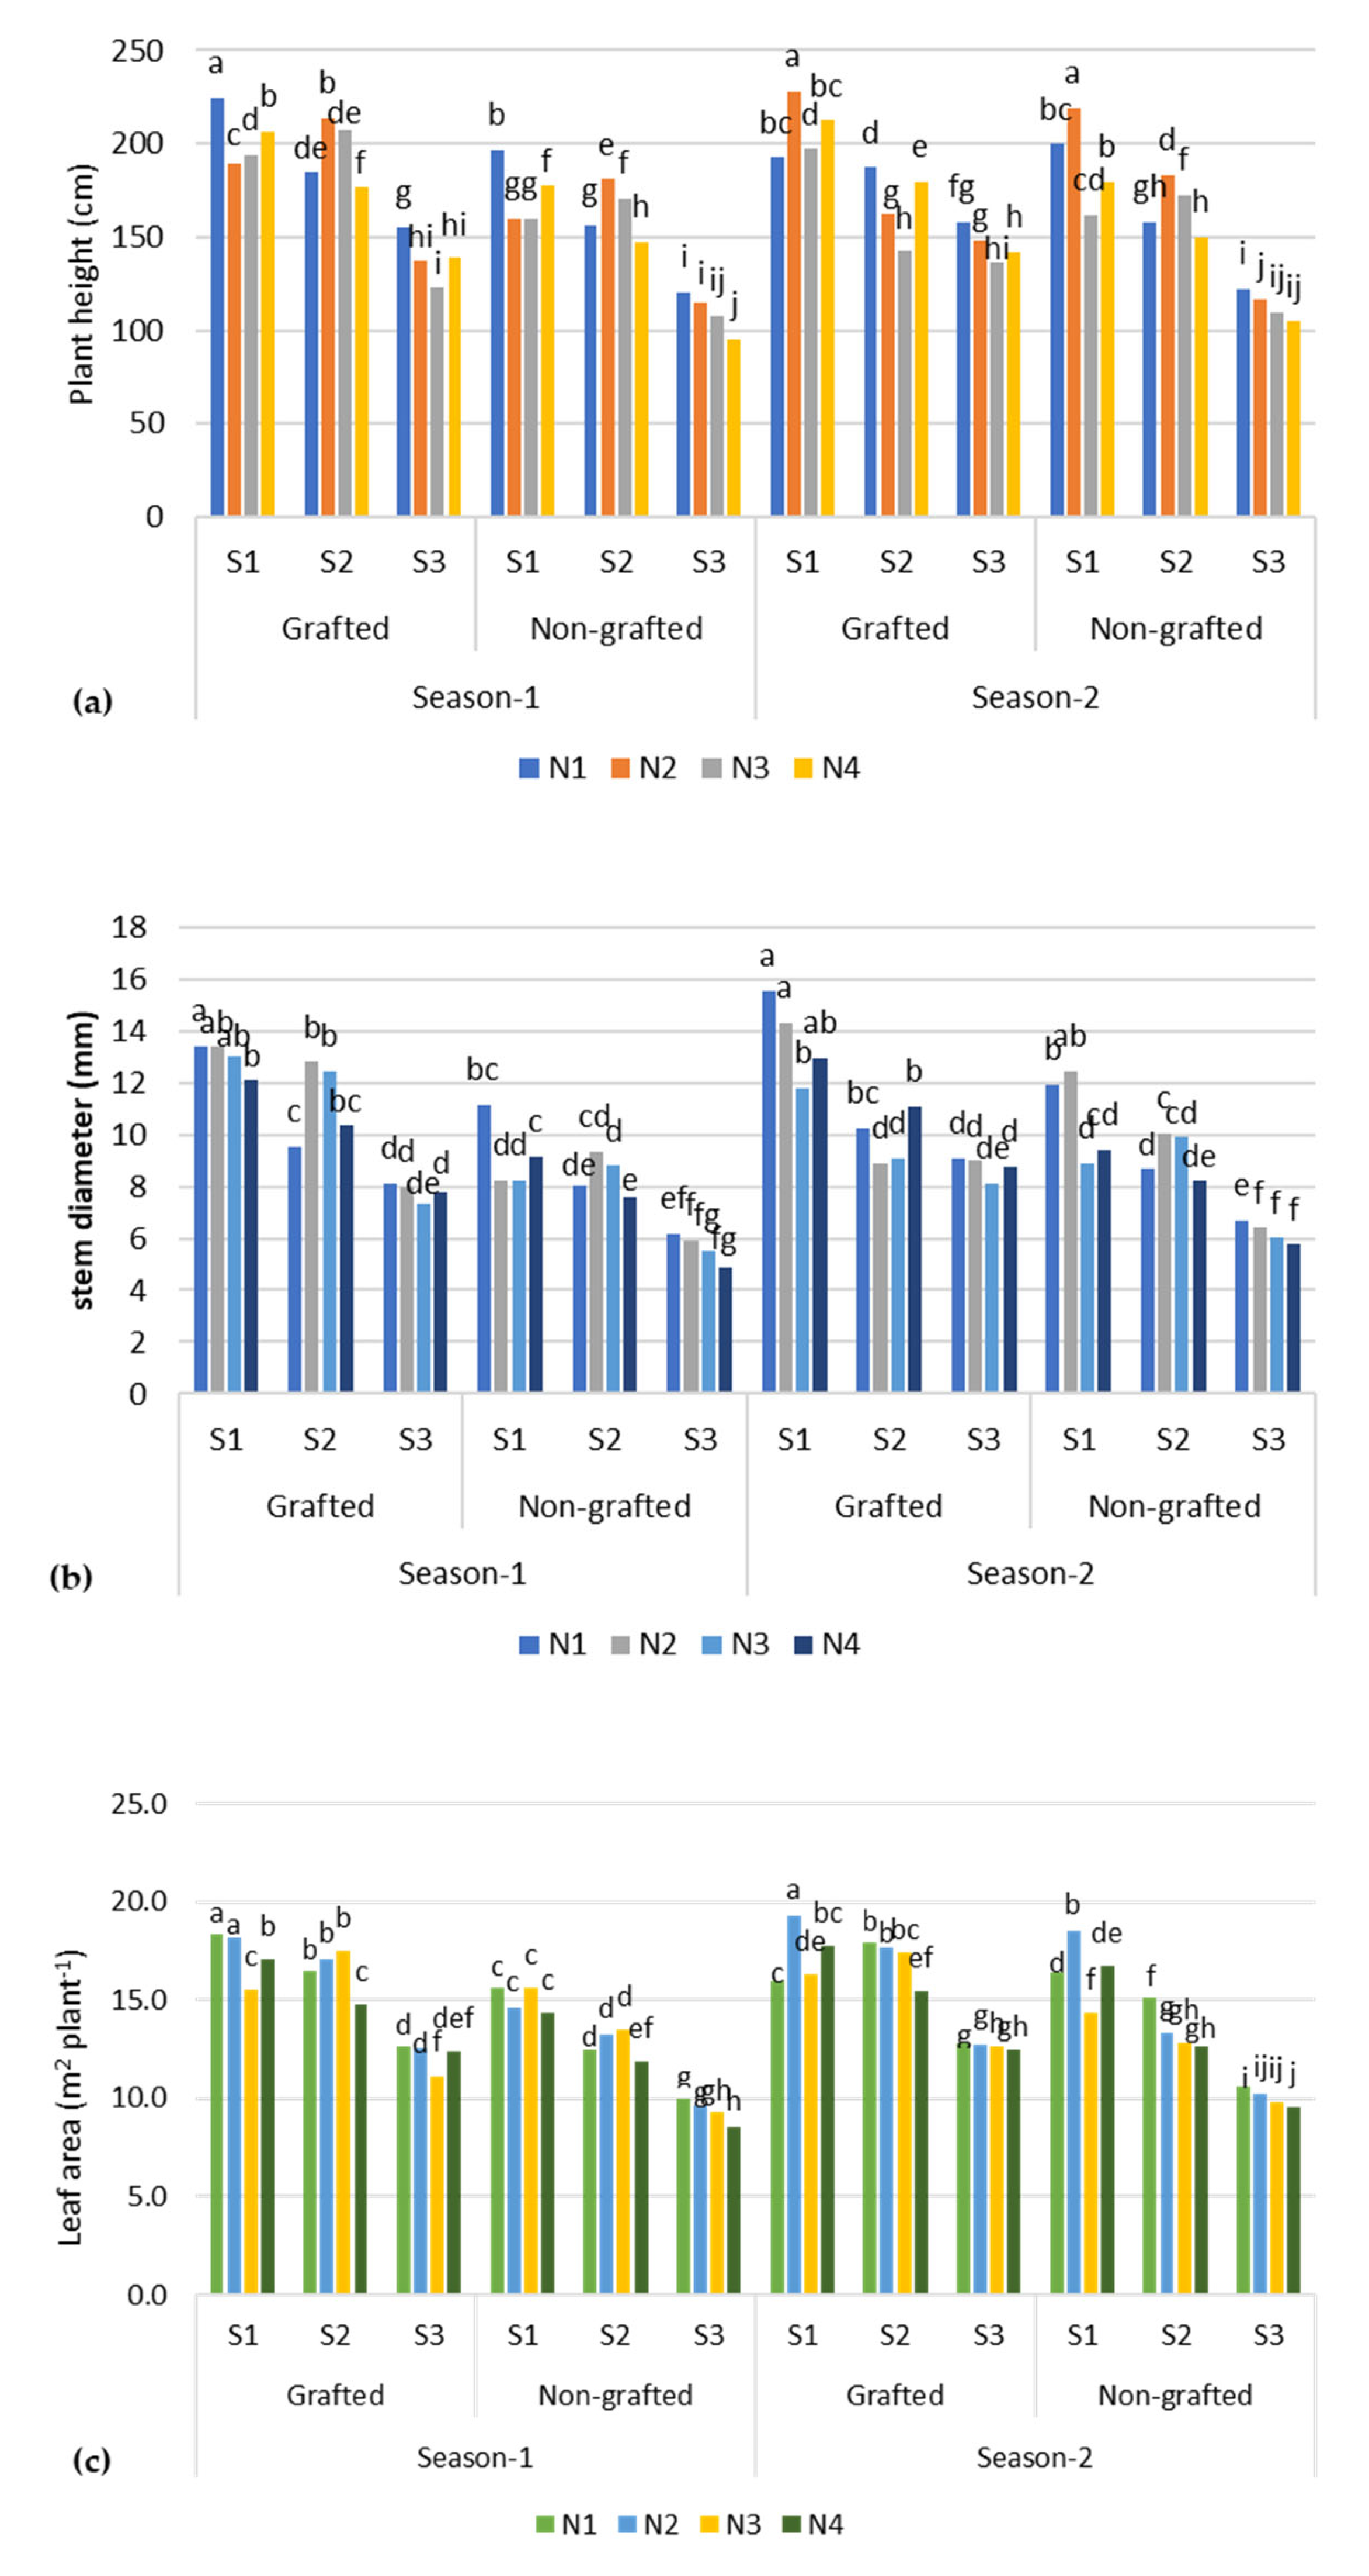
As shown in Table 3, the morphological features, such as plant height, stem diameter, and leaf area, of the tomato plants were highly affected when the plants were grown under high-salinity treatment (S3) compared with low-salinity treatment (S1, ~3.0 dS m−1). A significant impact of salinity on tomato plant height was observed across the implemented treatments (Figure 1). The mean plant height reached a maximum value of 193.6 cm under the low-salinity (S1, ~2.5 dS m−1) treatment, and a minimum height of 126.9 cm was observed for the high-salinity treatment (S3, ~9.0 dS m−1). A similar trend was noted with regard to stem diameter and leaf area. At a low-salinity level (S1), the leaf area was recorded as 16 m2 plant−1, which was 40.3% higher than the leaf area (11.4 m2 plant−1) recorded at S3 salinity level (EC~9.0 dS m−1). A lower (10.2 mm) value of stem diameter was observed when the plants were treated at S3 salinity level, which was 36.2% higher compared with the control (S1) treatment. Overall, the moderate salinity (S2) treatment was found to be on par with the S1 treatment with respect to morphological features. Moreover, the mean difference in the value of leaf area and stem diameter across the first and second seasons was 19% and 22%, respectively, under low-salinity water treatment.
Table 3.
Responses of tomato crops grown under different salinity and nutrient treatments.

Figure 1.
Morphological parameters of tomato plants under different salinity (S) stress and nutrient recipes (N): (a) tomato plant height, (b) stem diameter, and (c) leaf area.; The columns with different lowercase letters are significantly different (p < 0.05).
The responses of the plants in terms of morphological parameters to the tested nutrient recipes N1 and N2 produced more or less the same values. A maximum plant height of 171.3 cm was obtained for N2, which was 11% higher compared with the control (N1). This was followed by N3 (160.4–153.3 cm) and N4 (157–161.3 cm). The maximum stem diameter reached up to 12.7 mm in the control (N1), while reductions of 2.4%, 3.6%, and 7.2% in stem-diameter values were observed for the N2, N3, and N4 recipes, respectively. Unlike stem diameter, leaf area was found to be superior at 14.5 m2 plant−1 in plants treated with N1 and N2, and a slight reduction was observed for the N3 (14.2 m2 plant−1) and N4 (13.8 m2 plant−1) -treated plants. The results for season 1 showed that the vegetative growth parameters, including plant height, stem diameter, and leaf area, were moderately significantly higher (P = 0.03) under a combination of moderate salinity (S2) and N2 recipe compared with other treatments, but they were not superior to the control (i.e., combination of S1 and N1). However, in season 2, the mean vegetative growth parameters were somewhat superior to the control (N1) but comparable to the S1 treatments. The results also indicated that the performance of the grafted plants was better than the non-grafted plants.
3.2. Fruit Yield
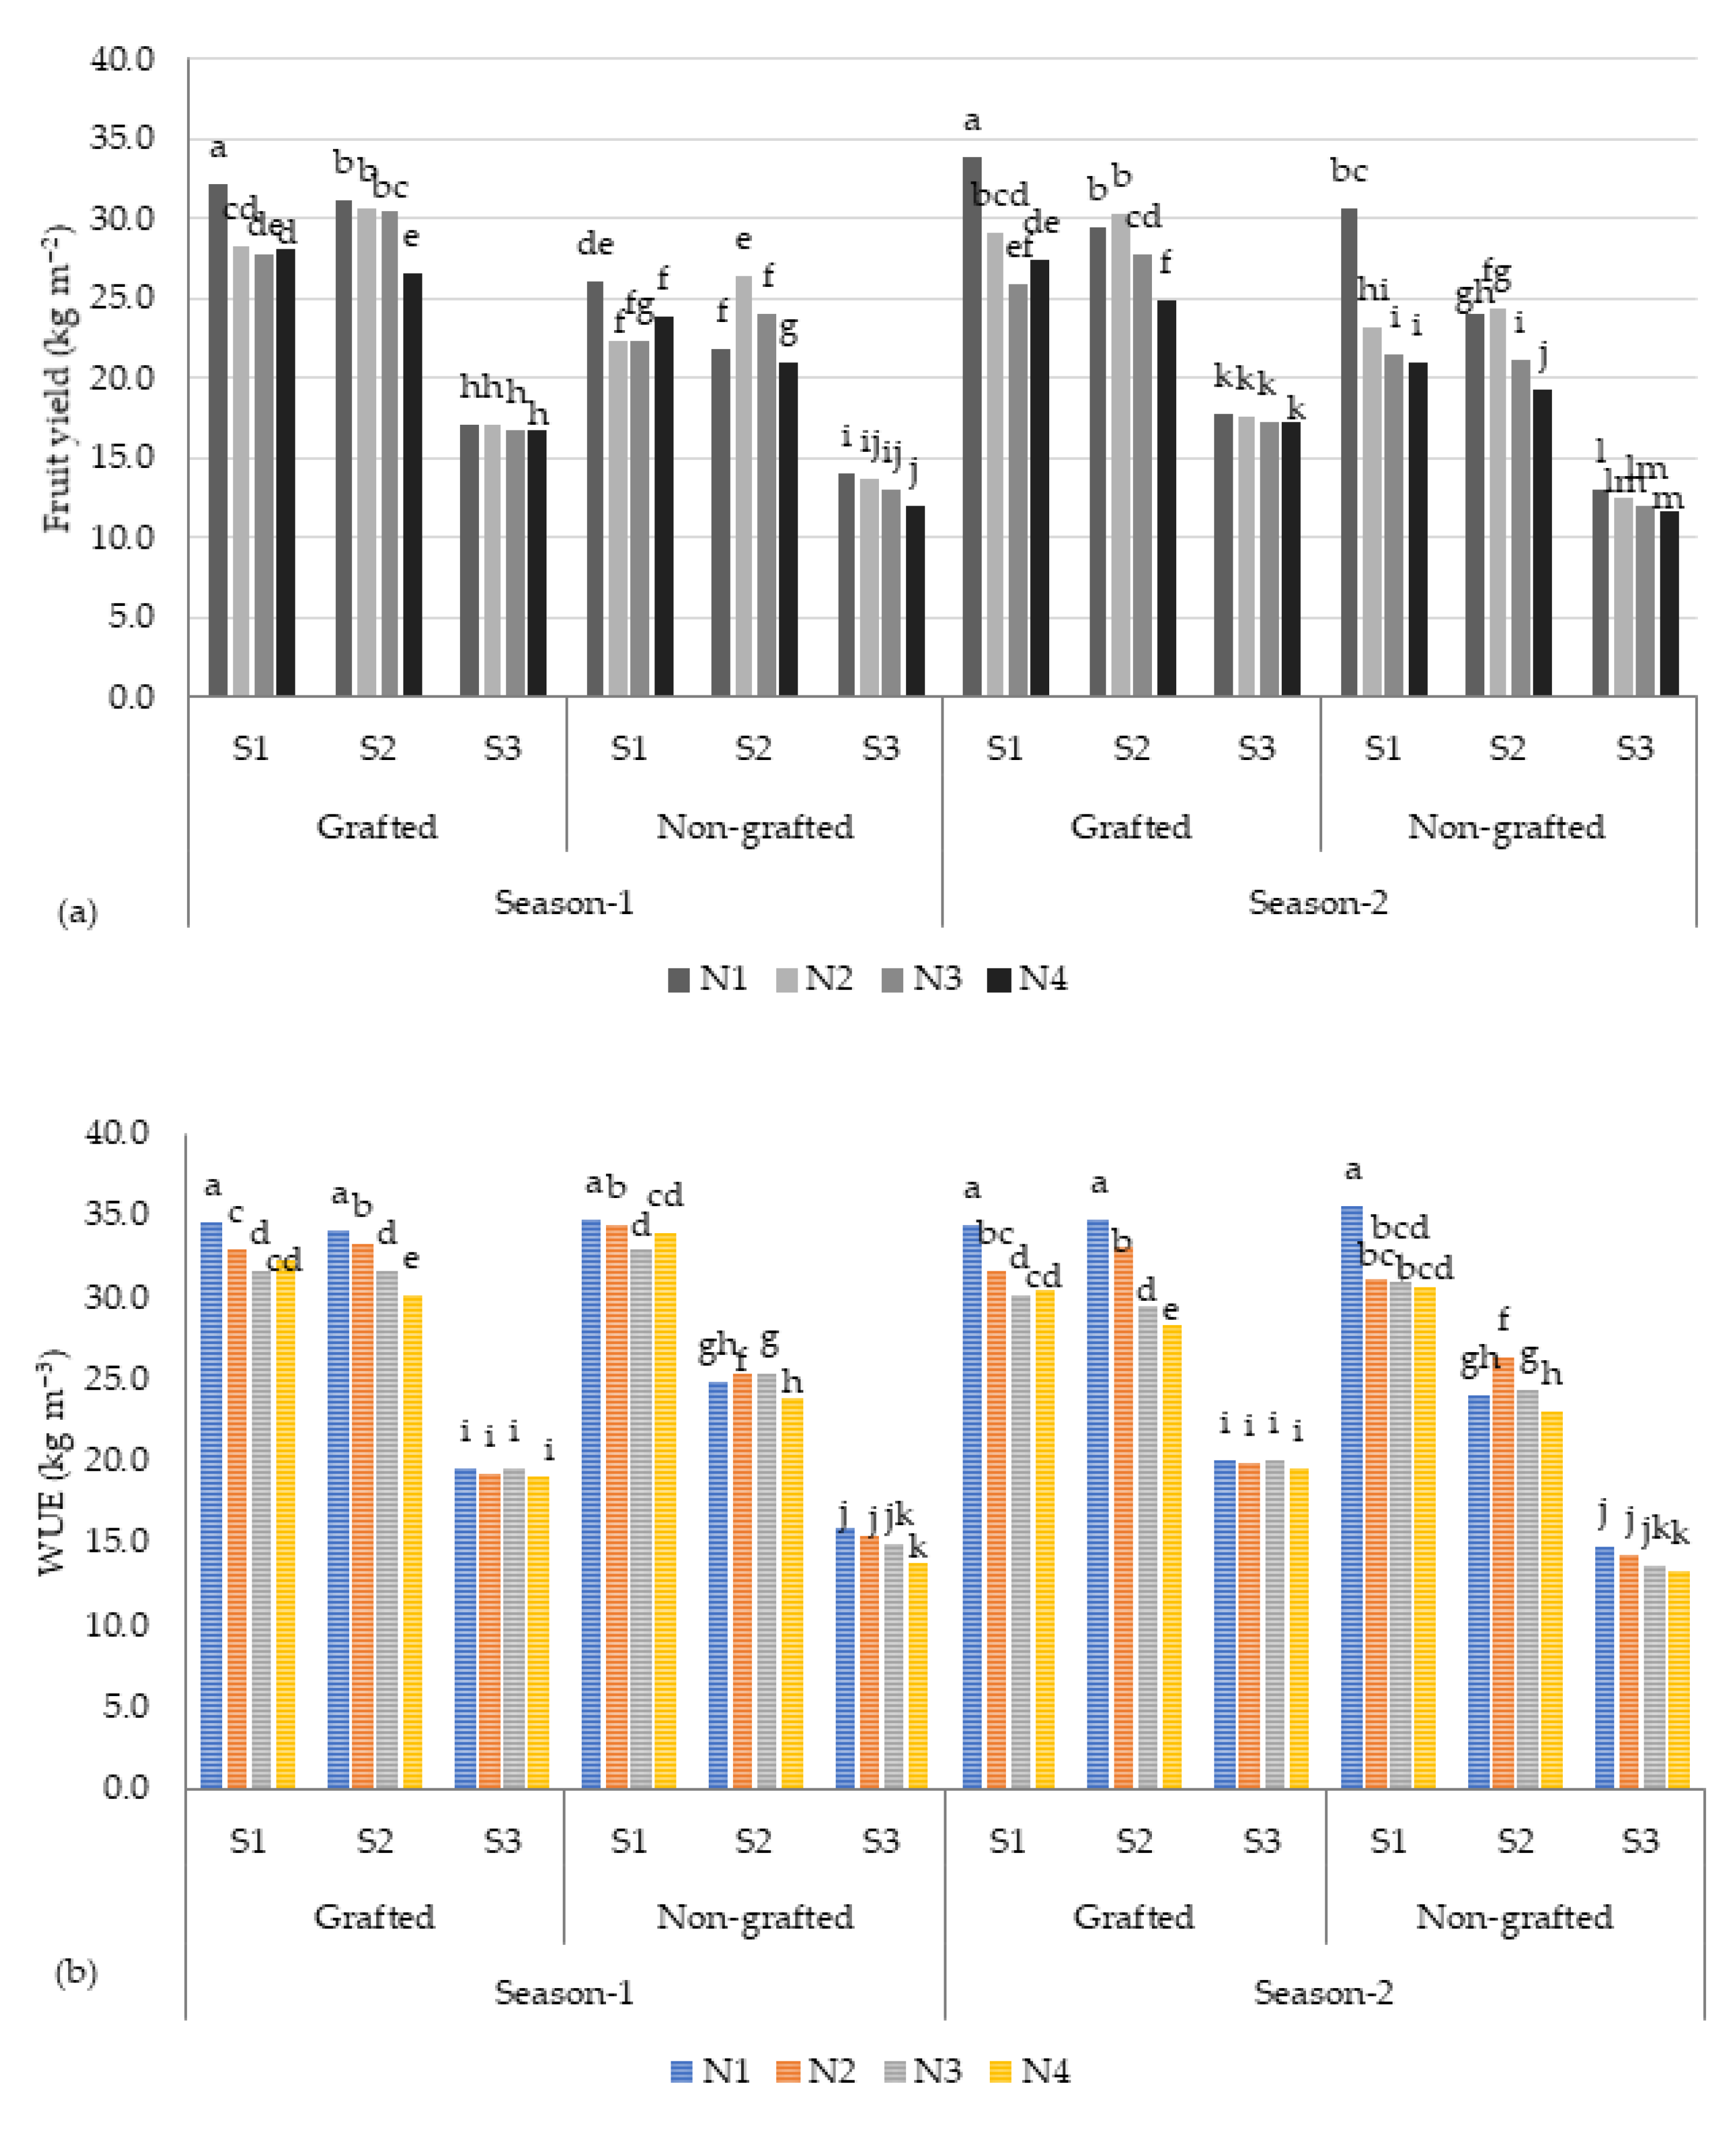
The results of this study showed that there were significant differences in the yields of tomato fruits among different salt concentration levels (S) and nutrient recipes (N). As depicted in Table 4, the highest fruit yield (27.6 kg m−2) was recorded for the low-salinity (S1, ~2.5 dS m−1) treatment, and the fruit yield reduced to 15.6 kg m−2 when the plants were treated with the high-salinity (S3, ~9.0 dS m−1) treatment (Table 3). As illustrated in Figure 2, the tomato fruit yield (26.8 kg m−2) of the plants treated with moderate salinity stress (~6.0 dS m−1) was comparable to the yield of the S1 treatment, accounting for a reduction of 2.8% in yield. The plants treated with the N1 recipe produced a higher yield (24.2 kg m−2), followed by the N2 (23.8 kg m−2), N3 (23.1 kg m−2), and N4 (22.3 kg m−2) recipes. The total fruit yields of the grafted (GR) and non-grafted (NG) plants were significantly different. The GR plants recorded a mean of 25.2 kg m−2 and 25.9 kg m−2 for season 1 and season 2, respectively. In contrast, the mean yield of the NG plants ranged between 21.7 kg m−2 (season 1) and 20.5 kg m−2 (season 2), with a difference of 19.7%. Under high-salinity conditions (~9.0 dS m−1), the GR plants produced 18.5 kg m−2 of tomatoes, accounting for a higher yield of 23% compared with the NG (12.8 kg m−2) plants (Figure 2). On the other hand, a yield difference of 37.5% between the GR and NG plants was observed under low-salinity water (S1) treatment.
Table 4.
Response in terms of tomato yield and water use efficiency (WUE) to different salinity and nutrient treatments.

Figure 2.
(a) Tomato fruit yield and (b) water use efficiency (WUE) under different salinity (S) stress conditions and nutrient recipes (N). The columns with different lowercase letters are significantly different (p < 0.05).
3.3. Water Use Efficiency
In contrast, as illustrated in Table 4 and Figure 2, the obtained WUE (computed by dividing the tomato fruit yield (kg m−2) with the amount of nutrient solution utilized for irrigation in m3 m−2) of the tomato crops varied significantly across the salinity treatments. The highest WUE (31.3 kg m−3) was recorded under the low-salinity conditions (S1), and the value was low under the high-salinity conditions (S3). These findings agree with Lovelli et al. [28], who found that the WUE of eggplant increased with increasing salinity stress. These results imply that tomato plants can perform better under low-salinity (S1) to moderate-salinity (S2) conditions, and that it is viable to utilize low to moderate saline water in a proportion of the nutrient solution as irrigation water in hydroponics to improve WUE [29]. This study also confirmed that moderate saline water is an alternative for tomato production under hydroponic conditions throughout a growing season to achieve an acceptable yield (31.3–30.4 kg m2).
3.4. Chlorophyll and Ion Concentrations in Plant Tissues
The leaf tissue analysis revealed that the chlorophyll content (SPAD) and tested ion concentrations (Na+, Ca2+, and K+) significantly varied across the different saline water treatments (Table 5). The chlorophyll content of the plants treated with the low-salinity (S1) water treatment was 56–58%, accounting for a higher level of ~36% in chlorophyll content compared with the plants treated with the S3 water treatment (37%). As illustrated in Table 5, the concentrations of Ca2+ and K+ followed similar trends. Higher ion concentrations were observed for the plants under the low-salinity (S1) treatment compared with the S3 plants. In the case of Na+, the leaf tissue analysis showed low amounts of Na+ (0.14%) in the plants under the high-salinity (S3) treatment compared with the S1 plants (0.21%). There was a slight difference in tested ion concentrations among the nutrient (N) treatments. The ion concentrations were higher under the N1 and N2 treatments compared with the N3 and N4 treatments. In the case of grafted and non-grafted plants, the GR plants had higher ion concentrations than the NG plants. When plants are exposed to higher salt concentrations, the plants become over-salted due to the osmotic effect in the roots, thus restricting their intake of water and causing a water deficit in the plants, which is detrimental to growth. As a result of the increased buildup of Cl− and N+, plants start to experience phytotoxicity and are re-blocked from absorbing certain nutrients (i.e., leading to nutritional imbalances) [8,9]. These elements have an adverse effect on the physiological and metabolic functions of plants, including cell division, respiration, and photosynthesis [10,11,12,13], all of which lead to a decrease in vegetative growth and crop yield.
Table 5.
Influence of salinity (S) and nutrient recipe (N) treatments on leaf chlorophyll and mineral composition: salinity stress, nutrient recipe, grafted condition, and tomato cultivars.
4. Discussion
All the tested morphological parameters with respect to salinity and grafting treatments were found to be highly significant in both season 1 and season 2. The plants under the low-salinity (S1) treatment and the grafted plants performed well, and the S2 treatment could be considered as its effects are on par with the S1 treatment. These findings are in agreement with the recent results reported by Zhang et al. [30], who found that fruit yield was not significantly affected under moderate-salinity conditions (~6.0 dS m−1), implying that the use of moderately saline (NaCl) water for irrigation may not decrease fruit yield at a significant level. The mean of total fruit yield for both grafted and non-grafted tomato cultivars, as shown in Figure 2, indicated that growing tomato plants under salinity levels of up to 6.0 dS m−1 (S2) resulted in no significant differences (LSD = 1.167 kg m−2), where the average total yield under S1 was 27.6 kg m−2 compared with 26.8 kg m−2 under S2. However, the average total fruit yield under S3 (15.6 kg m−2) was significantly lower compared with that under both S1 and S2. The WUE results followed the same trend of total fruit yield. The mean WUE showed significant differences under different salinity levels, with the WUE under S1 conditions (31.3 kg m−3) being the highest, followed by that under S2 conditions (30.4 kg m−3). However, the mean WUE under S3 conditions (17.7 kg m−3) was significantly lower compared with that under both S1 and S2 conditions. The results of grafted and non-grafted Ghandowra-F1 plants showed a significant decrease in total fruit yield with an increase in salinity concentration. With respect to nutrient (N) recipes, the impact on total fruit yield was not significant. However, N1 and N2 were found to have better effects compared with other recipes, with LSD of 1.167 and 1.190 kg m−2 for the first and second seasons, respectively. These results showed that all studied tomato cultivars could be grown successfully under hydroponic systems using irrigation water with salt concentration up to 6.0 dS m−1 in combination with the N1/N2 recipe without affecting total fruit yield.
The results shown in Table 6 and Table 7 indicate that grafted plants tolerated salinity stress better than non-grafted plants, as evidenced by the higher vegetative growth and yield under high-salinity conditions (i.e., ~9.0 dS m−1). The increase in WUE was clearly observed in the grafted cultivars, whose WUE under the low-salinity (S1) conditions was greater by 42–47.0% (for non-grafted plants) and 50–55.1% (for grafted plants) compared with those under the high-salinity conditions (S3). Similar results were reported by Patane et al. [42], who found that the difference in the WUE of tomato cultivars with respect to salinity treatments ranged between 2 and 15 dS m−1, which was less evident than in the present study. Another study [43] also confirmed that irrigation of tomato plants with moderate saline water could be more efficient.
Table 6.
Analysis of variation (ANOVA) (mean square) examining agro-morphological traits in tomato plants under different salt stress (S), nutrient (N) recipe, and grafting conditions (season 1).
Table 7.
Analysis of variation (ANOVA) (mean square) examining agro-morphological traits in tomato plants under different salt stress (S), nutrient (N) recipe, and grafting conditions (season 2).
Moreover, the nutrient recipe N2 was superior under salinity stress compared with the N3 and N4 recipes due to its higher performance in terms of vegetative growth and yield parameters. Also, higher WUE values were recorded in Maxifort-grafted tomato plants compared with non-grafted plants under the low-salinity level (S1). Moreover, non-grafted plants grown under the S1 treatment showed the lowest plant growth and yield values (Table 4). These results support the results of Schwarz et al. [44], who found that grafting tomato plants onto an appropriate rootstock reduces crop yield losses under salinity stress.
Grafting Valouro-RZ and Ghandowra-F1 cultivars onto Maxifort significantly improved their growth and yield parameters (Table 8). This is because plants grafted onto a suitable rootstock are able to absorb more water and nutrients from the root zone than non-grafted plants due to their robust root structure, which increases the contents of endogenous plant hormones and, thus, the rate of photosynthesis, which in turn enhances plant growth and fruit development [30,31]. Distinct variations in plant growth and fruit yield were observed among the studied tomato cultivars due to the applied salinity treatments. The results showed that Valouro-RZ recorded higher vegetative growth and fruit yield compared with Ghandowra-F1 and Feisty-Red cultivars (Table 3). Variations in plant growth and fruit yield parameters between the cultivars could be due to the genetic structure of individual cultivars, as Singh and Singh [45] presented similar results. Mahadeen et al. [18,26] also reported higher WUE values for certain tomato cultivars. In general, tomato farmers can achieve acceptable WUE with the use of moderately saline water; however, crop performance data may vary depending on the cultivar characteristics and salt stress conditions. In the case of the grafted tomato plants, vegetative growth, fruit yield, and WUE were found to be moderately significantly higher compared with the non-grafted plants.
Table 8.
Treatment interaction and response of tomato crops under different salinity and nutrient treatments.
The grafted plants performed well, and the obtained results are consistent with the study by Di Gioia et al. [46], who reported an increase in the leaf area of greenhouse heirloom tomato Cuore di Bue grafted onto Beaufort and Maxifort rootstocks. The results of the tomato plants grafted onto Maxifort rootstock showed 28.6% and 30.2% higher fruit yield than the non-grafted plants for the first and second seasons, respectively. In another study, Djidonou et al. [47] reported that grafting a tomato cultivar resulted in significantly higher yields and WUE of about 28% greater than non-grafted plants. The results of this study showed that the WUE of the tested tomato cultivars was in the range of 33–52 kg m−3 with respect to the salinity treatments, while an overall WUE value of 36–47 kg m−3 was obtained with respect to the nutrient treatments.
Low-salinity environments ease the uptake of irrigated nutrient solutions, which can enhance the vigor of vegetative parts and tomato fruit yields [16,17,18]. In general, salinity stress induces a reduction in the uptake of nutrients, resulting in a low fruit yield. In this study, it was also observed that there was a significant reduction (32.6–39.2%) in total fruit yield in the plants treated with high salinity (i.e., S3) compared with the plants treated with low salinity (S1). This could be due to the reduction in vegetative growth and flower development under high-salinity stress conditions [28,29]. In the present study, concentrations of Na+, Ca2+, and K+ decreased in leaf tissues with increasing salinity stress, and this led to lower availability of nutrient solution to the plants (Table 5). These results are in line with those reported by Nahar and Gretzmacher [48], who reported a trend of decreasing concentrations of several minerals, such as Na+, Ca2+, and K+, in tomato leaf tissues with increasing water stress, due to high salinity. In general, salinity stress leads to a decrease not only in nutrient uptake by the plant’s root system, but also in nutrient transfer from roots to shoots. This is the result of factors such as limited transpiration rate, decreased active transport, and decreased membrane permeability [24,25]. When plants are exposed to high salt concentrations, this causes a water deficit in the plants, which is detrimental to growth. As a result of the increased accumulation of Cl− and N+, plants start to experience phytotoxicity and are prevented from absorbing certain nutrients, which leads to nutritional imbalances [8,9]. These elements have an adverse effect on the physiological and metabolic functions of plants, including cell division, respiration, and photosynthesis [10,11,12,13], all of which lead to a decrease in vegetative growth and crop yield.
In previous studies, the decrease in tomato yield under high EC was attributed to smaller fruit weight and lower number [48,49]. Another problem often seen in tomatoes grown under high EC is the increased incidence of blossom-end rot (BER) caused by decreased calcium (Ca2+) uptake by roots and increased resistance to xylem transport inside the fruit. However, increasing levels Ca2+ in the nutrient solution reduced the incidence of BER [50]. Dorais et al. [49] reported that tomato yields under salinity conditions of 4.6, 8.0, and 12.0 dS m−1 were lower compared with those under 2.3 dS m−1. Fruit yields under salinity conditions of 4.6 and 8.0 dS m−1 were reduced because of fruit weight, whereas under 12.0 dS m−1, both fruit number and weight were reduced by 5.1% per dS m−1 above 2 dS m−1 [51].
The levels of chlorophyll, Ca2+, and K+ concentrations in the leaves of the Feisty-Red cultivar were significantly higher compared with the Valouro-RZ cultivar. However, the concentration of Na+ was higher in Feisty-Red leaves, although it was not significantly different when compared with other cultivars (Table 9). These results are in line with those reported by Nahar and Gretzmacher [48], who reported significant and insignificant differences between three tested tomato cultivars in terms of K+ and Na+ concentrations, respectively. The plants grafted onto Maxifort rootstock showed significantly higher levels of chlorophyll content in their leaves compared with the non-grafted plants. Furthermore, the grafted plants showed lower Ca2+ and K+ concentrations in their leaves than the non-grafted plants (Table 5). This might be due to the higher rate of absorption of water and minerals from the nutrient solution via the roots of the Maxifort rootstock, which could improve the uptake of Ca2+ and K+ [42]. On the other hand, the tomato plants grafted onto the rootstock showed higher Na+ uptake than the non-grafted plants. These findings suggest that rootstocks can modulate Na+ accumulation and partitioning within plant shoots [43]. In this study, the leaf tissues of Valouro-RZ plants under the low-salinity conditions (S1) showed the lowest concentrations of Ca2+ and K+. The plants treated with the N2 solution showed the highest Na+, Ca2+, and K+ concentrations. However, insignificant differences were observed in Na+ concentration between the tomato cultivars under low- and moderate-salinity conditions. Variations in these mineral concentrations indicated that the strength of uptake of Ca2+ and K+ under the S1N1 treatment and the strength of uptake of Na+ under the S2N2 treatment were comparable in Valouro-RZ tomato plants. These results are in agreement with Semiz and Suarz [52], who reported that salt resistance of tomato plants grafted onto Maxifort rootstock was due to improved osmoregulation, which was partially induced by the higher proline and relative water contents in tomato scions.
Table 9.
Leaf tissue analysis of interaction of salinity and nutrient recipe treatments with respect to chlorophyll and ion concentrations in tomato plants.
Principal Component Analysis
Principal component analysis (PCA) was performed to identify the main parameters of the studied agro-morphological traits that could be used to evaluate and select the most appropriate salinity level, nutrient, and grafting conditions (Figure 3). The first three principal components (F1, F2, and F3) explained 94.31% of the phenotypic variation and covered all measured traits (Table 10). The first two principal components (F1 and F2) had eigenvalues greater than 7.5 and explained 68.56% and 13.2% of the total variance, respectively. Salinity had a score of >0.73 and loaded positively onto PC1, while the other measured traits of plant height, stem diameter, leaf area, fruit yield, and WUE had high scores > 0.88 (Table 10). PC1 had a positive correlation with all measured traits except for nutrient and grafting treatments, which demonstrated a negative correlation with all other traits. The eigenvector’s distance and direction characterized the relationships between the traits and the imposed treatments. The scattering of the studied tomato traits in the same direction helped group them by similar physiological traits that were associated with salt tolerance. The PCA demonstrated that WUE had a stronger correlation with salinity treatment than with other parameters, followed by grafting status.
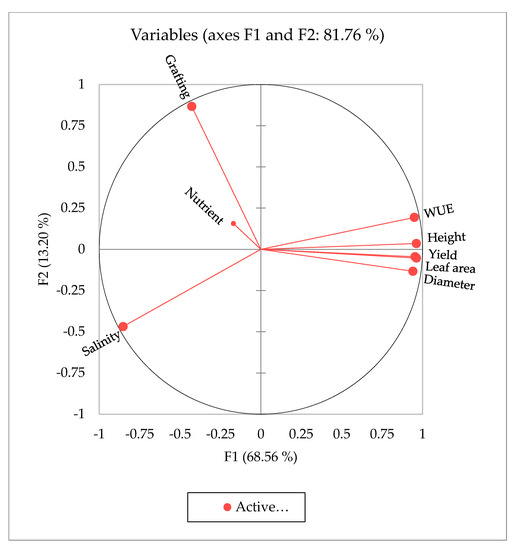
Figure 3.
Principal component analysis (PCA) results: factor (F) and water use efficiency (WUE).
Table 10.
Principal component analysis of tomato traits: eigenvalues, proportion, and cumulative variance for the four principal components underlying the effects of salinity stress.
5. Conclusions
An adverse effect of high salinity stress (~9 dS m−1) was evident in non-grafted plants, especially in the Valouro-RZ cultivar. A positive effect of grafting was observed when Maxifort was used as a rootstock. A modified nutrient solution [N2] was found to have a significant impact when used in combination with moderate salinity level (~6.0 dS m−1), as it exhibited a high mean yield (24 kg m−2), with a reduction of about ~20% in yield when compared with the control (i.e., combination of S1 and N1). High saline water significantly affected WUE, whose value was the highest at 34.7 kg m−3 for the control (S1 and N1), followed by the S2 (28.0 kg m−3) and S3 conditions (17.5 kg m−3). These results revealed that the studied tomato cultivars could be grown successfully under a hydroponic system using irrigation water with up to 6.0 dS m−1 salt concentration in combination with the N2 recipe without affecting total fruit yield. The results also indicated that grafting could mitigate some of the negative effects of salinity stress on tomato plants grown under hydroponic conditions.
Author Contributions
Conceptualization, V.C.P., R.M. and K.A.A.-G.; methodology, R.M., E.T. and N.S.; software, R.M.; validation, K.A.A.-G., V.C.P. and N.S.; formal analysis, R.M.; investigation, E.T.; resources, K.A.A.-G.; data curation, R.M.; writing—original draft preparation, R.M. and E.T.; writing—review and editing, E.T., K.A.A.-G., V.C.P. and N.S.; visualization, K.A.A.-G.; supervision, R.M.; project administration, E.T. and K.A.A.-G.; funding acquisition, R.M. All authors have read and agreed to the published version of the manuscript.
Funding
This research was funded by the National Plan for Science, Technology, and Innovation (MAARIFAH), King Abdelaziz City for Science and Technology, Kingdom of Saudi Arabia, grant number 11-AGR1939-02.
Institutional Review Board Statement
Not applicable.
Informed Consent Statement
Not applicable.
Data Availability Statement
Not applicable.
Acknowledgments
The authors are grateful to the National Plan for Science, Technology, and Innovation (MAARIFAH), King Abdulaziz City for Science and Technology, Kingdom of Saudi Arabia, for funding. The authors are also acknowledged the Research Chairs Program, Deanship of Scientific Research, King Saud University, Riyadh, for providing facilities for this study.
Conflicts of Interest
The authors declare no conflict of interest.
References
- Hasanean, H.; Almazroui, M. Rainfall: Features and Variations over Saudi Arabia, A Review. Climate 2015, 3, 578–626. [Google Scholar] [CrossRef]
- Baig, M.B.; AlZahrani, K.H.; Al-shaikh, A.A.; Wafa, A.A.; Risheh, A.; Straquadine, G.S.; Qureshi, A.M. Food Security in the Kingdom of Saudi Arabia Face to Emerging Dynamics: The Need to Rethink Extension Service. In Food Security and Climate-Smart Food Systems; Behnassi, M., Baig, M.B., Sraïri, M.T., Alsheikh, A.A., Abu Risheh, A.W.A., Eds.; Springer: Cham, Switzerland, 2022. [Google Scholar] [CrossRef]
- Morci, H.; Elmulthum, N.; Hadid, M. The Role of Greenhouses in Filling Trade Gap of Tomato Crop in Saudi Arabia. Egypt. J. Agron. 2020, 42, 197–207. [Google Scholar] [CrossRef]
- Ghanem, A.M.; Al-Ruwis, K.N.; Alqahtani, S.H.; Al-Nashwan, O.S.; Al-Duwais, A.A.M.; Alnafissa, M.A.; Alhashem, J.; Kamara, S.A.; Alaagib, S.B.; Aldawdahi, N.M.; et al. The economic dimension of directing treated wastewater to the production of green fodder in Saudi Arabia. Saudi J. Biol. Sci. 2021, 28, 4825–4832. [Google Scholar] [CrossRef] [PubMed]
- Saher, G.A.; Abdelmoneim, E.M.; Adam, B.A.; Adam, E.A.A. Strengthening the Crop Water Productivity of Tomato Under the Environmental Control of Greenhouse Technology. London J. Res. Sci. Nat. Form. 2021, 21, 37–48. [Google Scholar]
- FAO. The Dimensions of Water Productivity; Food and Agriculture Organization of the United Nations: Rome, Italy, 2022; 6p, Available online: https://www.fao.org/3/cc2724en/cc2724en.pdf (accessed on 30 January 2023).
- Abderrahman, W.A. Chapt. 6: Water demand management in Saudi Arabia. In Water Management in Islam; Faruqui, N.I., Biswas, A.K., Bino, M.J., Eds.; United Nations University Press: Tokyo, Japan, 2001; Available online: https://idrc-crdi.ca/en/book/water-management-islam (accessed on 16 February 2023).
- Alotaibi, B.A.; Kassem, H.S. Adoption of Sustainable Water Management Practices among Farmers in Saudi Arabia. Sustainability 2021, 13, 11260. [Google Scholar] [CrossRef]
- Haque, M.I.; Khan, M.R. Impact of climate change on food security in Saudi Arabia: A roadmap to agriculture-water sustainability. J. Agribus. Dev. Emerg. Econ. 2022, 12, 1–18. [Google Scholar] [CrossRef]
- Fiaz, A.; Noor, M.A.; Aldosri, F.O. Achieving food security in the Kingdom of Saudi Arabia through innovation: Potential role of agricultural extension. J. Saudi Soc. Agric. Sci. 2018, 17, 365–375. [Google Scholar] [CrossRef]
- JICA. Data Collection Survey on Water Saving, Leakage Measures and Water Quality Improvement in Saudi Arabia—Kingdom of Saudi Arabia—Final Report. Japan International Cooperation Agency. March 2022. Available online: https://openjicareport.jica.go.jp/pdf/12371308.pdf (accessed on 31 January 2023).
- Maucieri, C.; Nicoletto, C.; Os, E.V.; Anseeuw, D.; Havermaet, R.V.; Junge, R. Hydroponic Technologies. In Aquaponics Food Production Systems; Goddek, S., Joyce, A., Kotzen, B., Burnell, G.M., Eds.; Springer: Cham, Switzerland, 2019. [Google Scholar] [CrossRef]
- Marr, C.W. Greenhouse Vegetable Production: Hydroponic systems. Kensas State University, MF-1169, 1994. Available online: https://krex.k-state.edu/bitstream/handle/2097/32774/MF1169.pdf?sequence=1&isAllowed=y (accessed on 27 February 2023).
- Velazquez-Gonzalez, R.S.; Garcia-Garcia, A.L.; Ventura-Zapata, E.; Barceinas-Sanchez, J.D.O.; Sosa-Savedra, J.C. A Review on Hydroponics and the Technologies Associated for Medium- and Small-Scale Operations. Agriculture 2022, 12, 646. [Google Scholar] [CrossRef]
- Alomran, A.M.; Al-Harbi, A.A.R.; Wahb-Allah, M.A.; Alwabel, A.M.A.; Nadeem, M.E.A.; Al-Eter, A. Management of Irrigation Water Salinity in Greenhouse Tomato Production under Calcareous Sandy Soil and Drip Irrigation. J. Agric. Sci. Tech. 2012, 14, 939–950. [Google Scholar]
- Hussain, G.; Alquwaizany, A.; Al-Zarah, A. Guidelines for Irrigation Water Quality and Water Management in The Kingdom of Saudi Arabia: An Overview. J. Appl. Sci. 2010, 10, 79–96. [Google Scholar] [CrossRef]
- Furr, J.R.; Ream, C.L. Salinity effects on growth and salt uptake of seedlings of the date Phoenix dactylifera L. Proc. Am. Soc. Hort. Sci. 1968, 92, 268–273. [Google Scholar]
- Zhang, P.; Senge, M.; Dai, Y. Effects of salinity stress on growth, yield, fruit quality and water use efficiency of tomato under hydroponics system. Rev. Agric. Sci. 2016, 4, 46–55. [Google Scholar] [CrossRef]
- Bustomi, R.A.; Senge, M.S.T.R.; Suhandy, D.; Tusi, A. The Effect of EC Levels of Nutrient Solution on the Growth, Yield, and Quality of Tomatoes (Solanum lycopersicum) under the Hydroponic System. J. Agric Eng. Biotechnol. 2014, 2, 7–12. [Google Scholar]
- Taffouo, V.D.; Nouck, A.H.; Dibong, S.D.; Amougou, A. Effects of salinity stress on seedlings growth, mineral nutrients and total chlorophyll of some tomato (Lycopersicum esculentum L.) cultivars. Afr. J. Biotech. 2013, 9, 5366–5372. [Google Scholar]
- Karuppasamy, K.S.; Kumar, S.R.; Krishnakumar, S.; Varshini, V.; Susithra, N.; Kavitha, S.; Rajendran, V. Effect of Sodium Chloride on Soluble Protein, Nitrate Reductase Activity, Proline and Catalase Enzyme Activity of Green Gram Cultivars (Co6 And Co8). Legume Genom. Genet. 2014, 5, 1–5. [Google Scholar] [CrossRef]
- Fernandez, G.N.; Martinez, V.; Carvajal, M. Effect of salinity on growth, mineral composition, and water relations of grafted tomato plants. J. Plant Nutr. Soil Sci. 2004, 167, 616–622. [Google Scholar] [CrossRef]
- Rubio, J.S.; Garcia-Sanchez, F.; Rubio, F.; Martinez, V. Yield, blossom-end rot incidence, and fruit quality in pepper plants under moderate salinity are affected by K4 and Ca2+ fertilization. Sci. Hortic. 2009, 119, 79–87. [Google Scholar] [CrossRef]
- Zörb, C.; Geilfus, C.M.; Dietz, K.J. Salinity and crop yield. Plant Biol. J. 2019, 21, 31–38. [Google Scholar] [CrossRef]
- Kaya, C.; Higgs, D. Supplementary potassium nitrate improves salt tolerance in bell pepper plants. J. Plant Nutr. 2003, 26, 1367–1382. [Google Scholar] [CrossRef]
- Kütük, C.; Cayct, G.; Heng, L.K. Effects of increasing salinity and 15N-labelled urea levels on growth, N uptake, and water use efficiency of young tomato plants. Austr. J. Soil Res. 2004, 42, 345–351. [Google Scholar] [CrossRef]
- Guo, M.; Wang, X.; Guo, H.; Bai, S.; Khan, A.; Wang, X.; Gao, Y.; Li, J. Tomato salt tolerance mechanisms and their potential applications for fighting salinity: A review. Front. Plant Sci. 2022, 13, 949541. [Google Scholar] [CrossRef] [PubMed]
- Wang, X.; Geng, S.; Ri, Y.J.; Cao, D.; Liu, J.; Shi, D.; Yang, C. Physiological responses and adaptive strategies of tomato plants to salt and alkali stresses. Sci. Hortic. 2011, 130, 248–255. [Google Scholar] [CrossRef]
- Yang, H.; Du, T.; Mao, X.; Shukla, M.K. Modeling tomato evapotranspiration and yield responses to salinity using different macroscopic reduction functions. Vadose Zone J. 2020, 19, e20074. [Google Scholar] [CrossRef]
- Chaves, M.M.; Flexas, J.; Pinheiro, C. Photosynthesis under drought and salt stress: Regulation mechanisms from whole plant to cell. Ann. Bot. 2009, 103, 551–560. [Google Scholar] [CrossRef]
- Li, H.; Hou, X.; Bertin, N.; Ding, R.; Du, T. Quantitative responses of tomato yield, fruit quality and water use efficiency to soil salinity under different water regimes in Northwest China. Agric. Water Manag. 2023, 277, 108134. [Google Scholar] [CrossRef]
- Ayarna, A.; Tsukagoshi, S.; Nkansah, G.; Maeda, K. Effect of Plant Density on the Yield of Hydroponically Grown Heat-Tolerant Tomato under Summer Temperature Conditions. Am. J. Plant Sci. 2021, 12, 901–913. [Google Scholar] [CrossRef]
- Li, Y.L.; Stanghellini, C.; Challa, H. Response of Tomato Plants to a Step-Change in Root-Zone Salinity under Two Different Transpiration Regimes. Sci. Hortic. 2002, 93, 267–279. [Google Scholar] [CrossRef]
- Maboko, M.M.; Plooy, C.P.D. High-density planting of tomato cultivar’s with early decapitation of growing point increased yield in a closed hydroponic system. Acta Agric. Scand. Sect. B Soil Plant Sci. 2013, 63, 676–682. [Google Scholar] [CrossRef]
- Masterson, S.A.; Kennelly, M.M.; Janke, R.R.; Rivard, C.L. Scion shoot removal and rootstock cultivar affect vigor and early yield of grafted tomatoes grown in high tunnels in the Central United States. Hort. Technol. 2016, 26, 399–408. [Google Scholar] [CrossRef]
- Pardo-Alonso, J.L.; Carreño-Ortega, Á.; Martínez-Gaitán, C.-C.; Fatnassi, H. Behavior of Different Grafting Strategies Using Automated Technology for Splice Grafting Technique. Appl. Sci. 2020, 10, 2745. [Google Scholar] [CrossRef]
- Ohashi, Y.; Murai, M.; Ishigami, Y.; Goto, E. Light-Intercepting Characteristics and Growth of Tomatoes Cultivated in a Greenhouse Using a Movable Bench System. Horticulturae 2022, 8, 60. [Google Scholar] [CrossRef]
- Hochmuth, G.J.; Hochmuth, R.C. Nutrient Solution Formulation for Hydroponic (Perlite, Rockwool, NFT) Tomatoes in Florida. In EDIS Publication; Horticultural Sciences Department, University of Florida: Gainesville, FL, USA, 2008; Volume HS-796, 13p, Available online: http://edis.ifas.ufl.edu/CV216 (accessed on 18 January 2023).
- El-Iklil, Y.; Karrou, M.; Benichou, M. Salt stress effect on epinasty in relation to ethylene production and water relations in tomato. Agronomie 2000, 20, 399–406. [Google Scholar] [CrossRef]
- Chrétien, S.; Gosselin, A.; Dorais, M. High Electrical Conductivity and Radiation-based Water Management Improve Fruit Quality of Greenhouse Tomatoes Grown in Rockwool. Hort. Sci. 2000, 35, 627–631. [Google Scholar] [CrossRef]
- Cuartero, J.; Munoz, R.F. Tomato and salinity. Sci. Hortic. 1999, 78, 83–125. [Google Scholar] [CrossRef]
- Patane, C.; Tringali, S.; Sortino, O. Effects of deficit irrigation on biomass, yield, water productivity and fruit quality of processing tomato under semi-arid Mediterranean climate conditions. Sci. Hortic. 2011, 129, 590–596. [Google Scholar] [CrossRef]
- Zhang, P.; Senge, M.; Dai, Y. Effects of salinity stress at different growth stages on tomato growth, yield and water use efficiency. Commun. Soil Sci. Plant Anal. 2017, 48, 624–634. [Google Scholar] [CrossRef]
- Schwarz, D.; Öztekin, G.; Tüzel, Y.; Brücknera, B.; Krumbeina, A. Rootstocks can enhance tomato growth and quality characteristics at low potassium supply. Sci. Hortic. 2013, 149, 70–79. [Google Scholar] [CrossRef]
- Singh, J.; Sastry, E.V.; Singh, V. Effect of salinity on tomato (Lycopersicon esculentum Mill.) during seed germination stage. Physiol. Mol. Biol. Plants 2012, 18, 45–50. [Google Scholar] [CrossRef]
- Di Gioia, F.; Serio, F.; Buttaro, D.; Ayala, O.; Santamaria, P. Influence of rootstock on vegetative growth, fruit yield and quality in ‘Cuore di Bue’, an heirloom tomato. J. Horti. Sci. Biotech. 2010, 85, 477–482. [Google Scholar] [CrossRef]
- Djidonou, D.; Zhao, X.E.; Simonne, H.; Koch, K.E.; Erickson, J.E. Yield, water- and nitrogen-use efficiency in field-grown, grafted tomatoes. HortScience 2013, 48, 485–492. [Google Scholar] [CrossRef]
- Nahar, K.; Gretzmacher, R. Effect of water stress on nutrient uptake, yield and quality of tomato (Lycopersicon esculentum Mill.) under subtropical conditions. Die Bodenkultur. J. Land Manag. Food Environ. 2002, 53, 45–51. [Google Scholar]
- Dorais, M.; Papadopoulos, A.P.; Gosselin, A. Influence of electric conductivity management on greenhouse tomato yield and fruit quality. Agronomie 2001, 21, 367–383. [Google Scholar] [CrossRef]
- Roșca, M.; Mihalache, G.; Stoleru, V. Tomato responses to salinity stress: From morphological traits to genetic changes. Front. Plant Sci. 2023, 14, 1118383. [Google Scholar] [CrossRef]
- Ling, L.; Stanghellini, Y.S.C.; Challa, H. Effect of electrical conductivity and transpiration on production of greenhouse tomato (Lycopersicon esculentum L.). Sci. Hortic. 2001, 88, 11–29. [Google Scholar]
- Semiz, G.D.; Suarez, D.L. Tomato salt tolerance: Impact of grafting and water composition on yield and ion relations. Turk. J. Agric. Forest 2015, 39, 876–886. [Google Scholar] [CrossRef]

Disclaimer/Publisher’s Note: The statements, opinions and data contained in all publications are solely those of the individual author(s) and contributor(s) and not of MDPI and/or the editor(s). MDPI and/or the editor(s) disclaim responsibility for any injury to people or property resulting from any ideas, methods, instructions or products referred to in the content. |
© 2023 by the authors. Licensee MDPI, Basel, Switzerland. This article is an open access article distributed under the terms and conditions of the Creative Commons Attribution (CC BY) license (https://creativecommons.org/licenses/by/4.0/).